Financial Reporting Copy link Interim Results for the 28 weeks ended 12 September 2026 Consistently strong value, quality and service deliver volume and profit Simon Roberts, Chief Executive of J Sainsbury plc, said: “We know many households are…
Financial Reporting
Copy link
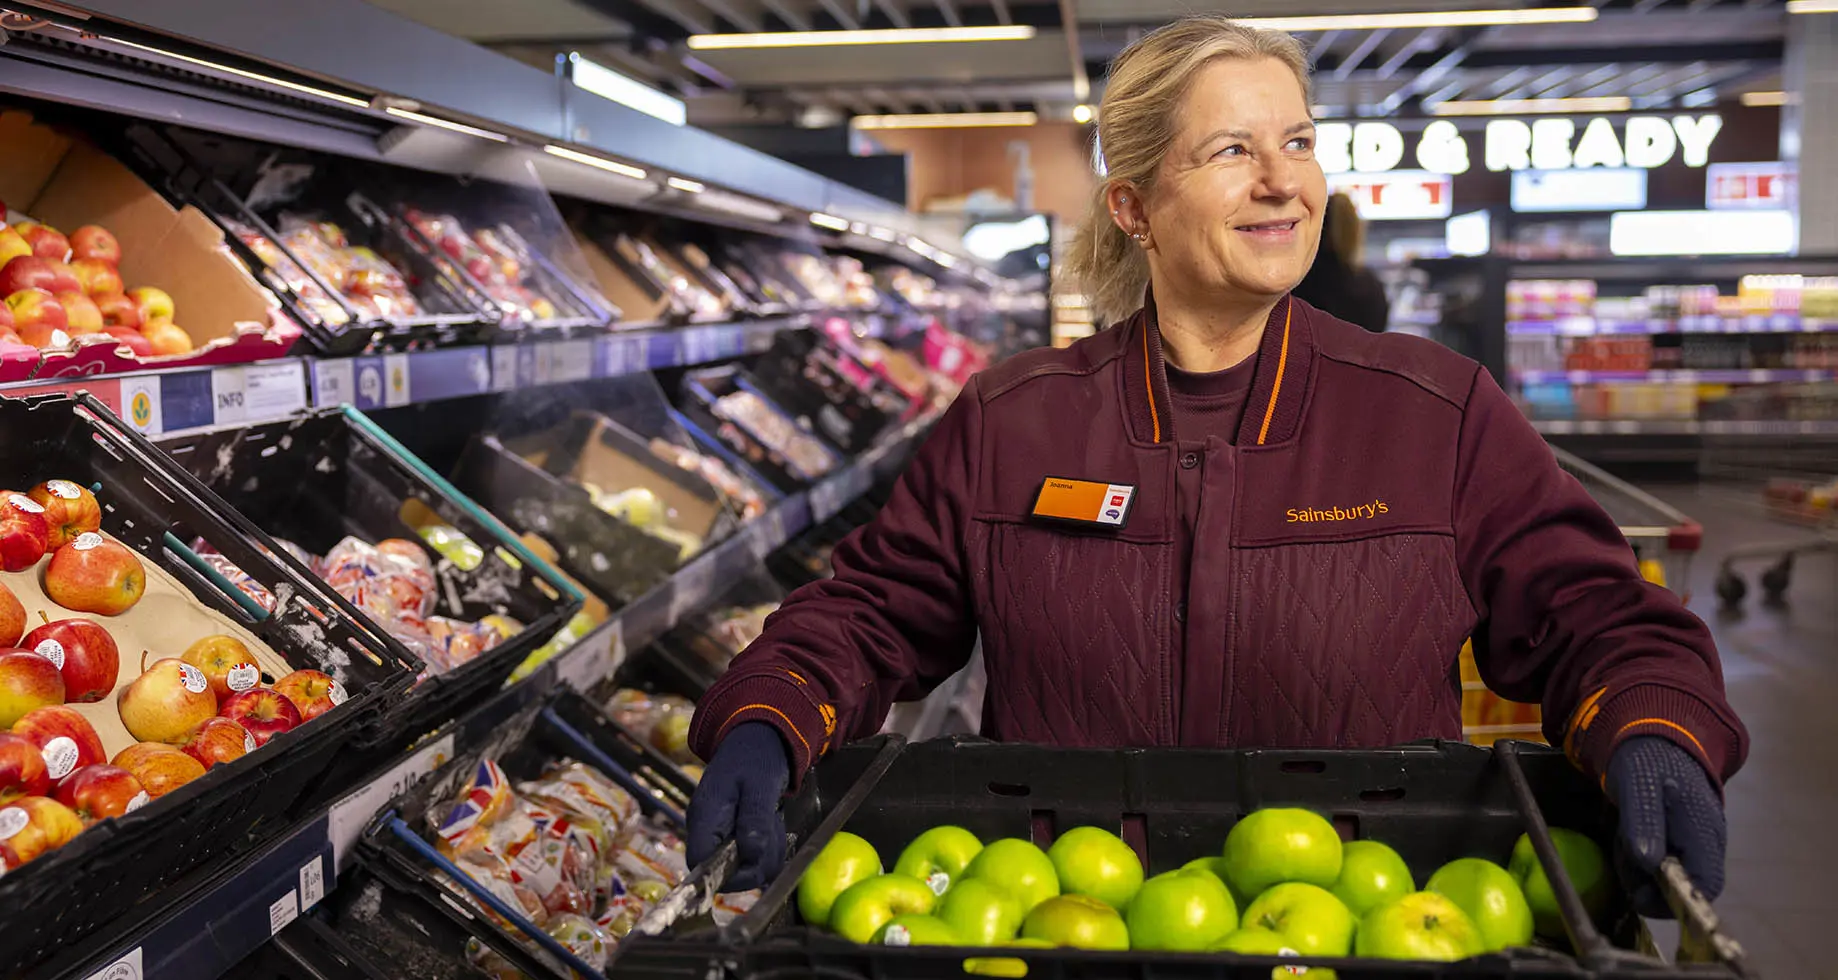
Interim Results for the 28 weeks ended 12 September 2026
Consistently strong value, quality and service deliver volume and profit
Simon Roberts, Chief Executive of J Sainsbury plc, said:
“We know many households are finding things tough at the moment and we’re making it easier for customers to enjoy good food every day, whatever their budget. That’s why more people are choosing us for their weekly shop, driving continued volume growth in the first half.
“We’re delivering trusted value for customers. Through Nectar Prices and the biggest Aldi Price Match in the market, Sainsbury’s is helping customers save on the products they buy most often and inflating behind the market.
“Innovation is powering our progress. We’re bringing more choice and exciting new food to customers and expanding ranges in more stores. Taste the Difference sales grew by more than six per cent and our restaurant-quality Taste the Difference Discovery range will soon have 200 products. We’re also making healthier choices easy, affordable and delicious through our expanded Full on Fibre range.
“Our long-term relationships with British farmers and suppliers help us deliver the food customers love at great value, while giving producers a predictable profit and the confidence to invest and plan for the future. My huge thanks go to our colleagues, farmers and suppliers whose passion, expertise and commitment make this possible every day.
“As we progress the sale of Argos and further sharpen our focus on food, we are building a simpler, more focused Sainsbury's. With great value, outstanding quality and exciting new food across our ranges, we’re looking forward to helping customers enjoy a really special Christmas.”
Financial Highlights
-
Agreed sale of Argos to Swift Partners; transaction expected to complete by the end of February 2027 and full separation expected by February 2029. Argos has been classified as a discontinued operation
-
Sales from continuing operations (excluding Fuel) £14.0bn, up 2.6%. Grocery sales £13.2bn, up 2.9%, reflecting continued volume growth and lower inflation. Sainsbury’s General Merchandise & Clothing sales £0.8bn, down 3.4%, reflecting General Merchandise space reduction and a subdued clothing market. Fuel sales £2.3bn, up 17.8%, reflecting higher wholesale prices
-
Continuing underlying operating profit £525m, up 3.6%, reflecting volume growth, continued cost savings delivery and consistent balanced investment in value, quality, availability and service
-
Statutory loss after tax £(164)m (H1 2025/26: profit £155m), primarily relating to discontinued operations
-
Free cash flow £333m. On track to deliver more than £500m for the full year
-
Completed £200m of previously announced £300m share buyback, with the remaining £100m to be completed in H2
-
Interim dividend of 4.1 pence per share. Consistent with prior years, this is 30 per cent of the prior year’s full year dividend per share
|
|
|
|
| H1 Financial Summary |
2026/27 |
2025/26 |
YoY |
| Business performance |
|
|
|
| Underlying sales (excl. fuel)1,2 |
£13,959m |
£13,611m |
2.6% |
| Underlying operating profit1 |
£525m |
£507m |
3.6% |
| Underlying profit before tax1 |
£366m |
£348m |
5.2% |
| Underlying basic earnings per share1,3 |
11.7p |
10.6p |
10.4% |
|
|
|
|
| Proposed interim dividend per share |
4.1p |
4.1p |
- |
| Free cash flow4 |
£333m |
£276m |
£57m |
| Net debt (inc. lease liabilities)5 |
£(5,634)m |
£(5,527)m |
£(107)m |
| Non-lease net debt5 |
£(75)m |
£(81)m |
£6m |
| Return on capital employed6 |
9.2% |
9.0% |
20bps |
| Statutory performance |
|
|
|
| Revenue (inc. fuel)1 |
£16,243m |
£15,596m |
4.1% |
| (Loss)/profit after tax1,3 |
£(164)m |
£155m |
n/a |
| o/w Continuing operations |
£212m |
£190m |
11.6% |
| o/w Discontinued operations |
£(376)m |
£(35)m |
n/a |
| Total basic (losses)/earnings per share3 |
(7.4)p |
6.8p |
n/a |
| Net cash generated from operating activities - continuing1 |
£890m |
£703m |
£187m |
2026/27 Outlook
The consistent strength of our customer offer helped deliver volume growth, share gains and profit growth in the first half. Looking to the second half, we expect the market to remain very competitive and we will make deliberate, balanced choices to sustain the strength of our offer, investing in value, quality, availability and service.
Reflecting this alongside our first half performance and the classification of Argos as a discontinued operation, we have adjusted our profit guidance. Our previous guidance of £975 million to £1,075 million would be equivalent to £965 million to £1,065 million on a continuing operations basis, removing Argos’s contribution.
We are now raising the lower end of this range and expect underlying operating profit from continuing operations of between £1,025 million and £1,065 million. We continue to expect to deliver free cash flow of more than £500 million.
Strategic Highlights
As part of the Next Level Sainsbury's plan that we set out in February 2024, we made eight commitments.
|
|
| * Food volume growth ahead of the market * Customer satisfaction higher 26/27 vs 23/24 * Colleague engagement higher 26/27 vs 23/24 * Deliver our Plan for Better commitments |
* Deliver profit leverage from sales growth * £1bn of cost savings over three years to 26/27 * £1.6bn+ Retail free cash flow over three years to 26/27 * Higher return on capital employed |
In the final year of this plan, we continue to make good progress against these commitments. We have consistently sustained a strong competitive position, investing in all aspects of the customer offer and we have made market share gains despite tough comparatives. Investment in our colleagues, technology, infrastructure and long-term supplier relationships has built a more resilient and sustainable business. This investment in the long-term strength of our business has been balanced with stronger financial delivery. We have consistently generated strong free cash flow and we have enhanced cash returns to shareholders while our cost savings programme has helped support profit growth and improved return on capital.
Our progress against the commitments has been driven by the four strategic outcomes we established as part of the Next Level Sainsbury's strategy: First choice for food, Loyalty everyone loves, More Argos, more often and Save and invest to win. In July we announced the planned sale of Argos to Swift Partners. The separation allows both businesses to pursue their own distinct strategies, creating a simpler, more focused Sainsbury's and enabling Argos to continue its transformation under new ownership.
First choice for food
Over the last six years, we have re-established the unique strength of the Sainsbury’s food offer, improving and consistently delivering a winning combination of value, quality and service. More and more customers are choosing Sainsbury’s as a result and we have grown our share of big basket primary customers7 and made significant market share gains8.
We made further progress in the first half, generating volume growth9 and further growing our share of main shop customers10. We will continue to focus on the delivery of sustainable sales and profit growth while building on Sainsbury’s strong food heritage and supplier relationships to deliver outstanding food innovation, choice and quality.
Volume growth and market outperformance
Delivering consistent value
-
Strengthened value position against key competitors12, inflating behind the market13
-
Unique value combination - biggest Aldi Price Match in the market14, Nectar Prices on almost 11,000 products, additional personalised value through Your Nectar Prices - continues to resonate with customers
-
Customer satisfaction scores in value for money and appealing promotions ahead of all other full choice grocers15
Driving food innovation, quality and healthy choices
-
Investing in fresh food, delivering sales growth of 4.3 per cent and completing biggest-ever changes to fresh food offer - range and space allocation changes across all supermarkets to provide greater choice, convenience and product discovery
-
Accelerating the pace of innovation, with more than 2,000 new and improved products expected this year, our biggest innovation programme ever
-
Taste the Difference sales up more than six per cent, continuing to grow faster than the market16. Discovery range of restaurant-quality meals has doubled this year, driving one quarter of Taste the Difference growth and extending into new categories including BBQ and Italian meals. Expected to exceed 200 products by year end
-
Supported healthier choices through innovation and product reformulation. More than 750 products now included in our Full on Fibre range
Strengthening our estate and operational resilience
-
Store investment programme delivering positive customer and financial outcomes, with customer satisfaction17 and sales growth in invested stores performing ahead of the rest of the estate
-
Invested in more than 170 stores during the half
-
Added an average of 1,500 new products per store in key space reallocation investments
-
Investment in refrigeration, stores and technology supported strong availability and operational resilience during periods of extreme heat; fresh food availability nearly two percentage points ahead of key competitors during most challenged heatwave weeks18
-
Opened two new supermarkets and 14 convenience stores in the first half and expect to open around ten new supermarkets and around 25 convenience stores in total during the year. Strong like-for-like growth in stores opened last year and encouraging early performance from new stores
Delivering for customers however they want to shop with us
-
Overall supermarket customer satisfaction continued to improve, maintaining lead against key competitors19
-
Focus on improving in-store shopping experience driving increase in supermarket customer satisfaction metrics for ease of finding products and ease of moving around the store20
-
Enhanced Sainsbury’s app now consolidates Groceries Online, SmartShop and OnDemand and includes new innovations including “Search your store” product finder and AI-driven “SmartLists”
-
Groceries Online21 sales up 9.0 per cent. OnDemand extended to nearly 95 per cent of stores. Sales up 27 per cent
-
Convenience22 sales up 0.8 per cent in a challenging market. Strong performance of new stores offsetting impact of disruption during extreme heat
-
Continued investment in colleagues, with pay increase for hourly-paid colleagues of five per cent. Launched KickStarter, our new Modern Work Experience Programme to make work experience fairer and more accessible to everyone, creating around 10,000 training opportunities for young people to help build skills. Welcomed the first cohort of FutureMaker, our new flagship graduate programme
-
Expansion of Sainsbury's Money with launches in partnership with NatWest of personal loans in September and savings in October, rewarding Nectar customers with additional value. Credit cards to follow later this year
Supporting farmers and growers to build a more resilient food system
-
Long-term partnerships with farmers and suppliers helping deliver quality food at great value, while ensuring fair returns, supporting profitability and investment for the future. Helping build a more resilient food system and maintain quality and availability for customers despite increasingly challenging growing conditions
-
By the end of 2026, 60 per cent of products in fresh produce, dairy, meat, fish and poultry will be in long-term agreements
-
New ten-year agreement with Thanet Earth supporting investment in glasshouse capacity and technology. Enabling Sainsbury’s customers to buy British-grown cucumbers through the winter for the first time and strengthening supply resilience
-
Growing partnership with the Woodland Trust for a further four years, supporting farmers and growers across our supply chain to adopt agroforestry practices that improve farm resilience, enhance biodiversity and support sustainable food production
Helping to make good food accessible for all
-
Continued to address food insecurity through strategic partnership with Comic Relief, supporting children and families facing hardship
-
Supported ambition to raise £30 million for Comic Relief by 2030, launching first Move for Meals fundraising campaign. Colleagues, customers and suppliers raised £1.1 million, matched by Sainsbury's to donate a total of £2.2 million to Comic Relief
-
Committed £8 million through partnership with Comic Relief to complement the Government's Holiday Activities and Food programme and create additional holiday club places for children
Resilient Tu Clothing performance and continued General Merchandise optimisation
-
Tu sales down two per cent, reflecting tough comparatives and a subdued clothing market23
-
Outperformed the clothing market23, reflecting strong progress on style perceptions24, improved availability and best ever back-to-school performance, with sales up eight per cent
-
Completed roll-out of clothing RFID25, improving stock accuracy, product availability and operational efficiency
-
Sainsbury’s General Merchandise sales down five per cent, primarily reflecting strategic decision to allocate more space to food and rationalise range, driving stronger stock efficiency, better availability, a simpler shopping experience and higher space productivity. Success of toys range reset completed last year, with fewer, better products, reflected in H1 sales up 13 per cent year on year.
Loyalty everyone loves
Nectar participation and digital engagement continue to grow, with more customers recognising the benefits of Nectar Prices, personalised value through Your Nectar Prices, targeted rewards and an expanding coalition of partners where they can earn and redeem rewards. The strength of this engaged, loyal customer base is fundamental to the success of Nectar360, where investment in market-leading Retail Media solutions is driving growth and supporting incremental profit generation.
Nectar Prices and personalised Your Nectar Prices continue to unlock value for customers
-
Digital Nectar users up nine per cent26
-
Customers saved more than £16 on £80+ big trolley shop as they continue to access the great value offered by Nectar
-
Your Nectar Prices continues to grow in popularity, with 350 million personalised offers per week and 17 per cent more customers accessing these on their favourite products each week27
-
Continued to engage with customers through digital campaigns such as Healthy Choice Challenge and Taste the Difference Challenge, supporting customers making healthier choices and driving trade up to our premium ranges
Creating more value for customers with Nectar partnerships
Leading the development of Retail Media in the UK
-
Strong adoption of Pollen, Nectar360’s market-leading platform for planning, activating and measuring Retail Media campaigns. More than 600 campaigns delivered for around 100 clients
-
Nectar360 is the first UK Retail Media business to be accredited and independently audited against IAB Europe Retail28 Media Measurement Standards, reinforcing leadership in transparency, accountability and measurement
-
Omnichannel campaigns continue to deliver strong results, including Diet Coke x The Devil Wears Prada campaign, which reached over eight million customers and generated a 3.7x incremental return on advertising spend29
Expanding media network and capabilities
-
Continued integration of Pollen and in-store media network, creating more connected omnichannel proposition across in-store, onsite and offsite channels. Expanded connected in-store media network to more than 3,500 digital screens – expecting to reach around 5,000 screens by year end
-
On track to deliver at least £100 million of incremental profit over the three years to March 2027
More Argos, more often
The sale of Argos to Swift Partners will support the next phase of Argos' development, providing greater flexibility to accelerate its transformation programme, pursue its strategic priorities and unlock future growth opportunities. Swift will build on the strength of the Argos brand, multichannel model and store network, bringing expertise and investment, unlocking the future potential of Argos for its customers and colleagues.
Securing a stronger future for Argos
-
Full year trading profit, reported as part of non-underlying discontinued operations, expected to be in line or ahead of last year
-
Sales, now reported within non-underlying discontinued operations, down 1.8 per cent (excluding Marketplace GMV30), partially reflecting highly competitive market and continued slower sales of bigger ticket items such as furniture, particularly during prolonged summer heatwave
-
Sales also impacted by in-year transition of legacy storecard customers to new digital financial services proposition, with strong new customer take-up of proposition outweighed by transitional sales impact
-
Successful launch of Marketplace offer. Number of sellers and product range will continue to expand, with 200,000 additional marketplace and supplier direct fulfilled products in Argos by financial year end
-
On track to deliver accelerated cost savings target, offsetting investment in people, technology, logistics and stores
Save and invest to win
In the final year of our Next Level plan, we remain on track to deliver our £1 billion cost saving target and a total of £2.3 billion over the past six years. By moving from stand-alone initiatives to end-to-end improvements in processes and ways of working we are making our business more efficient and resilient and creating a strong foundation for future savings opportunities.
Investing in connected stores and modernising logistics
-
SmartShop now available in all supermarkets, with 20 per cent more handsets year on year, supporting operational capacity and bigger basket trolley shops ahead of peak
-
Connecting real-time data, AI-driven decision making and store execution to improve customer satisfaction and availability while reducing loss and increasing productivity
-
Enhanced SmartShop rescanning, improving identification of mis-scanned baskets, more targeted interventions and better customer experience
-
Self-checkout video analytics now in nearly 600 stores - continued roll-out across supermarkets and introduction into convenience stores
-
Good progress rolling out facial recognition technology following a successful trial which saw logged incidents fall by 46 per cent and more than 90 per cent of identified offenders not return
-
Data-led stock replenishment capabilities helping stores identify and move available stock to the shop floor more efficiently, improving availability, reducing lost sales opportunities and simplifying replenishment
-
Optimised price reduction algorithm rolled out to all stores, reducing waste and improving colleague efficiency. Already delivered double digit million pound saving
-
More than 100 automated mobile robots now live at our Northampton warehouse, improving efficiency and increasing capacity in the ambient grocery picking operation
Sales performance1,2
|
|
|
|
|
|
|
|
| Like-for-like sales performance |
2025/26 |
|
|
|
2026/27 |
|
|
|
Q1 |
Q2 |
Q3 |
Q4 |
Q1 |
Q2 |
H1 |
| Like-for-like sales (exc. fuel) |
4.8% |
5.1% |
4.4% |
3.7% |
2.3% |
1.2% |
1.9% |
| Like-for-like sales (inc. fuel) |
2.0% |
3.3% |
3.7% |
1.9% |
4.2% |
3.4% |
3.9% |
|
|
|
|
|
|
|
|
| Total sales performance |
2025/26 |
|
|
|
2026/27 |
|
|
|
Q1 |
Q2 |
Q3 |
Q4 |
Q1 |
Q2 |
H1 |
| Sainsbury’s |
5.0% |
5.6% |
4.9% |
4.5% |
3.0% |
1.9% |
2.6% |
| Grocery |
5.1% |
5.9% |
5.4% |
4.7% |
3.5% |
2.2% |
2.9% |
| GM (Sainsbury’s) & Clothing |
4.4% |
2.0% |
(1.1)% |
1.5% |
(3.7)% |
(2.9)% |
(3.4)% |
| Total Continuing (exc. fuel) |
5.0% |
5.6% |
4.9% |
4.5% |
3.0% |
1.9% |
2.6% |
| Fuel31 |
(13.6)% |
(7.8)% |
(1.2)% |
(10.1)% |
17.5% |
18.2% |
17.8% |
| Total Continuing (inc. fuel) |
2.3% |
3.7% |
4.2% |
2.5% |
4.8% |
3.9% |
4.5% |
| Argos - discontinued |
4.2% |
0.3% |
(0.9)% |
0.7% |
(1.1)% |
(2.7)% |
(1.8)% |
|
|
|
|
|
|
|
|
| Total sales performance (£M) |
2025/26 |
|
|
|
2026/27 |
|
|
|
Q1 |
Q2 |
Q3 |
Q4 |
Q1 |
Q2 |
H1 |
| Sainsbury’s |
7,804 |
5,807 |
8,437 |
3,856 |
8,041 |
5,918 |
13,959 |
| Grocery |
7,349 |
5,458 |
7,830 |
3,647 |
7,603 |
5,579 |
13,182 |
| GM (Sainsbury’s) & Clothing |
455 |
349 |
607 |
209 |
438 |
339 |
777 |
| Total Continuing (exc. fuel) |
7,804 |
5,807 |
8,437 |
3,856 |
8,041 |
5,918 |
13,959 |
| Fuel31 |
1,115 |
824 |
1,103 |
517 |
1,310 |
974 |
2,284 |
| Total Retail (inc. fuel) |
8,919 |
6,631 |
9,540 |
4,373 |
9,351 |
6,892 |
16,243 |
| Argos - discontinued1 |
1,122 |
863 |
1,597 |
552 |
1,110 |
840 |
1,950 |
Notes
Certain statements made in this announcement are forward-looking statements. Such statements are based on current expectations and are subject to a number of risks and uncertainties that could cause actual events or results to differ materially from any expected future events or results referred to in these forward-looking statements. They appear in a number of places throughout this announcement and include statements regarding our intentions, beliefs or current expectations and those of our officers, directors and employees concerning, amongst other things, our results of operations, financial condition, liquidity, prospects, growth, strategies and the business we operate. Unless otherwise required by applicable law, regulation or accounting standard, we do not undertake any obligation to update or revise any forward-looking statements, whether as a result of new information, future developments or otherwise.
A webcast presentation and live Q&A will be held at 09:00 (BST). This will be available to view on our website at the following link: https://sainsburys-interim-results-announcement-october-2026.open-exchange.net
A recorded copy of the webcast and Q&A call, alongside slides and a transcript of the presentation will be available at www.about.sainsburys.co.uk/investors/results-reports-and-presentations
following the event.
Sainsbury’s will issue its 2026/27 Third Quarter Trading Statement at 07:00 (GMT) on 8 January 2027.
Enquiries
|
|
| Investor Relations |
Media |
| James Collins |
Rebecca Reilly |
| +44 (0) 7801 813 074 |
+44 (0) 20 7695 7295 |
1 Comparatives have been restated to present Argos operations as a discontinued operation. Refer to notes 2 and 7 of the financial statements for further detail
2 Total sales in prior periods as previously presented plus commission on Financial Services
3 The comparative period has been restated to reflect the deferred tax impact of an increased proportion of assets qualifying for tax allowances
4 Prior period comparatives exclude Financial Services as it is recorded on a Retail basis. Comparatives have also been restated to present Argos operations as a discontinued operation. Refer to note 2 of the financial statements for definition change and note A2.1 for reconciliation to the nearest IFRS measure
5 Net debt H1 2025/26 as previously reported. From the beginning of 2026/27 net debt has been restated to include Financial Services, following substantive completion of the exit from core banking operations and change in the business model. Refer to notes 2.2, 2.7 and 4 of the financial statements for further details
6 Return on capital employed: H1 2026/27 return is now stated exclusive of Argos discontinued operations whilst capital employed is presented after total net debt. No adjustment has been made to H1 2025/26, which remains as previously presented.
7 Worldpanel by Numerator Panel, Total Fresh & Grocery excl. Kiosk & Tobacco, Primary Shopper (defined as a shopper who bought 40% or more of their groceries in a retailer over the stated time period) shopper growth H1 2021/22 vs. H1 2026/27, 28 weeks to 6 September 2026
8 Worldpanel by Numerator Panel, Total Fresh & Grocery excl. Kiosk & Tobacco, Sainsbury’s volume market share H1 2021/22 vs. H1 2026/27, 28 weeks to 13 September 2026
9 NielsenIQ EPOS, Total FMCG excl. Kiosk & Tobacco & GM, units YoY growth, 28 weeks to 12 September 2026
10 Worldpanel by Numerator Panel, Total Fresh & Grocery exc. Kiosk & Tobacco, Main shop mission shoppers YoY change, 28 weeks to 6 September 2026
11 NielsenIQ EPOS, Total FMCG excl. Kiosk & Tobacco & GM, market share, 28 weeks to 12 September 2026
12 Value Reality, September 2026 vs February 2026; Acuity, internal modelling
13 NielsenIQ EPOS, Total FMCG excl. Kiosk & Tobacco & GM, ASP YoY% growth, 28 weeks to 12 September 2026
14 Based on average number of products included in Aldi Price Match over the first half
15 CSAT Supermarket Competitor Benchmark data – Value for money and Appealing promotions Q2 2026/27 vs full choice grocers
16 Worldpanel by Numerator Panel, Total Fresh & Grocery exc. Kiosk & Tobacco, Premium OL, Sainsbury's value growth differential versus Market excluding M&S, 28 weeks to 13 September 2026
17 Lettuce Know. Customer satisfaction scores. Overall satisfaction - invested vs non-invested estate P1-P7 2026/2027 YoY
18 NielsenIQ OSA EU GB Barometer– week 22: 24 to 30 May 2026 & week 26: 21 to 27 June 2026
19 CSAT Supermarket Competitor Benchmark data – Overall supermarket satisfaction Q2 2026/27 vs Q2 2025/26 vs full choice grocers
20 CSAT Supermarket Competitor Benchmark data – Ease of finding items and Ease of walking through store, Q2 2026/27 vs Q2 2025/26
21 Groceries Online includes sales through Sainsburys.co.uk
and sales through OnDemand channels serviced by supermarket and convenience locations
22 In-store only sales
23 Worldpanel by Numerator Panel, Total Clothing, Footwear and Accessories, Total market YoY volume growth and Tu YoY volume growth differential vs the market, 24 weeks to 16 August 2026
24 YouGov Brand Tracking, Style, H1 2026/27 vs H1 2025/26
25 Radio-frequency identification
26 8-week digital active Nectar users – week 28 2026/27 vs 2025/26
27 Your Nectar Prices customers P7 2026/27 vs 2025/26
28 IAB Europe is the European-level association for the digital marketing and advertising ecosystem. The Retail Media Certification Programme is designed to bring greater clarity and consistency to how Retail Media is measured and reported
29 From measured channels activated through Nectar360 Pollen
30 Gross merchandise value: Marketplace GMV is the total transaction value from the sale of products supplied by third-party e-commerce marketplace vendors. Reported sales include only the commission earned by Argos on those transactions
31 Fuel sales represent sales of fuel from our Petrol Filling Stations (PFS) and sales from our Ultra Rapid Electric Vehicle charging business, Smart Charge
Shop with our brands
Quick links
Contacts
Useful information
Follow us:
© 2026 J Sainsbury plc