Half Year 2026 Results Announcement 16TH JULY 2026 1 Forward-looking statements Disclaimer This presentation contains oral and written statements that are or may be “forward-looking statements” with respect to certain of Ocado’s plans and its current…
Half Year 2026
Results Announcement
16TH JULY 2026
1
Forward-looking statements
Disclaimer
This presentation contains oral and written statements that are or may be “forward-looking statements” with
respect to certain of Ocado’s plans and its current goals and expectations relating to its future financial
condition, performance and results. These forward-looking statements are usually identified by words such as
‘anticipate’, ‘target’, ‘expect’, ‘estimate’, ‘intend’, ‘plan’, ‘goal’, ‘believe’ or other words of similar meaning. By
their nature, all forward-looking statements involve risk and uncertainty because they are based on current
expectations and assumptions but relate to future events and circumstances which may be beyond Ocado’s
control. There are important factors that could cause Ocado’s actual financial condition, performance and
results to differ materially from those expressed or implied by these forward-looking statements, including,
among other things, UK domestic and global political, social, economic and business conditions, marketrelated risks such as fluctuations in interest rates and exchange rates, the policies and actions of regulatory
authorities, the impact of competition, the possible effects of inflation or deflation, variations in commodity
prices and other costs, the ability of Ocado to manage supply chain sources and its offering to customers, the
effect of any acquisitions by Ocado, combinations within relevant industries and the impact of changes to tax
and other legislation in the jurisdictions in which Ocado and its affiliates operate.
Further details of certain risks and uncertainties are included in the Full Year Results Statement which can be
found at www.ocadogroup.com and is set out in our FY25 Annual Report published on 4 March 2026. Ocado
expressly disclaims any undertaking or obligation to update the forward-looking statements made in this
presentation or any other forward-looking statements we may make except as required by law. Persons
receiving this presentation should not place undue reliance on forward-looking statements which are current
only as of the date on which such statements are made.
2
Introduction
Adam Warby
Chair,
Ocado Group
3
Strategic
Review
Tim Steiner
Chief Executive Officer,
Ocado Group
4
First Half Highlights:
Accelerating volume
growth across the
platform, with 27% YoY
volume growth across
international CFCs*
- Volume growth excludes the closed Kroger and Sobeys sites
Renewed commercial
momentum, with new
partners committing to a
wide range of solutions
across OSP
Good progress towards
turning Cash Flow
Positive in 2H, with
organisational changes
bedding in
A healthy pipeline of
new prospects, with
multiple grocers
engaged, following on
from exclusivity roll offs
5
Recent OSP live partners driving strong growth
Growth
65%
(Madrid)
Perfect
Order Rate
97%
21%
94%
Note: Growth figures have been calculated as follows, Alcampo public comments from CEO Jun-26; YoY growth for 1H26 vs 1H25
for Auchan and Aeon; Coles quotes are from Leah Weckert, Coles 1H26 Results, 27 February 2026 published data
Perfect Order Rate shown represents the peak or average value observed during the reporting period
70%
“Our CFC volumes increased in
the half with sales growth again
outpacing total supermarkets
e-commerce sales growth”
97%
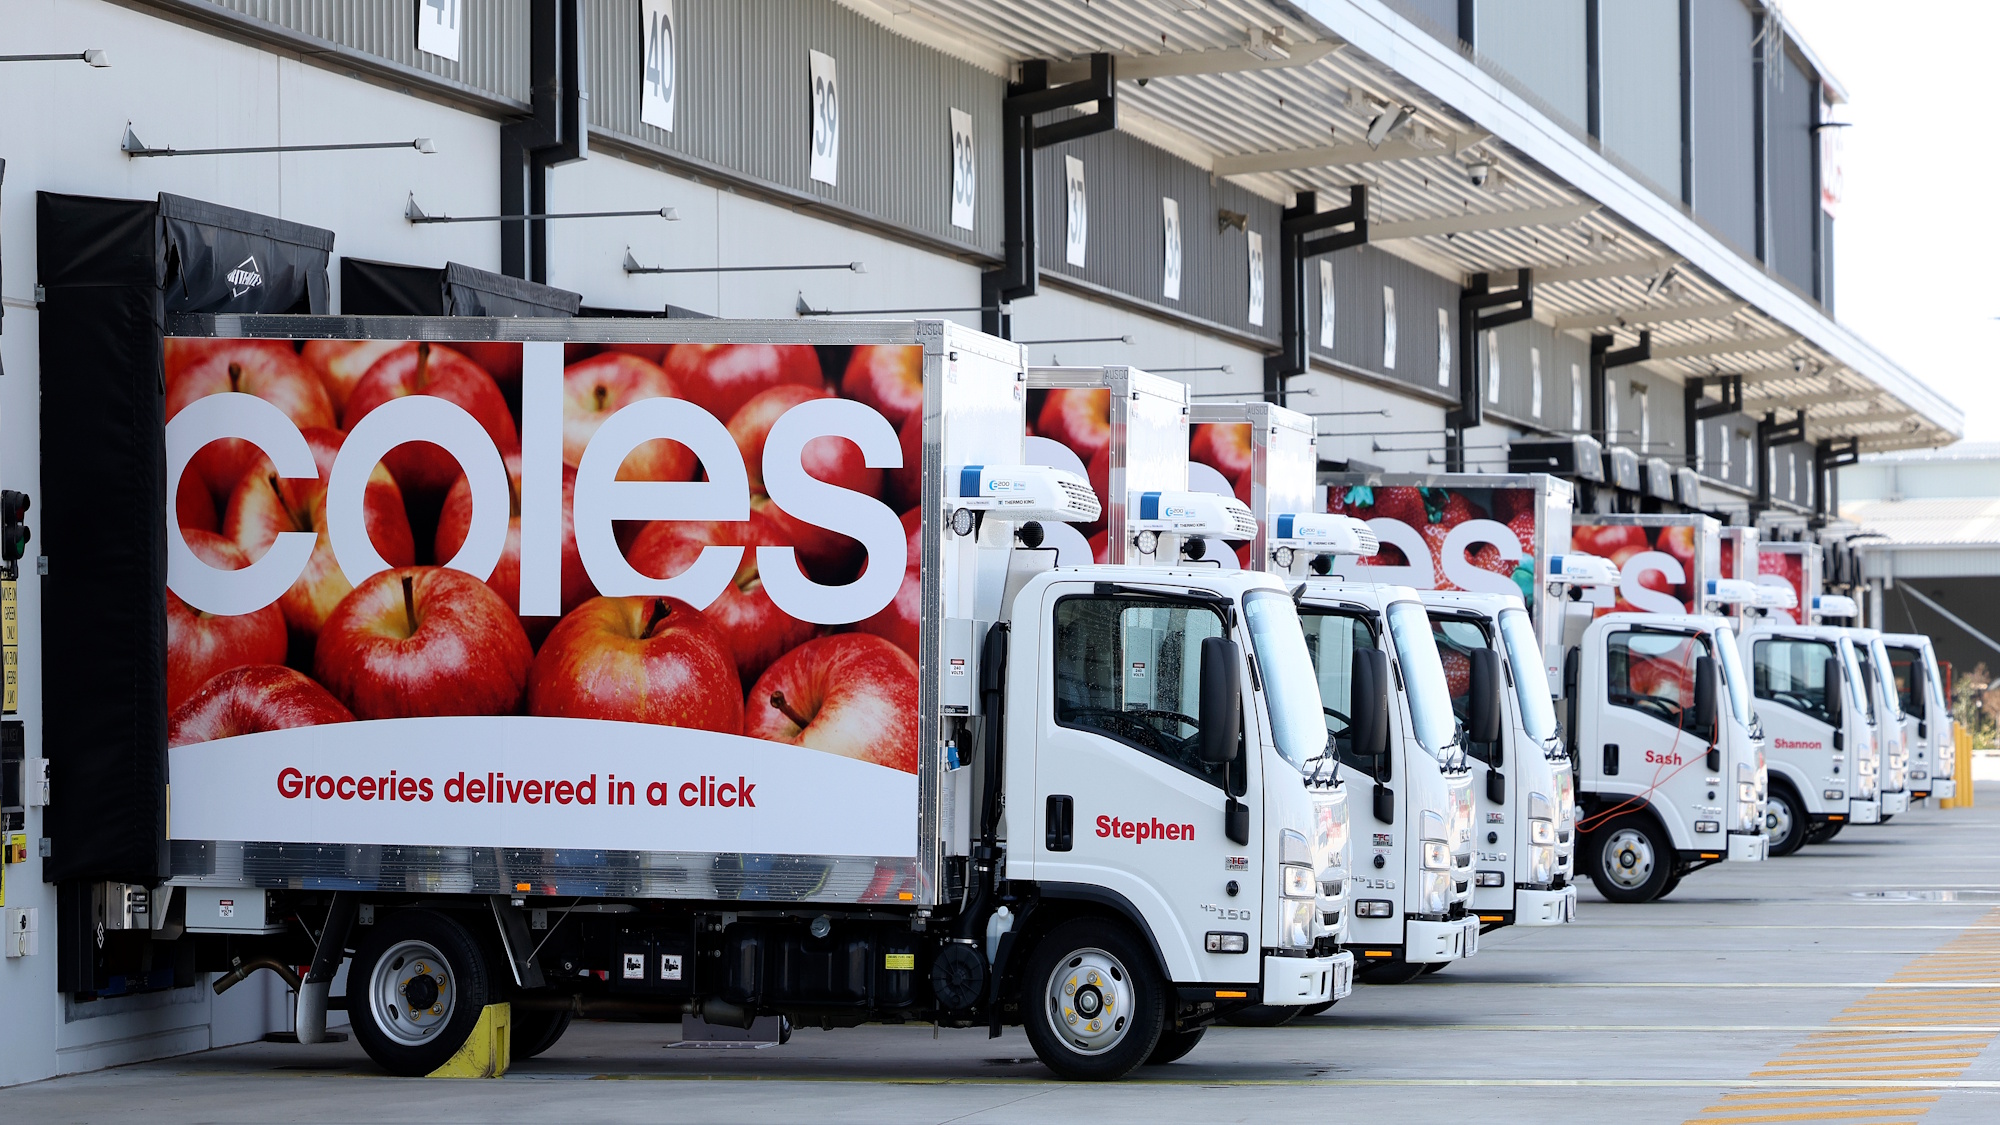
“Our CFCs allow us to provide the
biggest range, better availability
and improved freshness for those
customers who are looking to do
their weekly shop”
6
Increasing
flexibility
in deployment
7
Increasing
flexibility
in deployment
8
9
10
11
Building
Commercial
Momentum
Nick de la Vega
Chief Revenue Officer,
Ocado Group
12
Ocado's Commercial Focus
A refocused
& consolidated
commercial team
Doubling down
on grocery
Tilting toward and
validating the US
opportunity postexclusivity rolling off
13
Sales Momentum Growing
Major new OSP
partner signed
Significant acceleration
in Ocado Mobile Robot
System (OMRS) business
A strong pipeline
of new prospects
in multiple markets
14
Capturing the
US opportunity
c. 90% of online grocery in the U.S.
is currently fulfilled from stores
U.S. grocers are not adding meaningful
square footage in the coming years
Manual store-based fulfilment begins to
reach structural limits at roughly 12-15%
online penetration
A market that increasingly needs a new
answer, a competitive field in which no player
has yet locked up the winning model.*
- Assessment from a Big 3 Strategic Consultancy
An estimated core serviceable market of
c.8,400 stores by 2030, representing
c.$135 billion of online grocery demand
15
15
Feedback from the industry
What is the challenge?
Many stores are now beginning
to >25% online penetration,
putting pressure on operations
and costs
Rise of same day/immediacy
is putting acute pressure on
store labour productivity
Previous attempts to automate
struggled to accommodate
physical store constraints, or to
drive the required efficiencies.
What is driving interest in Ocado’s SBA?
No issue with physical store
constraints. Can be installed
within stores from 5,000 sq ft,
and no need to raise the roof
with a typical 20 ft clearance
Throughput and reliability
of Ocado’s system is well
established and proven
Ocado is not just solutions
provider and integrator, they
can ‘walk and talk’ as a
grocery operator
16
Financial
Review
Stephen Daintith
Chief Financial Officer,
Ocado Group
17
HY26 Financial progress1
(Excluding net closure fee receipts from Kroger/Sobeys)
Group revenue
Group adjusted EBITDA*
£684m
£81m
+1%1
Underlying cash flow *2
£(147)m
£(39)m1
• Revenue +1%
Technology Solutions +5% on LFL basis; Logistics +8%
• EBITDA run rate to improve
Technology Solutions £13m lower from phasing of closures
with 2H openings and benefits to come; Logistics +£3m
• Retail JV 100% +15% YoY
100% EBITDA £73m, 5.0% underlying margin
£(11)m1
• Underlying cash flow £(147)m
Liquidity
• Liquidity in excess of £1bn
£1.06bn
+£19m1
Excludes Kroger and Sobeys closure fees; net cash receipt
£263m
End-May cash £765m and £300m undrawn RCF; strong
liquidity to meet future debt maturities using cash
• Unchanged Guidance
Revenue, margin and cash flow targets on track
18
Summary Group Income Statement
£M
1H26 EXCL.
CLOSURE IMPACTS
KROGER/SOBEYS
CLOSURE IMPACTS
1H26
1H25
PRO- FORMA*
CHANGE
CHANGE EXCL.
CLOSURE
IMPACTS
Revenue
Recurring fees
231
231
239
(3%)
(3%)
Non-recurring and other revenue
25
354
378
39
+875%
(36%)
Technology Solutions
256
354
609
277
+120%
(8%)
Logistics
428
428
397
+8%
+8%
Group
684
354
1,037
674
+54%
+1%
Technology Solutions
60
351
410
73
+463%
(18%)
Logistics
22
22
19
+15%
+15%
Group
81
351
432
92
+371%
(11%)
Adjusted EBITDA*
Share of results of JV and assoc.
Depreciation, amort. and impairment
6
6
(8)
+14
+14
(184)
(125)
(309)
(174)
(135)
(9)
Finance income
22
22
22
(1)
(1)
Finance costs
(79)
(79)
(66)
(13)
(13)
(2)
(2)
(3)
+1
+1
(155)
225
70
(137)
+207
(18)
(53)
(53)
744
(797)
(797)
(208)
225
17
607
(590)
(816)
Other finance gains and losses
Adjusted EBT*
Adjusting items*
EBT
Note 1: figures used may not cast due to rounding
Note 2: £354m non-recurring income relating to CFC closures comprised £327m from Kroger's network optimisation (a £260m termination fee and £67m accelerated recognition of advance receipts) and
£26m from the closure of Sobeys' Calgary CFC (a £18m termination fee and £9m accelerated recognition of advance receipts). £125m of depreciation and impairment in the period related to Kroger's network
optimisation and the closure of Sobeys' Calgary CFC.
19
Technology
Solutions
20
1H26 reflects January closures with recurring fees and savings to drive EBITDA
1H26
1H25
CHANGE
(%/£M)
Average number of live modules
115
122
(6)%
Revenue
256
277
(8)%
Recurring fees
231
239
(3)%
Non-recurring fees
24
37
(33)%
Other revenue
0
2
(79)%
Direct operating costs
(67)
(71)
+4
2Q cost actions to flow through in 2H26:
Contribution
189
206
(17)
73.9%
74.4%
(0.5)%
•
•
Contribution £(17)m, reflecting revenue decline
Technology and Support costs reduced slightly
ongoing investment in core tech and partner delivery
Technology costs
(34)
(35)
+1
•
Support costs
(96)
(98)
+2
Major cost actions implemented during 2Q26, with
the benefits to flow through in H2 FY26 and FY27
EBITDA
60
73
(13)
23.3%
26.3%
(3.0)%
Kroger & Sobeys closure impact
+351
+351
Adjusted EBITDA*
410
73
+337
£M
Contribution margin %
EBITDA %
Technology Solutions total revenue (8)%:
• Recurring fees (3)% at £256m reflecting
Kroger/Sobeys closures partly offset by Warsaw and
drawdowns at existing partner CFCs
•
•
LFL recurring fees3 +5% excl. closures
Non-recurring fees of £24m with 1H25 incl. £17m
from Morrisons Erith exit
Technology Solutions EBITDA £60m:
• EBITDA reflects lower contribution partly offset by
cost discipline
•
Margin improvement expected to flow with cost
efficiencies in 2H26
LFL recurring fees exclude the business-as-usual fees from the four Kroger and Sobeys CFCs closed in Jan-26, removing £9m in HY26 and £27m in HY25 to compare £222m of LFL recurring fees in
HY26 with £212m in HY25.
21
Cost discipline and focus across all areas
Direct operating costs to benefit from
further efficiencies
Technology spend reducing due to
completed Re:Imagined investment
SG&A to reduce as we focus on
a leaner operating model
Technology Solutions direct operating costs
and contribution4
Technology spend (R&D CapEx and P&L
Technology costs5 )
Support costs5 (P&L) including
partner-facing teams
£m and % of sales revenue
£m
£m
206
172
74%
71%
189
248
74%
130
70
29%
71
26%
67
26%
1H24
1H25
1H26
Direct Operating Costs £m
operating efficiencies offset inflation
and initial Re:I tech. deployments
with volumes
1H25
98
98
96
1H24
1H25
1H26
88
1H26
1H27e
1H27e
Contribution £m
• Stable direct costs at 26% as
• Further leverage expected
1H24
104
•
Cost saving benefits to flow through
in 2H26, reducing overall Tech. spend
•
Major reorganisation actioned to
simplify our operating model
•
Technology R&D CapEx to be c.20%
recurring revenue in FY27
•
Support costs to decrease in 2H26
with full year impact in FY27
Direct operating costs and contribution figures exclude the Kroger and Sobeys closure impact
HY26 Technology spend includes £5m of share-based payments (HY25: £4m) and HY26 Support (SG&A) costs include £12m of share-based payments (HY25:£9m)
22
Ocado
Logistics
23
Ocado Logistics: strong 1H26 performance
1H26
1H25
CHANGE
(£M)/(%)
Management fees
15
14
+9%
Capital Recharges
3
3
£M
Fee Revenue
18
17
+6%
Cost Recharges
410
380
+8%
Revenue
428
397
+8%
1
1
Fulfilment and delivery costs
(370)
(344)
+8%
Technology and support costs
(36)
(35)
+1
Adjusted EBITDA*
22
19
+15%
Eaches per week (m)
30
28
+8%
Orders per week (000s)
669
614
+9%
OSP CFC UPH
268
239
+12%
Drops per van route (DP8)
22.5
21.2
+6%
Deliveries per van per week
23.5
22.0
+7%
Other Income
DP8 represents Ocado Retail only
Revenue
•
•
Management fees for Logistics services +9% to
£15m; higher recoverable costs from partner volume
growth
Cost recharges +8%reflecting higher fulfilment
activity, broadly in line with EPW growth (+8%)
Costs
•
CFC productivity (UPH) +12% with OGRP & AFL
helping to drive efficiency gains at our UK sites
•
DP86 +6% driven by drop density and routing
efficiency through deployments of OSP technology
improvements
Efficiency gains partially offset labour and broader
cost inflation
•
•
Adjusted EBITDA* +15% to £22m
24
UK partner gains in both CFC and DP8 delivery efficiency
OSP CFCs overall productivity UPH7 +12% YoY
Deliveries/8hr shift (DP88) +6% YoY
OSP CFC UPH
Drops per van route (normalised for an 8-hour shift)
221
239
1H24
1H25
268
21.0
21.2
22.5
1H26
1H24
1H25
1H26
Continued gains in CFC direct labour productivity
with UPH +12% (c.£10m p.a. efficiencies for ORL)
• Luton CFC averaged 315 UPH in 1H26 (1H25: 277) with
peak UPH of 323
• Labour efficiency enabled by Re:Imagined technology
including OGRP and AFL
•
•
•
•
Deliveries/8hr shift +6%; improvement in routing accuracy
from the new OSP platform and increased volumes
Additional van utilisation improvement, with drops per van
per week +7% (c.£20m p.a. efficiencies for ORL)
Further efficiency opportunities to be realised from the new
OSP platform, including Swift Router for ORL
Units dispatched from the CFC per variable labour
hour worked
hour (incl.
by Erith,
inbound
Andover,
and outbound
Purfleet, operations),
Bristol and Bicester
from theCFC
Erith,
operational
Andover, personnel
Purfleet, Bristol, Bicester and Luton CFCs
DP8 represents Ocado Retail only
25
Ocado
Retail
26
Ocado Retail: market-leading and high quality customer growth
1H26
1H25
CHANGE (%)
Revenue £m
1,756
1,526
+15%
avg. orders per week
(000s)
554
491
+13%
avg. active customers
(000s)
1,281
1,158
+11%
avg. basket value (£)
127
124
+1.9%
avg. eaches per basket
(individual items)
44
44
2.86
2.80
+2.0%
avg. selling price (£)
•
Strong volume-led growth with orders at +13%; active
customers9 +11%; 1.3m customers
•
High quality growth with mature customers (5 or more
orders) +10.2%
•
Average item price +2.0%; well below UK grocery
market inflation of 3.9%10
•
ORL continues to take a disproportionate share in a
channel exhibiting structural growth
•
Ocado’s share of the UK online grocery market 13.7%
with online grocery penetration at 13.4%10
•
The UK’s fastest growing retailer for 12
consecutive months10
Note: KPIs relate to Ocado.com
9.
10.
Customers are classified as active if they have shopped within the previous 12 weeks. Average active customers represents the average number of active customers over the 26-week period
NIQ Total Till and NIQ Homescan from Nielsen Consumer LLC,4 weeks to 16th May 2026
27
Ocado Retail: market-leading growth, EBT and cash positive
£M
1H26
%REV.
1H25
%REV.
%CHG.
•
Revenue +15% and Gross profit +£84m: with gross
margin increasing +0.4ppt
+17%
•
CFC costs +2%: CFC productivity more than offset
labour inflation, reducing CFC costs to 5.7% sales
(6.4)%
+2%
•
(184)
(12.1)%
+15%
Service delivery costs +15%: vs. revenue +15% with
routing and van utilisation efficiencies +7%, saving
around £20m p.a. to offset labour/fuel inflation
(0.5)%
(8)
(0.5)%
+17%
•
(23)
(1.3)%
(21)
(1.4)%
+11%
Support costs +10%: Higher IT costs from standalone
platform migration and business growth
Support costs
(69)
(3.9)%
(62)
(4.1)%
+10%
•
Total fees
(108)
(6.2)%
(102)
(6.7)%
+6%
Fees +6%: Includes £15m Hatfield fees, alongside indexlinked OSP fees and logistics/capital recharges.
OSP fees
(95)
(5.4)%
(89)
(5.8)%
+7%
Logistics/ Other
fees
(13)
(0.7)%
(13)
(0.9)%
+6%
•
Underlying EBITDA margin11 +1.7ppt to 5.0%: strong
operating leverage despite industry-wide cost inflation
Adjusted EBITDA*
73
4.2%
33
2.2%
+119%
•
Depn. & amort.
(39)
(2.2)%
(32)
(2.1)%
+22%
Operating leverage drives Adjusted EBT positive and
cash positive
Net finance costs
(23)
(1.3)%
(19)
(1.2)%
+21%
•
Adjusted EBT*
12
0.7%
(17)
(1.1)%
Cash and cash equivalents increased by £56m to £184m;
IAS17 net debt reduced by £48m to £(36)m.
Revenue
1,756
Gross profit
594
33.8%
509
33.4%
CFC
(100)
(5.7)%
(98)
Service delivery
(212)
(12.1)%
Utilities
(9)
Marketing costs
1,526
Underlying EBITDA margin excludes Hatfield Fees of £15m (HY25: £17m)
+15%
28
Ocado Retail KPIs: high growth, stable baskets and increasing asset turn
Enduring and structural
customer growth
Basket items stable, order
frequency improves again
We are leveraging our CFCs
beyond their designed capacity
Ocado.com average active customers
Ocado.com eaches per basket
CFC original design capacity utilisation
Thousands
5yr CAGR +13%
840
1,281
956
1,021
1,158
Covid
impact
% (eaches shipped vs eaches capacity)
56
48
45
45
44
44
Covid
impact
103%
Hatfield ceased
operations
92%
80%
75%
688
103%
61%
1H21 1H22 1H23 1H24 1H25 1H26
1H21 1H22 1H23 1H24 1H25 1H26
1H21 1H22 1H23 1H24 1H25 1H26
• Compounding customer growth as
the channel shifts endures
•
Stable basket sizes with an
increasing shopping frequency
• Additional capacity with minimal
capital outlay
• Strong retention to fifth shop with
stable vouchering, <1% of sales
•
Enabled by a long tail assortment
with availability to promise
• Erith CFC or additional modules
beyond design capacity available
29
Ocado Group
Cash Flow
30
Cash Flow: Reduced CapEx offset by lower EBITDA, upfront fees
and a working capital outflow
£M
1H26
1H25
YOY £M
Adjusted EBITDA*
81
92
(11)
Cash received from contract liabilities (upfront fees)
10
41
(31)
Revenue recognised from long-term contracts
(24)
(31)
+7
Working capital and other underlying items
(39)
(1)
(38)
Interest paid
(61)
(39)
(22)
Interest received
13
12
+1
Capital expenditure
(116)
(171)
+55
Lease cash costs (net)
(12)
(12)
Underlying cash flow*
(147)
(108)
(39)
•
•
•
•
Adjusted EBITDA* decreasing by £11m
to £81m reflecting the impact from the
closure of four CFCs
Lower upfront fees with receipts from
two partners vs. four in HY25
Working capital outflow12 from phasing
(2H25 £21m inflow)
Net finance costs up by £21m: higher
interest cost at c.8%
CapEx falling by £55m to £116m; £15m
lower Technology CapEx and £33m lower
CFC CapEx
• Underlying cash outflow of £(147)m
(excludes Kroger/Sobeys net closure
receipts £263m)
•
Note: Interest paid reflects interest and charges on borrowings only.
Working capital and other underlying items includes working capital £(55)m (HY25 £(18)m) and share-based compensation £19m (HY25 £16m).
31
Net cash inflow of £25m driven by the closure fee receipts
Reported cash inflow of £25m
Reported cash flow
£m
£(172)M
263
(31)
•
Total cash inflow of £25m
•
£263m related to net receipts from Kroger and
Sobeys site closures
•
£(31)m of the Adjusting items principally related
to restructuring of the organisation
•
£(55)m outflow from paying down the
remaining stub of the £600m senior unsecured
notes at maturity
(55)
(5)
(147)
25
• £(5)m Other items relating to the effect of
changes in FX rates
HY25 Underlying
cash flow
Kroger and
Sobeys net
closure receipts
Adjusting items
Debt reduction
Other items
HY26 Reported
cash flow
32
Ocado Group
Outlook
33
On track to turn cash flow positive during 2H26 and for full year FY27
Underlying cash flow*
£m
8
(27)
(108)
(175)
(147)
(197)
(298)
(396)
(432)
1H22
2H22
1H23
2H23
1H24
2H24
1H25
Path to sustainable cash flow positive underpinned by cost savings,
lower capital intensity and operational leverage
2H25
1H26
2H26e
1H27e
Underlying cash flow
Underlying cash flow before MHE CapEx
34
Actions implemented in 1H26 underpin the delivery of our £150m
Technology & SG&A cost reduction programme
£150m
4Q26
3Q26
WORKSTREAM
KEY ACTIONS
Organisational
Efficiency
•
•
•
Redesigned operating model complete
Simplified organisational layers
Combined commercial teams with a single brand
Lower Support (SG&A) costs in
2H26/FY27
Location
Optimisation
•
•
•
Office rationalisation (London/Barcelona)
Enlarged Shared Support Centre in Sofia
Consolidation of UK Research sites
Lower Property costs in FY27
Non-people cost
optimisation
•
•
•
“Zero-based budgeting” mentality
Reduced contractor and professional services spend
Bearing down in non-essential spend
Lower Support (SG&A) costs in
2H26/FY27
Focused Technology
spend
•
•
•
Prioritising short payback opportunities
Optimising continuity and partner commitments
Deploying AI-tooling as a “multiplier”
Lower Technology spend and
CapEx in 2H26/FY27
£30-40m
<£10m
Activated
in 1H26
CASH FLOW BENEFIT
£20-30m
£80-90m
The majority of organisational actions have now been implemented, financial benefits
expected to be realised progressively through H2 FY26 and FY27
35
Key building blocks to cash flow positive in FY27
Underlying cash flow*
£m FY19
FY20
FY21
FY22
FY23
FY24
(199)
(261)
(312)
FY25
FY26
FY27
•
FY27 Live modules of 120-125+ plus
additional fees
•
Contribution of around £400m; cash
contribution per module of c.£3m†
•
Total Technology spend and Support costs of
around £250m (£400m in FY25)†
•
Other net inflows £50-100m including upfront
fees received from partners, Logistics cash
inflows, lease costs and movements in
working capital
•
Net interest costs of £80m to £100m†
•
Sufficient cash flow to be cash flow positive
and to fund c.10% module growth
(213)
(473)
(743)
(828)
FY19
FY20
FY21
FY22
FY23
FY24
FY25
FY26
FY27
36
Note: † Items stated on a cash basis
Managing our debt maturities in an orderly way
Strong liquidity augmented by one-off fees from Kroger and Sobeys in 1H26
Summary Net Debt Profile
£m
COUPON %
Cash and cash equivalents
1H26
FY25
CHANGE
765
740
+25
£600m senior unsecured convertible bonds
(Dec-25)
0.88%
(56)
(56)
£500m senior unsecured notes (Oct-26)
3.88%
£350m senior unsecured convertible bonds
(Jan-27)
0.75%
(342)
(335)
+7
£250m senior unsecured convertible bonds
(Aug-29)
6.25%
(226)
(222)
+4
£450m senior unsecured notes (Aug-29)
10.50%
(457)
(456)
+1
£400m senior unsecured notes (Jun-30)
11.00%
(413)
(417)
(4)
(1,438)
(1,486)
+48
Lease liabilities14
(296)
(302)
+6
Gross debt
(1,734)
(1,788)
+54
IFRS16 Net debt
(970)
(1,048)
+79
Borrowings13
Borrowings shown are carrying amounts in the balance sheet
In HY26 £272m of lease liabilities relate to Ocado Logistics (HY25:£280m)
•
£56m stub for the £600m Dec-25 CB
redeemed at maturity
•
Sufficient liquidity to address the
£350m CB due Jan-27; gross debt set
to decline further
•
Additional liquidity since Y/E: £263m
cash from Kroger and Sobeys
•
Target to maintain a minimum liquidity
around £500m (incl. RCF)
37
Unchanged guidance for FY26
Guidance below excludes Kroger and Sobeys closure fees*
Technology Solutions
Ocado Logistics
Ocado Group
REVENUE
ADJUSTED EBITDA*
Around £500m
c.30% EBITDA margin
High mid-single digit % growth
c.£30-35m
UNDERLYING CASH FLOW*
CAPITAL EXPENDITURE
Around £200m outflow
Turning positive during 2H FY26
Around £250m
38
Key messages
Building commercial
momentum
Major new OSP partner and a strong
commercial pipeline; ORL now PBT
and cash positive, +15% revenue YoY
Cost and capital discipline
Underway and on track to
deliver our £150m cost saving
programme
Active management of
our Balance Sheet
On track to turn cash positive
during second half FY26
£1bn of liquidity, cash available to
pay down our near-term debt;
gross debt set to decline
Robust plan to sustainably turn
full cash flow positive for FY27
39
Q&A
40
Appendix
41
Ocado Group – HY26 Adjusting items
£M
HY26
HY25
CHANGE
ORL deconsolidation
783
(783)
Jones Food deconsolidation
(23)
+23
Organisational restructure
(42)
(12)
(30)
ORL adjusting items (Ocado Group
50% share)
(7)
(4)
(3)
Ocado Group HR system
transformation
(3)
(3)
Other
4
(4)
(53)
744
(797)
Total adjusting items
42
HY26 Interest Charges - P&L vs Cash
£M
MAY-26 CASH
PRINCIPAL
COUPON
Finance income
INCOME
STATEMENT
CASH
FLOW
22
18
£600m senior unsecured convertible bonds (Dec-25)
0.88%
£500m senior unsecured notes (Oct-26)
3.88%
£350m senior unsecured convertible bonds (Jan-27)
(350)
0.75%
(9)
(1)
£250m senior unsecured convertible bonds (Aug-29)
(250)
6.25%
(12)
(8)
£450m senior unsecured notes (Aug-29)
(450)
10.50%
(25)
(24)
£400m senior unsecured notes (Jun-30)
(400)
11.00%
(23)
(27)
Other interest and charges on borrowings
(2)
(2)
Total interest and charges on borrowings
(69)
(61)
Interest on lease liabilities
(9)
(9)
Other finance costs
(1)
Gross finance costs
(79)
(70)
Other finance gain and losses
(2)
Net finance costs
(59)
(52)
43
Summary of footnotes
8.
DP8 represents Ocado Retail only
Customers are classified as active if they have shopped within the previous 12 weeks. Average
active customers represents the average number of active customers over the 26-week period
NIQ Total Till and NIQ Homescan from Nielsen Consumer LLC,4 weeks to 16th May 2026
Underlying EBITDA margin excludes Hatfield Fees of £15m (HY25: £17m)
LFL recurring fees exclude the business-as-usual fees from the four Kroger and Sobeys CFCs
closed in Jan-26, removing £9m in HY26 and £27m in HY25 to compare £222m of LFL recurring
fees in HY26 with £212m in HY25.
Working capital and other underlying items includes working capital £(55)m (HY25 £(18)m) and
share-based compensation £19m (HY25 £16m).
Direct operating costs and contribution figures exclude the Kroger and Sobeys closure impact
Borrowings shown are carrying amounts in the balance sheet
HY26 Technology spend includes £5m of share-based payments (HY25: £4m) and HY26 Support
(SG&A) costs include £12m of share-based payments (HY25:£9m)
In HY26 £272m of lease liabilities relate to Ocado Logistics (HY25:£280m)
DP8 represents Ocado Retail only
Units dispatched from the CFC per variable labour hour (incl. inbound and outbound operations),
from the Erith, Andover, Purfleet, Bristol, Bicester and Luton CFCs
Comparisons of % changes and £m variances are made between HY26 and HY25 on a 26-week
basis and exclude Kroger and Sobeys closure impacts from figures
Underlying cash flow is the movement in cash and cash equivalents, excluding the impact of
adjusting items, financing costs, proceeds from the disposal of assets held for sale, cash received
in respect of contingent consideration, acquisitions of subsidiaries, purchases of unlisted equity
investments, material non-recurring termination fees (which are not treated as adjusting items) and
foreign exchange movements. Underlying cash flow* also excludes the closure impacts from the
four Kroger and Sobeys CFCs closed in January 2026.
44
Glossary (continued)
Active customers – a customer who has shopped at Ocado.com within the
previous 12 weeks
Live module – means modules that are fully installed and available for use by
our partners or where fees are being received for the module
AFL – Auto frame load
Mature customer – defined as a customer who has shopped on Ocado.com 5
or more times in the previous 12 weeks
Average live modules – based on average weekly live modules in the reporting
period
Basket size – number of eaches (number of individual pick of SKUs) for
Ocado.com
CFC – Customer Fulfilment Centre
CFC UPH – average units processed per labour hour at OSP CFCs (all CFCs
excluding Hatfield and Dordon)
Deliveries per van per week – total average weekly deliveries for the period
divided by the average weekly number of vans in the fleet. Relates to Ocado
Retail only
Module of capacity – a module of capacity is assumed as 5,000 eaches picked
per hour and c.£79m (FY24: c.£75m) per annum of sales capacity available to
live OSP partners.
Ocado.com – relates to sales on the Ocado.com platform (excludes
Ocado Zoom)
Ocado Logistics costs – includes other income
Ocado Logistics eaches (m) – total CFC units of volume fulfilled for UK clients
in millions
Ocado Logistics orders per week – total CFC orders shipped for UK clients
divided by the number of weeks in the reporting period
Each – an individual pick of a stock keep unit (SKUs)
45
Glossary (continued)
Ocado Retail average basket value (£) – product sales divided by total orders
OGRP – On-Grid Robotic Pick
Ocado Retail average orders per week (000s) – Ocado.com only
OSP – Ocado Smart Platform; the end-to-end solution for operating online in
the grocery market which has been developed by the Group
Ocado Retail average selling price (£) – product sales divided by total eaches
Ocado Retail fees – include OSP, capital recharges and management fees
Ocado Retail gross profit and other income – includes supplier funded
media income
Perfect Order Rate - the percentage of grocery deliveries that are fulfilled
flawlessly without any errors, missing items, or delays
Sites – includes CFCs and Zooms
UPH – Units per hour
Ocado Retail marketing costs – comprise the cost of marketing activities to
customers and exclude vouchering costs which are within revenue
Ocado Retail revenue – includes online sales (net of returns) including charges
for delivery but excluding relevant vouchers/offers and value added tax
46
Kroger is a registered trademark of The Kroger Co.
Morrisons is a registered trademark of Wm Morrison Supermarkets Limited.
Sobeys is a registered trademark of Sobeys Inc.
Bonpreu is a registered trademark of Bon Preu group.
Alcampo is a registered trademark of Auchan Retail España, S.L.
Lotte Shopping is a registered trademark of Lotte Shopping Co., Ltd
Auchan Poland is a registered trademark of the French multinational retail
group Auchan Holding S.A.
Uber Eats is a registered trademark of Uber Technologies, Inc
Just Eat is a registered trademark owned by Just Eat Holding Limited
AEON is a registered trademark of AEON Co., Ltd.
Coles is a registered trademark of Coles Group Limited.
Deliveroo is a registered trademarks and branding are owned by Deliveroo plc
ASDA is a registered trademark of Asda Stores Limited, which is a subsidiary of
Asda Group PLC
47



















 LinkedIn
 Facebook
 X
 YouTube
 Instagram