Transaction in Own Shares | Kier Group PLC
Bull 0
Bear 0
Routine
KIE
Fiscal year ends June
Quarters are offset from the calendar — Q1 is Jul–Sep
|
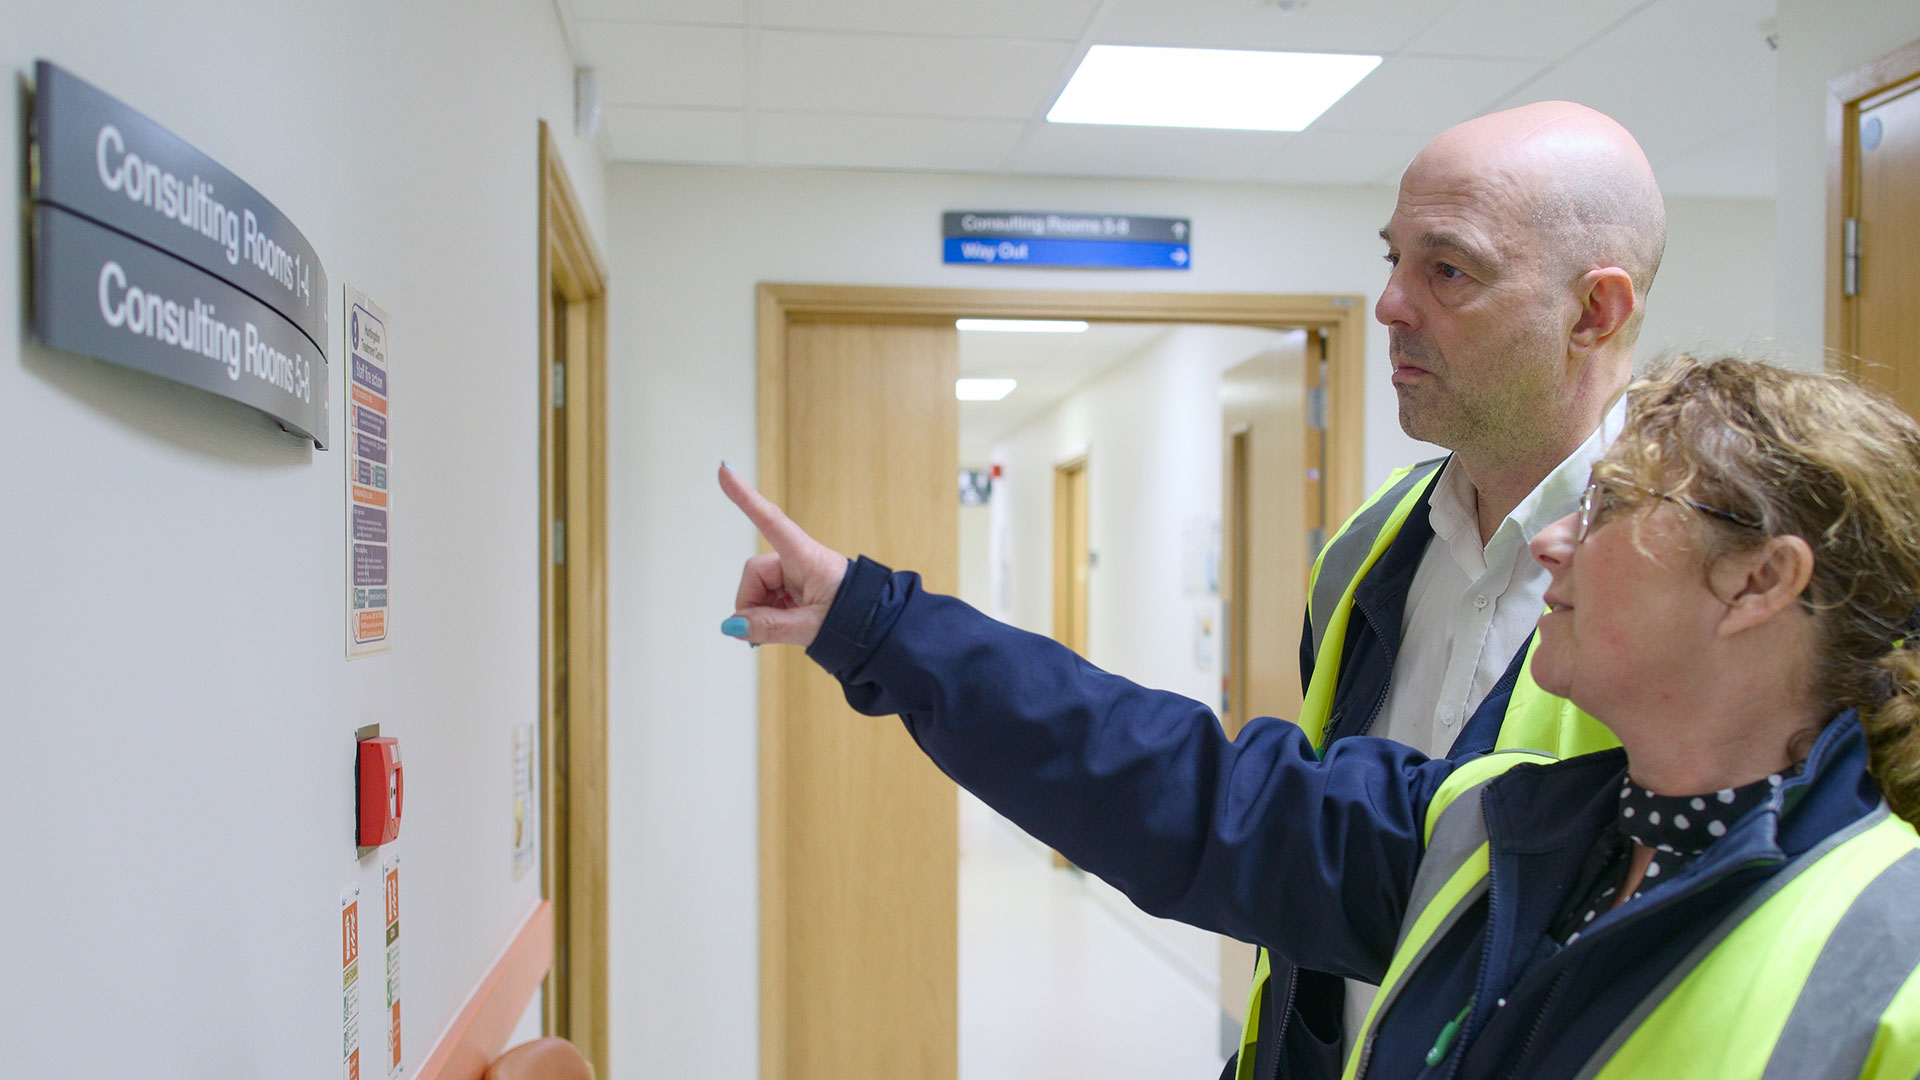
Kier Group plc is a UK-based infrastructure and construction group that designs, builds, maintains, and operates economic and social infrastructure assets. The company operates through two main divisions: Infrastructure and Construction. Its business spans sectors including water, energy, defence, healthcare, transport, education, and central government projects. Kier serves customers such as central government departments, regional and local authorities, regulated industries, and private sector clients across the United Kingdom. The company holds long-term framework positions in transport, education, and central government, and has expanded its nuclear portfolio with appointments related to Sizewell C. Notable recent projects include the Manchester Airport station remodelling, Thames Water wastewater upgrades, and the Hinchingbrooke Hospital Treatment Centre. Kier combines national capability with local delivery, utilizing digital and data technologies to support project lifecycles from development and design to maintenance and repurposing. Summarised from the company's own disclosures, fiscal year ended Jun 2026 |
Industry Engineering & Construction | Homepage kier.co.uk |
| Sector Industrials | IR page kier.co.uk/investors | |
|
Tags
infrastructure construction, water infrastructure, energy infrastructure, defence facilities, healthcare facilities, transport infrastructure, education facilities, nuclear construction, asset maintenance, asset operation, Kier Group plc, Infrastructure, Construction, Sizewell C, Thames Water, Manchester Airport, Hinchingbrooke Hospital Treatment Centre, L&Q Major Works investment programme, MWIP
|
Press page kier.co.uk/news-and-events/newsroom |
Metrics
| Valuation | |
|---|---|
| Market cap | £ 1.379B |
| Market cap (USD) | $ 1.824B |
| P/E | 22.34 |
| PEG | 1.54 |
| P/BV | 2.70 |
| P/S | 0.32 |
| P/OCF | 6.01 |
| P/FCF | 6.17 |
| Dividend yield | — |
| Turnover / mcap | — |
| Returns | |
|---|---|
| ROE | 12.0% |
| ROI | 8.0% |
| ROIC | 11.3% |
| Profit margin | 1.4% |
| Growth | |
|---|---|
| Revenue growing | Yes |
| Profits growing | Yes |
| Revenue up 3y | Yes |
| Revenue up 5y | No |
| Earnings growth 3y (net profit CAGR) | 14.5% |
| Quality | |
|---|---|
| Profitable | Yes |
| Margin expanding | No |
| Buying back stock | Yes |
| Diluting (TTM) | No |
| Debt/Equity | 51.9% |
| Podcast bulls (TTM) | Sign up |
| Podcast bears (TTM) | Sign up |
| Podcast sentiment (TTM) | Sign up |
| Podcast sentiment % (TTM) | Sign up |
| News sentiment (TTM) | 55 |
| Quality score | 33.3% |
| Insiders | |
|---|---|
| Buys, 1w | Sign up |
| Buys, 1m | Sign up |
| Buys, 1y | Sign up |
| Sells, 1w | Sign up |
| Sells, 1m | Sign up |
| Sells, 1y | Sign up |
Sign up to see this company's insider trades
| Figure | FY 2026 | FY 2025 | FY 2024 | FY 2023 | FY 2022 | FY 2021 | FY 2020 | FY 2019 | FY 2018 | FY 2017 | FY 2016 | FY 2015 | FY 2014 | FY 2013 | FY 2012 |
|---|---|---|---|---|---|---|---|---|---|---|---|---|---|---|---|
| Revenue | 4.353B | 4.077B | 3.905B | 3.381B | 3.144B | 3.261B | 3.423B | 4.122B | 4.24B | 4.129B | 3.991B | 3.276B | 2.954B | 1.943B | 2.031B |
| Net profit | 61.8M | 56.4M | 43M | 41M | 12.7M | -1.6M | -273.3M | -229.8M | 87.5M | 11.8M | -16.8M | — | 10.7M | 38.6M | 55.3M |
| Free cash flow | 223.5M | 223.9M | 223M | 179.6M | 68M | 44.7M | — | — | — | — | — | — | — | — | — |
Filed figures
Lines the statements and their notes report beside the headline figures, read from the filings' XBRL as filed (no restatement applied), with figures computed from one filing's own lines. Cash-flow lines carry their cash direction: an outflow is negative. Each period links to its filing; a figure's period, report date and tag are in its tooltip.
| Figure | Jun 2020 | Jun 2021 | Jun 2022 | Jun 2023 | Jun 2024 | Jun 2025 | Jun 2026 |
|---|---|---|---|---|---|---|---|
| Balance sheet detail | |||||||
| Trade receivables (GBP) | — | 203M | 203M | 189M | 237M | 203M | 256M |
| ↳ YoY growth | -0.1% | -6.8% | +25.4% | -14.5% | +26.2% | ||
| ↳ 5y CAGR | +4.7% | ||||||
| Borrowings, current (GBP) | — | 38.2M | 40.5M | 0.00 | 58.8M | 0.00 | — |
| Borrowings, non-current (GBP) | — | 362M | 267M | 319M | 242M | 264M | 265M |
| Lease liabilities (GBP) | — | 164M | 158M | 183M | 173M | 151M | 178M |
| Cash and deposits (GBP) | 414M | 391M | 298M | 377M | 1.56B | 1.69B | 1.9B |
| Right-of-use assets (GBP) | — | 96.5M | 80.6M | 105M | 95M | 96.5M | 110M |
| Net debt (borrowings + leases - cash) (GBP) | — | 173M | 167M | 125M | -1.09B | -1.27B | -1.46B |
| Cash flow detail | |||||||
| Operating cash flow (GBP) | — | 48M | 74M | 184M | 230M | 235M | 229M |
| Purchases of property, plant and equipment (GBP) | — | -3.3M | -6M | -3.9M | -7.1M | -11.1M | -5.9M |
| Purchases of intangible assets (GBP) | — | -3.1M | -700,000 | -2.7M | -9.5M | -5.4M | -4.7M |
| Change in receivables (cash effect) (GBP) | — | 43M | 7.3M | 12.2M | -20.3M | 19.6M | -47.9M |
| Change in inventories (cash effect) (GBP) | — | 3.9M | -2.1M | -18.8M | -1.1M | 2M | -5.2M |
| Change in payables (cash effect) (GBP) | — | 101M | -12.4M | 26.1M | 23.7M | -20.5M | 30.1M |
| Dividends paid (cash effect) (GBP) | — | — | — | 0.00 | -7.3M | -24.1M | -34.1M |
| Share buybacks (cash effect) (GBP) | — | -500,000 | -7M | -11.9M | -3.7M | -16.1M | — |
| Interest paid (cash effect) (GBP) | — | -28.4M | -28.8M | -39.5M | -32.7M | -40.6M | -39.2M |
| Income taxes paid (cash effect) (GBP) | — | 11.2M | 0.00 | -100,000 | -2.9M | -1.8M | -2.9M |
| Share-based compensation (GBP) | — | 7M | 8.6M | 8.4M | 9.3M | 8.9M | 11.2M |
| Operating cash flow before change in receivables (GBP) | — | 5M | 66.7M | 171M | 250M | 215M | 277M |
| Free cash flow (OCF - PPE - intangibles) (GBP) | — | 41.6M | 67.3M | 177M | 214M | 219M | 219M |
| Income detail | |||||||
| Total comprehensive income (GBP) | — | -31M | 117M | -37.5M | 4.6M | 24.8M | 66.6M |
| Comprehensive income to owners (GBP) | — | -29.7M | 117M | -37.4M | 4.3M | 24.8M | 66.5M |
| Reported | Oct 7, 2022 | Oct 7, 2022 | Oct 7, 2022 | Oct 4, 2024 | Oct 4, 2024 | Oct 3, 2025 | Oct 2, 2026 |
Sign up to see institutional holdings
Sign UpPodcast Mentions
Sign up to see podcast mentions and sentiment
Sign UpResults, director/PDMR dealings and voting-rights totals announced to the FCA's National Storage Mechanism, newest first. The link opens the announcement on the NSM. Press releases from the company's own website, newest first.

Total Voting Rights | Kier Group PLC
Bull 0
Bear 0
Routine
Director/PDMR Shareholding | Kier Group PLC
Bull 0
Bear 0
Routine






Prompts
Click prompts to add them under the company line, click again to take one out, then copy the result into your AI chat. Shared by Asian Century Stocks and Uncovered Thai Stocks. Thank you.
Kier Group plc (ticker KIE), listed in United Kingdom.
Copied
ETFs Holding Kier Group plc
Exchange-traded funds whose newest published daily portfolio holds one of the company's listings, largest weight first.