Director/PDMR Shareholding
Bull 0
Bear 0
Routine
IMI
|
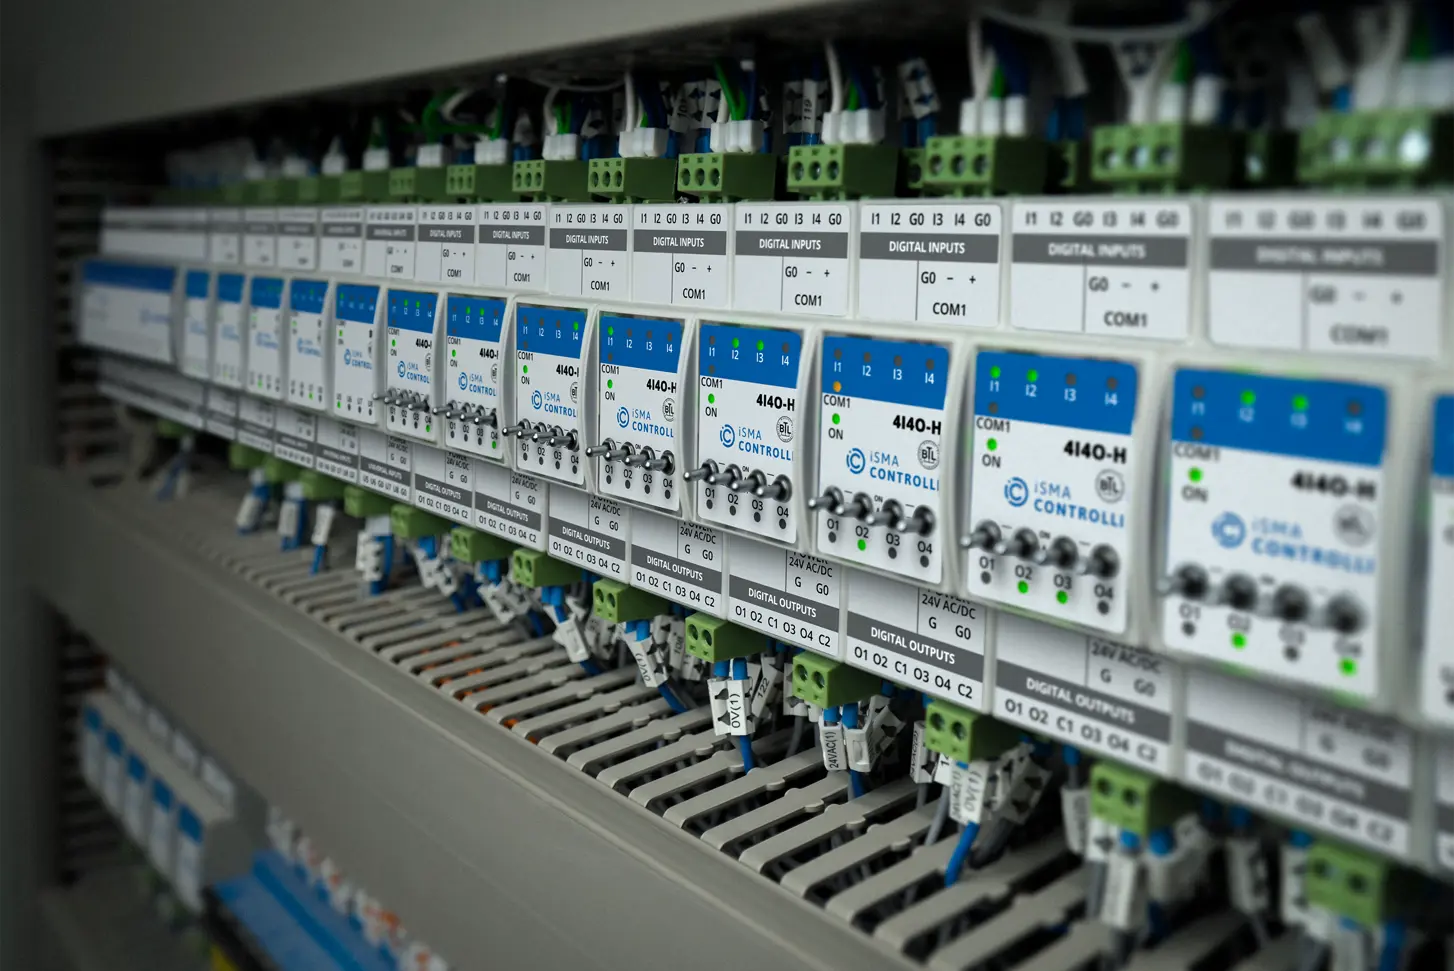
IMI plc is an engineering company specializing in fluid and motion control. The group designs and manufactures bespoke solutions, including valves, actuators, and controls, that enhance safety, productivity, and sustainability in critical industrial systems. IMI serves five key market sectors, with a primary focus on energy, automation, and healthcare. In the energy sector, the company provides flow control technologies for applications ranging from LNG and nuclear power to hydrogen production and data center cooling. Its automation business includes process automation and smart building solutions, while its healthcare division offers precision components for life sciences and medical devices. The company operates under the 'One IMI' model, leveraging a global presence in Europe, North America, and the rest of the world. IMI was founded in 1862 and formerly operated as Imperial Metal Industries before its current branding. The group includes subsidiaries and brands such as Norgren, IMI CCI, Adaptas, Heatmiser, TWTG, iSMA CONTROLLI, IMI Remosa, and Bahr. Summarised from the company's own disclosures, fiscal year ended Dec 2025 |
Industry Specialty Industrial Machinery | Homepage imiplc.com |
| Sector Industrials | IR page imiplc.com/en/investors | |
|
Tags
fluid control, motion control, valves, actuators, process automation, energy systems, healthcare engineering, smart building controls, industrial instrumentation, Norgren, IMI CCI, Adaptas, Heatmiser, TWTG, iSMA CONTROLLI, IMI Remosa, Bahr, TA-Smart, Retrofit 3D
|
Press page — |
Metrics
| Valuation | |
|---|---|
| Market cap | £ 7.619B |
| Market cap (USD) | $ 10.227B |
| P/E | 22.80 |
| PEG | 2.06 |
| P/BV | 7.99 |
| P/S | 3.21 |
| P/OCF | 18.35 |
| P/FCF | — |
| Dividend yield | 0.74% |
| Turnover / mcap | — |
| Returns | |
|---|---|
| ROE | 28.2% |
| ROI | 20.1% |
| ROIC | 20.3% |
| Profit margin | 13.5% |
| Growth | |
|---|---|
| Revenue growing | Yes |
| Profits growing | Yes |
| Revenue up 3y | Yes |
| Revenue up 5y | — |
| Earnings growth 3y (net profit CAGR) | 11.0% |
| Quality | |
|---|---|
| Profitable | Yes |
| Margin expanding | Yes |
| Buying back stock | Yes |
| Diluting (TTM) | No |
| Debt/Equity | 38.7% |
| Podcast bulls (TTM) | Sign up |
| Podcast bears (TTM) | Sign up |
| Podcast sentiment (TTM) | Sign up |
| Podcast sentiment % (TTM) | Sign up |
| News sentiment (TTM) | 0 |
| Quality score | 50.0% |
| Insiders | |
|---|---|
| Buys, 1w | Sign up |
| Buys, 1m | Sign up |
| Buys, 1y | Sign up |
| Sells, 1w | Sign up |
| Sells, 1m | Sign up |
| Sells, 1y | Sign up |
Sign up to see this company's insider trades
| Figure | FY 2025 | FY 2024 | FY 2023 | FY 2022 | FY 2021 | FY 2020 | FY 2019 | FY 2018 | FY 2017 | FY 2016 | FY 2015 | FY 2014 | FY 2013 | FY 2012 | FY 2011 | FY 2009 |
|---|---|---|---|---|---|---|---|---|---|---|---|---|---|---|---|---|
| Revenue | 2.304B | 2.21B | 2.196B | 2.049B | 1.866B | — | 1.873B | 1.907B | 1.751B | 1.657B | 1.567B | 1.686B | 1.744B | 2.192B | 2.135B | — |
| Net profit | 309.9M | 248.5M | 237.3M | 226.3M | 196.3M | 170.2M | 156.1M | 169.4M | 177M | 133.2M | — | 671.3M | 227M | 219M | — | 132.4M |
Filed figures
Lines the statements and their notes report beside the headline figures, read from the filings' XBRL as filed (no restatement applied), with figures computed from one filing's own lines. Cash-flow lines carry their cash direction: an outflow is negative. Each period links to its filing; a figure's period, report date and tag are in its tooltip.
| Figure | Dec 2019 | Dec 2020 | Dec 2021 | Dec 2022 | Dec 2023 | Dec 2024 | Dec 2025 |
|---|---|---|---|---|---|---|---|
| Balance sheet detail | |||||||
| Trade receivables (GBP) | 390M | 379M | 414M | 485M | 524M | 540M | 562M |
| ↳ YoY growth | -2.8% | +9.3% | +17.1% | +8.0% | +3.1% | +4.1% | |
| ↳ 5y CAGR | +6.7% | +8.2% | |||||
| Borrowings, current (GBP) | 17.6M | 0.00 | 128M | 150M | 47.2M | 124M | 92.6M |
| Borrowings, non-current (GBP) | 358M | 362M | 430M | 595M | 531M | 391M | 430M |
| Lease liabilities (GBP) | 90.4M | 88.3M | 93.9M | 106M | 100M | 89.1M | 78.1M |
| Cash and deposits (GBP) | 88.2M | 208M | 94.6M | 133M | 107M | 148M | 112M |
| Intangible assets (GBP) | — | 150M | 235M | 271M | 277M | 254M | 221M |
| Right-of-use assets (GBP) | 90.1M | 85.6M | 91.5M | 107M | 99.6M | 87.6M | 79.1M |
| Net debt (borrowings + leases - cash) (GBP) | 378M | 243M | 557M | 718M | 572M | 457M | 488M |
| Cash flow detail | |||||||
| Operating cash flow (GBP) | 315M | 329M | 269M | 284M | 363M | 372M | 415M |
| Purchases of property, plant and equipment (GBP) | -65.8M | -50.7M | -57.5M | -71.3M | -79.9M | -91.5M | -98.6M |
| Change in receivables (cash effect) (GBP) | 44.9M | 17.2M | -44M | -38.8M | -56.5M | -40.5M | -26.3M |
| Change in inventories (cash effect) (GBP) | -14.7M | -8.8M | -37.3M | -47.6M | -32.3M | -24.1M | 31.4M |
| Change in payables (cash effect) (GBP) | -17.3M | 6.2M | 30.7M | 1.3M | 57.5M | 43.1M | -2.6M |
| Dividends paid (cash effect) (GBP) | -111M | -91.6M | -61.8M | -62.2M | -68.8M | -76M | -80.6M |
| Share buybacks (cash effect) (GBP) | -4.2M | -8.7M | — | — | 0.00 | -100M | -201M |
| Interest paid (cash effect) (GBP) | -19.4M | -14.8M | -14.5M | -23.8M | -30.8M | -24.5M | -28.1M |
| Income taxes paid (cash effect) (GBP) | -40.2M | -41M | -50.9M | -48.6M | -76.1M | -97.9M | -99.7M |
| Share-based compensation (GBP) | 8.8M | 10.3M | 12M | 11.7M | 12.9M | 10.8M | 10.9M |
| Operating cash flow before change in receivables (GBP) | 270M | 312M | 313M | 323M | 420M | 412M | 442M |
| Free cash flow (OCF - PPE - intangibles) (GBP) | 249M | 278M | 212M | 212M | 283M | 280M | 317M |
| Income detail | |||||||
| Total comprehensive income (GBP) | 149M | 179M | 252M | 198M | 179M | 217M | 293M |
| Comprehensive income to owners (GBP) | — | 179M | 252M | 198M | 179M | 217M | 293M |
| Reported | Mar 26, 2021 | Mar 25, 2022 | Mar 25, 2022 | Mar 24, 2023 | Jun 5, 2025 | Jun 5, 2025 | Mar 31, 2026 |
Sign up to see institutional holdings
Sign UpPodcast Mentions
Sign up to see podcast mentions and sentiment
Sign UpResults, director/PDMR dealings and voting-rights totals announced to the FCA's National Storage Mechanism, newest first. The link opens the announcement on the NSM. Press releases from the company's own website, newest first.
Director/PDMR Shareholding
Bull 0
Bear 0
Routine
Stopping failures before they begin
Bull 2
Bear 0
Product/operations

Published
12.10.2026
Share
Keep up to date with all the latest from IMI. Sign up for occasional news, updates, and the latest industry insights.
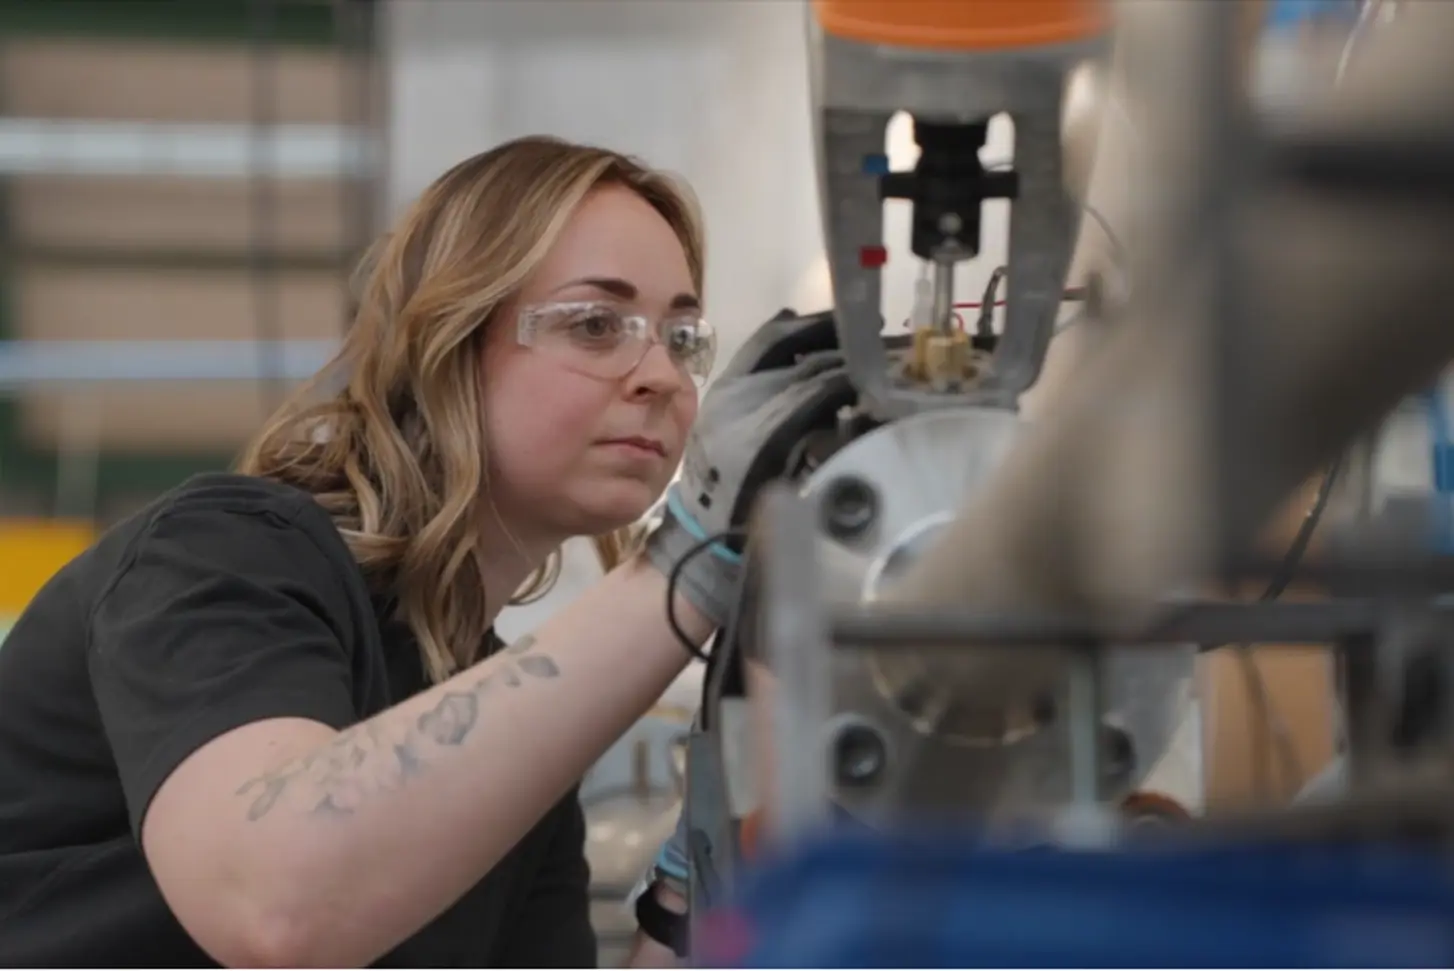
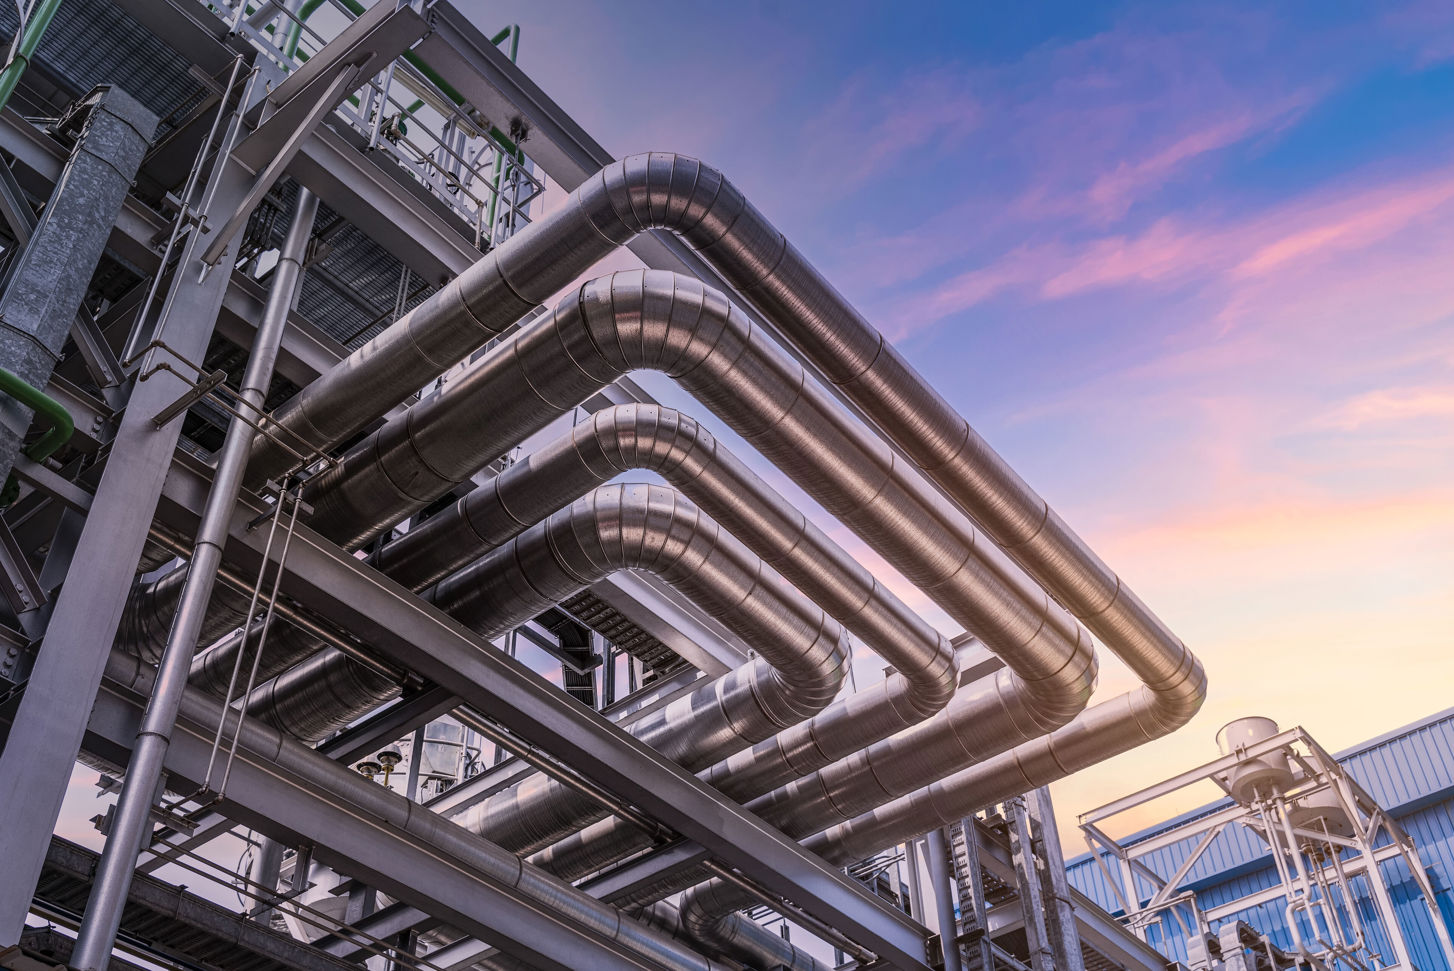
Across power plants, the constant stops and starts now needed to balance renewable energy place pipework under stresses that can crack it without warning.
Developed through the Growth Hub , IMI Insyt is a cloud-based service that combines continuous monitoring with IMI's engineering expertise to predict those failures and help prevent them before they happen.
The customer problem we solved
To support the rise of renewable energy, plants that were built to run steadily now start and stop every day, and that constant cycling places their pipework under stresses it was never designed to face.
Over months, the strain builds invisibly until, one day, a component cracks and the entire plant comes to a standstill. For the operator, the cost is considerable, the disruption greater still, and there are real safety implications for the people on site.
The deepest frustration is that the warning signs were present all along; they were simply impossible to interpret in time.
Customers were left managing failures after the event, when what they needed was to prevent them.
Why it's hard to solve
The reason these failures stay hidden is that their early signs appear in no single place - they are distributed across an entire system, embedded in the way a plant operates day to day. Reading them calls for two capabilities that rarely come together: advanced data analysis and decades of genuine engineering judgement.
Insyt combines both. Drawing on a plant's own operating history, it works out not merely that something will fail, but where and why - so the issue can be addressed during planned maintenance rather than in the middle of a crisis. In effect, it gives the customer a complete health check for their plant, and a clear, prioritised plan of action.
Why the solution is scalable
For customers, scalability means the same expert insight becomes available across every plant they run - not only their most critical site. Because Insyt works entirely from data the plant already produces, there is nothing to install and no disruption to operations, so an operator can extend it across an entire estate quickly and at low cost. That brings predictive protection to sites that could never justify a dedicated engineering team of their own.
The impact compounds across the portfolio: fewer unplanned shutdowns, safer operations, better-planned maintenance and more predictable budgets - wherever the customer operates.
A single, proven approach to protecting one plant becomes a way of protecting all of them.
For IMI, Insyt turns deep engineering expertise into a repeatable, digital service - a scalable, higher-value way to keep growing with customers long after the original equipment is installed.
Read more
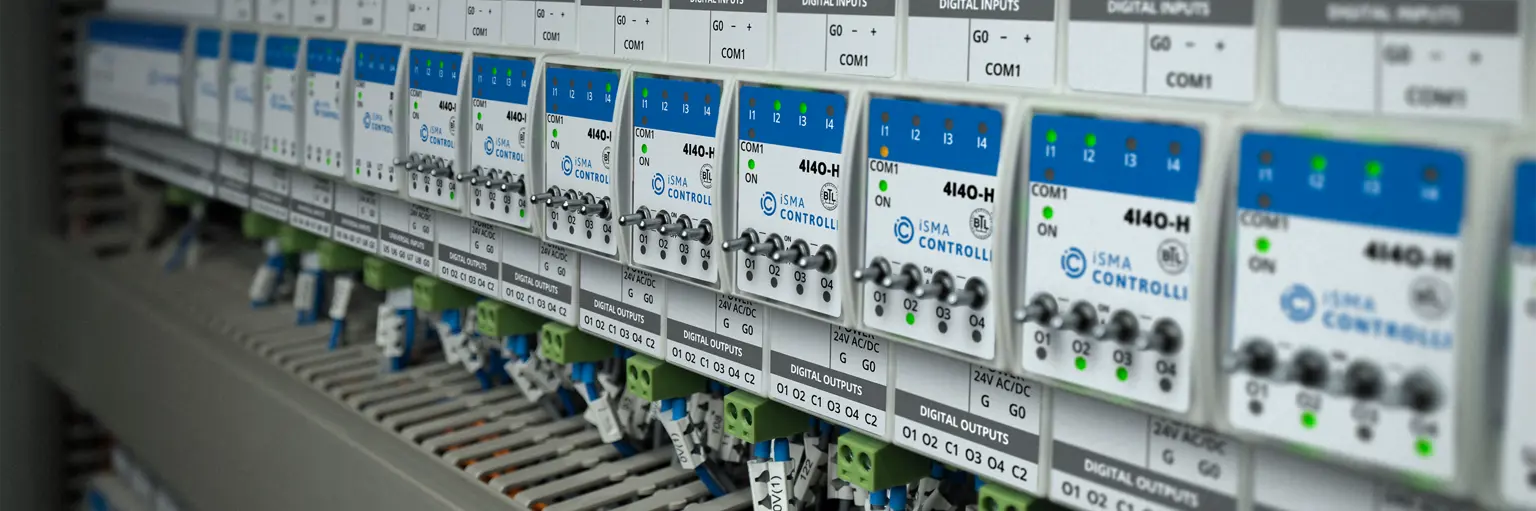
Enabling enhanced building intelligence, comfort and efficiency: TA-Smart
13.08.26 Innovation
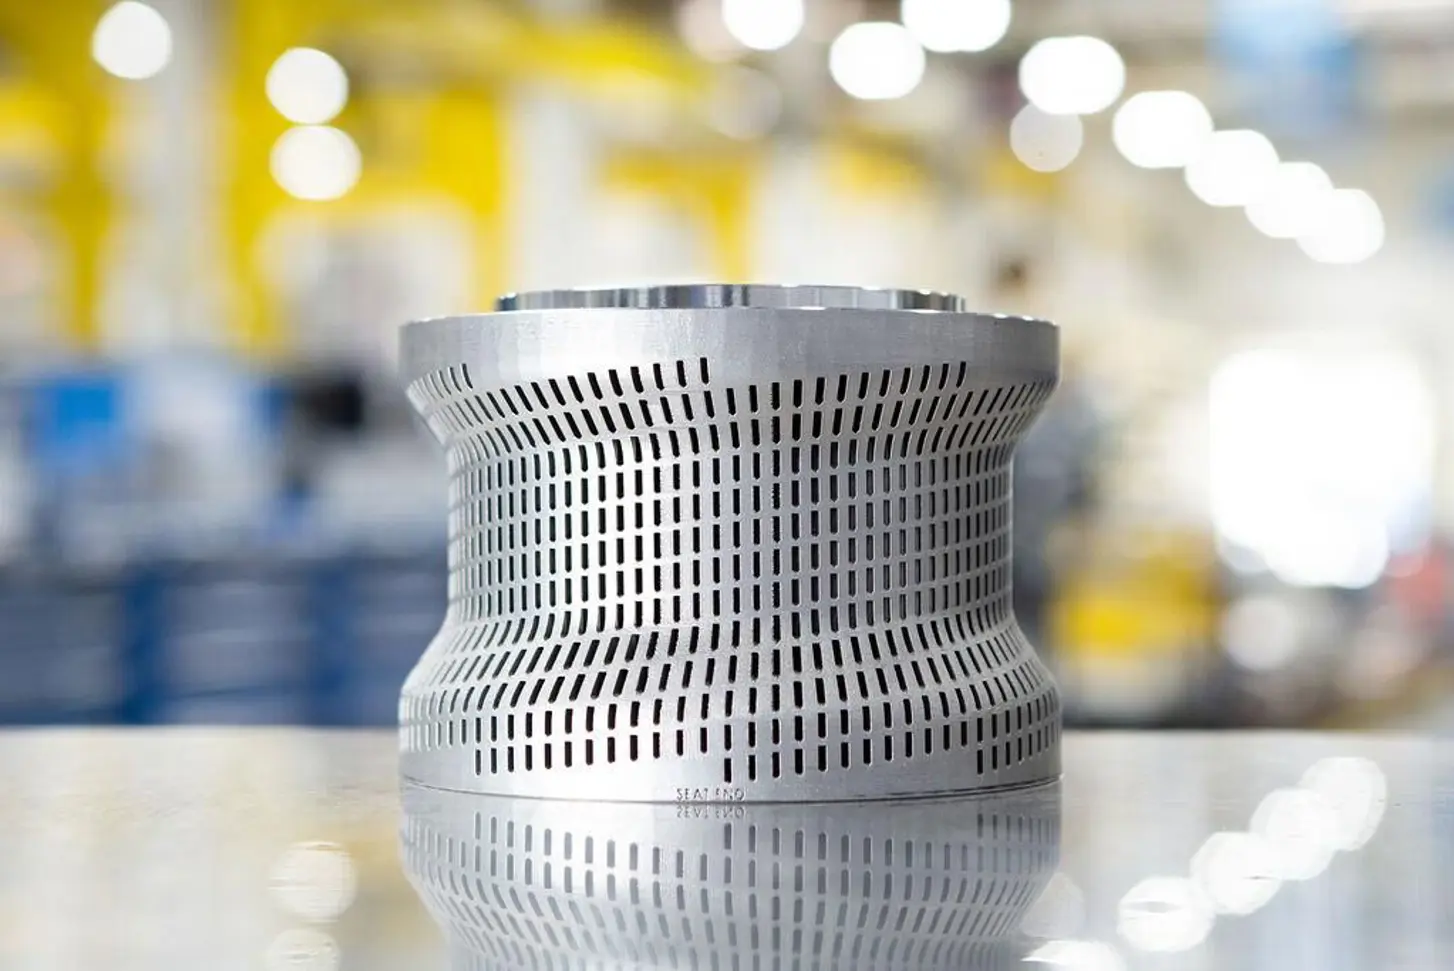
Improving power plant reliability and uptime: Retrofit 3D
28.07.26 Innovation

Innovation grounded in close customer partnerships
02.10.25 Innovation
Subscribe for news & insights
Get in touch
Policies
Copyright © IMI 2026. All rights reserved.
Designed & built by SampsonMay
Original on www.imiplc.com
Half Year Results 2026 31.07.2026 (PDF)
Trading update - Q1 2026 12.05.2026 (PDF)
Full-year Results 2025 06.03.2026 (PDF)
Annual Report 2025 31.03.2026 (PDF)
Factsheet (PDF)
Sustainability fast facts 31.03.2026 (PDF)
Health, Safety and Environment policy (PDF)
Code of Conduct 07.05.2025 (PDF)
GRI Index 12.05.2026 (PDF)
Modern slavery statement (PDF)

 Connecting... Please wait.





Prompts
Click prompts to add them under the company line, click again to take one out, then copy the result into your AI chat. Shared by Asian Century Stocks and Uncovered Thai Stocks. Thank you.
IMI plc (ticker IMI), listed in United Kingdom.
Copied
ETFs Holding IMI plc
Exchange-traded funds whose newest published daily portfolio holds one of the company's listings, largest weight first.
| ETF | Weight in ETF | Shares | Market value | As of |
|---|---|---|---|---|
| KNO | 1.50% | 17,256 | $ 678.846K | Jun 30, 2026 |
| DFIS | 0.16% | 231,542 | $ 9.011M | Nov 12, 2026 |
| SEIE | 0.15% | 43,924 | $ 1.728M | Jun 30, 2026 |
| DIHP | 0.12% | 203,615 | $ 7.924M | Nov 12, 2026 |
| DFSI | 0.11% | 34,696 | $ 1.35M | Nov 12, 2026 |
| DFIC | 0.09% | 357,745 | $ 13.923M | Nov 12, 2026 |
| DFAX | 0.08% | 262,123 | $ 10.201M | Nov 12, 2026 |
| AVDE | 0.06% | 287,670 | $ 10.902M | Nov 16, 2026 |
| DXIV | 0.05% | 2,801 | $ 109.01K | Nov 12, 2026 |
| DFAI | 0.04% | 205,931 | $ 8.014M | Nov 12, 2026 |
| AVSD | 0.04% | 4,179 | $ 158.373K | Nov 16, 2026 |