Director/PDMR Shareholding
Bull 0
Bear 0
Routine
HLMA
Fiscal year ends March
Quarters are offset from the calendar — Q1 is Apr–Jun
|
Halma plc is a global group of life-saving technology companies operating across three sectors: Safety, Environmental & Analysis, and Healthcare. The Safety sector includes technologies that protect people and infrastructure, such as fire detection and pipeline inspection. The Environmental & Analysis sector provides solutions for environmental monitoring, water analysis, and treatment. The Healthcare sector offers diagnostic and monitoring technologies, including blood pressure measurement devices. Halma serves customers in multiple countries, with major operations in the UK, Mainland Europe, the USA, and Asia Pacific. The group comprises nearly 50 companies, including Apollo, Minicam Group, and SunTech, which provide specialized products for commercial, industrial, and healthcare applications. Summarised from the company's own disclosures, fiscal year ended Mar 2026 |
Industry Conglomerates | Homepage halma.com |
| Sector Industrials | IR page halma.com/investors | |
|
Tags
fire detection, pipeline inspection, water analysis, blood pressure monitoring, environmental monitoring, safety technology, healthcare diagnostics, infrastructure safety, Apollo, Minicam Group, SunTech
|
Press page — |
Metrics
| Valuation | |
|---|---|
| Market cap | £ 14.401B |
| Market cap (USD) | $ 19.33B |
| P/E | 38.68 |
| PEG | 2.32 |
| P/BV | 6.64 |
| P/S | 5.58 |
| P/OCF | 29.96 |
| P/FCF | 33.83 |
| Dividend yield | 0.62% |
| Turnover / mcap | — |
| Returns | |
|---|---|
| ROE | 18.3% |
| ROI | 12.7% |
| ROIC | 13.6% |
| Profit margin | 14.4% |
| Growth | |
|---|---|
| Revenue growing | Yes |
| Profits growing | Yes |
| Revenue up 3y | Yes |
| Revenue up 5y | — |
| Earnings growth 3y (net profit CAGR) | 16.7% |
| Quality | |
|---|---|
| Profitable | Yes |
| Margin expanding | Yes |
| Buying back stock | No |
| Diluting (TTM) | No |
| Debt/Equity | 34.9% |
| Podcast bulls (TTM) | Sign up |
| Podcast bears (TTM) | Sign up |
| Podcast sentiment (TTM) | Sign up |
| Podcast sentiment % (TTM) | Sign up |
| News sentiment (TTM) | 0 |
| Quality score | 38.9% |
| Insiders | |
|---|---|
| Buys, 1w | Sign up |
| Buys, 1m | Sign up |
| Buys, 1y | Sign up |
| Sells, 1w | Sign up |
| Sells, 1m | Sign up |
| Sells, 1y | Sign up |
Sign up to see this company's insider trades
| Figure | FY 2026 | FY 2025 | FY 2024 | FY 2023 | FY 2022 | FY 2021 | FY 2020 | FY 2019 | FY 2018 | FY 2017 | FY 2016 | FY 2015 | FY 2014 | FY 2013 | FY 2012 | FY 2011 | FY 2010 |
|---|---|---|---|---|---|---|---|---|---|---|---|---|---|---|---|---|---|
| Revenue | 2.582B | 2.248B | 2.034B | 1.853B | — | — | — | 1.211B | 1.076B | 961.662M | 807.805M | 726.134M | 676.506M | 676.506M | — | — | — |
| Net profit | 372.3M | 296.4M | 268.8M | 234.3M | 244.2M | 203.3M | 184.4M | 169.8M | 154.228M | 129.689M | 108.841M | 104.001M | 106.327M | 106.327M | 48.8M | — | — |
| Free cash flow | 425.7M | 448.6M | 352.2M | 229M | 212.2M | 254.8M | — | — | — | — | — | — | — | — | — | — | — |
Filed figures
Lines the statements and their notes report beside the headline figures, read from the filings' XBRL as filed (no restatement applied), with figures computed from one filing's own lines. Cash-flow lines carry their cash direction: an outflow is negative. Each period links to its filing; a figure's period, report date and tag are in its tooltip.
| Figure | Mar 2020 | Mar 2021 | Mar 2022 | Mar 2023 | Mar 2024 | Mar 2025 | Mar 2026 |
|---|---|---|---|---|---|---|---|
| Balance sheet detail | |||||||
| Trade receivables (GBP) | — | 268M | 325M | 411M | 461M | 486M | 601M |
| ↳ YoY growth | +21.3% | +26.3% | +12.2% | +5.4% | +23.7% | ||
| ↳ 5y CAGR | +17.5% | ||||||
| Borrowings, current (GBP) | — | 3M | 72.5M | 1M | 300,000 | 35.6M | 48.9M |
| Borrowings, non-current (GBP) | — | 322M | 288M | 677M | 712M | 704M | 757M |
| Lease liabilities (GBP) | — | 65M | 72.1M | 87.9M | 83.7M | 110M | 108M |
| Cash and deposits (GBP) | 105M | 131M | 157M | 169M | 142M | 313M | 143M |
| Intangible assets (GBP) | — | 290M | 325M | 472M | 569M | 576M | 745M |
| Net debt (borrowings + leases - cash) (GBP) | — | 259M | 276M | 598M | 654M | 536M | 770M |
| Cash flow detail | |||||||
| Operating cash flow (GBP) | — | 278M | 237M | 258M | 385M | 492M | 481M |
| Purchases of property, plant and equipment (GBP) | — | -22.8M | -25.2M | -29M | -32.8M | -43.8M | -54.9M |
| Dividends paid (cash effect) (GBP) | — | -63.7M | -68.7M | -73.3M | -78.2M | -83.8M | -89.7M |
| Share buybacks (cash effect) (GBP) | — | -16.2M | -19.3M | -22.3M | -21.1M | -7.9M | -33.5M |
| Interest paid (cash effect) (GBP) | — | -10M | -8.2M | -17.5M | -29.6M | -28.9M | -32.6M |
| Free cash flow (OCF - PPE - intangibles) (GBP) | — | 255M | 212M | 229M | 352M | 449M | 426M |
| Income detail | |||||||
| Total comprehensive income (GBP) | — | 104M | 317M | 279M | 221M | 232M | 365M |
| Comprehensive income to owners (GBP) | — | 104M | 318M | 279M | 221M | 232M | 365M |
| Reported | Jun 23, 2022 | Jun 23, 2022 | Jun 23, 2022 | Jun 22, 2023 | Jun 24, 2024 | Jun 20, 2025 | Jun 24, 2026 |
Sign up to see institutional holdings
Sign UpPodcast Mentions
Sign up to see podcast mentions and sentiment
Sign UpResults, director/PDMR dealings and voting-rights totals announced to the FCA's National Storage Mechanism, newest first. The link opens the announcement on the NSM. Press releases from the company's own website, newest first.
Trading Update
Bull 4
Bear 0
Guidance
24 September 2026
Halma, the global group of life-saving technology companies focused on growing a safer, cleaner, healthier future for everyone, every day, today releases its scheduled trading update ahead of its half year end on 30 September 2026.
Strong progress in the first half; full year Adjusted1 EBIT margin2 guidance increased
We have made strong progress in the first half of this financial year, delivering broad-based growth against a backdrop of continued economic, geopolitical and market uncertainty. Our performance reflects the strength of our Sustainable Growth Model, including decades of disciplined choices around the markets we operate in, the companies we acquire and the leaders we trust to run them. It also reflects the autonomy our model gives our talented teams to respond with agility to changes in their markets. Our approach enables us to invest with confidence and to actively manage our portfolio, delivering compounding growth and returns over the long term.
Based on our progress in the year to date and our current expectations for the remainder of the year, we continue to expect low double-digit percentage organic3 constant currency revenue growth for the year as a whole. This guidance includes premium4 growth of approximately five percentage points from our photonics business, implying an organic3 constant currency photonics growth rate of approximately 30%. Adjusted1 EBIT margin2 in the 2027 full year is now expected to be in the range of 23.5% to 24%. This compares to our previous guidance for margin to be in line with the 2026 financial year at around 22.7%5, with the increase reflecting continued good operational delivery and favourable product and portfolio mix across all three sectors, including the positive impact of recent acquisitions and disposals.
This guidance is supported by order intake which remains ahead of both revenue in the year to date and the comparable period last year.
The recent appreciation of Sterling against the US Dollar and Euro, if maintained, is expected to result in a negative currency translation effect on the Group's results6.
Record investment in acquisitions; healthy acquisition pipeline
Our cash generation and robust financial position support continued investment in future growth, both organically and through acquisitions. We have maintained strong M&A momentum, completing six acquisitions in the year to date, investing a record £515m (on a cash- and debt-free maximum total consideration basis7). We continue to have a healthy acquisition pipeline across all three sectors.
We also continue to actively manage our portfolio of global businesses to ensure capital is allocated towards those opportunities with the greatest potential to deliver sustainable growth and returns, while remaining aligned with our purpose of growing a safer, cleaner, healthier future for everyone, every day. Reflecting this disciplined approach, we have completed three disposals in the period, realising approximately £83m, net of disposal costs8.
Half Year Results
The Group’s results for the half year ending 30 September 2026 will be released on 19 November 2026.
For further information, please contact:
**Halma plc
**Marc Ronchetti, Group Chief Executive +44 (0)1494 721 111
Carole Cran, Chief Financial Officer
Melanie Horton, Co-Head of Investor Relations +44 (0) 7554 013 396
Charles King, Co-Head of Investor Relations +44 (0) 7776 685 948
**MHP
**Oliver Hughes / Rachel Farrington / Ollie Hoare +44 (0)7801 894 577 / +44 (0)7817 458 804 / [email protected]
Notes:
1. Adjusted to remove the amortisation and impairment of acquired intangible assets; acquisition items; significant restructuring costs; profit or loss on disposal of operations, and impairment of associates.
2. Adjusted1 EBIT margin is defined as Adjusted1 Earnings before Interest and Taxation from continuing operations expressed as a percentage of revenue from continuing operations.
3. Organic measures exclude the effect of movements in foreign exchange rates on the translation of revenue and Adjusted1 Profit into Sterling, as well as acquisitions in the year following completion and disposals.
4. The photonics premium is determined as the incremental contribution to Group organic3 revenue growth from the photonics business in excess of the Group’s long-term organic3 revenue growth rate of 7%. It captures the portion of Group organic3 revenue growth, expressed in percentage points, that would not have occurred had photonics grown at the Group’s long-term organic3 revenue growth rate.
5. On 15 May 2025, Nuvonic, an Environmental & Analysis Sector company, granted FluidSmile Fluid Tech Ltd (FluidSmile), a longstanding partner in China, an exclusive trademark licence and related manufacturing and distribution rights to sell certain Nuvonic products in China and other agreed southeastern Asian markets, for RMB95m (£9.9m). Nuvonic also acquired a 35% associate interest in FluidSmile for RMB95m on the same date. As a result of these transactions, one-off revenue of £9.9m and Adjusted1 profit of £9.3m were recognised in financial year 2026, which constituted a 30bps increment to Adjusted1 EBIT margin2.
6. Sterling has strengthened in the year relative to the US Dollar and Euro and the currency translation impact on the Group's results for the financial year ended 31 March 2027 is expected to be negative. Based on current exchange rates of Sterling/US Dollar 1:1.35 and Sterling/Euro 1:1.17, we would expect approximately an £8m negative revenue effect and approximately a £2m negative profit effect in the 2027 financial year, compared to the 2026 financial year.
7. Of the six acquisitions made in the year to date, DCR Inspection Systems Ltd and Surgistar Inc were reported in the Group’s 2026 full year results announcement and disclosed in note 32 to our Annual Report and Accounts 2026. Since that time, we have made four further acquisitions (considerations given are all on a cash- and debt-free maximum total consideration basis):
-
itemedical, a provider of digital platforms that integrates patient data in real time from different devices in hospitals, supporting clinical decision-making and workflow efficiency, acquired in June 2026 for €23m (approximately £20m), as a bolt on for SSG;
-
Näslund Medical, a company specialising in fiducial marker technology used to support targeted cancer treatment, acquired in June 2026 for $45m (approximately £34m), as a bolt on for IZI Medical;
-
Dreampath Diagnostics, a provider of automated systems that enable anatomical pathology laboratories to safely and efficiently track, store and manage patient tissue samples, acquired in July 2026 for €279m (approximately £238m); and
-
Pyxis, a specialist provider of water quality monitoring and analysis technology, acquired in September 2026 for $200m (approximately £148m). Following the announcement on 2 September 2026, the acquisition of all three Pyxis companies has completed.
8. Of the three disposals made in the year to date, Labsphere and Cardios were reported in the Group’s 2026 full year results announcement and disclosed in note 32 to our Annual Report and Accounts 2026. In August 2026, we made one further disposal, of NovaBone, for $56m (approximately £42m), net of disposal costs. We currently expect no material gain or loss to be recognised on this disposal.
9. This Trading update is based upon unaudited management accounts information. Forward-looking statements have been made by the Directors in good faith using information available up until the date that they approved this statement. Forward-looking statements should be regarded with caution because of the inherent uncertainties in economic trends and business risks.
10. A copy of this announcement, together with other information about Halma, may be viewed on our website www.halma.com
.
Back
BackCareers
Media Gallery
Home | News and stories | Media Gallery
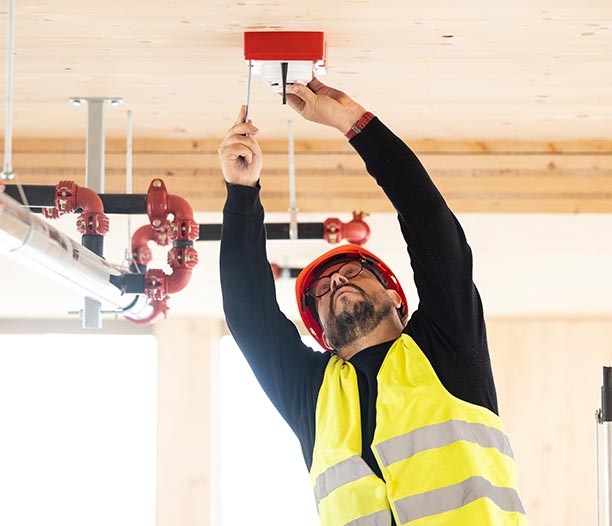
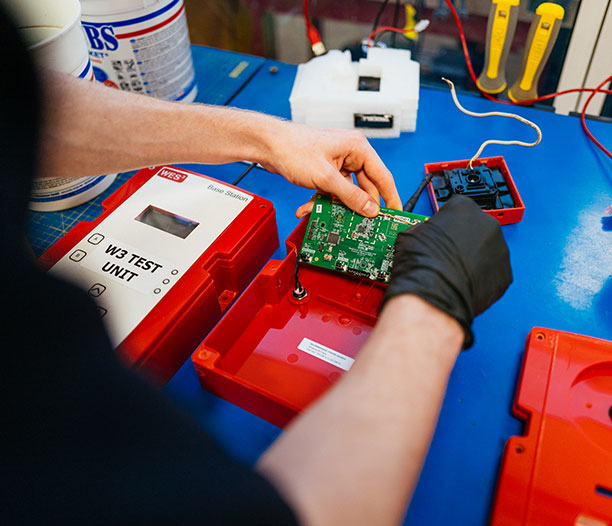
Find a selection of images from across our companies, ranging from Safety to Environmental & Analysis and Healthcare.
Media Gallery
In this section
-
Media Gallery
Filter
-
Safety
-
Environmental & Analysis
-
Healthcare
-
Leadership
Safety

Safety

Safety

Safety
Safety

Prompts
Click prompts to add them under the company line, click again to take one out, then copy the result into your AI chat. Shared by Asian Century Stocks and Uncovered Thai Stocks. Thank you.
Halma plc (ticker HLMA), listed in United Kingdom.
Copied
ETFs Holding Halma plc
Exchange-traded funds whose newest published daily portfolio holds one of the company's listings, largest weight first.
| ETF | Weight in ETF | Shares | Market value | As of |
|---|---|---|---|---|
| BKCI | 2.96% | 81,634 | $ 3.884M | Jul 31, 2026 |
| VNIE | 2.49% | 4,429 | $ 231.255K | Jun 30, 2026 |
| ESIM | 1.88% | 7,127 | $ 338.568K | Jul 31, 2026 |
| MTRA | 1.03% | 30,005 | $ 1.431M | Jul 31, 2026 |
| FFDI | 0.95% | 3,880 | $ 184.593K | Jul 31, 2026 |
| CGIE | 0.91% | 480,754 | $ 22.127M | Nov 16, 2026 |
| IGGY | 0.91% | 825 | $ 40.625K | Aug 31, 2026 |
| SROI | 0.46% | 1,824 | $ 86.778K | Jul 31, 2026 |
| DWMF | 0.38% | 2,468 | $ 128.864K | Jun 30, 2026 |
| SEIE | 0.33% | 72,997 | $ 3.811M | Jun 30, 2026 |
| NBIE | 0.30% | 15,426 | $ 750.112K | Aug 31, 2026 |
| FFGX | 0.29% | 3,280 | $ 156.048K | Jul 31, 2026 |
| QUIZ | 0.23% | 4,266 | $ 209.936K | Aug 31, 2026 |
| IVSI | 0.17% | 257 | $ 13.411K | Jun 30, 2026 |
| JSTC | 0.12% | 7,626 | $ 351.129K | Nov 17, 2026 |
| NTSI | 0.12% | 11,373 | $ 593.83K | Jun 30, 2026 |
| IQSZ | 0.11% | 3,991 | $ 190.396K | Jul 31, 2026 |
| FENI | 0.09% | 184,145 | $ 9.609M | Jun 30, 2026 |
| DFSI | 0.08% | 20,364 | $ 947.263K | Nov 12, 2026 |
| TIER | 0.08% | 582 | $ 27.806K | Jul 31, 2026 |
| UPAR | 0.06% | 746 | $ 34.349K | Nov 17, 2026 |
| DFAI | 0.05% | 199,702 | $ 9.289M | Nov 12, 2026 |
| RPAR | 0.04% | 4,813 | $ 221.608K | Nov 17, 2026 |
| DFIC | 0.04% | 121,761 | $ 5.664M | Nov 12, 2026 |
| AVDE | 0.03% | 141,537 | $ 6.458M | Nov 16, 2026 |
| DFAX | 0.03% | 74,254 | $ 3.454M | Nov 12, 2026 |
| AVSD | 0.00% | 224 | $ 10.221K | Nov 16, 2026 |