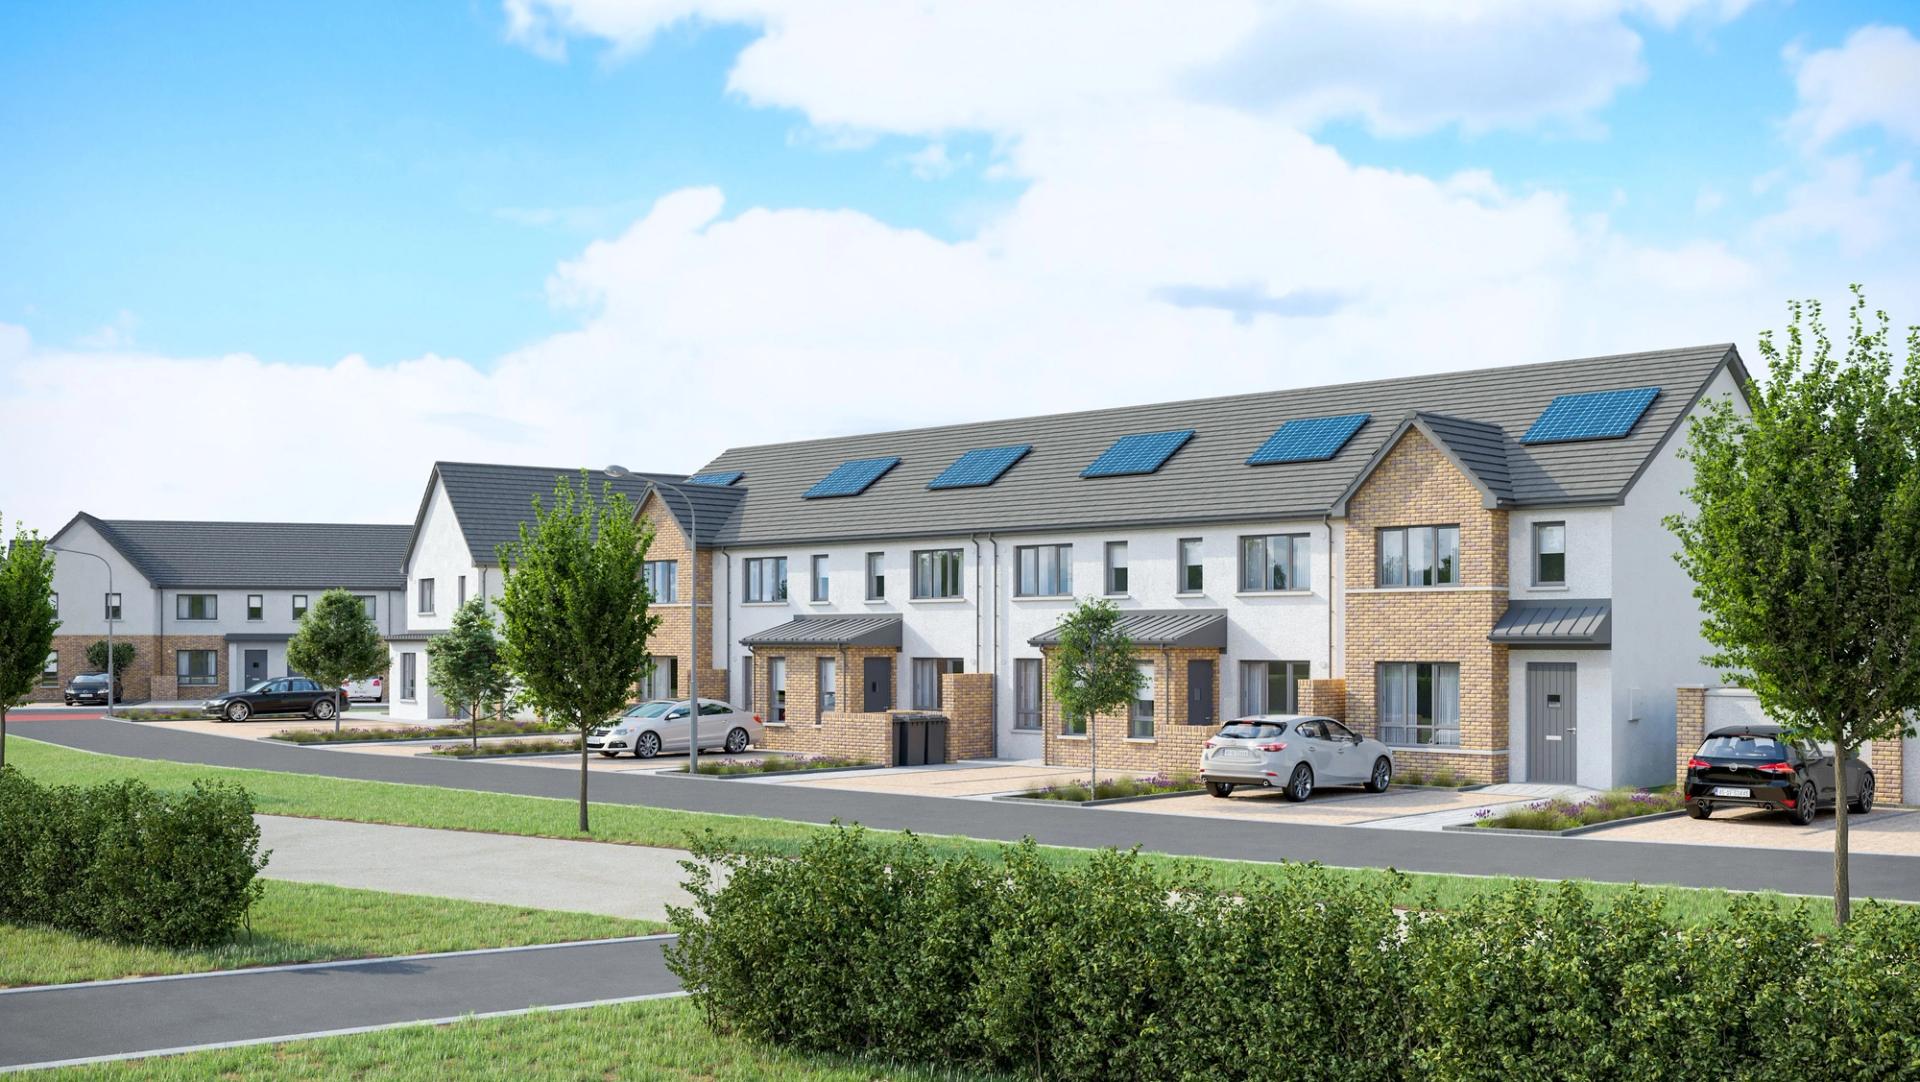
Ireland must move urgently on Modern Methods of Construction (MMC), zoning, and the National Development Plan if it is to improve the scalable delivery of homes, according to a comprehensive new report by Ireland’s leading homebuilder. The…
Ireland must move urgently on Modern Methods of Construction (MMC), zoning, and the National Development Plan if it is to improve the scalable delivery of homes, according to a comprehensive new report by Ireland’s leading homebuilder.
The inaugural Glenveagh Homebuilding Horizons Report
is a wide-ranging analysis combining, for the first time, comprehensive Irish/EU benchmarking housing research, Glenveagh’s own data, and representative public polling on housing. The benchmarking research shows that Ireland is building new homes at a faster rate than any other EU country.
The report features an overall assessment of the homebuilding sector and sets out the policy actions Glenveagh believes can support greater housing delivery over the coming decade.
Its central finding is that few of Ireland's housing challenges require significant new policy: the foundations for scalable delivery are in place, the direction of travel is right, and the focus now needs to shift to consistent implementation.
In total, Glenveagh has proposed 40 practical recommendations that will support existing policy and the various stages of the homebuilding process.
The report identifies three immediate housing priorities:
Remove the barriers to Modern Methods of Construction (MMC). MMC is an innovative form of construction whereby more of the house or apartment is manufactured offsite and then assembled on site. It can create homes that are quicker to build, more sustainable, and of a higher quality, thanks to digital design methods and precision engineering. It reduces the reliance on favourable weather conditions associated with traditional methods of homebuilding, while also opening up exciting new career and job opportunities in the industry. MMC is crucial to increasing supply, improving consistency of delivery and output, and curbing costs. However, the current regulatory structure is holding progress back. Certificates from bodies with European Accreditation should be accepted by Irish building control authorities where they meet all relevant standards, removing the need for separate domestic re-accreditation.
Maximise zoned land and accelerate ten-year plans. A consistent national approach to zoning, with clear accountability, is needed. The Cabinet Committee on Housing should engage regularly with local authorities and the Office of the Planning Regulator to ensure the next round of development plan variations is adequate and new ten-year plans are put in place as soon as practicable.
Fully fund National Development Plan housing commitments. Investment and reform must go hand in hand. State investment gives the private sector certainty and acts as a multiplier. Budget 2027 should maintain NDP housing commitments in full while reforming key schemes – including the Cost Rental Equity Loan, the Capital Advance Leasing Facility, and infrastructure investment – to ensure financial sustainability and maximise the homes delivered for every euro invested.
The report argues that inconsistent implementation across numerous stages of the homebuilding process, including zoning, planning, and the interpretation of regulations, is a core barrier to delivery, creating uncertainty and delays that add cost to projects and affect viability and affordability.
Inaugural Irish/EU benchmarking housing research
The first ever comprehensive Ireland/EU wide benchmarking research commissioned from Goodbody for the report shows Ireland will complete 7.2 new homes per 1,000 people this year – the fastest rate in the EU and more than double the EU average of three.
To support this, the government spent 2.3% of Gross National Income (the total amount earned by Irish people and businesses both domestically and internationally) on housing in 2024. This performance follows a decade of rapid population growth, with Ireland's population up 16% since 2015 compared with a European average of 2%.
Glenveagh founder and CEO, Stephen Garvey, commented: “It’s well acknowledged that due to economic prosperity alongside significant population growth we have a major housing challenge for the coming decade, but we are closer to resolving it than many might believe.
Much of the analysis of the Irish homebuilding sector is political or academic. We work at the very centre of the process - from acquiring land and securing planning, through to delivering homes across all tenures. We deal with our customers every day and understand what they need. We believe it is useful for the practical experience of companies like ours to be heard in a debate that is critical to Ireland's future competitiveness.
“We have to factor in the uncertainty that is on the horizon. Trade wars, geo-political turmoil, and energy shocks are current and pressing issues. Trends like climate change sit alongside a forthcoming demographic crunch. Ireland’s strong economic performance is funding strategic investments and the reforms required to address structural challenges. This ‘Goldilocks moment’ of national economic prosperity cannot be wasted when it comes to the necessary infrastructure and housing. We have an opportunity to deliver more homes - and ones that are more affordable and cost effective for the people who will live in them.”
Representative public polling
The report also includes new public polling carried out by research company Red C. Selected key findings include:
- Just 16% agree that Ireland is making real progress on housing
- 81% support zoning more land locally if it leads to more homes
- 48% cite house prices as the single biggest barrier to ownership
- Awareness of state supports is low: while 61% recognise Help to Buy, awareness of every other scheme sits below 50%, and 18% are not aware of any scheme at all.
David Caffrey, Head of Planning and Policy at Glenveagh, said: “These findings show that the record housing output is not yet being felt by the public – but the support is there for the solutions already available to us. We must continue to capitalise on the momentum created thus far by embedding certainty and consistency in the homebuilding process where we can. The 40 recommendations in this report are designed to do exactly that: no new major policy shifts, just delivering relentlessly on what's already been committed to.”
Independent research reports - detailed polling by Red C and the first ever comprehensive European comparative benchmarking by Goodbody - are also published alongside the report. To download a copy of the Glenveagh Homebuilding Horizons Report 2026, visit www.glenveagh.ie/corporate
.
Related news

8 October 2026
Glenveagh and Maynooth University strengthen industry engage…

6 October 2026
Budget 2027 provides continued certainty the homebuilding se…

28 September 2026
- Corporate
- Embracing Communities
Little hands, lasting change: Nature Hero Awards invite scho…
Get in touch
© 2026 Glenveagh Properties plc. All rights reserved.



 Sign in