posted:05/08/2026 2026 Half-Year Report Share Share Baar, Switzerland 5 August 2026 Highlights Glencore’s Chief Executive Officer, Gary Nagle, commented: “We delivered another strong operational and financial performance for the first half of the…
posted:05/08/2026
2026 Half-Year Report
Share
Share
Baar, Switzerland
5 August 2026
Highlights
Glencore’s Chief Executive Officer, Gary Nagle, commented:
“We delivered another strong operational and financial performance for the first half of the year. Our assets performed in line with market guidance, which alongside substantially higher period-over-period average prices for our core commodities and a favourable marketing backdrop, underpinned a material increase in earnings.
“H1 2026 was characterised by the significant repricing of energy and closely related markets and risks, following escalation of the Middle East (ME) conflict. What began the year as a relatively well-supplied energy complex, quickly shifted towards a focus on security of supply and access to physical commodities. Constraints across oil, refined products, LNG and freight capacity, drove heightened volatility across global energy and other markets.
“Against this backdrop, Group Adjusted EBITDA increased 86% to $10.1 billion, while Net income attributable to equity holders increased by more than $5 billion period on period to $4.4 billion.
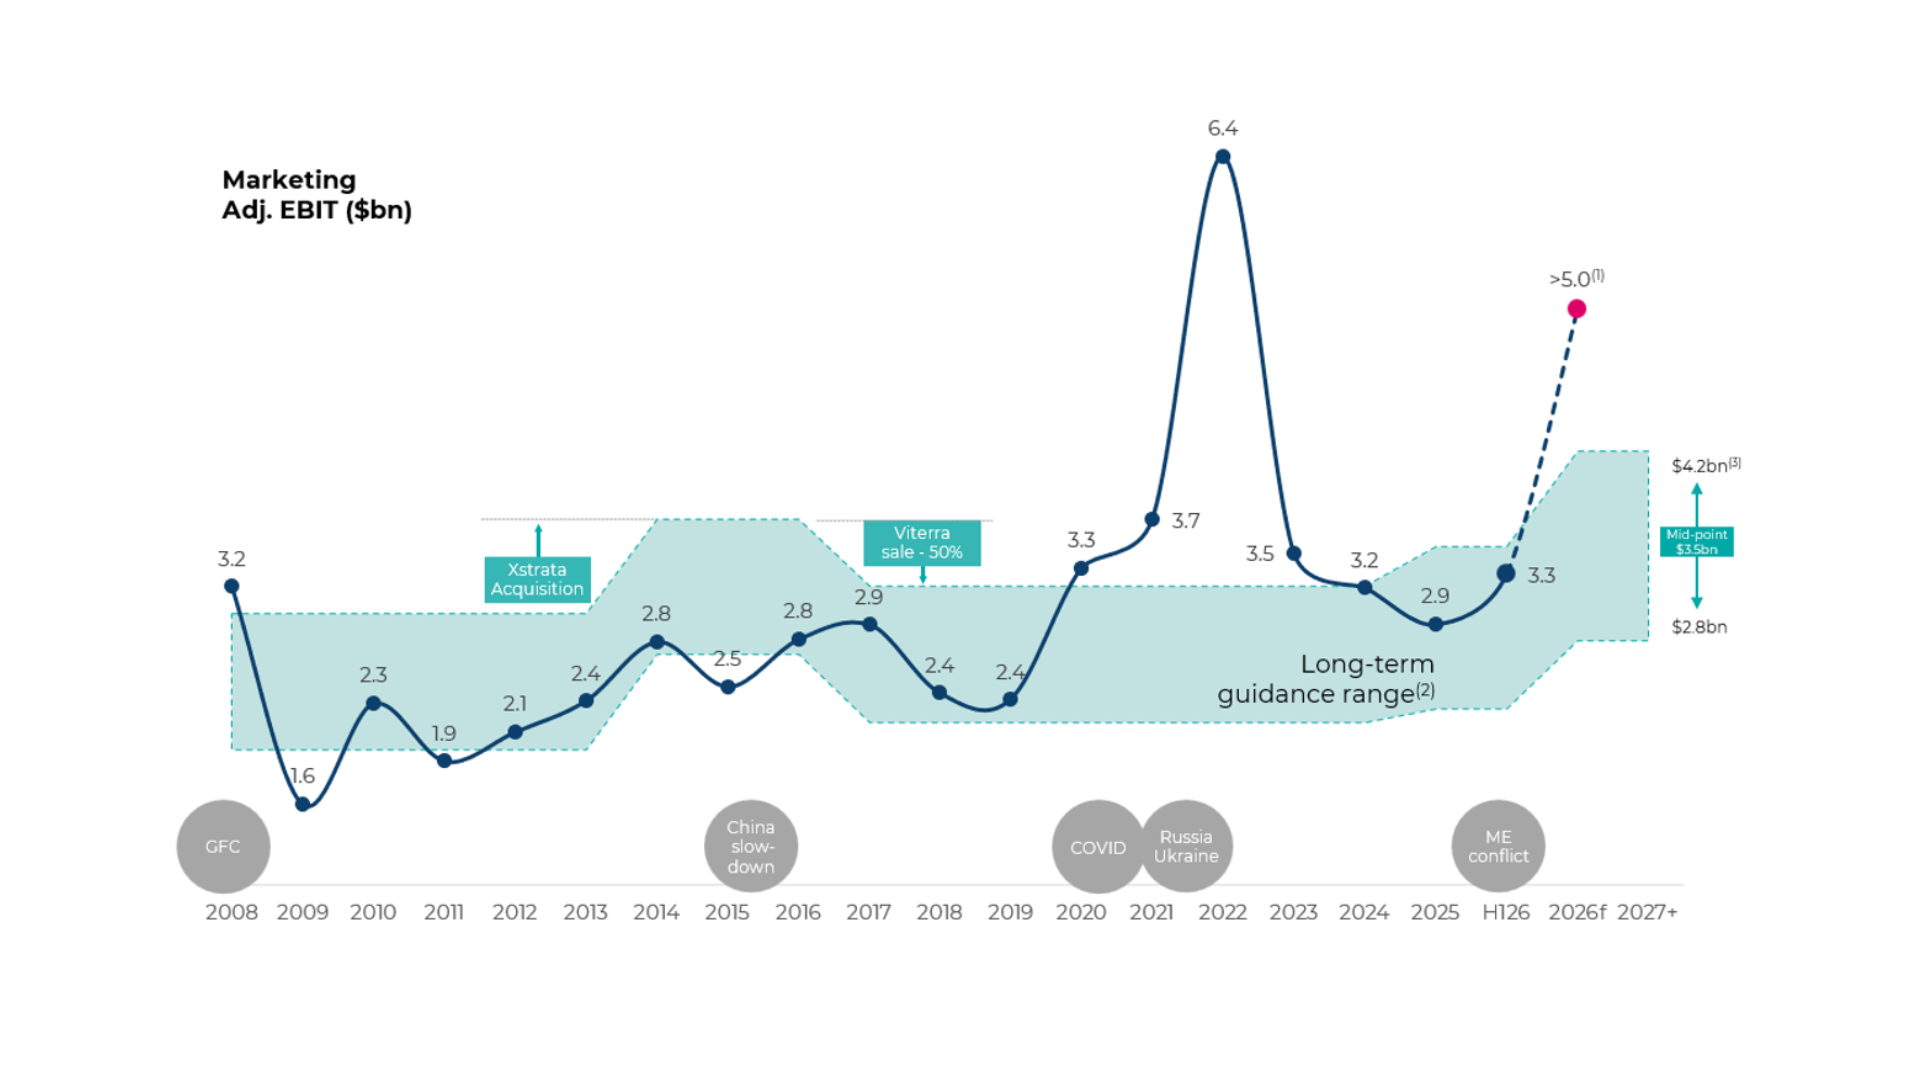
“Marketing Adjusted EBIT was $3.3 billion, up 142% compared with the prior period, demonstrating the resilience and responsiveness of the business amid heightened geopolitical uncertainty and market volatility. This environment continues to highlight the value of the Group's marketing, logistics and risk management capabilities, enabling us to efficiently source, transport and deliver essential energy and metals products to customers around the world.
“The Industrial segment contributed Adjusted EBITDA of $6.5 billion, up 72% compared with the prior period, reflecting the significantly stronger commodity price environment and solid operational performance across the portfolio. These benefits were partially offset by a generally weaker US dollar and higher operating costs, exacerbated by the ME conflict supply-chain disruptions, materially impacting the availability and pricing of key inputs and consumables (e.g. diesel, sulphur and sulphuric acid) beyond normal inflationary considerations.
“After making our regular proforma adjustments, Net debt, having declined by $1.0 billion during the period, is in line with our ordinary course of business net debt cap c.$10 billion. Consistent with prior practice, recognising our Bunge shares as surplus capital, we announce today a top-up special cash distribution of $8.5c/per share (c.$1 billion), alongside a new $500 million share buyback to be completed by February 2027. This brings total 2026 announced shareholder returns to c.$3.5 billion.
“In terms of asset development, we remain well positioned to reach copper production volumes of c.1 million tonnes annualised by the end of 2028 and our c.1.6 million target by 2035. We are making good progress across the various projects presented at our December 2025 Capital Markets Day. Some, including the Alumbrera restart, are running ahead of schedule, with its first production now expected in H2 2027 compared to original guidance of H1 2028.
“We are also announcing today that, following a detailed review of opportunities to broaden our investor base and enhance trading liquidity, we intend to apply for a secondary listing on the ASX, targeting admission in October 2026.
“An ASX secondary listing (via CDIs) would provide a number of compelling strategic benefits, both on an absolute basis and relative to other global exchanges. Australia is home to one of the world's largest and fastest-growing pools of long-term investment capital, with A$4.4 trillion in pension assets expected to grow to approximately A$12.4 trillion by 2045. The market also offers access to a highly sophisticated investor base with deep expertise in the global resources sector.
“An Australian listing is also expected to strengthen our profile in one of our most important operating jurisdictions, broaden our shareholder base, improve trading liquidity and enhance corporate financial flexibility. For Australian investors, it would provide increased access to diversified copper exposure at a time when local investment opportunities have diminished following industry consolidation and M&A activity in recent years.”
| US$ million |
H1 2026 |
H1 2025 |
Change % |
2025 |
| Key statement of income and cash flows highlights1: |
|
|
|
|
| Revenue |
174,430 |
117,396 |
49 |
247,535 |
| Adjusted EBITDA◊ |
10,115 |
5,430 |
86 |
13,511 |
| Adjusted EBIT◊ |
6,651 |
1,801 |
269 |
5,978 |
| Income/(loss) for the period attributable to equity holders |
4,405 |
(655) |
n.m. |
363 |
| Earnings/(loss) per share (Basic) (US$) |
0.37 |
(0.05) |
n.m. |
0.03 |
| Funds from operations (FFO)2◊ |
8,129 |
3,147 |
158 |
8,714 |
| US$ million |
30.06.2026 |
31.12.2025 |
Change % |
| Key financial position highlights: |
|
|
|
| Total assets |
155,447 |
142,199 |
9 |
| Total equity |
36,812 |
33,606 |
10 |
| Net funding2,3◊ |
42,418 |
39,405 |
8 |
| Net debt2,3◊ |
10,194 |
11,171 |
(9) |
| Ratios: |
|
|
|
| Net debt to Adjusted EBITDA4◊ |
0.56 |
0.83 |
(33) |
1 Refer to basis of presentation on page 6.
2 Refer to page 10.
3 Includes $1,208 million (2025: $1,010 million) of Marketing-related lease liabilities.
4 H1 2026 ratio based on last 12 months’ Adjusted EBITDA, refer to the Alternative performance measures (APMs) section for reconciliation.
◊ Adjusted measures referred to as APMs are not defined or specified under the requirements of International Financial Reporting Standards; refer to the APMs section on page 69 for definitions and reconciliations and to note 3 of the condensed consolidated interim financial statements for reconciliation of Adjusted EBIT/EBITDA.
2026 HALF-YEAR FINANCIAL SCORECARD
- Industrial Adjusted EBITDA of $6.5 billion, up 72%, primarily reflecting higher commodity prices
- Marketing Adjusted EBIT of $3.3 billion, up 142%, a near record H1 result, owing to the materially disrupted energy, freight and other markets during the period
- $10.1 billion overall Group Adjusted EBITDA, up 86%
- Funds from operations (FFO) of $8.1 billion, up 158%, reflecting the higher Group Adjusted EBITDA noted above
- Net cash purchase and sale of PP&E: $4.0 billion compared to $3.2 billion in the prior period; substantial part of the increase comprises copper portfolio investments to secure land access to support growth and operational flexibility
- Net income attributable to equity holders, pre-significant items: $3.7 billion; Net income attributable to equity holders: $4.4 billion, reflecting gains on disposals of non-current assets, recognition of deferred tax assets and impairments
- Adjusted EBITDA mining margins were 52% for copper, 38% for steelmaking coal and 19% for energy coal
BALANCE SHEET
- Net debt of $10.2 billion, down $1.0 billion, after $4.0 billion of net capital expenditure, $1.9 billion of non-RMI net working capital and $1.1 billion of shareholder distributions. Net debt includes $1.2 billion of marketing lease liabilities
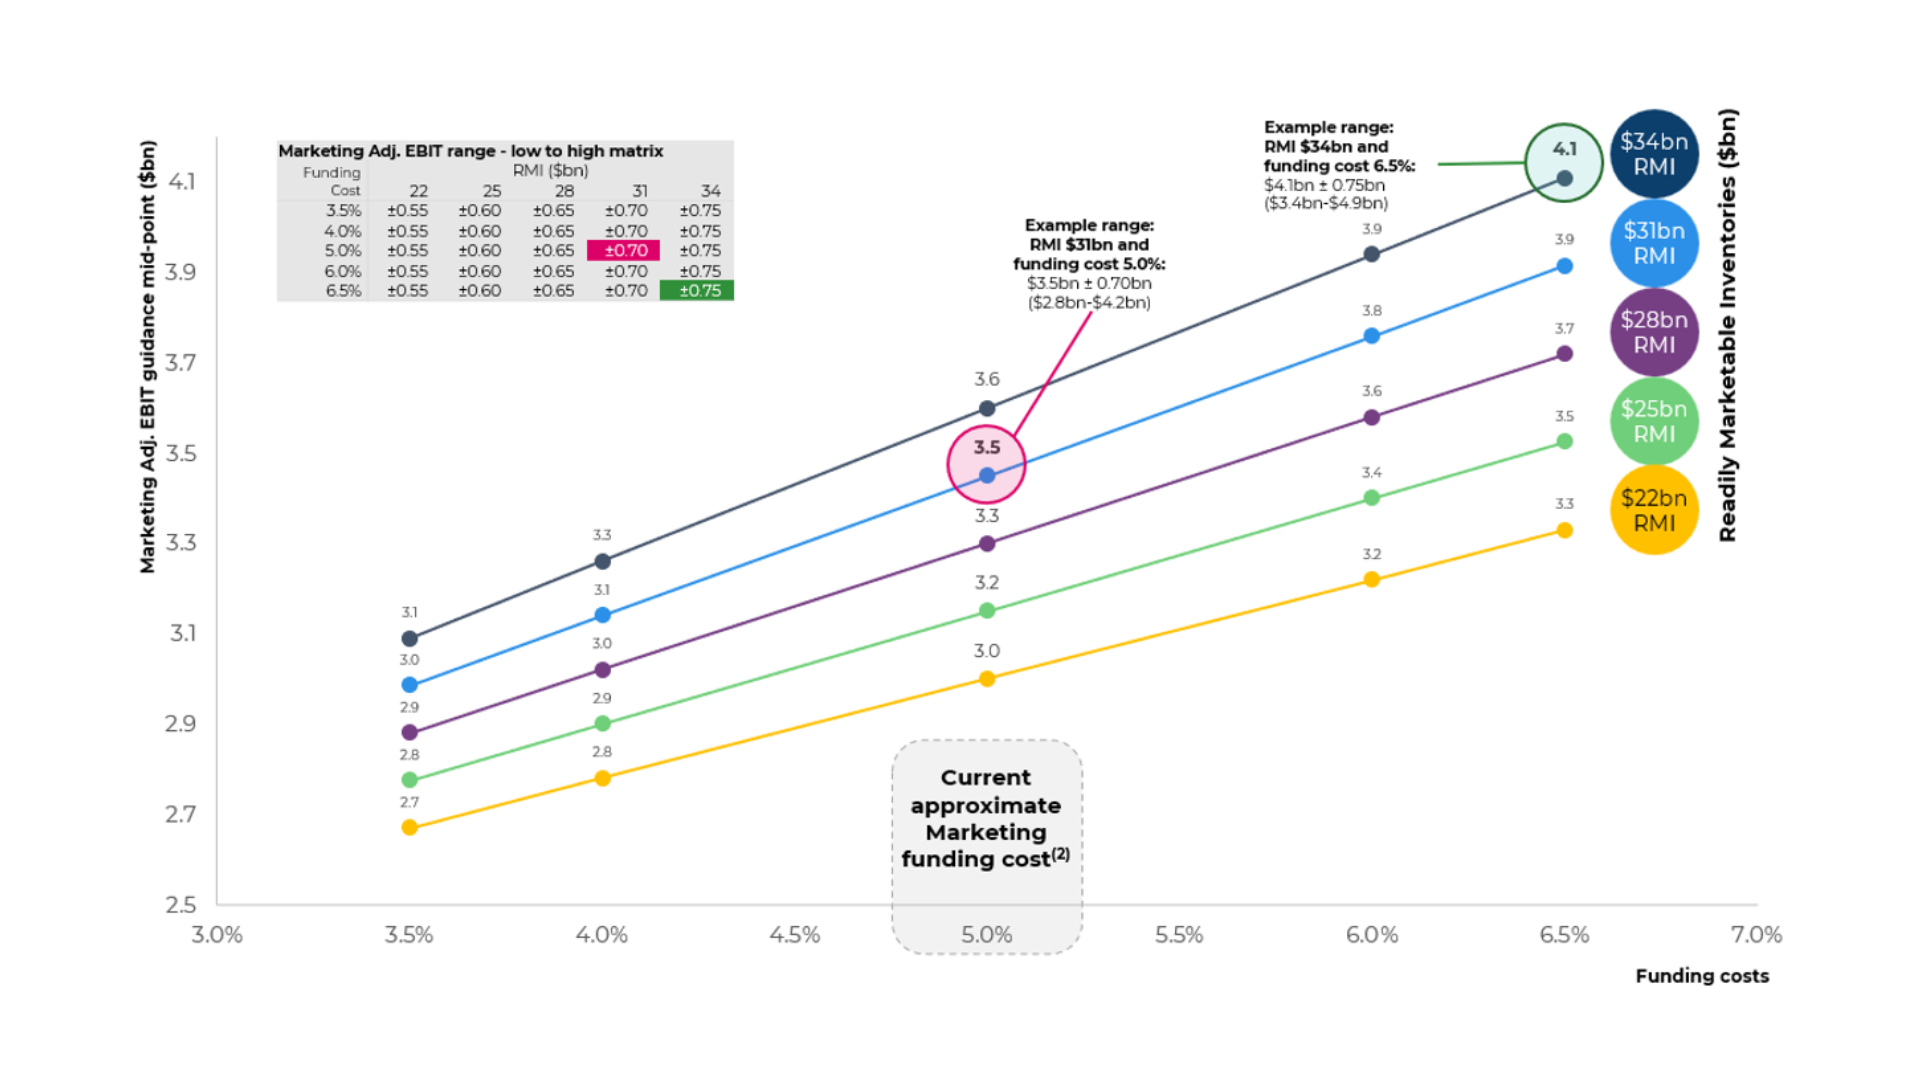
- Net funding, increased to $42.4 billion (vs $39.4 billion at the end of 2025), primarily reflecting the impact of higher energy and metals prices on our Readily Marketable Inventories held at period end
- Available committed liquidity of $14.0 billion; bond maturities maintained around a cap of no more than c.$3 billion in any given year
- Net debt/Adjusted EBITDA of 0.56x, down from 0.83x
- Additional shareholder returns of c.$1.5 billion announced today, comprising a $8.5c/share special cash distribution (c.$1.0 billion) and a $500 million buyback, lift full year 2026 returns to c.$3.5 billion
- Based on current commodity prices and an expected uplift in H2 volumes, particularly for steelmaking coal, we anticipate continued strong cash generation through the remainder of 2026. On this basis, and assuming no significant change, we have calculated a full year 2026 illustrative Adjusted EBITDA of c.$19.7 billion.
To view the full report please click here: https://www.glencore.com/.rest/api/v1/documents/static/98cf0f2a-ede7-4ced-9539-061198c3b6be/GLEN-2026-Half-Year-Report.pdf
To view the 2026 Half-Year Report Presentation please click here: https://www.glencore.com/.rest/api/v1/documents/static/a8dfc8ac-480f-46d8-bbf3-ede5686cba20/20260805+GLEN+2026+Half-Year+Results+Presentation.pdf
For further information please contact:
Investors
Martin Fewings
t: +41 41 709 2880
m: +41 79 737 5642
[email protected]
Media
Charles Watenphul
t: +41 41 709 2462
m: +41 79 904 3320
[email protected]
Glencore LEI: 2138002658CPO9NBH955
Please refer to the end of this document for disclaimers including on forward-looking statements.
Notes for Editors
Glencore is one of the world’s largest global diversified natural resource companies and a major producer and marketer of more than 60 commodities. Through a network of assets, customers and suppliers that spans the globe, we produce, process, recycle, source, market and distribute the commodities that advance everyday life.
With over 140,000 employees and contractors and a strong footprint in over 30 countries in both established and emerging regions for natural resources, our marketing and industrial activities are supported by a global network of offices.
Glencore’s customers are principally industrial consumers, such as those in the automotive, steel, power generation, battery manufacturing and oil sectors. We also provide financing, logistics and other services to producers and consumers of commodities.
Important notice
This document does not constitute or form part of any offer or invitation to sell or issue, or any solicitation of any offer to purchase or subscribe for any securities. This document does not purport to contain all of the information you may wish to consider.
Cautionary statement regarding forward-looking information
Certain descriptions in this document are oriented towards future events and therefore contain statements that are, or may be deemed to be, “forward-looking statements” which are prospective in nature. Such statements may include, without limitation, statements in respect of trends in commodity prices and currency exchange rates; demand for commodities; reserves and resources and production forecasts; expectations, plans, strategies and objectives of management; expectations regarding financial performance, results of operations and cash flows; climate scenarios; sustainability (including, without limitation, environmental, social and governance) performance-related goals, ambitions, targets, intentions and aspirations; approval of certain projects and consummation and impacts of certain transactions (including, without limitation, acquisitions, disposals or other corporate transactions); closures or divestments of certain assets, operations or facilities (including, without limitation, associated costs); capital costs and scheduling; operating costs and supply of materials and skilled employees; financings; permitting, anticipated project timelines, productive lives of mines and facilities; provisions and contingent liabilities; and tax, legal and regulatory developments.
These forward-looking statements may be identified by the use of forward-looking terminology, or the negative thereof including, without limitation, “outlook”, “guidance”, “trend”, “plans”, “expects”, “continues”, “assumes”, “is subject to”, “budget”, “scheduled”, “estimates”, “aims”, “forecasts”, “risks”, “intends”, “positioned”, “predicts”, “projects”, “anticipates”, “believes”, or variations of such words or comparable terminology and phrases or statements that certain actions, events or results “may”, “could”, “should”, “shall”, “would”, “might” or “will” be taken, occur or be achieved. The information in this document provides an insight into how we currently intend to direct the management of our businesses and assets and to deploy our capital to help us implement our strategy. The matters disclosed in this document are a ‘point in time’ disclosure only. Forward-looking statements are not based on historical facts, but rather on current predictions, expectations, beliefs, opinions, plans, objectives, goals, intentions and projections about future events, results of operations, prospects, financial conditions and discussions of strategy, and reflect judgments, assumptions, estimates and other information available as at the date of this document or the date of the corresponding planning or scenario analysis process.
By their nature, forward-looking statements involve known and unknown risks, uncertainties and other factors which may cause actual results, performance or achievements to differ materially from any future events, results, performance, achievements or other outcomes expressed or implied by such forward-looking statements. Important factors that could impact these uncertainties include, without limitation, those disclosed in the risk management section of our latest Annual Report and/or Half-Year Report, which can each be found on our website. These risks and uncertainties may materially affect the timing and feasibility of particular developments. Other factors which may impact risks and uncertainties include, without limitation: the ability to produce and transport products profitably; demand for our products and commodity prices; development, efficacy and adoption of new or competing technologies; changing or divergent preferences and expectations of our stakeholders; events giving rise to adverse reputational impacts; changes to the assumptions regarding the recoverable value of our tangible and intangible assets; inadequate estimates of resources and reserves; changes in environmental scenarios and related regulations, including, without limitation, transition risks and the evolution and development of the global transition to a low carbon economy; recovery rates and other operational capabilities; timing, quantum and nature of certain acquisitions and divestments; delays, overruns or other unexpected developments in connection with significant projects; the ability to successfully manage the planning and execution of closure, reclamation and rehabilitation of industrial sites and any related goals, such as those in connection with our no net loss methodology, where applicable; health, safety, environmental or social performance incidents; labour shortages or workforce disruptions; natural catastrophes or adverse geological conditions, including, without limitation, the physical risks associated with climate change; effects of global pandemics and outbreaks of infectious disease; the outcome of litigation or enforcement or regulatory proceedings; the effect of foreign currency exchange rates on market prices and operating costs; actions by governmental authorities, such as changes in taxation or laws or regulations or changes in the decarbonisation policies and plans of other countries; breaches of Glencore’s policy architecture and other internal requirements, applicable laws or regulations; the availability of sufficient credit and management of liquidity and counterparty risks; changes in economic and financial market conditions generally or in various countries or regions; political or geopolitical uncertainty; and wars, political or civil unrest, acts of terrorism, cyber attacks or sabotage.
Readers, including, without limitation, investors and prospective investors, should review and consider these risks and uncertainties (as well as the other risks identified in this document) when considering the information contained in this document. Readers should also note that the high degree of uncertainty around the nature, timing and magnitude of climate-related risks, and the uncertainty as to how the energy transition will evolve, makes it particularly difficult to determine all potential risks and opportunities and disclose these and any potential impacts with precision. Neither Glencore nor any of its affiliates, associates, employees, directors, officers or advisers, provides any representation, warranty, assurance or guarantee as to the accuracy, completeness or correctness, likelihood of achievement or reasonableness of any forward-looking information contained in this document or that the events, results, performance, achievements or other outcomes expressed or implied in any forward-looking statements in this document will actually occur. Glencore cautions readers against reliance on any forward-looking statements contained in this document, particularly in light of the long-term time horizon which this document discusses in certain instances and the inherent uncertainty in possible policy, market and technological developments in the future. Readers should also be mindful that certain information contained within this document is summary in nature and that the application of different internal methodologies and requirements across the Group may vary.
No statement in this document is intended as any kind of forecast (including, without limitation, a profit forecast or a profit estimate), guarantee or prediction of future events or performance and past performance cannot be relied on as a guide to future performance.
Except as required by applicable rules or laws or regulations, Glencore is not under any obligation, and Glencore and its affiliates expressly disclaim any intention, obligation or undertaking, to update or revise any forward-looking statements, whether as a result of new information, future events or otherwise. This document shall not, under any circumstances, create any implication that there has been no change in the business or affairs of Glencore since the date of this document or that the information contained herein is correct as at any time subsequent to its date.
Sources
Certain statistical and other information included in this document is sourced from publicly available third-party sources. This information has not been independently verified and presents the view of those third parties, and may not necessarily correspond to the views held by Glencore and Glencore expressly disclaims any responsibility for, or liability in respect of, and makes no representation or guarantee in relation to, such information (including, without limitation, as to its accuracy, completeness or whether it is current). Glencore cautions readers against reliance on any of the industry, market or other third-party data or information contained in this document.
Information preparation
In preparing this document, Glencore has made certain estimates and assumptions that may affect the information presented. Certain information is derived from management accounts, is unaudited and based on information Glencore has available to it at the time. Figures throughout this document are subject to rounding adjustments. The information presented is subject to change at any time without notice and we do not intend to update this information except as required.
This document contains alternative performance measures which reflect how Glencore's management assesses the performance of the Group, including results that exclude certain items included in our reported results. These alternative performance measures should be considered in addition to, and not as a substitute for, or as superior to, measures of financial performance or position reported in accordance with IFRS. Such measures may not be uniformly defined by all companies, including those in Glencore’s industry. Accordingly, the alternative performance measures presented may not be comparable with similarly titled measures disclosed by other companies. Further information can be found in our reporting suite available at glencore.com/publications.
Subject to any terms implied by law which cannot be excluded, Glencore accepts no responsibility for any loss, damage, cost or expense (whether direct or indirect) incurred by any person as a result of any error, omission or misrepresentation in information in this document.
Other information
The companies in which Glencore plc directly and indirectly has an interest are separate and distinct legal entities. In this document, “Glencore”, “Glencore group” and “Group” are used for convenience only where references are made to Glencore plc and its subsidiaries in general. These collective expressions are used for ease of reference only and do not imply any other relationship between the companies. Likewise, the words “we”, “us” and “our” are also used to refer collectively to members of the Group or to those who work for them. These expressions are also used where no useful purpose is served by identifying the particular company or companies.
© Glencore 2026
Privacy policy and cookies
This site uses cookies. By continuing to browse the site you are agreeing to our use of cookies.
Accept all cookies Reject all cookies Cookie settings