Home News & Media Press releases Interim Results for the six months ended 30 June 2026 25 September 2026 Ferrexpo plc (LSE: FXPO), a producer and exporter of premium iron ore products to the global steel industry, is pleased to report interim results…
25 September 2026
Ferrexpo plc (LSE: FXPO), a producer and exporter of premium iron ore products to the global steel industry, is pleased to report interim results for the six months ended 30 June 2026 (“the period” or “first half” or “first six months” or “1H 2026”).
Commenting on the results, Lucio Genovese, Interim Executive Chair, said:
“The first six months of 2026 have been another exceptionally difficult period for Ferrexpo, during which the business and its people demonstrated a continued ability to adapt and respond to a series of operational, financial and legal challenges that were outside its control.
The year began with waves of intensive attacks on Ukraine’s electricity generation and transmission infrastructure, which forced us to temporarily suspend operations. Following some improvements in the availability and price of electricity, we were able to restart limited production by bringing one of the Group’s four pellet lines back online.
Reflecting the constraints on power, liquidity and working capital, total commercial production for the first six months was 1.6 million tonnes, comprising 1.4 million tonnes of premium iron ore pellets (including 163 thousand tonnes of premium DR pellets) and 171 thousand tonnes of finished high-grade iron ore concentrate.
We continued to take all the necessary actions we could to preserve cash and protect the integrity of the business and our assets. This included reducing working time for employees, maintaining tight controls over procurement, continuing the suspension of all non-essential maintenance and capital expenditure, overheads, corporate social responsibility spending, and by focusing production on the products and customers that generated the optimal short-term value. We recognise that these actions have had direct and challenging impacts on colleagues, suppliers and the communities where we operate. They were however necessary, to preserve liquidity and maintain the business as a going concern while operating at reduced levels and progressing the Group’s funding plans.
The continued suspension of VAT refunds by the Ukrainian tax authorities remains a significant financial issue. As at 30 June 2026, the Group’s net VAT receivable balance in Ukraine was US$82.7 million. The continued withholding of VAT refunds constrained liquidity during the period, contributing to the further downscaling of production and knock-on effects, such as reductions in salaries, procurement, and fiscal contributions. As at the date of approval of these interim condensed consolidated financial statements, VAT refunds in the aggregate amount of UAH3,885 million (US$86.9 million at this date) were suspended by the State Tax Service (“STS”).
During the period, the Board took a number of steps to manage its liquidity constraints. This included an agreement in April to sell its transhipping vessel ‘Iron Destiny’, for total net cash consideration of US$7.7 million. Given the vessel’s age, the restrictions on its use since the start of the war and the ongoing costs to maintain the vessel in a seaworthy condition, the Board concluded that a sale was in the best interests of the Group. The proceeds provided some additional liquidity while the Board progressed a longer-term funding solution for the Group.
Sales volumes for the first six months of 2026 totalled 1.5 million tonnes, comprising 1.3 million tonnes of pellets and just over 200 thousand tonnes of commercial concentrate. Revenue for the period was US$196 million and underlying EBITDA was negative US$4 million, reflecting lower production and sales volumes, constrained operating conditions, elevated energy and logistics costs and the continuing impact of VAT refunds not being received.
At the end of June 2026, the Group cash position was approximately US$30 million compared to US$58 million at the end of December 2025. Throughout the first six months and into the third quarter of 2026, the Board progressed an equity fundraise to strengthen the Group’s financial position and provide sufficient liquidity to meet ongoing obligations, fund short-term working capital requirements and support operations.
I am pleased that in early September, post period end, we were able to announce a successful US$100 million equity raise which was overwhelmingly approved by shareholders at the subsequent General Meeting of the Company. I am grateful for the support shown by existing shareholders, and indeed new shareholders, whom we welcome.
The equity fund raise has materially strengthened the Group’s liquidity position, providing additional financial resilience and greater flexibility to manage the continuing operational and financial pressures facing the business. The additional capital does not however remove the underlying challenges as a result of the continued withholding of VAT refunds, the war in Ukraine, constraints on logistics and energy infrastructure, and the need to maintain disciplined management of cash and working capital.
As a result of the fundraising the Company and its auditors were able to finalise the going concern assessment and publish the audited financial statements and annual report for the year ended 31 December 2025, in turn enabling the lifting of the suspension of trading in the Company’s shares on the London Stock Exchange on 7 September.
Following the end of the first six months reporting period, it was regrettable to announce logistics disruption and a shipping incident in which a sailor employed by a chartered shipping company lost his life after that company’s vessel was attacked and damaged. This tragedy serves to remind us of the broader impacts of war beyond Ukraine’s shores. At our own operations, safety remains our first priority. At the end of June 2026, the Group achieved an improvement in its rolling six-month LTIFR to 0.20, below the historic five-year trailing average of 0.44, with zero workplace fatalities for more than five years. Maintaining this performance in wartime conditions is a significant achievement, but it is not a reason for complacency. Air raid alerts, power interruptions, disrupted transport and the psychological pressure of living and working through war continue to make safety discipline, emergency preparedness and practical support for employees essential.
It is with great sadness that during the first six months of 2026 we received notice that a further 11 colleagues serving in the Armed Forces of Ukraine had been killed, bringing the total number of colleagues killed since the start of the full-scale invasion to 67. Our thoughts are with their families, friends and colleagues during this extremely difficult period. At the end of June 2026, 804 colleagues were serving in the Armed Forces of Ukraine, while 218 colleagues had been demobilised since the start of the full-scale invasion. We continue to support colleagues serving in the Armed Forces, those returning to civilian life and the families of those affected by the war.
Since the full-scale invasion of Ukraine in February 2022, Ferrexpo has continued to operate and export its products despite immense challenges. By remaining operational, the Group has continued to sustain employment, serve customers, maintain the integrity of its assets and make a meaningful contribution to Ukraine. The successful equity fundraise represents an important step in strengthening the Group’s financial position and providing the resilience required to navigate the current operating environment. Significant challenges nevertheless remain, particularly the continued suspension of VAT refunds and war-related disruption.
The fact that Ferrexpo has continued to operate through these conditions reflects the resilience, professionalism and determination shown by our people across the Group. Ferrexpo has world-class assets, skilled people, strong customer relationships and premium iron ore products that have an important role to play in the transition towards lower-carbon steelmaking. The additional capital raised provides the Group with greater financial resilience to manage the challenges ahead, and positioning the business for recovery when conditions permit.”
Production and financial summary
- Due to the ongoing suspension of VAT refunds and the resulting reduction in financial liquidity, the Group was forced to downscale operations to one pelletising line.
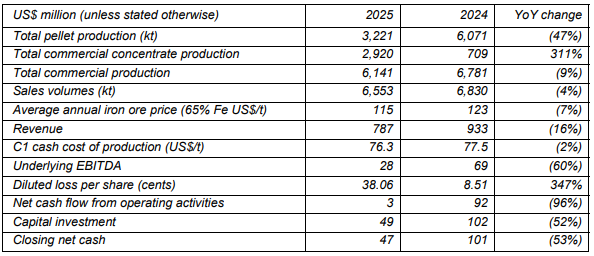
- Total commercial production for the first six months of 1,556 thousand tonnes, a 40% decrease compared to the previous six months to 31 December 2025 and 54% lower compared to the first six months of 2025.
- Production mix comprised 89% pellets and 11% commercial concentrate in 1H 2026, compared with 61% and 39% respectively in 1H 2025, when the higher proportion of concentrate production provided additional market options during a period of weaker pellet demand and premiums.
- Revenue decreased by 57% to US$196 million (1H 2025: US$453 million) due to lower sales volumes.
- C1 Cash Cost of Production (“C1 costs”) increased to US$81.3 per tonne in the half year (1H 2025: US$77.1 per tonne), due to increased mining and maintenance activities, the effects from higher electricity and fuel prices and higher personnel costs.
- Underlying EBITDA loss was US$4 million (1H 2025: positive US$4 million), reflecting the net effects of lower sales volumes and realised prices and higher production costs.
- No impairment loss in 1H 2026 (1H 2025: US$154 million).
- Loss after tax of US$14.9 million (1H 2025: loss US$196 million).
- The Group ended the period with US$30 million of cash and cash equivalents, and net cash of US$21 million after deducting US$9 million of lease liabilities (31 December 2025: US$47 million). The Group otherwise had no interest-bearing loans or borrowings.
- CapEx was deliberately reduced by limiting spend on development projects and only funding necessary sustaining capital projects. Total CapEx reduced to US$10 million (1H 2025: US$28 million), comprising 88% in sustaining and 12% development capital.
- Formal written notifications of decisions not to refund VAT from the Ukrainian tax authorities are being received on a monthly basis, typically two months after the reporting month. For the period since the suspension in March 2025 until the end of June 2026, the cumulative gross VAT receivable amount outstanding is US$102.2 million of which US$86.9 million relates to refund claims from March 2025 to June 2026 that have been refused as at the date of approval of this report.
- The Group has worked extensively to lower its costs to remain financially viable. This includes reducing working time for employees, cuts in the procurement of goods and services and a suspension of all non-essential capital expenditure, overheads and Corporate & Social Responsibility (“CSR”) spending.
Link to full PDF version of this release: click here
.