Director/PDMR Shareholding
Bull 0
Bear 0
Routine
CNA
|
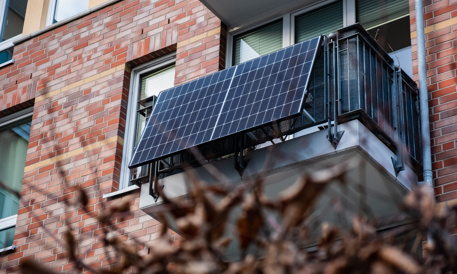
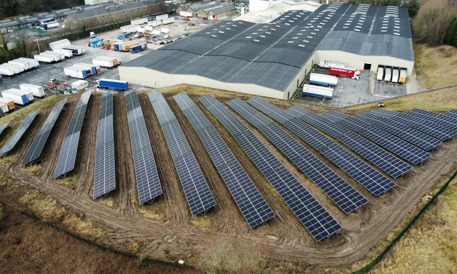
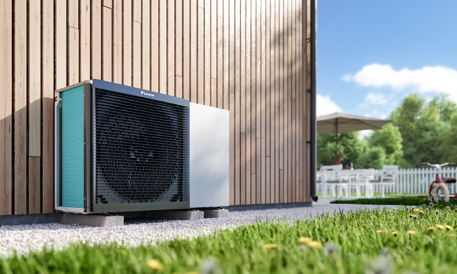
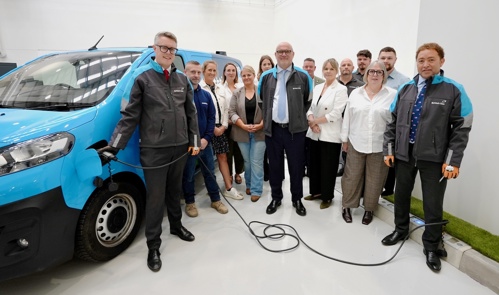
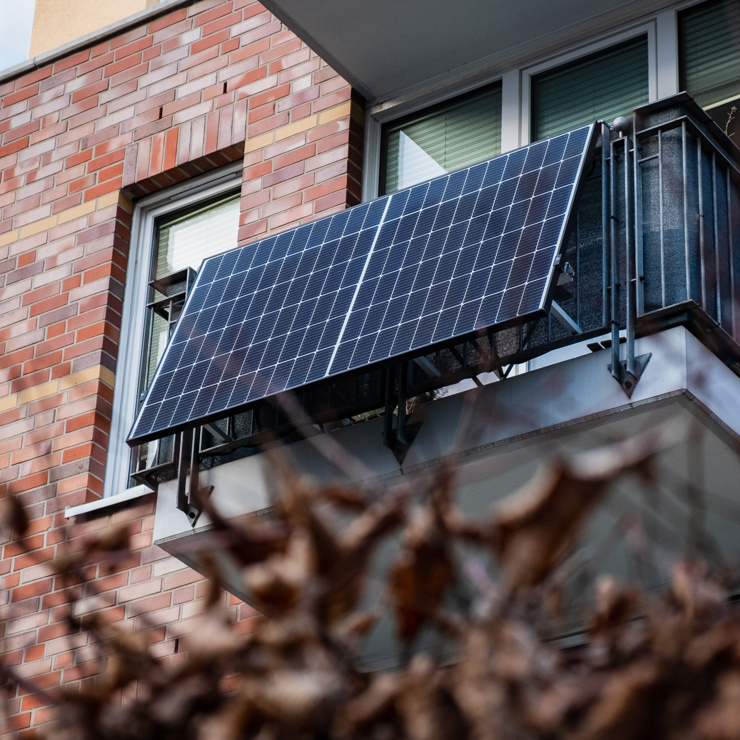
Centrica plc is an international energy and services company operating across the UK and Ireland. The company supplies electricity and gas to homes and businesses through its British Gas and Bord Gáis brands, supported by the ENSEK digital platform for account management and billing. Its services division provides installation, repair, and maintenance of heating, plumbing, and electrical appliances via British Gas, Bord Gáis, and Dyno-Rod, alongside decarbonisation solutions such as Hive smart thermostats, electric vehicle chargers, heat pumps, and rooftop solar. Centrica Energy manages gas and power trading across Europe and the United States, including global LNG trading and renewable energy optimisation. The power division owns and operates utility-scale generation and storage assets, including shares in the UK nuclear fleet, the Whitegate power station, and a portfolio of batteries and gas peakers. The gas infrastructure division produces, stores, and transports natural gas through the Rough gas storage facility, the Spirit Energy joint venture, and the Grain LNG regasification terminal. Centrica also operates an in-house smart meter business and is investing in the Sizewell C nuclear power station and carbon storage projects. Summarised from the company's own disclosures, fiscal year ended Dec 2025 |
Industry Oil & Gas Integrated | Homepage centrica.com |
| Sector Energy | IR page centrica.com/investors | |
|
Tags
energy supply, gas trading, power generation, smart meters, heat pumps, electric vehicle chargers, lng trading, nuclear power, gas storage, home services, British Gas, Bord Gáis, Dyno-Rod, ENSEK, Hive, Centrica Energy, Whitegate power station, Spirit Energy, Grain LNG regasification terminal, Rough gas storage facility, Sizewell C
|
Press page centrica.com/media-centre |
Metrics
| Valuation | |
|---|---|
| Market cap | £ 6.798B |
| Market cap (USD) | $ 8.991B |
| P/E | 9.79 |
| PEG | — |
| P/BV | 1.80 |
| P/S | 0.26 |
| P/OCF | 9.78 |
| P/FCF | 48.21 |
| Dividend yield | — |
| Turnover / mcap | — |
| Returns | |
|---|---|
| ROE | -1.2% |
| ROI | -0.83% |
| ROIC | 1.3% |
| Profit margin | — |
| Growth | |
|---|---|
| Revenue growing | Yes |
| Profits growing | No |
| Revenue up 3y | Yes |
| Revenue up 5y | No |
| Earnings growth 3y (net profit CAGR) | — |
| Quality | |
|---|---|
| Profitable | No |
| Margin expanding | Yes |
| Buying back stock | No |
| Diluting (TTM) | No |
| Debt/Equity | 75.1% |
| Podcast bulls (TTM) | Sign up |
| Podcast bears (TTM) | Sign up |
| Podcast sentiment (TTM) | Sign up |
| Podcast sentiment % (TTM) | Sign up |
| News sentiment (TTM) | 26 |
| Quality score | 5.9% |
| Insiders | |
|---|---|
| Buys, 1w | Sign up |
| Buys, 1m | Sign up |
| Buys, 1y | Sign up |
| Sells, 1w | Sign up |
| Sells, 1m | Sign up |
| Sells, 1y | Sign up |
Sign up to see this company's insider trades
| Figure | FY 2025 | FY 2024 | FY 2023 | FY 2022 | FY 2021 | FY 2020 | FY 2019 | FY 2018 | FY 2017 | FY 2016 | FY 2015 | FY 2014 | FY 2013 | FY 2012 | FY 2011 | FY 2010 |
|---|---|---|---|---|---|---|---|---|---|---|---|---|---|---|---|---|
| Revenue | — | — | 26.458B | 23.741B | 14.744B | 12.249B | 11.106B | 11.205B | — | 27.102B | 27.971B | — | — | — | — | — |
| Net profit | -51M | 1.365B | 4.04B | -636M | 1.173B | -117M | -582M | 4M | — | 1.662B | — | — | — | 1.273B | 421M | — |
| Free cash flow | 141M | 733M | 2.417B | 943M | 1.191B | 911M | — | — | — | — | — | — | — | — | — | — |
Filed figures
Lines the statements and their notes report beside the headline figures, read from the filings' XBRL as filed (no restatement applied), with figures computed from one filing's own lines. Cash-flow lines carry their cash direction: an outflow is negative. Each period links to its filing; a figure's period, report date and tag are in its tooltip.
| Figure | Dec 2020 | Dec 2021 | Dec 2022 | Dec 2023 | Dec 2024 | Dec 2025 |
|---|---|---|---|---|---|---|
| Balance sheet detail | ||||||
| Trade receivables (GBP) | — | — | — | 5.41B | 5.2B | 4.68B |
| ↳ YoY growth | -3.8% | -10.2% | ||||
| Borrowings, current (GBP) | 787M | 1.2B | 1.01B | 1B | 854M | 232M |
| Borrowings, non-current (GBP) | 4.59B | 3.44B | 3.01B | 3.1B | 2.66B | 2.62B |
| Cash and deposits (GBP) | 1.82B | 5.06B | 4.84B | 6.44B | 6.34B | 4.31B |
| Intangible assets (GBP) | 1.01B | 760M | 707M | 340M | 318M | 318M |
| Net debt (borrowings + leases - cash) (GBP) | 3.56B | -417M | -825M | -2.34B | -2.83B | -1.45B |
| Cash flow detail | ||||||
| Operating cash flow (GBP) | 1.4B | 1.61B | 1.31B | 2.75B | 1.15B | 695M |
| Purchases of property, plant and equipment (GBP) | -489M | -420M | -371M | -335M | -416M | -554M |
| Change in receivables (cash effect) (GBP) | 363M | -3.36B | -2.3B | 2.91B | 241M | 413M |
| Change in inventories (cash effect) (GBP) | 4M | -361M | -593M | 186M | 164M | 546M |
| Change in payables (cash effect) (GBP) | -571M | 3.97B | 2.24B | -2.85B | -657M | -795M |
| Dividends paid (cash effect) (GBP) | — | 0.00 | -59M | -186M | -219M | -237M |
| Share buybacks (cash effect) (GBP) | -30M | 0.00 | -5M | 0.00 | -8M | -9M |
| Interest paid (cash effect) (GBP) | -202M | -233M | -202M | -306M | -299M | -197M |
| Income taxes paid (cash effect) (GBP) | -2M | -140M | -574M | -803M | -636M | -375M |
| Share-based compensation (GBP) | 34M | 12M | 10M | 31M | 47M | 56M |
| Operating cash flow before change in receivables (GBP) | 1.04B | 4.97B | 3.62B | -159M | 908M | 282M |
| Free cash flow (OCF - PPE - intangibles) (GBP) | 911M | 1.19B | 943M | 2.42B | 733M | 141M |
| Income detail | ||||||
| Total comprehensive income (GBP) | -435M | 1.36B | -891M | 3.61B | 1.25B | -363M |
| Comprehensive income to owners (GBP) | -277M | 1.4B | -1.04B | 3.5B | 1.21B | -384M |
| Reported | Apr 25, 2022 | Apr 26, 2023 | Apr 26, 2023 | Apr 10, 2025 | Apr 10, 2025 | Mar 26, 2026 |
Sign up to see institutional holdings
Sign UpPodcast Mentions
Sign up to see podcast mentions and sentiment
Sign UpResults, director/PDMR dealings and voting-rights totals announced to the FCA's National Storage Mechanism, newest first. The link opens the announcement on the NSM. Press releases from the company's own website, newest first.



























Prompts
Click prompts to add them under the company line, click again to take one out, then copy the result into your AI chat. Shared by Asian Century Stocks and Uncovered Thai Stocks. Thank you.
Centrica plc (ticker CNA), listed in United Kingdom.
Copied
ETFs Holding Centrica plc
Exchange-traded funds whose newest published daily portfolio holds one of the company's listings, largest weight first.
| ETF | Weight in ETF | Shares | Market value | As of |
|---|---|---|---|---|
| RFDI | 0.74% | 587,295 | $ 1.227M | Jul 31, 2026 |
| DWMF | 0.42% | 63,260 | $ 143.449K | Jun 30, 2026 |
| SEIE | 0.16% | 781,268 | $ 1.772M | Jun 30, 2026 |
| DFIC | 0.10% | 7,531,950 | $ 15.429M | Nov 12, 2026 |
| DFAX | 0.07% | 4,187,451 | $ 8.578M | Nov 12, 2026 |
| DFIV | 0.06% | 6,254,791 | $ 12.813M | Nov 12, 2026 |
| AVDE | 0.05% | 4,450,165 | $ 9.156M | Nov 16, 2026 |
| FLSP | 0.05% | 194,396 | $ 440.813K | Jun 30, 2026 |
| AVSD | 0.04% | 64,910 | $ 133.553K | Nov 16, 2026 |
| DXIV | 0.04% | 44,080 | $ 90.298K | Nov 12, 2026 |
| DFAI | 0.04% | 3,226,761 | $ 6.61M | Nov 12, 2026 |
| DFIS | 0.03% | 980,128 | $ 2.008M | Nov 12, 2026 |
| DIHP | 0.00% | 32,046 | $ 65.646K | Nov 12, 2026 |