Topics All Media release Sustainability Awards Community More filters isFetching: false error: errors: pagination: { "copy": "Showing 1-10 of 1102 items", "currentPage": 1, "totalPages": 111, "first": { "title": "First", "action":…
Topics
isFetching: false
error:
errors:
pagination: { "copy": "Showing <span class=\"type-title-sm text-navy-900\">1-10 of <span class=\"type-title-sm text-navy-900\">1102 items", "currentPage": 1, "totalPages": 111, "first": { "title": "First", "action": "https://cms.bellwayplc.co.uk/index.php?p=actions/templating/news/news-index&href=https%3A%2F%2Fwww.bellwayplc.co.uk%2Fmedia-centre%2Fnews%2Fmedia-release", "href": "https://www.bellwayplc.co.uk/media-centre/news/media-release" }, "last": { "title": "Last", "action": "https://cms.bellwayplc.co.uk/index.php?p=actions/templating/news/news-index&href=https%3A%2F%2Fwww.bellwayplc.co.uk%2Fmedia-centre%2Fnews%2Fmedia-release%2Fpage-111", "href": "https://www.bellwayplc.co.uk/media-centre/news/media-release/page-111" }, "prev": { "title": "Prev", "action": null, "href": null }, "next": { "title": "Next", "action": "https://cms.bellwayplc.co.uk/index.php?p=actions/templating/news/news-index&href=https%3A%2F%2Fwww.bellwayplc.co.uk%2Fmedia-centre%2Fnews%2Fmedia-release%2Fpage-2", "href": "https://www.bellwayplc.co.uk/media-centre/news/media-release/page-2" }, "items": [ { "title": 1, "action": "https://cms.bellwayplc.co.uk/index.php?p=actions/templating/news/news-index&href=https%3A%2F%2Fwww.bellwayplc.co.uk%2Fmedia-centre%2Fnews%2Fmedia-release", "href": "https://www.bellwayplc.co.uk/media-centre/news/media-release" }, { "title": 2, "action": "https://cms.bellwayplc.co.uk/index.php?p=actions/templating/news/news-index&href=https%3A%2F%2Fwww.bellwayplc.co.uk%2Fmedia-centre%2Fnews%2Fmedia-release%2Fpage-2", "href": "https://www.bellwayplc.co.uk/media-centre/news/media-release/page-2" }, { "title": 3, "action": "https://cms.bellwayplc.co.uk/index.php?p=actions/templating/news/news-index&href=https%3A%2F%2Fwww.bellwayplc.co.uk%2Fmedia-centre%2Fnews%2Fmedia-release%2Fpage-3", "href": "https://www.bellwayplc.co.uk/media-centre/news/media-release/page-3" }, { "title": 4, "action": "https://cms.bellwayplc.co.uk/index.php?p=actions/templating/news/news-index&href=https%3A%2F%2Fwww.bellwayplc.co.uk%2Fmedia-centre%2Fnews%2Fmedia-release%2Fpage-4", "href": "https://www.bellwayplc.co.uk/media-centre/news/media-release/page-4" }, { "title": 5, "action": "https://cms.bellwayplc.co.uk/index.php?p=actions/templating/news/news-index&href=https%3A%2F%2Fwww.bellwayplc.co.uk%2Fmedia-centre%2Fnews%2Fmedia-release%2Fpage-5", "href": "https://www.bellwayplc.co.uk/media-centre/news/media-release/page-5" }, { "title": 6, "action": "https://cms.bellwayplc.co.uk/index.php?p=actions/templating/news/news-index&href=https%3A%2F%2Fwww.bellwayplc.co.uk%2Fmedia-centre%2Fnews%2Fmedia-release%2Fpage-6", "href": "https://www.bellwayplc.co.uk/media-centre/news/media-release/page-6" }, { "title": 7, "action": "https://cms.bellwayplc.co.uk/index.php?p=actions/templating/news/news-index&href=https%3A%2F%2Fwww.bellwayplc.co.uk%2Fmedia-centre%2Fnews%2Fmedia-release%2Fpage-7", "href": "https://www.bellwayplc.co.uk/media-centre/news/media-release/page-7" }, { "title": 8, "action": "https://cms.bellwayplc.co.uk/index.php?p=actions/templating/news/news-index&href=https%3A%2F%2Fwww.bellwayplc.co.uk%2Fmedia-centre%2Fnews%2Fmedia-release%2Fpage-8", "href": "https://www.bellwayplc.co.uk/media-centre/news/media-release/page-8" }, { "title": 9, "action": "https://cms.bellwayplc.co.uk/index.php?p=actions/templating/news/news-index&href=https%3A%2F%2Fwww.bellwayplc.co.uk%2Fmedia-centre%2Fnews%2Fmedia-release%2Fpage-9", "href": "https://www.bellwayplc.co.uk/media-centre/news/media-release/page-9" }, { "title": 10, "action": "https://cms.bellwayplc.co.uk/index.php?p=actions/templating/news/news-index&href=https%3A%2F%2Fwww.bellwayplc.co.uk%2Fmedia-centre%2Fnews%2Fmedia-release%2Fpage-10", "href": "https://www.bellwayplc.co.uk/media-centre/news/media-release/page-10" }, { "title": 11, "action": "https://cms.bellwayplc.co.uk/index.php?p=actions/templating/news/news-index&href=https%3A%2F%2Fwww.bellwayplc.co.uk%2Fmedia-centre%2Fnews%2Fmedia-release%2Fpage-11", "href": "https://www.bellwayplc.co.uk/media-centre/news/media-release/page-11" }, { "title": 12, "action": "https://cms.bellwayplc.co.uk/index.php?p=actions/templating/news/news-index&href=https%3A%2F%2Fwww.bellwayplc.co.uk%2Fmedia-centre%2Fnews%2Fmedia-release%2Fpage-12", "href": "https://www.bellwayplc.co.uk/media-centre/news/media-release/page-12" }, { "title": 13, "action": "https://cms.bellwayplc.co.uk/index.php?p=actions/templating/news/news-index&href=https%3A%2F%2Fwww.bellwayplc.co.uk%2Fmedia-centre%2Fnews%2Fmedia-release%2Fpage-13", "href": "https://www.bellwayplc.co.uk/media-centre/news/media-release/page-13" }, { "title": 14, "action": "https://cms.bellwayplc.co.uk/index.php?p=actions/templating/news/news-index&href=https%3A%2F%2Fwww.bellwayplc.co.uk%2Fmedia-centre%2Fnews%2Fmedia-release%2Fpage-14", "href": "https://www.bellwayplc.co.uk/media-centre/news/media-release/page-14" }, { "title": 15, "action": "https://cms.bellwayplc.co.uk/index.php?p=actions/templating/news/news-index&href=https%3A%2F%2Fwww.bellwayplc.co.uk%2Fmedia-centre%2Fnews%2Fmedia-release%2Fpage-15", "href": "https://www.bellwayplc.co.uk/media-centre/news/media-release/page-15" }, { "title": 16, "action": "https://cms.bellwayplc.co.uk/index.php?p=actions/templating/news/news-index&href=https%3A%2F%2Fwww.bellwayplc.co.uk%2Fmedia-centre%2Fnews%2Fmedia-release%2Fpage-16", "href": "https://www.bellwayplc.co.uk/media-centre/news/media-release/page-16" }, { "title": 17, "action": "https://cms.bellwayplc.co.uk/index.php?p=actions/templating/news/news-index&href=https%3A%2F%2Fwww.bellwayplc.co.uk%2Fmedia-centre%2Fnews%2Fmedia-release%2Fpage-17", "href": "https://www.bellwayplc.co.uk/media-centre/news/media-release/page-17" }, { "title": 18, "action": "https://cms.bellwayplc.co.uk/index.php?p=actions/templating/news/news-index&href=https%3A%2F%2Fwww.bellwayplc.co.uk%2Fmedia-centre%2Fnews%2Fmedia-release%2Fpage-18", "href": "https://www.bellwayplc.co.uk/media-centre/news/media-release/page-18" }, { "title": 19, "action": "https://cms.bellwayplc.co.uk/index.php?p=actions/templating/news/news-index&href=https%3A%2F%2Fwww.bellwayplc.co.uk%2Fmedia-centre%2Fnews%2Fmedia-release%2Fpage-19", "href": "https://www.bellwayplc.co.uk/media-centre/news/media-release/page-19" }, { "title": 20, "action": "https://cms.bellwayplc.co.uk/index.php?p=actions/templating/news/news-index&href=https%3A%2F%2Fwww.bellwayplc.co.uk%2Fmedia-centre%2Fnews%2Fmedia-release%2Fpage-20", "href": "https://www.bellwayplc.co.uk/media-centre/news/media-release/page-20" }, { "title": 21, "action": "https://cms.bellwayplc.co.uk/index.php?p=actions/templating/news/news-index&href=https%3A%2F%2Fwww.bellwayplc.co.uk%2Fmedia-centre%2Fnews%2Fmedia-release%2Fpage-21", "href": "https://www.bellwayplc.co.uk/media-centre/news/media-release/page-21" }, { "title": 22, "action": "https://cms.bellwayplc.co.uk/index.php?p=actions/templating/news/news-index&href=https%3A%2F%2Fwww.bellwayplc.co.uk%2Fmedia-centre%2Fnews%2Fmedia-release%2Fpage-22", "href": "https://www.bellwayplc.co.uk/media-centre/news/media-release/page-22" }, { "title": 23, "action": "https://cms.bellwayplc.co.uk/index.php?p=actions/templating/news/news-index&href=https%3A%2F%2Fwww.bellwayplc.co.uk%2Fmedia-centre%2Fnews%2Fmedia-release%2Fpage-23", "href": "https://www.bellwayplc.co.uk/media-centre/news/media-release/page-23" }, { "title": 24, "action": "https://cms.bellwayplc.co.uk/index.php?p=actions/templating/news/news-index&href=https%3A%2F%2Fwww.bellwayplc.co.uk%2Fmedia-centre%2Fnews%2Fmedia-release%2Fpage-24", "href": "https://www.bellwayplc.co.uk/media-centre/news/media-release/page-24" }, { "title": 25, "action": "https://cms.bellwayplc.co.uk/index.php?p=actions/templating/news/news-index&href=https%3A%2F%2Fwww.bellwayplc.co.uk%2Fmedia-centre%2Fnews%2Fmedia-release%2Fpage-25", "href": "https://www.bellwayplc.co.uk/media-centre/news/media-release/page-25" }, { "title": 26, "action": "https://cms.bellwayplc.co.uk/index.php?p=actions/templating/news/news-index&href=https%3A%2F%2Fwww.bellwayplc.co.uk%2Fmedia-centre%2Fnews%2Fmedia-release%2Fpage-26", "href": "https://www.bellwayplc.co.uk/media-centre/news/media-release/page-26" }, { "title": 27, "action": "https://cms.bellwayplc.co.uk/index.php?p=actions/templating/news/news-index&href=https%3A%2F%2Fwww.bellwayplc.co.uk%2Fmedia-centre%2Fnews%2Fmedia-release%2Fpage-27", "href": "https://www.bellwayplc.co.uk/media-centre/news/media-release/page-27" }, { "title": 28, "action": "https://cms.bellwayplc.co.uk/index.php?p=actions/templating/news/news-index&href=https%3A%2F%2Fwww.bellwayplc.co.uk%2Fmedia-centre%2Fnews%2Fmedia-release%2Fpage-28", "href": "https://www.bellwayplc.co.uk/media-centre/news/media-release/page-28" }, { "title": 29, "action": "https://cms.bellwayplc.co.uk/index.php?p=actions/templating/news/news-index&href=https%3A%2F%2Fwww.bellwayplc.co.uk%2Fmedia-centre%2Fnews%2Fmedia-release%2Fpage-29", "href": "https://www.bellwayplc.co.uk/media-centre/news/media-release/page-29" }, { "title": 30, "action": "https://cms.bellwayplc.co.uk/index.php?p=actions/templating/news/news-index&href=https%3A%2F%2Fwww.bellwayplc.co.uk%2Fmedia-centre%2Fnews%2Fmedia-release%2Fpage-30", "href": "https://www.bellwayplc.co.uk/media-centre/news/media-release/page-30" }, { "title": 31, "action": "https://cms.bellwayplc.co.uk/index.php?p=actions/templating/news/news-index&href=https%3A%2F%2Fwww.bellwayplc.co.uk%2Fmedia-centre%2Fnews%2Fmedia-release%2Fpage-31", "href": "https://www.bellwayplc.co.uk/media-centre/news/media-release/page-31" }, { "title": 32, "action": "https://cms.bellwayplc.co.uk/index.php?p=actions/templating/news/news-index&href=https%3A%2F%2Fwww.bellwayplc.co.uk%2Fmedia-centre%2Fnews%2Fmedia-release%2Fpage-32", "href": "https://www.bellwayplc.co.uk/media-centre/news/media-release/page-32" }, { "title": 33, "action": "https://cms.bellwayplc.co.uk/index.php?p=actions/templating/news/news-index&href=https%3A%2F%2Fwww.bellwayplc.co.uk%2Fmedia-centre%2Fnews%2Fmedia-release%2Fpage-33", "href": "https://www.bellwayplc.co.uk/media-centre/news/media-release/page-33" }, { "title": 34, "action": "https://cms.bellwayplc.co.uk/index.php?p=actions/templating/news/news-index&href=https%3A%2F%2Fwww.bellwayplc.co.uk%2Fmedia-centre%2Fnews%2Fmedia-release%2Fpage-34", "href": "https://www.bellwayplc.co.uk/media-centre/news/media-release/page-34" }, { "title": 35, "action": "https://cms.bellwayplc.co.uk/index.php?p=actions/templating/news/news-index&href=https%3A%2F%2Fwww.bellwayplc.co.uk%2Fmedia-centre%2Fnews%2Fmedia-release%2Fpage-35", "href": "https://www.bellwayplc.co.uk/media-centre/news/media-release/page-35" }, { "title": 36, "action": "https://cms.bellwayplc.co.uk/index.php?p=actions/templating/news/news-index&href=https%3A%2F%2Fwww.bellwayplc.co.uk%2Fmedia-centre%2Fnews%2Fmedia-release%2Fpage-36", "href": "https://www.bellwayplc.co.uk/media-centre/news/media-release/page-36" }, { "title": 37, "action": "https://cms.bellwayplc.co.uk/index.php?p=actions/templating/news/news-index&href=https%3A%2F%2Fwww.bellwayplc.co.uk%2Fmedia-centre%2Fnews%2Fmedia-release%2Fpage-37", "href": "https://www.bellwayplc.co.uk/media-centre/news/media-release/page-37" }, { "title": 38, "action": "https://cms.bellwayplc.co.uk/index.php?p=actions/templating/news/news-index&href=https%3A%2F%2Fwww.bellwayplc.co.uk%2Fmedia-centre%2Fnews%2Fmedia-release%2Fpage-38", "href": "https://www.bellwayplc.co.uk/media-centre/news/media-release/page-38" }, { "title": 39, "action": "https://cms.bellwayplc.co.uk/index.php?p=actions/templating/news/news-index&href=https%3A%2F%2Fwww.bellwayplc.co.uk%2Fmedia-centre%2Fnews%2Fmedia-release%2Fpage-39", "href": "https://www.bellwayplc.co.uk/media-centre/news/media-release/page-39" }, { "title": 40, "action": "https://cms.bellwayplc.co.uk/index.php?p=actions/templating/news/news-index&href=https%3A%2F%2Fwww.bellwayplc.co.uk%2Fmedia-centre%2Fnews%2Fmedia-release%2Fpage-40", "href": "https://www.bellwayplc.co.uk/media-centre/news/media-release/page-40" }, { "title": 41, "action": "https://cms.bellwayplc.co.uk/index.php?p=actions/templating/news/news-index&href=https%3A%2F%2Fwww.bellwayplc.co.uk%2Fmedia-centre%2Fnews%2Fmedia-release%2Fpage-41", "href": "https://www.bellwayplc.co.uk/media-centre/news/media-release/page-41" }, { "title": 42, "action": "https://cms.bellwayplc.co.uk/index.php?p=actions/templating/news/news-index&href=https%3A%2F%2Fwww.bellwayplc.co.uk%2Fmedia-centre%2Fnews%2Fmedia-release%2Fpage-42", "href": "https://www.bellwayplc.co.uk/media-centre/news/media-release/page-42" }, { "title": 43, "action": "https://cms.bellwayplc.co.uk/index.php?p=actions/templating/news/news-index&href=https%3A%2F%2Fwww.bellwayplc.co.uk%2Fmedia-centre%2Fnews%2Fmedia-release%2Fpage-43", "href": "https://www.bellwayplc.co.uk/media-centre/news/media-release/page-43" }, { "title": 44, "action": "https://cms.bellwayplc.co.uk/index.php?p=actions/templating/news/news-index&href=https%3A%2F%2Fwww.bellwayplc.co.uk%2Fmedia-centre%2Fnews%2Fmedia-release%2Fpage-44", "href": "https://www.bellwayplc.co.uk/media-centre/news/media-release/page-44" }, { "title": 45, "action": "https://cms.bellwayplc.co.uk/index.php?p=actions/templating/news/news-index&href=https%3A%2F%2Fwww.bellwayplc.co.uk%2Fmedia-centre%2Fnews%2Fmedia-release%2Fpage-45", "href": "https://www.bellwayplc.co.uk/media-centre/news/media-release/page-45" }, { "title": 46, "action": "https://cms.bellwayplc.co.uk/index.php?p=actions/templating/news/news-index&href=https%3A%2F%2Fwww.bellwayplc.co.uk%2Fmedia-centre%2Fnews%2Fmedia-release%2Fpage-46", "href": "https://www.bellwayplc.co.uk/media-centre/news/media-release/page-46" }, { "title": 47, "action": "https://cms.bellwayplc.co.uk/index.php?p=actions/templating/news/news-index&href=https%3A%2F%2Fwww.bellwayplc.co.uk%2Fmedia-centre%2Fnews%2Fmedia-release%2Fpage-47", "href": "https://www.bellwayplc.co.uk/media-centre/news/media-release/page-47" }, { "title": 48, "action": "https://cms.bellwayplc.co.uk/index.php?p=actions/templating/news/news-index&href=https%3A%2F%2Fwww.bellwayplc.co.uk%2Fmedia-centre%2Fnews%2Fmedia-release%2Fpage-48", "href": "https://www.bellwayplc.co.uk/media-centre/news/media-release/page-48" }, { "title": 49, "action": "https://cms.bellwayplc.co.uk/index.php?p=actions/templating/news/news-index&href=https%3A%2F%2Fwww.bellwayplc.co.uk%2Fmedia-centre%2Fnews%2Fmedia-release%2Fpage-49", "href": "https://www.bellwayplc.co.uk/media-centre/news/media-release/page-49" }, { "title": 50, "action": "https://cms.bellwayplc.co.uk/index.php?p=actions/templating/news/news-index&href=https%3A%2F%2Fwww.bellwayplc.co.uk%2Fmedia-centre%2Fnews%2Fmedia-release%2Fpage-50", "href": "https://www.bellwayplc.co.uk/media-centre/news/media-release/page-50" }, { "title": 51, "action": "https://cms.bellwayplc.co.uk/index.php?p=actions/templating/news/news-index&href=https%3A%2F%2Fwww.bellwayplc.co.uk%2Fmedia-centre%2Fnews%2Fmedia-release%2Fpage-51", "href": "https://www.bellwayplc.co.uk/media-centre/news/media-release/page-51" }, { "title": 52, "action": "https://cms.bellwayplc.co.uk/index.php?p=actions/templating/news/news-index&href=https%3A%2F%2Fwww.bellwayplc.co.uk%2Fmedia-centre%2Fnews%2Fmedia-release%2Fpage-52", "href": "https://www.bellwayplc.co.uk/media-centre/news/media-release/page-52" }, { "title": 53, "action": "https://cms.bellwayplc.co.uk/index.php?p=actions/templating/news/news-index&href=https%3A%2F%2Fwww.bellwayplc.co.uk%2Fmedia-centre%2Fnews%2Fmedia-release%2Fpage-53", "href": "https://www.bellwayplc.co.uk/media-centre/news/media-release/page-53" }, { "title": 54, "action": "https://cms.bellwayplc.co.uk/index.php?p=actions/templating/news/news-index&href=https%3A%2F%2Fwww.bellwayplc.co.uk%2Fmedia-centre%2Fnews%2Fmedia-release%2Fpage-54", "href": "https://www.bellwayplc.co.uk/media-centre/news/media-release/page-54" }, { "title": 55, "action": "https://cms.bellwayplc.co.uk/index.php?p=actions/templating/news/news-index&href=https%3A%2F%2Fwww.bellwayplc.co.uk%2Fmedia-centre%2Fnews%2Fmedia-release%2Fpage-55", "href": "https://www.bellwayplc.co.uk/media-centre/news/media-release/page-55" }, { "title": 56, "action": "https://cms.bellwayplc.co.uk/index.php?p=actions/templating/news/news-index&href=https%3A%2F%2Fwww.bellwayplc.co.uk%2Fmedia-centre%2Fnews%2Fmedia-release%2Fpage-56", "href": "https://www.bellwayplc.co.uk/media-centre/news/media-release/page-56" }, { "title": 57, "action": "https://cms.bellwayplc.co.uk/index.php?p=actions/templating/news/news-index&href=https%3A%2F%2Fwww.bellwayplc.co.uk%2Fmedia-centre%2Fnews%2Fmedia-release%2Fpage-57", "href": "https://www.bellwayplc.co.uk/media-centre/news/media-release/page-57" }, { "title": 58, "action": "https://cms.bellwayplc.co.uk/index.php?p=actions/templating/news/news-index&href=https%3A%2F%2Fwww.bellwayplc.co.uk%2Fmedia-centre%2Fnews%2Fmedia-release%2Fpage-58", "href": "https://www.bellwayplc.co.uk/media-centre/news/media-release/page-58" }, { "title": 59, "action": "https://cms.bellwayplc.co.uk/index.php?p=actions/templating/news/news-index&href=https%3A%2F%2Fwww.bellwayplc.co.uk%2Fmedia-centre%2Fnews%2Fmedia-release%2Fpage-59", "href": "https://www.bellwayplc.co.uk/media-centre/news/media-release/page-59" }, { "title": 60, "action": "https://cms.bellwayplc.co.uk/index.php?p=actions/templating/news/news-index&href=https%3A%2F%2Fwww.bellwayplc.co.uk%2Fmedia-centre%2Fnews%2Fmedia-release%2Fpage-60", "href": "https://www.bellwayplc.co.uk/media-centre/news/media-release/page-60" }, { "title": 61, "action": "https://cms.bellwayplc.co.uk/index.php?p=actions/templating/news/news-index&href=https%3A%2F%2Fwww.bellwayplc.co.uk%2Fmedia-centre%2Fnews%2Fmedia-release%2Fpage-61", "href": "https://www.bellwayplc.co.uk/media-centre/news/media-release/page-61" }, { "title": 62, "action": "https://cms.bellwayplc.co.uk/index.php?p=actions/templating/news/news-index&href=https%3A%2F%2Fwww.bellwayplc.co.uk%2Fmedia-centre%2Fnews%2Fmedia-release%2Fpage-62", "href": "https://www.bellwayplc.co.uk/media-centre/news/media-release/page-62" }, { "title": 63, "action": "https://cms.bellwayplc.co.uk/index.php?p=actions/templating/news/news-index&href=https%3A%2F%2Fwww.bellwayplc.co.uk%2Fmedia-centre%2Fnews%2Fmedia-release%2Fpage-63", "href": "https://www.bellwayplc.co.uk/media-centre/news/media-release/page-63" }, { "title": 64, "action": "https://cms.bellwayplc.co.uk/index.php?p=actions/templating/news/news-index&href=https%3A%2F%2Fwww.bellwayplc.co.uk%2Fmedia-centre%2Fnews%2Fmedia-release%2Fpage-64", "href": "https://www.bellwayplc.co.uk/media-centre/news/media-release/page-64" }, { "title": 65, "action": "https://cms.bellwayplc.co.uk/index.php?p=actions/templating/news/news-index&href=https%3A%2F%2Fwww.bellwayplc.co.uk%2Fmedia-centre%2Fnews%2Fmedia-release%2Fpage-65", "href": "https://www.bellwayplc.co.uk/media-centre/news/media-release/page-65" }, { "title": 66, "action": "https://cms.bellwayplc.co.uk/index.php?p=actions/templating/news/news-index&href=https%3A%2F%2Fwww.bellwayplc.co.uk%2Fmedia-centre%2Fnews%2Fmedia-release%2Fpage-66", "href": "https://www.bellwayplc.co.uk/media-centre/news/media-release/page-66" }, { "title": 67, "action": "https://cms.bellwayplc.co.uk/index.php?p=actions/templating/news/news-index&href=https%3A%2F%2Fwww.bellwayplc.co.uk%2Fmedia-centre%2Fnews%2Fmedia-release%2Fpage-67", "href": "https://www.bellwayplc.co.uk/media-centre/news/media-release/page-67" }, { "title": 68, "action": "https://cms.bellwayplc.co.uk/index.php?p=actions/templating/news/news-index&href=https%3A%2F%2Fwww.bellwayplc.co.uk%2Fmedia-centre%2Fnews%2Fmedia-release%2Fpage-68", "href": "https://www.bellwayplc.co.uk/media-centre/news/media-release/page-68" }, { "title": 69, "action": "https://cms.bellwayplc.co.uk/index.php?p=actions/templating/news/news-index&href=https%3A%2F%2Fwww.bellwayplc.co.uk%2Fmedia-centre%2Fnews%2Fmedia-release%2Fpage-69", "href": "https://www.bellwayplc.co.uk/media-centre/news/media-release/page-69" }, { "title": 70, "action": "https://cms.bellwayplc.co.uk/index.php?p=actions/templating/news/news-index&href=https%3A%2F%2Fwww.bellwayplc.co.uk%2Fmedia-centre%2Fnews%2Fmedia-release%2Fpage-70", "href": "https://www.bellwayplc.co.uk/media-centre/news/media-release/page-70" }, { "title": 71, "action": "https://cms.bellwayplc.co.uk/index.php?p=actions/templating/news/news-index&href=https%3A%2F%2Fwww.bellwayplc.co.uk%2Fmedia-centre%2Fnews%2Fmedia-release%2Fpage-71", "href": "https://www.bellwayplc.co.uk/media-centre/news/media-release/page-71" }, { "title": 72, "action": "https://cms.bellwayplc.co.uk/index.php?p=actions/templating/news/news-index&href=https%3A%2F%2Fwww.bellwayplc.co.uk%2Fmedia-centre%2Fnews%2Fmedia-release%2Fpage-72", "href": "https://www.bellwayplc.co.uk/media-centre/news/media-release/page-72" }, { "title": 73, "action": "https://cms.bellwayplc.co.uk/index.php?p=actions/templating/news/news-index&href=https%3A%2F%2Fwww.bellwayplc.co.uk%2Fmedia-centre%2Fnews%2Fmedia-release%2Fpage-73", "href": "https://www.bellwayplc.co.uk/media-centre/news/media-release/page-73" }, { "title": 74, "action": "https://cms.bellwayplc.co.uk/index.php?p=actions/templating/news/news-index&href=https%3A%2F%2Fwww.bellwayplc.co.uk%2Fmedia-centre%2Fnews%2Fmedia-release%2Fpage-74", "href": "https://www.bellwayplc.co.uk/media-centre/news/media-release/page-74" }, { "title": 75, "action": "https://cms.bellwayplc.co.uk/index.php?p=actions/templating/news/news-index&href=https%3A%2F%2Fwww.bellwayplc.co.uk%2Fmedia-centre%2Fnews%2Fmedia-release%2Fpage-75", "href": "https://www.bellwayplc.co.uk/media-centre/news/media-release/page-75" }, { "title": 76, "action": "https://cms.bellwayplc.co.uk/index.php?p=actions/templating/news/news-index&href=https%3A%2F%2Fwww.bellwayplc.co.uk%2Fmedia-centre%2Fnews%2Fmedia-release%2Fpage-76", "href": "https://www.bellwayplc.co.uk/media-centre/news/media-release/page-76" }, { "title": 77, "action": "https://cms.bellwayplc.co.uk/index.php?p=actions/templating/news/news-index&href=https%3A%2F%2Fwww.bellwayplc.co.uk%2Fmedia-centre%2Fnews%2Fmedia-release%2Fpage-77", "href": "https://www.bellwayplc.co.uk/media-centre/news/media-release/page-77" }, { "title": 78, "action": "https://cms.bellwayplc.co.uk/index.php?p=actions/templating/news/news-index&href=https%3A%2F%2Fwww.bellwayplc.co.uk%2Fmedia-centre%2Fnews%2Fmedia-release%2Fpage-78", "href": "https://www.bellwayplc.co.uk/media-centre/news/media-release/page-78" }, { "title": 79, "action": "https://cms.bellwayplc.co.uk/index.php?p=actions/templating/news/news-index&href=https%3A%2F%2Fwww.bellwayplc.co.uk%2Fmedia-centre%2Fnews%2Fmedia-release%2Fpage-79", "href": "https://www.bellwayplc.co.uk/media-centre/news/media-release/page-79" }, { "title": 80, "action": "https://cms.bellwayplc.co.uk/index.php?p=actions/templating/news/news-index&href=https%3A%2F%2Fwww.bellwayplc.co.uk%2Fmedia-centre%2Fnews%2Fmedia-release%2Fpage-80", "href": "https://www.bellwayplc.co.uk/media-centre/news/media-release/page-80" }, { "title": 81, "action": "https://cms.bellwayplc.co.uk/index.php?p=actions/templating/news/news-index&href=https%3A%2F%2Fwww.bellwayplc.co.uk%2Fmedia-centre%2Fnews%2Fmedia-release%2Fpage-81", "href": "https://www.bellwayplc.co.uk/media-centre/news/media-release/page-81" }, { "title": 82, "action": "https://cms.bellwayplc.co.uk/index.php?p=actions/templating/news/news-index&href=https%3A%2F%2Fwww.bellwayplc.co.uk%2Fmedia-centre%2Fnews%2Fmedia-release%2Fpage-82", "href": "https://www.bellwayplc.co.uk/media-centre/news/media-release/page-82" }, { "title": 83, "action": "https://cms.bellwayplc.co.uk/index.php?p=actions/templating/news/news-index&href=https%3A%2F%2Fwww.bellwayplc.co.uk%2Fmedia-centre%2Fnews%2Fmedia-release%2Fpage-83", "href": "https://www.bellwayplc.co.uk/media-centre/news/media-release/page-83" }, { "title": 84, "action": "https://cms.bellwayplc.co.uk/index.php?p=actions/templating/news/news-index&href=https%3A%2F%2Fwww.bellwayplc.co.uk%2Fmedia-centre%2Fnews%2Fmedia-release%2Fpage-84", "href": "https://www.bellwayplc.co.uk/media-centre/news/media-release/page-84" }, { "title": 85, "action": "https://cms.bellwayplc.co.uk/index.php?p=actions/templating/news/news-index&href=https%3A%2F%2Fwww.bellwayplc.co.uk%2Fmedia-centre%2Fnews%2Fmedia-release%2Fpage-85", "href": "https://www.bellwayplc.co.uk/media-centre/news/media-release/page-85" }, { "title": 86, "action": "https://cms.bellwayplc.co.uk/index.php?p=actions/templating/news/news-index&href=https%3A%2F%2Fwww.bellwayplc.co.uk%2Fmedia-centre%2Fnews%2Fmedia-release%2Fpage-86", "href": "https://www.bellwayplc.co.uk/media-centre/news/media-release/page-86" }, { "title": 87, "action": "https://cms.bellwayplc.co.uk/index.php?p=actions/templating/news/news-index&href=https%3A%2F%2Fwww.bellwayplc.co.uk%2Fmedia-centre%2Fnews%2Fmedia-release%2Fpage-87", "href": "https://www.bellwayplc.co.uk/media-centre/news/media-release/page-87" }, { "title": 88, "action": "https://cms.bellwayplc.co.uk/index.php?p=actions/templating/news/news-index&href=https%3A%2F%2Fwww.bellwayplc.co.uk%2Fmedia-centre%2Fnews%2Fmedia-release%2Fpage-88", "href": "https://www.bellwayplc.co.uk/media-centre/news/media-release/page-88" }, { "title": 89, "action": "https://cms.bellwayplc.co.uk/index.php?p=actions/templating/news/news-index&href=https%3A%2F%2Fwww.bellwayplc.co.uk%2Fmedia-centre%2Fnews%2Fmedia-release%2Fpage-89", "href": "https://www.bellwayplc.co.uk/media-centre/news/media-release/page-89" }, { "title": 90, "action": "https://cms.bellwayplc.co.uk/index.php?p=actions/templating/news/news-index&href=https%3A%2F%2Fwww.bellwayplc.co.uk%2Fmedia-centre%2Fnews%2Fmedia-release%2Fpage-90", "href": "https://www.bellwayplc.co.uk/media-centre/news/media-release/page-90" }, { "title": 91, "action": "https://cms.bellwayplc.co.uk/index.php?p=actions/templating/news/news-index&href=https%3A%2F%2Fwww.bellwayplc.co.uk%2Fmedia-centre%2Fnews%2Fmedia-release%2Fpage-91", "href": "https://www.bellwayplc.co.uk/media-centre/news/media-release/page-91" }, { "title": 92, "action": "https://cms.bellwayplc.co.uk/index.php?p=actions/templating/news/news-index&href=https%3A%2F%2Fwww.bellwayplc.co.uk%2Fmedia-centre%2Fnews%2Fmedia-release%2Fpage-92", "href": "https://www.bellwayplc.co.uk/media-centre/news/media-release/page-92" }, { "title": 93, "action": "https://cms.bellwayplc.co.uk/index.php?p=actions/templating/news/news-index&href=https%3A%2F%2Fwww.bellwayplc.co.uk%2Fmedia-centre%2Fnews%2Fmedia-release%2Fpage-93", "href": "https://www.bellwayplc.co.uk/media-centre/news/media-release/page-93" }, { "title": 94, "action": "https://cms.bellwayplc.co.uk/index.php?p=actions/templating/news/news-index&href=https%3A%2F%2Fwww.bellwayplc.co.uk%2Fmedia-centre%2Fnews%2Fmedia-release%2Fpage-94", "href": "https://www.bellwayplc.co.uk/media-centre/news/media-release/page-94" }, { "title": 95, "action": "https://cms.bellwayplc.co.uk/index.php?p=actions/templating/news/news-index&href=https%3A%2F%2Fwww.bellwayplc.co.uk%2Fmedia-centre%2Fnews%2Fmedia-release%2Fpage-95", "href": "https://www.bellwayplc.co.uk/media-centre/news/media-release/page-95" }, { "title": 96, "action": "https://cms.bellwayplc.co.uk/index.php?p=actions/templating/news/news-index&href=https%3A%2F%2Fwww.bellwayplc.co.uk%2Fmedia-centre%2Fnews%2Fmedia-release%2Fpage-96", "href": "https://www.bellwayplc.co.uk/media-centre/news/media-release/page-96" }, { "title": 97, "action": "https://cms.bellwayplc.co.uk/index.php?p=actions/templating/news/news-index&href=https%3A%2F%2Fwww.bellwayplc.co.uk%2Fmedia-centre%2Fnews%2Fmedia-release%2Fpage-97", "href": "https://www.bellwayplc.co.uk/media-centre/news/media-release/page-97" }, { "title": 98, "action": "https://cms.bellwayplc.co.uk/index.php?p=actions/templating/news/news-index&href=https%3A%2F%2Fwww.bellwayplc.co.uk%2Fmedia-centre%2Fnews%2Fmedia-release%2Fpage-98", "href": "https://www.bellwayplc.co.uk/media-centre/news/media-release/page-98" }, { "title": 99, "action": "https://cms.bellwayplc.co.uk/index.php?p=actions/templating/news/news-index&href=https%3A%2F%2Fwww.bellwayplc.co.uk%2Fmedia-centre%2Fnews%2Fmedia-release%2Fpage-99", "href": "https://www.bellwayplc.co.uk/media-centre/news/media-release/page-99" }, { "title": 100, "action": "https://cms.bellwayplc.co.uk/index.php?p=actions/templating/news/news-index&href=https%3A%2F%2Fwww.bellwayplc.co.uk%2Fmedia-centre%2Fnews%2Fmedia-release%2Fpage-100", "href": "https://www.bellwayplc.co.uk/media-centre/news/media-release/page-100" }, { "title": 101, "action": "https://cms.bellwayplc.co.uk/index.php?p=actions/templating/news/news-index&href=https%3A%2F%2Fwww.bellwayplc.co.uk%2Fmedia-centre%2Fnews%2Fmedia-release%2Fpage-101", "href": "https://www.bellwayplc.co.uk/media-centre/news/media-release/page-101" }, { "title": 102, "action": "https://cms.bellwayplc.co.uk/index.php?p=actions/templating/news/news-index&href=https%3A%2F%2Fwww.bellwayplc.co.uk%2Fmedia-centre%2Fnews%2Fmedia-release%2Fpage-102", "href": "https://www.bellwayplc.co.uk/media-centre/news/media-release/page-102" }, { "title": 103, "action": "https://cms.bellwayplc.co.uk/index.php?p=actions/templating/news/news-index&href=https%3A%2F%2Fwww.bellwayplc.co.uk%2Fmedia-centre%2Fnews%2Fmedia-release%2Fpage-103", "href": "https://www.bellwayplc.co.uk/media-centre/news/media-release/page-103" }, { "title": 104, "action": "https://cms.bellwayplc.co.uk/index.php?p=actions/templating/news/news-index&href=https%3A%2F%2Fwww.bellwayplc.co.uk%2Fmedia-centre%2Fnews%2Fmedia-release%2Fpage-104", "href": "https://www.bellwayplc.co.uk/media-centre/news/media-release/page-104" }, { "title": 105, "action": "https://cms.bellwayplc.co.uk/index.php?p=actions/templating/news/news-index&href=https%3A%2F%2Fwww.bellwayplc.co.uk%2Fmedia-centre%2Fnews%2Fmedia-release%2Fpage-105", "href": "https://www.bellwayplc.co.uk/media-centre/news/media-release/page-105" }, { "title": 106, "action": "https://cms.bellwayplc.co.uk/index.php?p=actions/templating/news/news-index&href=https%3A%2F%2Fwww.bellwayplc.co.uk%2Fmedia-centre%2Fnews%2Fmedia-release%2Fpage-106", "href": "https://www.bellwayplc.co.uk/media-centre/news/media-release/page-106" }, { "title": 107, "action": "https://cms.bellwayplc.co.uk/index.php?p=actions/templating/news/news-index&href=https%3A%2F%2Fwww.bellwayplc.co.uk%2Fmedia-centre%2Fnews%2Fmedia-release%2Fpage-107", "href": "https://www.bellwayplc.co.uk/media-centre/news/media-release/page-107" }, { "title": 108, "action": "https://cms.bellwayplc.co.uk/index.php?p=actions/templating/news/news-index&href=https%3A%2F%2Fwww.bellwayplc.co.uk%2Fmedia-centre%2Fnews%2Fmedia-release%2Fpage-108", "href": "https://www.bellwayplc.co.uk/media-centre/news/media-release/page-108" }, { "title": 109, "action": "https://cms.bellwayplc.co.uk/index.php?p=actions/templating/news/news-index&href=https%3A%2F%2Fwww.bellwayplc.co.uk%2Fmedia-centre%2Fnews%2Fmedia-release%2Fpage-109", "href": "https://www.bellwayplc.co.uk/media-centre/news/media-release/page-109" }, { "title": 110, "action": "https://cms.bellwayplc.co.uk/index.php?p=actions/templating/news/news-index&href=https%3A%2F%2Fwww.bellwayplc.co.uk%2Fmedia-centre%2Fnews%2Fmedia-release%2Fpage-110", "href": "https://www.bellwayplc.co.uk/media-centre/news/media-release/page-110" }, { "title": 111, "action": "https://cms.bellwayplc.co.uk/index.php?p=actions/templating/news/news-index&href=https%3A%2F%2Fwww.bellwayplc.co.uk%2Fmedia-centre%2Fnews%2Fmedia-release%2Fpage-111", "href": "https://www.bellwayplc.co.uk/media-centre/news/media-release/page-111" } ] }
paginationData: { "copy": "Showing <span class=\"type-title-sm text-navy-900\">1-10 of <span class=\"type-title-sm text-navy-900\">1102 items", "currentPage": 1, "totalPages": 111, "first": { "title": "First", "action": "https://cms.bellwayplc.co.uk/index.php?p=actions/templating/news/news-index&href=https%3A%2F%2Fwww.bellwayplc.co.uk%2Fmedia-centre%2Fnews%2Fmedia-release", "href": "https://www.bellwayplc.co.uk/media-centre/news/media-release" }, "last": { "title": "Last", "action": "https://cms.bellwayplc.co.uk/index.php?p=actions/templating/news/news-index&href=https%3A%2F%2Fwww.bellwayplc.co.uk%2Fmedia-centre%2Fnews%2Fmedia-release%2Fpage-111", "href": "https://www.bellwayplc.co.uk/media-centre/news/media-release/page-111" }, "prev": { "title": "Prev", "action": null, "href": null }, "next": { "title": "Next", "action": "https://cms.bellwayplc.co.uk/index.php?p=actions/templating/news/news-index&href=https%3A%2F%2Fwww.bellwayplc.co.uk%2Fmedia-centre%2Fnews%2Fmedia-release%2Fpage-2", "href": "https://www.bellwayplc.co.uk/media-centre/news/media-release/page-2" }, "items": [ { "title": 1, "action": "https://cms.bellwayplc.co.uk/index.php?p=actions/templating/news/news-index&href=https%3A%2F%2Fwww.bellwayplc.co.uk%2Fmedia-centre%2Fnews%2Fmedia-release", "href": "https://www.bellwayplc.co.uk/media-centre/news/media-release" }, { "title": 2, "action": "https://cms.bellwayplc.co.uk/index.php?p=actions/templating/news/news-index&href=https%3A%2F%2Fwww.bellwayplc.co.uk%2Fmedia-centre%2Fnews%2Fmedia-release%2Fpage-2", "href": "https://www.bellwayplc.co.uk/media-centre/news/media-release/page-2" }, { "title": 3, "action": "https://cms.bellwayplc.co.uk/index.php?p=actions/templating/news/news-index&href=https%3A%2F%2Fwww.bellwayplc.co.uk%2Fmedia-centre%2Fnews%2Fmedia-release%2Fpage-3", "href": "https://www.bellwayplc.co.uk/media-centre/news/media-release/page-3" }, { "title": 4, "action": "https://cms.bellwayplc.co.uk/index.php?p=actions/templating/news/news-index&href=https%3A%2F%2Fwww.bellwayplc.co.uk%2Fmedia-centre%2Fnews%2Fmedia-release%2Fpage-4", "href": "https://www.bellwayplc.co.uk/media-centre/news/media-release/page-4" }, { "title": 5, "action": "https://cms.bellwayplc.co.uk/index.php?p=actions/templating/news/news-index&href=https%3A%2F%2Fwww.bellwayplc.co.uk%2Fmedia-centre%2Fnews%2Fmedia-release%2Fpage-5", "href": "https://www.bellwayplc.co.uk/media-centre/news/media-release/page-5" }, { "title": 6, "action": "https://cms.bellwayplc.co.uk/index.php?p=actions/templating/news/news-index&href=https%3A%2F%2Fwww.bellwayplc.co.uk%2Fmedia-centre%2Fnews%2Fmedia-release%2Fpage-6", "href": "https://www.bellwayplc.co.uk/media-centre/news/media-release/page-6" }, { "title": 7, "action": "https://cms.bellwayplc.co.uk/index.php?p=actions/templating/news/news-index&href=https%3A%2F%2Fwww.bellwayplc.co.uk%2Fmedia-centre%2Fnews%2Fmedia-release%2Fpage-7", "href": "https://www.bellwayplc.co.uk/media-centre/news/media-release/page-7" }, { "title": 8, "action": "https://cms.bellwayplc.co.uk/index.php?p=actions/templating/news/news-index&href=https%3A%2F%2Fwww.bellwayplc.co.uk%2Fmedia-centre%2Fnews%2Fmedia-release%2Fpage-8", "href": "https://www.bellwayplc.co.uk/media-centre/news/media-release/page-8" }, { "title": 9, "action": "https://cms.bellwayplc.co.uk/index.php?p=actions/templating/news/news-index&href=https%3A%2F%2Fwww.bellwayplc.co.uk%2Fmedia-centre%2Fnews%2Fmedia-release%2Fpage-9", "href": "https://www.bellwayplc.co.uk/media-centre/news/media-release/page-9" }, { "title": 10, "action": "https://cms.bellwayplc.co.uk/index.php?p=actions/templating/news/news-index&href=https%3A%2F%2Fwww.bellwayplc.co.uk%2Fmedia-centre%2Fnews%2Fmedia-release%2Fpage-10", "href": "https://www.bellwayplc.co.uk/media-centre/news/media-release/page-10" }, { "title": 11, "action": "https://cms.bellwayplc.co.uk/index.php?p=actions/templating/news/news-index&href=https%3A%2F%2Fwww.bellwayplc.co.uk%2Fmedia-centre%2Fnews%2Fmedia-release%2Fpage-11", "href": "https://www.bellwayplc.co.uk/media-centre/news/media-release/page-11" }, { "title": 12, "action": "https://cms.bellwayplc.co.uk/index.php?p=actions/templating/news/news-index&href=https%3A%2F%2Fwww.bellwayplc.co.uk%2Fmedia-centre%2Fnews%2Fmedia-release%2Fpage-12", "href": "https://www.bellwayplc.co.uk/media-centre/news/media-release/page-12" }, { "title": 13, "action": "https://cms.bellwayplc.co.uk/index.php?p=actions/templating/news/news-index&href=https%3A%2F%2Fwww.bellwayplc.co.uk%2Fmedia-centre%2Fnews%2Fmedia-release%2Fpage-13", "href": "https://www.bellwayplc.co.uk/media-centre/news/media-release/page-13" }, { "title": 14, "action": "https://cms.bellwayplc.co.uk/index.php?p=actions/templating/news/news-index&href=https%3A%2F%2Fwww.bellwayplc.co.uk%2Fmedia-centre%2Fnews%2Fmedia-release%2Fpage-14", "href": "https://www.bellwayplc.co.uk/media-centre/news/media-release/page-14" }, { "title": 15, "action": "https://cms.bellwayplc.co.uk/index.php?p=actions/templating/news/news-index&href=https%3A%2F%2Fwww.bellwayplc.co.uk%2Fmedia-centre%2Fnews%2Fmedia-release%2Fpage-15", "href": "https://www.bellwayplc.co.uk/media-centre/news/media-release/page-15" }, { "title": 16, "action": "https://cms.bellwayplc.co.uk/index.php?p=actions/templating/news/news-index&href=https%3A%2F%2Fwww.bellwayplc.co.uk%2Fmedia-centre%2Fnews%2Fmedia-release%2Fpage-16", "href": "https://www.bellwayplc.co.uk/media-centre/news/media-release/page-16" }, { "title": 17, "action": "https://cms.bellwayplc.co.uk/index.php?p=actions/templating/news/news-index&href=https%3A%2F%2Fwww.bellwayplc.co.uk%2Fmedia-centre%2Fnews%2Fmedia-release%2Fpage-17", "href": "https://www.bellwayplc.co.uk/media-centre/news/media-release/page-17" }, { "title": 18, "action": "https://cms.bellwayplc.co.uk/index.php?p=actions/templating/news/news-index&href=https%3A%2F%2Fwww.bellwayplc.co.uk%2Fmedia-centre%2Fnews%2Fmedia-release%2Fpage-18", "href": "https://www.bellwayplc.co.uk/media-centre/news/media-release/page-18" }, { "title": 19, "action": "https://cms.bellwayplc.co.uk/index.php?p=actions/templating/news/news-index&href=https%3A%2F%2Fwww.bellwayplc.co.uk%2Fmedia-centre%2Fnews%2Fmedia-release%2Fpage-19", "href": "https://www.bellwayplc.co.uk/media-centre/news/media-release/page-19" }, { "title": 20, "action": "https://cms.bellwayplc.co.uk/index.php?p=actions/templating/news/news-index&href=https%3A%2F%2Fwww.bellwayplc.co.uk%2Fmedia-centre%2Fnews%2Fmedia-release%2Fpage-20", "href": "https://www.bellwayplc.co.uk/media-centre/news/media-release/page-20" }, { "title": 21, "action": "https://cms.bellwayplc.co.uk/index.php?p=actions/templating/news/news-index&href=https%3A%2F%2Fwww.bellwayplc.co.uk%2Fmedia-centre%2Fnews%2Fmedia-release%2Fpage-21", "href": "https://www.bellwayplc.co.uk/media-centre/news/media-release/page-21" }, { "title": 22, "action": "https://cms.bellwayplc.co.uk/index.php?p=actions/templating/news/news-index&href=https%3A%2F%2Fwww.bellwayplc.co.uk%2Fmedia-centre%2Fnews%2Fmedia-release%2Fpage-22", "href": "https://www.bellwayplc.co.uk/media-centre/news/media-release/page-22" }, { "title": 23, "action": "https://cms.bellwayplc.co.uk/index.php?p=actions/templating/news/news-index&href=https%3A%2F%2Fwww.bellwayplc.co.uk%2Fmedia-centre%2Fnews%2Fmedia-release%2Fpage-23", "href": "https://www.bellwayplc.co.uk/media-centre/news/media-release/page-23" }, { "title": 24, "action": "https://cms.bellwayplc.co.uk/index.php?p=actions/templating/news/news-index&href=https%3A%2F%2Fwww.bellwayplc.co.uk%2Fmedia-centre%2Fnews%2Fmedia-release%2Fpage-24", "href": "https://www.bellwayplc.co.uk/media-centre/news/media-release/page-24" }, { "title": 25, "action": "https://cms.bellwayplc.co.uk/index.php?p=actions/templating/news/news-index&href=https%3A%2F%2Fwww.bellwayplc.co.uk%2Fmedia-centre%2Fnews%2Fmedia-release%2Fpage-25", "href": "https://www.bellwayplc.co.uk/media-centre/news/media-release/page-25" }, { "title": 26, "action": "https://cms.bellwayplc.co.uk/index.php?p=actions/templating/news/news-index&href=https%3A%2F%2Fwww.bellwayplc.co.uk%2Fmedia-centre%2Fnews%2Fmedia-release%2Fpage-26", "href": "https://www.bellwayplc.co.uk/media-centre/news/media-release/page-26" }, { "title": 27, "action": "https://cms.bellwayplc.co.uk/index.php?p=actions/templating/news/news-index&href=https%3A%2F%2Fwww.bellwayplc.co.uk%2Fmedia-centre%2Fnews%2Fmedia-release%2Fpage-27", "href": "https://www.bellwayplc.co.uk/media-centre/news/media-release/page-27" }, { "title": 28, "action": "https://cms.bellwayplc.co.uk/index.php?p=actions/templating/news/news-index&href=https%3A%2F%2Fwww.bellwayplc.co.uk%2Fmedia-centre%2Fnews%2Fmedia-release%2Fpage-28", "href": "https://www.bellwayplc.co.uk/media-centre/news/media-release/page-28" }, { "title": 29, "action": "https://cms.bellwayplc.co.uk/index.php?p=actions/templating/news/news-index&href=https%3A%2F%2Fwww.bellwayplc.co.uk%2Fmedia-centre%2Fnews%2Fmedia-release%2Fpage-29", "href": "https://www.bellwayplc.co.uk/media-centre/news/media-release/page-29" }, { "title": 30, "action": "https://cms.bellwayplc.co.uk/index.php?p=actions/templating/news/news-index&href=https%3A%2F%2Fwww.bellwayplc.co.uk%2Fmedia-centre%2Fnews%2Fmedia-release%2Fpage-30", "href": "https://www.bellwayplc.co.uk/media-centre/news/media-release/page-30" }, { "title": 31, "action": "https://cms.bellwayplc.co.uk/index.php?p=actions/templating/news/news-index&href=https%3A%2F%2Fwww.bellwayplc.co.uk%2Fmedia-centre%2Fnews%2Fmedia-release%2Fpage-31", "href": "https://www.bellwayplc.co.uk/media-centre/news/media-release/page-31" }, { "title": 32, "action": "https://cms.bellwayplc.co.uk/index.php?p=actions/templating/news/news-index&href=https%3A%2F%2Fwww.bellwayplc.co.uk%2Fmedia-centre%2Fnews%2Fmedia-release%2Fpage-32", "href": "https://www.bellwayplc.co.uk/media-centre/news/media-release/page-32" }, { "title": 33, "action": "https://cms.bellwayplc.co.uk/index.php?p=actions/templating/news/news-index&href=https%3A%2F%2Fwww.bellwayplc.co.uk%2Fmedia-centre%2Fnews%2Fmedia-release%2Fpage-33", "href": "https://www.bellwayplc.co.uk/media-centre/news/media-release/page-33" }, { "title": 34, "action": "https://cms.bellwayplc.co.uk/index.php?p=actions/templating/news/news-index&href=https%3A%2F%2Fwww.bellwayplc.co.uk%2Fmedia-centre%2Fnews%2Fmedia-release%2Fpage-34", "href": "https://www.bellwayplc.co.uk/media-centre/news/media-release/page-34" }, { "title": 35, "action": "https://cms.bellwayplc.co.uk/index.php?p=actions/templating/news/news-index&href=https%3A%2F%2Fwww.bellwayplc.co.uk%2Fmedia-centre%2Fnews%2Fmedia-release%2Fpage-35", "href": "https://www.bellwayplc.co.uk/media-centre/news/media-release/page-35" }, { "title": 36, "action": "https://cms.bellwayplc.co.uk/index.php?p=actions/templating/news/news-index&href=https%3A%2F%2Fwww.bellwayplc.co.uk%2Fmedia-centre%2Fnews%2Fmedia-release%2Fpage-36", "href": "https://www.bellwayplc.co.uk/media-centre/news/media-release/page-36" }, { "title": 37, "action": "https://cms.bellwayplc.co.uk/index.php?p=actions/templating/news/news-index&href=https%3A%2F%2Fwww.bellwayplc.co.uk%2Fmedia-centre%2Fnews%2Fmedia-release%2Fpage-37", "href": "https://www.bellwayplc.co.uk/media-centre/news/media-release/page-37" }, { "title": 38, "action": "https://cms.bellwayplc.co.uk/index.php?p=actions/templating/news/news-index&href=https%3A%2F%2Fwww.bellwayplc.co.uk%2Fmedia-centre%2Fnews%2Fmedia-release%2Fpage-38", "href": "https://www.bellwayplc.co.uk/media-centre/news/media-release/page-38" }, { "title": 39, "action": "https://cms.bellwayplc.co.uk/index.php?p=actions/templating/news/news-index&href=https%3A%2F%2Fwww.bellwayplc.co.uk%2Fmedia-centre%2Fnews%2Fmedia-release%2Fpage-39", "href": "https://www.bellwayplc.co.uk/media-centre/news/media-release/page-39" }, { "title": 40, "action": "https://cms.bellwayplc.co.uk/index.php?p=actions/templating/news/news-index&href=https%3A%2F%2Fwww.bellwayplc.co.uk%2Fmedia-centre%2Fnews%2Fmedia-release%2Fpage-40", "href": "https://www.bellwayplc.co.uk/media-centre/news/media-release/page-40" }, { "title": 41, "action": "https://cms.bellwayplc.co.uk/index.php?p=actions/templating/news/news-index&href=https%3A%2F%2Fwww.bellwayplc.co.uk%2Fmedia-centre%2Fnews%2Fmedia-release%2Fpage-41", "href": "https://www.bellwayplc.co.uk/media-centre/news/media-release/page-41" }, { "title": 42, "action": "https://cms.bellwayplc.co.uk/index.php?p=actions/templating/news/news-index&href=https%3A%2F%2Fwww.bellwayplc.co.uk%2Fmedia-centre%2Fnews%2Fmedia-release%2Fpage-42", "href": "https://www.bellwayplc.co.uk/media-centre/news/media-release/page-42" }, { "title": 43, "action": "https://cms.bellwayplc.co.uk/index.php?p=actions/templating/news/news-index&href=https%3A%2F%2Fwww.bellwayplc.co.uk%2Fmedia-centre%2Fnews%2Fmedia-release%2Fpage-43", "href": "https://www.bellwayplc.co.uk/media-centre/news/media-release/page-43" }, { "title": 44, "action": "https://cms.bellwayplc.co.uk/index.php?p=actions/templating/news/news-index&href=https%3A%2F%2Fwww.bellwayplc.co.uk%2Fmedia-centre%2Fnews%2Fmedia-release%2Fpage-44", "href": "https://www.bellwayplc.co.uk/media-centre/news/media-release/page-44" }, { "title": 45, "action": "https://cms.bellwayplc.co.uk/index.php?p=actions/templating/news/news-index&href=https%3A%2F%2Fwww.bellwayplc.co.uk%2Fmedia-centre%2Fnews%2Fmedia-release%2Fpage-45", "href": "https://www.bellwayplc.co.uk/media-centre/news/media-release/page-45" }, { "title": 46, "action": "https://cms.bellwayplc.co.uk/index.php?p=actions/templating/news/news-index&href=https%3A%2F%2Fwww.bellwayplc.co.uk%2Fmedia-centre%2Fnews%2Fmedia-release%2Fpage-46", "href": "https://www.bellwayplc.co.uk/media-centre/news/media-release/page-46" }, { "title": 47, "action": "https://cms.bellwayplc.co.uk/index.php?p=actions/templating/news/news-index&href=https%3A%2F%2Fwww.bellwayplc.co.uk%2Fmedia-centre%2Fnews%2Fmedia-release%2Fpage-47", "href": "https://www.bellwayplc.co.uk/media-centre/news/media-release/page-47" }, { "title": 48, "action": "https://cms.bellwayplc.co.uk/index.php?p=actions/templating/news/news-index&href=https%3A%2F%2Fwww.bellwayplc.co.uk%2Fmedia-centre%2Fnews%2Fmedia-release%2Fpage-48", "href": "https://www.bellwayplc.co.uk/media-centre/news/media-release/page-48" }, { "title": 49, "action": "https://cms.bellwayplc.co.uk/index.php?p=actions/templating/news/news-index&href=https%3A%2F%2Fwww.bellwayplc.co.uk%2Fmedia-centre%2Fnews%2Fmedia-release%2Fpage-49", "href": "https://www.bellwayplc.co.uk/media-centre/news/media-release/page-49" }, { "title": 50, "action": "https://cms.bellwayplc.co.uk/index.php?p=actions/templating/news/news-index&href=https%3A%2F%2Fwww.bellwayplc.co.uk%2Fmedia-centre%2Fnews%2Fmedia-release%2Fpage-50", "href": "https://www.bellwayplc.co.uk/media-centre/news/media-release/page-50" }, { "title": 51, "action": "https://cms.bellwayplc.co.uk/index.php?p=actions/templating/news/news-index&href=https%3A%2F%2Fwww.bellwayplc.co.uk%2Fmedia-centre%2Fnews%2Fmedia-release%2Fpage-51", "href": "https://www.bellwayplc.co.uk/media-centre/news/media-release/page-51" }, { "title": 52, "action": "https://cms.bellwayplc.co.uk/index.php?p=actions/templating/news/news-index&href=https%3A%2F%2Fwww.bellwayplc.co.uk%2Fmedia-centre%2Fnews%2Fmedia-release%2Fpage-52", "href": "https://www.bellwayplc.co.uk/media-centre/news/media-release/page-52" }, { "title": 53, "action": "https://cms.bellwayplc.co.uk/index.php?p=actions/templating/news/news-index&href=https%3A%2F%2Fwww.bellwayplc.co.uk%2Fmedia-centre%2Fnews%2Fmedia-release%2Fpage-53", "href": "https://www.bellwayplc.co.uk/media-centre/news/media-release/page-53" }, { "title": 54, "action": "https://cms.bellwayplc.co.uk/index.php?p=actions/templating/news/news-index&href=https%3A%2F%2Fwww.bellwayplc.co.uk%2Fmedia-centre%2Fnews%2Fmedia-release%2Fpage-54", "href": "https://www.bellwayplc.co.uk/media-centre/news/media-release/page-54" }, { "title": 55, "action": "https://cms.bellwayplc.co.uk/index.php?p=actions/templating/news/news-index&href=https%3A%2F%2Fwww.bellwayplc.co.uk%2Fmedia-centre%2Fnews%2Fmedia-release%2Fpage-55", "href": "https://www.bellwayplc.co.uk/media-centre/news/media-release/page-55" }, { "title": 56, "action": "https://cms.bellwayplc.co.uk/index.php?p=actions/templating/news/news-index&href=https%3A%2F%2Fwww.bellwayplc.co.uk%2Fmedia-centre%2Fnews%2Fmedia-release%2Fpage-56", "href": "https://www.bellwayplc.co.uk/media-centre/news/media-release/page-56" }, { "title": 57, "action": "https://cms.bellwayplc.co.uk/index.php?p=actions/templating/news/news-index&href=https%3A%2F%2Fwww.bellwayplc.co.uk%2Fmedia-centre%2Fnews%2Fmedia-release%2Fpage-57", "href": "https://www.bellwayplc.co.uk/media-centre/news/media-release/page-57" }, { "title": 58, "action": "https://cms.bellwayplc.co.uk/index.php?p=actions/templating/news/news-index&href=https%3A%2F%2Fwww.bellwayplc.co.uk%2Fmedia-centre%2Fnews%2Fmedia-release%2Fpage-58", "href": "https://www.bellwayplc.co.uk/media-centre/news/media-release/page-58" }, { "title": 59, "action": "https://cms.bellwayplc.co.uk/index.php?p=actions/templating/news/news-index&href=https%3A%2F%2Fwww.bellwayplc.co.uk%2Fmedia-centre%2Fnews%2Fmedia-release%2Fpage-59", "href": "https://www.bellwayplc.co.uk/media-centre/news/media-release/page-59" }, { "title": 60, "action": "https://cms.bellwayplc.co.uk/index.php?p=actions/templating/news/news-index&href=https%3A%2F%2Fwww.bellwayplc.co.uk%2Fmedia-centre%2Fnews%2Fmedia-release%2Fpage-60", "href": "https://www.bellwayplc.co.uk/media-centre/news/media-release/page-60" }, { "title": 61, "action": "https://cms.bellwayplc.co.uk/index.php?p=actions/templating/news/news-index&href=https%3A%2F%2Fwww.bellwayplc.co.uk%2Fmedia-centre%2Fnews%2Fmedia-release%2Fpage-61", "href": "https://www.bellwayplc.co.uk/media-centre/news/media-release/page-61" }, { "title": 62, "action": "https://cms.bellwayplc.co.uk/index.php?p=actions/templating/news/news-index&href=https%3A%2F%2Fwww.bellwayplc.co.uk%2Fmedia-centre%2Fnews%2Fmedia-release%2Fpage-62", "href": "https://www.bellwayplc.co.uk/media-centre/news/media-release/page-62" }, { "title": 63, "action": "https://cms.bellwayplc.co.uk/index.php?p=actions/templating/news/news-index&href=https%3A%2F%2Fwww.bellwayplc.co.uk%2Fmedia-centre%2Fnews%2Fmedia-release%2Fpage-63", "href": "https://www.bellwayplc.co.uk/media-centre/news/media-release/page-63" }, { "title": 64, "action": "https://cms.bellwayplc.co.uk/index.php?p=actions/templating/news/news-index&href=https%3A%2F%2Fwww.bellwayplc.co.uk%2Fmedia-centre%2Fnews%2Fmedia-release%2Fpage-64", "href": "https://www.bellwayplc.co.uk/media-centre/news/media-release/page-64" }, { "title": 65, "action": "https://cms.bellwayplc.co.uk/index.php?p=actions/templating/news/news-index&href=https%3A%2F%2Fwww.bellwayplc.co.uk%2Fmedia-centre%2Fnews%2Fmedia-release%2Fpage-65", "href": "https://www.bellwayplc.co.uk/media-centre/news/media-release/page-65" }, { "title": 66, "action": "https://cms.bellwayplc.co.uk/index.php?p=actions/templating/news/news-index&href=https%3A%2F%2Fwww.bellwayplc.co.uk%2Fmedia-centre%2Fnews%2Fmedia-release%2Fpage-66", "href": "https://www.bellwayplc.co.uk/media-centre/news/media-release/page-66" }, { "title": 67, "action": "https://cms.bellwayplc.co.uk/index.php?p=actions/templating/news/news-index&href=https%3A%2F%2Fwww.bellwayplc.co.uk%2Fmedia-centre%2Fnews%2Fmedia-release%2Fpage-67", "href": "https://www.bellwayplc.co.uk/media-centre/news/media-release/page-67" }, { "title": 68, "action": "https://cms.bellwayplc.co.uk/index.php?p=actions/templating/news/news-index&href=https%3A%2F%2Fwww.bellwayplc.co.uk%2Fmedia-centre%2Fnews%2Fmedia-release%2Fpage-68", "href": "https://www.bellwayplc.co.uk/media-centre/news/media-release/page-68" }, { "title": 69, "action": "https://cms.bellwayplc.co.uk/index.php?p=actions/templating/news/news-index&href=https%3A%2F%2Fwww.bellwayplc.co.uk%2Fmedia-centre%2Fnews%2Fmedia-release%2Fpage-69", "href": "https://www.bellwayplc.co.uk/media-centre/news/media-release/page-69" }, { "title": 70, "action": "https://cms.bellwayplc.co.uk/index.php?p=actions/templating/news/news-index&href=https%3A%2F%2Fwww.bellwayplc.co.uk%2Fmedia-centre%2Fnews%2Fmedia-release%2Fpage-70", "href": "https://www.bellwayplc.co.uk/media-centre/news/media-release/page-70" }, { "title": 71, "action": "https://cms.bellwayplc.co.uk/index.php?p=actions/templating/news/news-index&href=https%3A%2F%2Fwww.bellwayplc.co.uk%2Fmedia-centre%2Fnews%2Fmedia-release%2Fpage-71", "href": "https://www.bellwayplc.co.uk/media-centre/news/media-release/page-71" }, { "title": 72, "action": "https://cms.bellwayplc.co.uk/index.php?p=actions/templating/news/news-index&href=https%3A%2F%2Fwww.bellwayplc.co.uk%2Fmedia-centre%2Fnews%2Fmedia-release%2Fpage-72", "href": "https://www.bellwayplc.co.uk/media-centre/news/media-release/page-72" }, { "title": 73, "action": "https://cms.bellwayplc.co.uk/index.php?p=actions/templating/news/news-index&href=https%3A%2F%2Fwww.bellwayplc.co.uk%2Fmedia-centre%2Fnews%2Fmedia-release%2Fpage-73", "href": "https://www.bellwayplc.co.uk/media-centre/news/media-release/page-73" }, { "title": 74, "action": "https://cms.bellwayplc.co.uk/index.php?p=actions/templating/news/news-index&href=https%3A%2F%2Fwww.bellwayplc.co.uk%2Fmedia-centre%2Fnews%2Fmedia-release%2Fpage-74", "href": "https://www.bellwayplc.co.uk/media-centre/news/media-release/page-74" }, { "title": 75, "action": "https://cms.bellwayplc.co.uk/index.php?p=actions/templating/news/news-index&href=https%3A%2F%2Fwww.bellwayplc.co.uk%2Fmedia-centre%2Fnews%2Fmedia-release%2Fpage-75", "href": "https://www.bellwayplc.co.uk/media-centre/news/media-release/page-75" }, { "title": 76, "action": "https://cms.bellwayplc.co.uk/index.php?p=actions/templating/news/news-index&href=https%3A%2F%2Fwww.bellwayplc.co.uk%2Fmedia-centre%2Fnews%2Fmedia-release%2Fpage-76", "href": "https://www.bellwayplc.co.uk/media-centre/news/media-release/page-76" }, { "title": 77, "action": "https://cms.bellwayplc.co.uk/index.php?p=actions/templating/news/news-index&href=https%3A%2F%2Fwww.bellwayplc.co.uk%2Fmedia-centre%2Fnews%2Fmedia-release%2Fpage-77", "href": "https://www.bellwayplc.co.uk/media-centre/news/media-release/page-77" }, { "title": 78, "action": "https://cms.bellwayplc.co.uk/index.php?p=actions/templating/news/news-index&href=https%3A%2F%2Fwww.bellwayplc.co.uk%2Fmedia-centre%2Fnews%2Fmedia-release%2Fpage-78", "href": "https://www.bellwayplc.co.uk/media-centre/news/media-release/page-78" }, { "title": 79, "action": "https://cms.bellwayplc.co.uk/index.php?p=actions/templating/news/news-index&href=https%3A%2F%2Fwww.bellwayplc.co.uk%2Fmedia-centre%2Fnews%2Fmedia-release%2Fpage-79", "href": "https://www.bellwayplc.co.uk/media-centre/news/media-release/page-79" }, { "title": 80, "action": "https://cms.bellwayplc.co.uk/index.php?p=actions/templating/news/news-index&href=https%3A%2F%2Fwww.bellwayplc.co.uk%2Fmedia-centre%2Fnews%2Fmedia-release%2Fpage-80", "href": "https://www.bellwayplc.co.uk/media-centre/news/media-release/page-80" }, { "title": 81, "action": "https://cms.bellwayplc.co.uk/index.php?p=actions/templating/news/news-index&href=https%3A%2F%2Fwww.bellwayplc.co.uk%2Fmedia-centre%2Fnews%2Fmedia-release%2Fpage-81", "href": "https://www.bellwayplc.co.uk/media-centre/news/media-release/page-81" }, { "title": 82, "action": "https://cms.bellwayplc.co.uk/index.php?p=actions/templating/news/news-index&href=https%3A%2F%2Fwww.bellwayplc.co.uk%2Fmedia-centre%2Fnews%2Fmedia-release%2Fpage-82", "href": "https://www.bellwayplc.co.uk/media-centre/news/media-release/page-82" }, { "title": 83, "action": "https://cms.bellwayplc.co.uk/index.php?p=actions/templating/news/news-index&href=https%3A%2F%2Fwww.bellwayplc.co.uk%2Fmedia-centre%2Fnews%2Fmedia-release%2Fpage-83", "href": "https://www.bellwayplc.co.uk/media-centre/news/media-release/page-83" }, { "title": 84, "action": "https://cms.bellwayplc.co.uk/index.php?p=actions/templating/news/news-index&href=https%3A%2F%2Fwww.bellwayplc.co.uk%2Fmedia-centre%2Fnews%2Fmedia-release%2Fpage-84", "href": "https://www.bellwayplc.co.uk/media-centre/news/media-release/page-84" }, { "title": 85, "action": "https://cms.bellwayplc.co.uk/index.php?p=actions/templating/news/news-index&href=https%3A%2F%2Fwww.bellwayplc.co.uk%2Fmedia-centre%2Fnews%2Fmedia-release%2Fpage-85", "href": "https://www.bellwayplc.co.uk/media-centre/news/media-release/page-85" }, { "title": 86, "action": "https://cms.bellwayplc.co.uk/index.php?p=actions/templating/news/news-index&href=https%3A%2F%2Fwww.bellwayplc.co.uk%2Fmedia-centre%2Fnews%2Fmedia-release%2Fpage-86", "href": "https://www.bellwayplc.co.uk/media-centre/news/media-release/page-86" }, { "title": 87, "action": "https://cms.bellwayplc.co.uk/index.php?p=actions/templating/news/news-index&href=https%3A%2F%2Fwww.bellwayplc.co.uk%2Fmedia-centre%2Fnews%2Fmedia-release%2Fpage-87", "href": "https://www.bellwayplc.co.uk/media-centre/news/media-release/page-87" }, { "title": 88, "action": "https://cms.bellwayplc.co.uk/index.php?p=actions/templating/news/news-index&href=https%3A%2F%2Fwww.bellwayplc.co.uk%2Fmedia-centre%2Fnews%2Fmedia-release%2Fpage-88", "href": "https://www.bellwayplc.co.uk/media-centre/news/media-release/page-88" }, { "title": 89, "action": "https://cms.bellwayplc.co.uk/index.php?p=actions/templating/news/news-index&href=https%3A%2F%2Fwww.bellwayplc.co.uk%2Fmedia-centre%2Fnews%2Fmedia-release%2Fpage-89", "href": "https://www.bellwayplc.co.uk/media-centre/news/media-release/page-89" }, { "title": 90, "action": "https://cms.bellwayplc.co.uk/index.php?p=actions/templating/news/news-index&href=https%3A%2F%2Fwww.bellwayplc.co.uk%2Fmedia-centre%2Fnews%2Fmedia-release%2Fpage-90", "href": "https://www.bellwayplc.co.uk/media-centre/news/media-release/page-90" }, { "title": 91, "action": "https://cms.bellwayplc.co.uk/index.php?p=actions/templating/news/news-index&href=https%3A%2F%2Fwww.bellwayplc.co.uk%2Fmedia-centre%2Fnews%2Fmedia-release%2Fpage-91", "href": "https://www.bellwayplc.co.uk/media-centre/news/media-release/page-91" }, { "title": 92, "action": "https://cms.bellwayplc.co.uk/index.php?p=actions/templating/news/news-index&href=https%3A%2F%2Fwww.bellwayplc.co.uk%2Fmedia-centre%2Fnews%2Fmedia-release%2Fpage-92", "href": "https://www.bellwayplc.co.uk/media-centre/news/media-release/page-92" }, { "title": 93, "action": "https://cms.bellwayplc.co.uk/index.php?p=actions/templating/news/news-index&href=https%3A%2F%2Fwww.bellwayplc.co.uk%2Fmedia-centre%2Fnews%2Fmedia-release%2Fpage-93", "href": "https://www.bellwayplc.co.uk/media-centre/news/media-release/page-93" }, { "title": 94, "action": "https://cms.bellwayplc.co.uk/index.php?p=actions/templating/news/news-index&href=https%3A%2F%2Fwww.bellwayplc.co.uk%2Fmedia-centre%2Fnews%2Fmedia-release%2Fpage-94", "href": "https://www.bellwayplc.co.uk/media-centre/news/media-release/page-94" }, { "title": 95, "action": "https://cms.bellwayplc.co.uk/index.php?p=actions/templating/news/news-index&href=https%3A%2F%2Fwww.bellwayplc.co.uk%2Fmedia-centre%2Fnews%2Fmedia-release%2Fpage-95", "href": "https://www.bellwayplc.co.uk/media-centre/news/media-release/page-95" }, { "title": 96, "action": "https://cms.bellwayplc.co.uk/index.php?p=actions/templating/news/news-index&href=https%3A%2F%2Fwww.bellwayplc.co.uk%2Fmedia-centre%2Fnews%2Fmedia-release%2Fpage-96", "href": "https://www.bellwayplc.co.uk/media-centre/news/media-release/page-96" }, { "title": 97, "action": "https://cms.bellwayplc.co.uk/index.php?p=actions/templating/news/news-index&href=https%3A%2F%2Fwww.bellwayplc.co.uk%2Fmedia-centre%2Fnews%2Fmedia-release%2Fpage-97", "href": "https://www.bellwayplc.co.uk/media-centre/news/media-release/page-97" }, { "title": 98, "action": "https://cms.bellwayplc.co.uk/index.php?p=actions/templating/news/news-index&href=https%3A%2F%2Fwww.bellwayplc.co.uk%2Fmedia-centre%2Fnews%2Fmedia-release%2Fpage-98", "href": "https://www.bellwayplc.co.uk/media-centre/news/media-release/page-98" }, { "title": 99, "action": "https://cms.bellwayplc.co.uk/index.php?p=actions/templating/news/news-index&href=https%3A%2F%2Fwww.bellwayplc.co.uk%2Fmedia-centre%2Fnews%2Fmedia-release%2Fpage-99", "href": "https://www.bellwayplc.co.uk/media-centre/news/media-release/page-99" }, { "title": 100, "action": "https://cms.bellwayplc.co.uk/index.php?p=actions/templating/news/news-index&href=https%3A%2F%2Fwww.bellwayplc.co.uk%2Fmedia-centre%2Fnews%2Fmedia-release%2Fpage-100", "href": "https://www.bellwayplc.co.uk/media-centre/news/media-release/page-100" }, { "title": 101, "action": "https://cms.bellwayplc.co.uk/index.php?p=actions/templating/news/news-index&href=https%3A%2F%2Fwww.bellwayplc.co.uk%2Fmedia-centre%2Fnews%2Fmedia-release%2Fpage-101", "href": "https://www.bellwayplc.co.uk/media-centre/news/media-release/page-101" }, { "title": 102, "action": "https://cms.bellwayplc.co.uk/index.php?p=actions/templating/news/news-index&href=https%3A%2F%2Fwww.bellwayplc.co.uk%2Fmedia-centre%2Fnews%2Fmedia-release%2Fpage-102", "href": "https://www.bellwayplc.co.uk/media-centre/news/media-release/page-102" }, { "title": 103, "action": "https://cms.bellwayplc.co.uk/index.php?p=actions/templating/news/news-index&href=https%3A%2F%2Fwww.bellwayplc.co.uk%2Fmedia-centre%2Fnews%2Fmedia-release%2Fpage-103", "href": "https://www.bellwayplc.co.uk/media-centre/news/media-release/page-103" }, { "title": 104, "action": "https://cms.bellwayplc.co.uk/index.php?p=actions/templating/news/news-index&href=https%3A%2F%2Fwww.bellwayplc.co.uk%2Fmedia-centre%2Fnews%2Fmedia-release%2Fpage-104", "href": "https://www.bellwayplc.co.uk/media-centre/news/media-release/page-104" }, { "title": 105, "action": "https://cms.bellwayplc.co.uk/index.php?p=actions/templating/news/news-index&href=https%3A%2F%2Fwww.bellwayplc.co.uk%2Fmedia-centre%2Fnews%2Fmedia-release%2Fpage-105", "href": "https://www.bellwayplc.co.uk/media-centre/news/media-release/page-105" }, { "title": 106, "action": "https://cms.bellwayplc.co.uk/index.php?p=actions/templating/news/news-index&href=https%3A%2F%2Fwww.bellwayplc.co.uk%2Fmedia-centre%2Fnews%2Fmedia-release%2Fpage-106", "href": "https://www.bellwayplc.co.uk/media-centre/news/media-release/page-106" }, { "title": 107, "action": "https://cms.bellwayplc.co.uk/index.php?p=actions/templating/news/news-index&href=https%3A%2F%2Fwww.bellwayplc.co.uk%2Fmedia-centre%2Fnews%2Fmedia-release%2Fpage-107", "href": "https://www.bellwayplc.co.uk/media-centre/news/media-release/page-107" }, { "title": 108, "action": "https://cms.bellwayplc.co.uk/index.php?p=actions/templating/news/news-index&href=https%3A%2F%2Fwww.bellwayplc.co.uk%2Fmedia-centre%2Fnews%2Fmedia-release%2Fpage-108", "href": "https://www.bellwayplc.co.uk/media-centre/news/media-release/page-108" }, { "title": 109, "action": "https://cms.bellwayplc.co.uk/index.php?p=actions/templating/news/news-index&href=https%3A%2F%2Fwww.bellwayplc.co.uk%2Fmedia-centre%2Fnews%2Fmedia-release%2Fpage-109", "href": "https://www.bellwayplc.co.uk/media-centre/news/media-release/page-109" }, { "title": 110, "action": "https://cms.bellwayplc.co.uk/index.php?p=actions/templating/news/news-index&href=https%3A%2F%2Fwww.bellwayplc.co.uk%2Fmedia-centre%2Fnews%2Fmedia-release%2Fpage-110", "href": "https://www.bellwayplc.co.uk/media-centre/news/media-release/page-110" }, { "title": 111, "action": "https://cms.bellwayplc.co.uk/index.php?p=actions/templating/news/news-index&href=https%3A%2F%2Fwww.bellwayplc.co.uk%2Fmedia-centre%2Fnews%2Fmedia-release%2Fpage-111", "href": "https://www.bellwayplc.co.uk/media-centre/news/media-release/page-111" } ] }

22nd October 2026
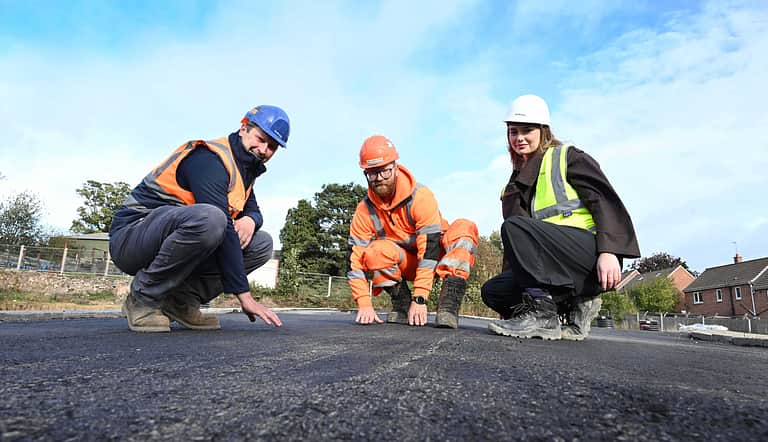
Bellway leads the way in use of pioneering net zero asphalt at County Durham development
Read article

21st October 2026
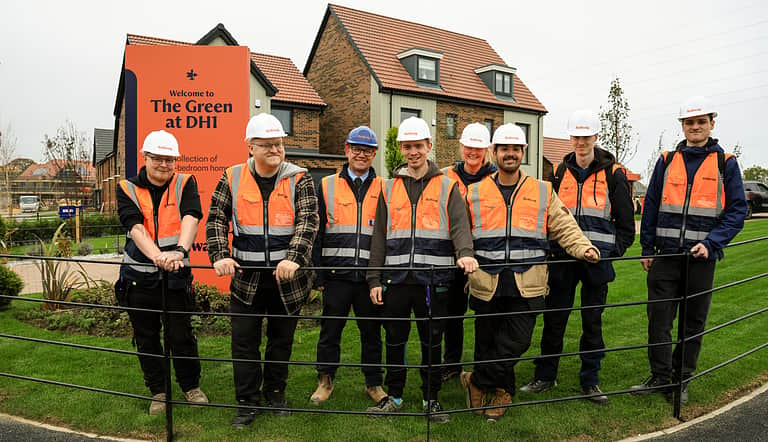
Coalville pupils shine bright thanks to hi-vis vest donation
Read article

21st October 2026
Bellway plans weekend of events to guide first-time buyers after Your First Home details announced
Read article
20th October 2026
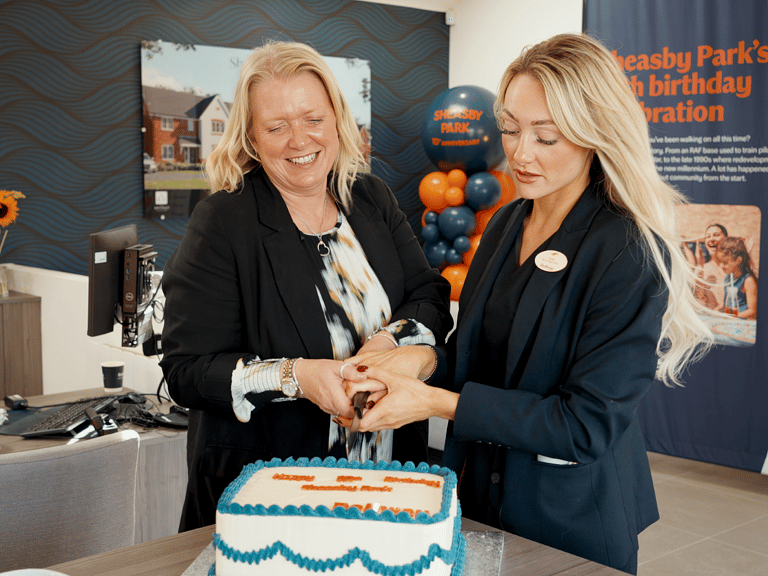
Local community joins 10th anniversary celebrations at Bellway’s Sheasby Park development
Read article

19th October 2026
Bellway provides training tops for team at Thorpe Wood Rangers FC
Read article
13th October 2026
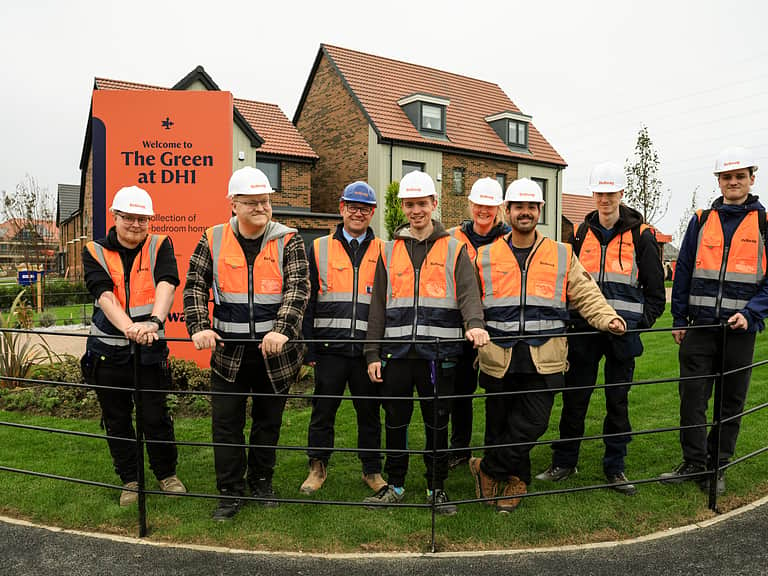
Bellway helps joinery students build on their knowledge in tour of timber-frame homes
Read article

7th October 2026
Bellway North East charity ball raises more than £100,000 for good causes
Read article

6th October 2026
From Barking to Mont Blanc – David takes on alpine challenge in aid of children’s charities
Read article

5th October 2026
Junior football team embarks on toughest test yet with backing from Bellway
Read article
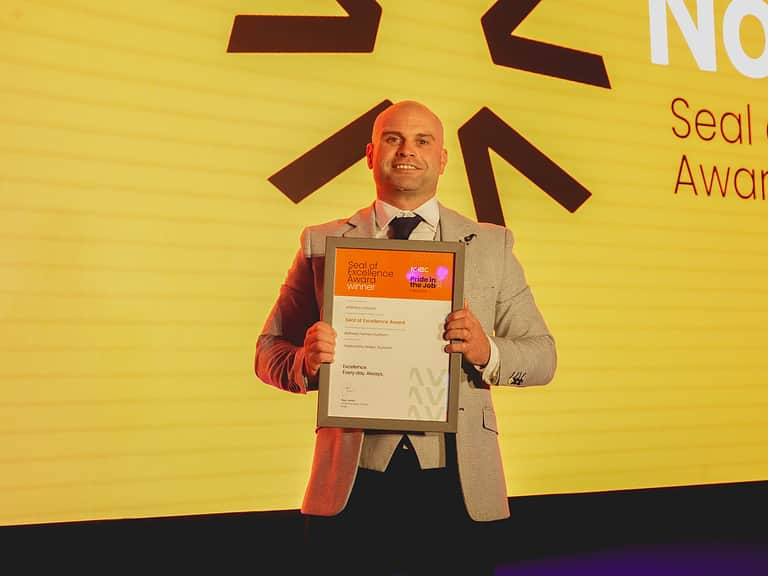
25th September 2026
Second Seal of Excellence in a row for Hedworths Green at Lambton Park site manager
Read article
Prev
1
2
3
…
111
Next
Showing 1-10 of 1102 items
Visit Bellway

Visit Ashberry homes



5-star builder. 10 years in a row. That's lots of happy customers.
Company
Socials
Head office
Bellway p.l.c.
Woolsington House, Woolsington
Newcastle upon Tyne,
NE13 8BF
Copyright © 2026 Bellway