July 30, 2026 26 min to read H1 2026 Highlights: Revenue of €820m in IFRS (+34%) and of €839m on an adjusted[1] basis (+29% and +37% at constant exchange rates and tariffs) Growth in both EMEA and Americas & APAC regions, driven by major retailers…
July 30, 2026 26 min to read
H1 2026 Highlights:
- Revenue of €820m in IFRS (+34%) and of €839m on an adjusted[1] basis (+29% and +37% at constant exchange rates and tariffs)
- Growth in both EMEA and Americas & APAC regions, driven by major retailers expanding their strategic partnerships
- VAS[2] revenue of €125m (+39%), including €61m in recurring VAS[3] (+73%)
- Order entries of €681m in line with expectations, and up +7% in Q2
- 2026 guidance reaffirmed, reflecting confidence in continued profitable growth
- Agreement to acquire In-Store Media (ISM) broadens Vusion’s connected store platform
The following 2026 financial figures are presented under IFRS standards, and also in adjusted terms before IFRS adjustments related to the Walmart U.S. contract, and which do not have a cash impact. The gap between IFRS and adjusted data continues to narrow in 2026 due to the now positive impact of IFRS average selling prices compared to actual invoiced prices. These adjustments are detailed at the end of this release.
scroll to the leftscroll to the right
|
|
|
|
| In €m |
IFRS Sales |
Adjustments due to Walmart contract |
Adjusted Sales1 |
| H1 2026 |
819.8 |
-19.5 |
839.3 |
| H1 2025 |
614.1 |
-35.2 |
649.3 |
| Change (in %) |
+33.5% |
N/A |
+29.3% |
| Unaudited figures |
|
|
|
Commenting on the figures, Thierry Gadou, Chairman and CEO of Vusion, said:
“The first half of 2026 is in line with our targets and confirms the strength of our growth trajectory and the relevance of our platform in supporting the digital transformation of physical commerce. Vusion continued to grow at a sustained pace, driven by the ramp-up of its new EdgeSense technological platform and its VAS business.
The strong growth in recurring VAS revenue demonstrates the strength of our business model. Surpassing the symbolic milestone of half a billion labels managed by VusionCloud marks an important achievement. It further strengthens our ability to transform physical stores into intelligent digital infrastructures, enabling operational excellence, local e-commerce, retail media, and enhanced customer experience.
Our commercial momentum remains positive across our key geographic regions. In Europe, the signing of the strategic partnership with Carrefour marks another major milestone in the large-scale adoption of our next-generation platform. In the Americas region, the successful deployment of EdgeSense at Walmart in the United States, its expansion into Mexico with Walmex, and our robust pipeline of opportunities with leading U.S. retailers confirm Vusion’s technological leadership.
Building on this excellent first half, we are confident in our objectives for the second half and are maintaining our full-year 2026 guidance, with expected adjusted revenue growth of +15% to +20% at constant exchange rates and tariffs, further growth in VAS, and an improvement in our adjusted EBITDA margin.
As retailers accelerate the modernization of their stores, Vusion is establishing itself as the technology partner of choice for transforming physical retail networks into connected, high-performing, intelligent, and data-driven platforms. This momentum reinforces our confidence in our ability to create sustainable value for our customers and to continue delivering profitable growth.”
Sales by region (adjusted1 and IFRS)
scroll to the leftscroll to the right
|
|
|
|
|
|
| In €m |
EMEA |
Rest of World |
|
Total IFRS |
Total adjusted |
| IFRS |
adjusted |
|
|
|
|
| Q1 2026 |
98.7 |
189.9 |
195.2 |
288.6 |
293.9 |
| Q1 2025 |
90.0 |
125.2 |
142.8 |
215.2 |
232.8 |
| Change (in %) |
+9.7% |
+51.7% |
+36.7% |
+34.1% |
+26.2% |
| Q2 2026 |
110.7 |
420.5 |
434.7 |
531.2 |
545.4 |
| Q2 2025 |
107.6 |
291.3 |
308.9 |
398.9 |
416.5 |
| Change (in %) |
+2.9% |
+44.4% |
+40.7% |
+33.1% |
+30.9% |
| H1 2026 |
209.4 |
610.4 |
629.9 |
819.8 |
839.3 |
| H1 2025 |
197.6 |
416.5 |
451.7 |
614.1 |
649.3 |
| Change (in %) |
+6.0% |
+46.6% |
+39.4% |
+33.5% |
+29.3% |
Strong revenue growth in the first semester
In the first half, the Group’s IFRS revenue reached €820m, up +34% compared to the same period in 2025. On an adjusted basis¹, revenue reached €839m, up +29%.
At constant exchange rates and tariffs, adjusted1 revenue growth stood at +37%.
In the EMEA region, adjusted revenue¹ amounted to €209 million, up +6% compared with 2025. Business activity remained solid and evenly distributed across the region – particularly in France, the DACH**[4]** region, the United Kingdom, Scandinavia, Spain and Turkey – while strong order intake growth in the first half bodes well for the remainder of the year.
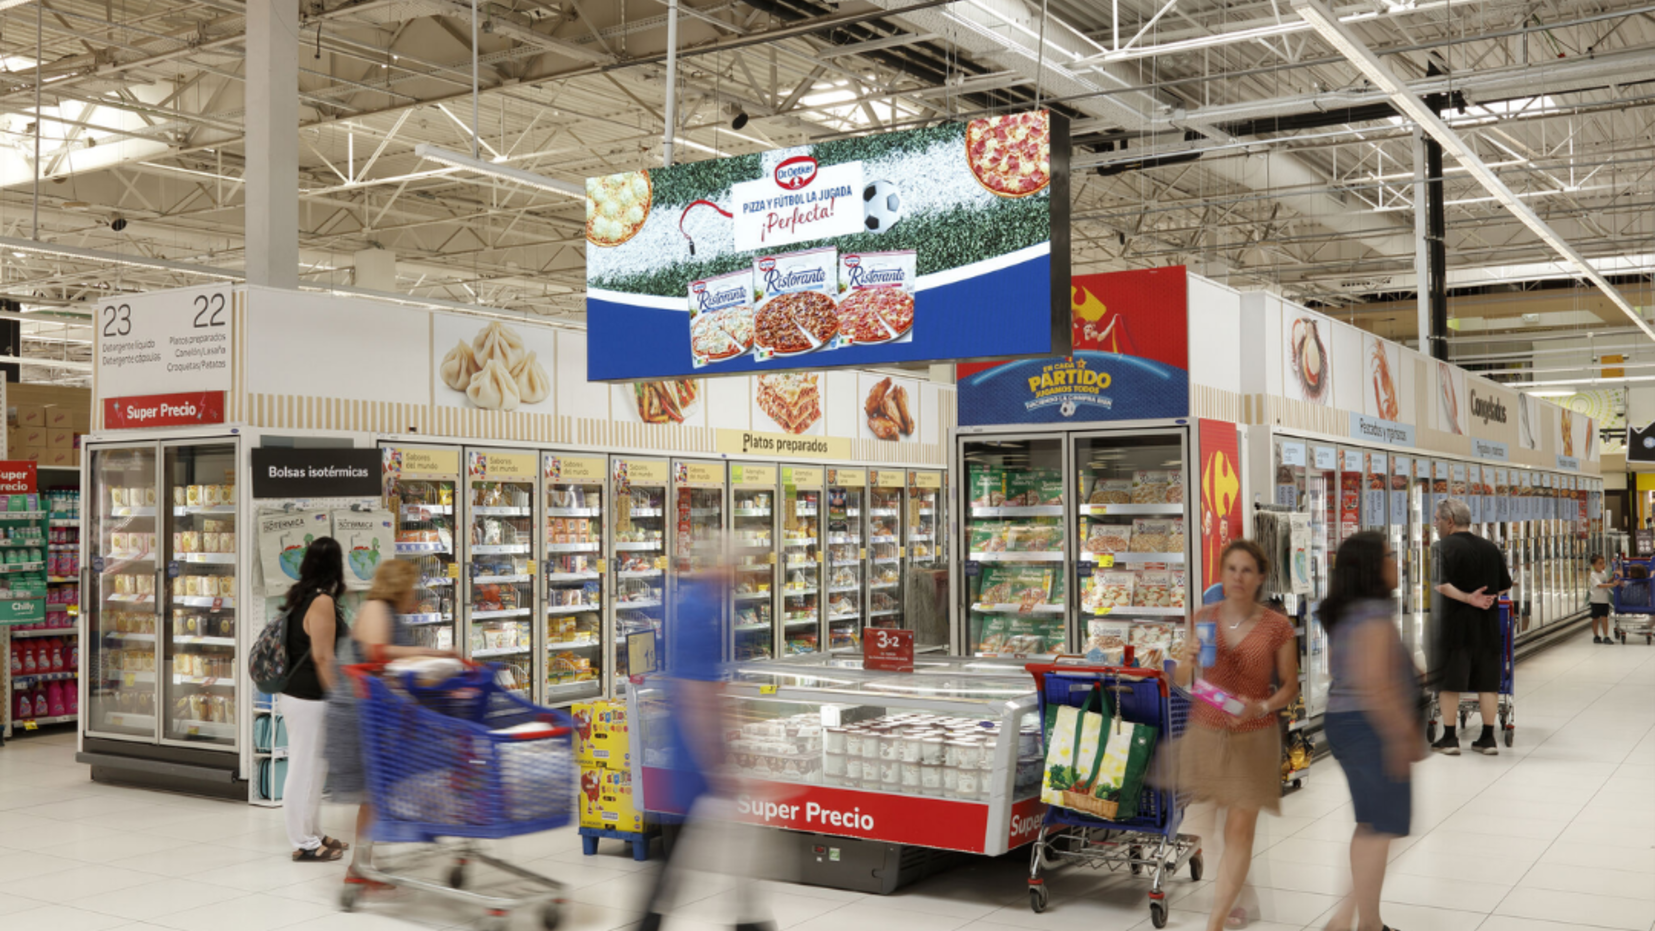
The first half of the year was marked by the signing of a strategic partnership with Carrefour Group, covering the deployment of EdgeSense, VusionCloud, and Captana in hypermarkets and supermarkets in France, with a 3-year exclusivity in Europe.
The Group expects revenue growth of 15% to 20% in the EMEA region for the full year.
The pace at which certain recently signed contracts are ramping up, together with the transition of some pilot projects to EdgeSense, may result in a slight delay in the timing of installations. However, strong prospects for new contract wins, both in the grocery sector and across other verticals, are expected to support growth in the EMEA region during the second half of the year.
In the Americas and Asia-Pacific (or Rest of World region), adjusted revenue¹ reached €630m, up +39% year-on-year.
In the Americas, Vusion continues to demonstrate strong commercial momentum, driven in particular by the successful deployment of EdgeSense at Walmart in the United States. Completion of this phase of the partnership is expected by the end of the year. Other projects involving new solutions and new geographies are underway and will continue driving the activity. In addition, the Group has a significant pipeline of commercial opportunities with major U.S. retailers and anticipates strong adoption momentum in the United States over the coming years.
Order entries
In the second quarter of 2026, order intake increased +7% compared with Q2 2025 and +16% compared with the first quarter of 2026. This performance is consistent with the expected scenario of a growth of order intake for the full-year 2026.
Global order entries reached €681 million in the first half, down 22% compared with the level at the end of June 2025, in line with the Group’s expectations. This decline was primarily attributable to an unfavorable comparison base following the significant orders placed by Walmart in 2025.
Among the contracts announced during the first half, the most significant were those signed with Walmex, Carrefour, and other retailers in the EMEA region, including JYSK, Decathlon, and Gratis. On a rolling twelve-month basis, order intake totaled €1,511 million at the end of the first half of 2026, down 15% compared with the level at the end of June 2025.
On February 18, 2026, Carrefour, another one of the world’s leading food retailers, and Vusion announced the signing of a strategic partnership. As part of its “Carrefour 2030” plan, Carrefour has selected the Vusion platform to digitalize all its hypermarkets and supermarkets in France by 2030. This major industrial partnership covers the deployment of latest-generation electronic shelf labels, smart rails, and AI-driven cameras to transform operational efficiency and the in-store customer experience.
On March 30, 2026, Walmart expanded its strategic partnership with Vusion to deploy the EdgeSense platform in Mexico – Walmart’s first market outside the United States – across Walmex Express stores and Supercenters. This expansion reinforces the global strategic partnership between Walmart and Vusion, which expands now on several geographies, solutions and innovation projects.
This momentum confirms the unique relevance of the Vusion solutions and their positive impact in terms of operational excellence, e-Commerce performance, retail media and shopper engagement. Vusion has become a trusted partner to the world’s leading retailers, helping them transform their stores and improve both customer and associate experiences through the digitalization of their physical stores.
On June 16, 2026, Vusion announced the expansion of its long-standing partnership with JYSK, one of Europe’s leading home furnishing retailers, through a major new agreement supporting the retailer’s next phase of store modernization and cloud transformation strategy. The agreement includes the upgrade of electronic shelf labels across JYSK’s already deployed 450 Nordic stores, the roll-out of Vusion solutions in 750 additional stores across Europe, and the full migration of JYSK’s legacy on-premise platform to VusionCloud. By 2027, the deployment is expected to scale to approximately 2,500 stores across the Nordic, DACH4 and Benelux regions.
On June 23, 2026, Vusion announced that Gratis, one of Turkey’s leading beauty and personal care retailers serving millions of customers through a strong nationwide store footprint, has selected the Vusion platform to support the next phase of its store digitalization strategy. The agreement covers the deployment of approximately 2 million electronic shelf labels (ESLs) across 300 stores in Turkey as part of the first phase of the rollout.
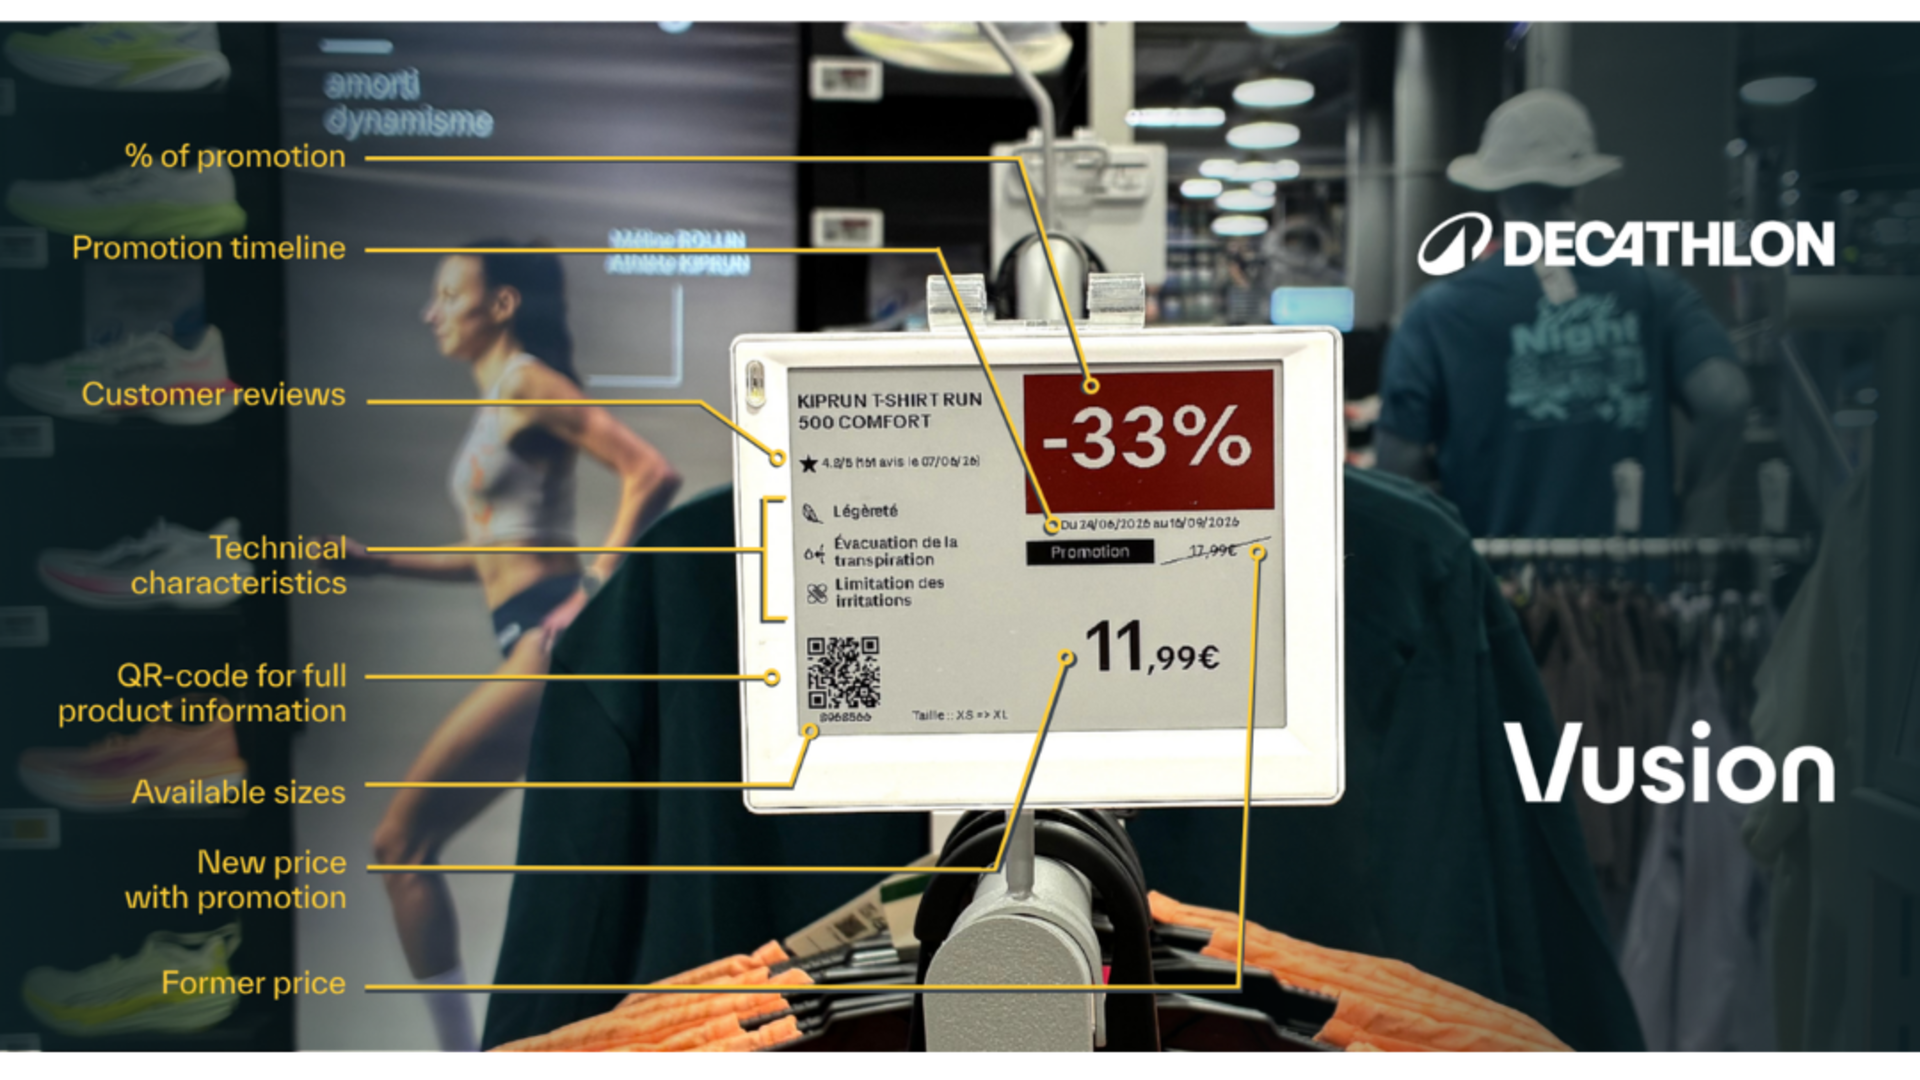
On July 15, 2026, Vusion announced that Decathlon reached the milestone of 700 stores equipped with its digital solutions during the second quarter of 2026. The deployment now spans 54 countries across three continents (Europe, South America, and Asia-Pacific), making the sporting goods retailer Vusion’s most internationally deployed customer to date.
VAS2 activity
VAS2 revenue reached €125 million in the first semester, representing strong growth of +39%.
During the period, VAS accounted for approximately 15% of the Group’s total revenue.
Recurring3 VAS revenue reached €61 million, up sharply by +73% compared to the first semester of 2025, particularly driven by a strong momentum in VusionCloud.
The VusionCloud installed base grew strongly in the first semester, reaching 522 million connected ESLs and surpassing the symbolic milestone of half a billion connected ESLs. This strong momentum is expected to continue throughout 2026. For reference, as of the end of June 2025, the cloud installed base stood at 220 million connected ESLs.
On an annualized basis, recurring VAS revenue reached €133 million in Q2, up +83% year over year.
Another example of VAS momentum was the sharp increase in Captana order intake (reaching several tens of millions of euros for the first time).
Finally, Vusion announced recently an agreement to acquire In-Store Media, which will accelerate one of the main pillars of the Group’s VAS strategy and connected store vision, which is Retail Media.
Acquisition of In-Store Media (Post-Closing Event)
On July 27, 2026, Vusion announced it had entered into an agreement to acquire In-Store Media (ISM), accelerating the creation of a platform for digital in-store retail media and advertising. This proposed acquisition would enhance its position in connected commerce and promote retail media as a core pillar of its connected store vision.
Headquartered in Barcelona (Spain), ISM a well-established in-store retail media company, which brings deep expertise in designing effective in-store retail media networks, proven execution, long-standing relationships with 90 retail banners and more than 1,600 brands, as well as a strong international track record in 9 countries across EMEA, Americas and APAC.
In 2025, the company generated revenue of approximately €120 million with a robust profitability. ISM has developed over time a wide and flexible portfolio of over 50 media solutions both print and digital to cover advertisers needs.
Together, Vusion and In-Store Media aim to build a new platform for digital in-store retail media, connecting retailers, brands, and shoppers through measurable and real-time in-store activation.
The proposed transaction has been approved by the Board of Directors. Completion remains subject to customary regulatory approvals and other customary closing conditions. The transaction is expected to be financed with debt.
2026 Guidance confirmed
Vusion confirms the growth and profitability targets announced during the publication of its annual results on February 26:
- Group Revenue growth of +15% to +20% on an adjusted1 basis and at constant exchange rates and tariffs
- Around +40% strong VAS revenue growth
- An adjusted1 EBITDA margin increase of more than 100 basis points
- Continued positive operating free cash flow (EBITDA – Capex) generation
The currently anticipated timing for the completion of the In-Store Media acquisition is expected to have only a limited impact on the Group’s revenue in 2026.
Impact of U.S. Tariffs
At the beginning of the second half of the year, the Group started receiving refunds of import duties, primarily those paid in 2025, following the U.S. Supreme Court’s decision to invalidate tariffs that had previously been imposed on certain products imported into the United States.
To date, the Group has received approximately US$60 million in tariff refunds during July. Over the full year, the total amount could reach approximately US$80 million.
As previously indicated, the Group had passed through a significant portion of these tariffs to customers where contractual arrangements allowed it. In such cases, the reimbursement of these tariffs by the U.S. Administration, and their subsequent reimbursement to the Group’s customers, will be recognized through credit notes. As a result, both cost of goods sold and revenue will be reduced retrospectively in the 2026 financial statements, with no impact on gross margin or cash position.
The Group’s 2026 guidance was established at constant exchange rates and tariffs compared with 2025, and the Group confirms its guidance. However, it should be noted that reported IFRS and adjusted revenue growth may come in below the guided range, reflecting the revenue credit notes to be recognized in respect of tariffs that were primarily recharged to customers in 2025.
Employee share ownership
Following the Annual General Meeting of June 4, 2026 and the approval of the Board of Directors at its meeting on July 30, 2026, Vusion is proud to continue its employee share ownership policy by granting free shares subject to performance conditions to all team members meeting the eligibility criteria, with more than 91% of the workforce covered this year. This policy is an effective driver of long-term motivation and loyalty among the Group’s employees.
Capital Markets Day Scheduled for November 2026
Vusion will host a Capital Markets Day in Paris on November 18, 2026, where the Group will present its new strategic plan.
Conference with Management on July 30, 2026 at 6pm CET
Click on this link
to access the live webcast.
The slideshow as well as a replay of the event will be available on Vusion’s investor website: https://investor.vusion.com
Financial Calendar 2026
- September 21, 2026 (after market): H1 2026 Results
- October 20, 2026 (after market): Q3 2026 Sales
Forthcoming investor events
- November 18, 2026: Capital Markets Day in Paris
- November 19, 2026: Bank of America Consumer Conference in Paris
- November 24, 2026: Investir Day Forum in Paris (dedicated to retail investors)
- November 30, 2026: Berenberg European Conference in London
Note on the IFRS Restatements related to the Walmart contract
Several IFRS restatements related to the Walmart contract impact 2026 financial disclosures:
1. On June 2, 2023, at their Annual General Meeting, the Group’s shareholders approved a grant to Walmart of 1,761,200 of stock warrants on the Group’s shares. According to IFRS standards, the fair value of these warrants should be calculated. On June 2, 2023, the fair value of the warrants was established at €163m. A contract asset and a financial debt were thus recorded in the consolidated accounts for this amount.
The contract asset, which is fixed amount, is amortized in proportion to the projected revenue generated by Walmart over the estimated period necessary for Walmart to reach a level of spending of $3 billion with the Group. This impact in terms of reduced turnover is conventional because the only potential effect of the BSAs will be a dilution that has already been simulated and communicated when these BSAs are granted at the beginning of June 2023; it does not impact the turnover invoiced to Walmart. This restatement has no effect on the Group’s cash position. It has an impact on revenue and also on all the aggregates of the Group’s income statement, in the same proportions. This negative impact will continue to have an impact on the Group’s IFRS accounts until Walmart has spent $3 billion with the Group and in proportion to the revenue generated by this contract.
Financial debt is subject to a revaluation at each closing date depending in particular on the number of exercisable warrants and the stock market price of the Vusion share. Any variation is recorded in the Group’s consolidated financial statements. The Group will continue to communicate the impact of this IFRS restatement on revenue and net income at each closing.
2. The impact of future price reductions indexed to the volumes agreed upon with Walmart from the first deliveries of electronic shelf labels (ESLs): The cost of the Group’s hardware solutions is a function of the volume manufactured. A significant increase in volume might thus lead to lower cost. Therefore, it has been agreed with this customer that they will be granted price reductions in relation to the future sales volume to which they contribute. The IFRS standard (IFRS 15) requires prices to be averaged over the life of the contract. The application of this restatement impacts reported revenue (IFRS) and the margin by -€2.0m compared to the revenue invoiced, even though price reductions will only be granted if and when volumes will have reached certain thresholds. The application of this standard has a negative impact on revenue and all income statement lines, down to net profit.
3. The impact of the application of IAS 21 to the reciprocal debt and receivables between the parent company and its US subsidiary related to the financing of production lines for Walmart.
4. The effect of deferred taxes relating to these adjustments.
Glossary
EBITDA
The Group considers EBITDA to be a performance indicator that presents operating income before depreciation and amortization of fixed assets, adjusted for some items during the period that affect comparability with previous reporting periods. It also represents a good approximation of the cash flow generated by operating activities before taking into account investments and changes in working capital. Consequently, restatements include significant non-recurring items or items that will never lead to a cash disbursement.
Operating Free Cash-Flow
The Group considers Operating Free Cash-Flow to be a performance indicator that is calculated based on the following items: Adjusted EBITDA (-) Capital Expenditure
Operating Free Cash-Flow is a good indicator of the Group’s cash generation as it is calculated before the impact of changes in working capital requirements, particularly (i) downpayments, which can be significant on large deployment contracts, and (ii) the prefinancing of capex by clients.
Order entries
Order entries represent the year-to-date cumulative value of ESL orders received from customers. These orders are valued based on negotiated selling prices, i.e. before any impact of IFRS 15. Order intake also includes year-to-date VAS revenues.
Important Disclaimer
This press release contains unaudited financial data. The aggregates presented are those normally used and communicated on markets by Vusion. These statements include financial projections, synergies, estimates and their underlying assumptions, statements regarding plans, expectations and objectives with respect to future operations, products and services, and statements regarding future performance. Such statements do not constitute forecasts regarding Vusion’s results or any other performance indicator, but rather trends or targets, as the case may be. No guarantee can be given as to the achievement of such forward-looking statements and information. Investors and holders of Vusion securities are cautioned that forward-looking information and statements are subject to various risks and uncertainties, which are difficult to predict and generally beyond the control of Vusion, and that such risks and uncertainties may entail results and developments that differ materially from those stated or implied in forward-looking information and statements. These risks and uncertainties include, but are not limited to, those discussed or identified in the public documents filed with the Autorité des Marchés Financiers (AMF), the French Financial Markets Authority. Investors and holders of Vusion securities should consider that the occurrence of some or all of these risks may have a material adverse effect on Vusion. Vusion is under no obligation and does not undertake to provide updates of these forward-looking statements and information to reflect events that occur or circumstances that arise after the date of this press release. More comprehensive information about Vusion may be obtained on its Internet website (www.vusion.com). This press release does not constitute an offer to sell, or a solicitation of an offer to buy Vusion securities in any jurisdiction.
[1] Adjusted sales incorporate IFRS standards before adjusting for certain non-cash IFRS 15 adjustments related to the Walmart US contract, which began in Q4 2023. These adjustments only impact the Americas & Asia-Pacific region. Please see the detailed explanatory note at the end of this press release.
[2] VAS: Software, services and non-ESL (Electronic Shelf Labels) solutions
[3] “Recurring VAS” revenue includes revenue generated by subscriptions to VusionCloud and its SaaS computer vision (Captana and Belive) and data analytics (MarketHub and Memory) solutions, as well as contracts for recurring services.
[4] DACH: Germany, Austria and Switzerland.
Share
We are here to help make your store smarter and more efficient.
© Copyright 2026 Vusion

By clicking “Accept All Cookies”, you agree to the storing of cookies on your device to enhance site navigation, analyze site usage, and assist in our marketing efforts.
Cookies Settings Reject All Accept All Cookies

Privacy Preference Center
When you visit any website, it may store or retrieve information on your browser, mostly in the form of cookies. This information might be about you, your preferences, or your device, and is mostly used to make the site work as you expect. The information does not usually identify you directly, but it can give you a more personalized web experience. Because we respect your right to privacy, you can choose not to allow some types of cookies. Click on the different category headings to learn more and change our default settings. Blocking some types of cookies may impact your experience of the site and the services we are able to offer.
More information
Allow All
Manage Consent Preferences
Strictly Necessary Cookies
Always Active
These cookies are necessary for the website to function and cannot be switched off in our systems. They are usually only set in response to actions made by you which amount to a request for services, such as setting your privacy preferences, logging in or filling in forms. You can set your browser to block or alert you about these cookies, but some parts of the site will not then work. These cookies do not store any personally identifiable information.
Targeting Cookies
Targeting Cookies
These cookies may be set through our site by our advertising partners. They may be used by those companies to build a profile of your interests and show you relevant adverts on other sites. They do not store directly personal information, but are based on uniquely identifying your browser and internet device. If you do not allow these cookies, you will experience less targeted advertising.
Performance Cookies
Performance Cookies
These cookies allow us to count visits and traffic sources so we can measure and improve the performance of our site. They help us to know which pages are the most and least popular and see how visitors move around the site. All information these cookies collect is aggregated and therefore anonymous. If you do not allow these cookies we will not know when you have visited our site, and will not be able to monitor its performance.
Functional Cookies
Functional Cookies
These cookies enable the website to provide enhanced functionality and personalisation. They may be set by us or by third party providers whose services we have added to our pages. If you do not allow these cookies then some or all of these services may not function properly.
Back Button
Cookie List
Search Icon
Filter Icon
Clear
Apply Cancel
Consent Leg.Interest
checkbox label label
checkbox label label
checkbox label label
Reject All Confirm My Choices


 Share on Facebook
 Share on Linkedin
 Share on X