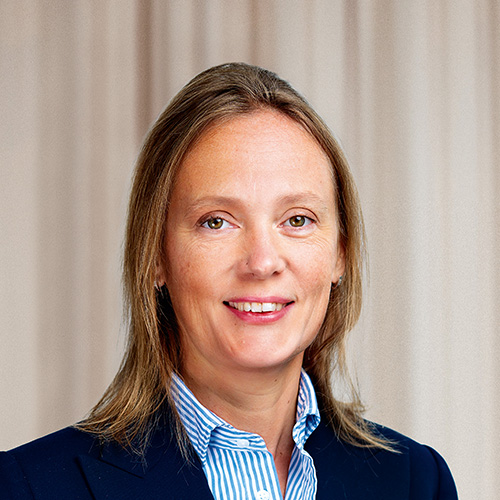
Sodexo appoints Belinda Oakley as Global Chief Executive Officer of Sodexo Live!
Bull 0
Bear 0
Management
SW
Fiscal year ends August
Quarters are offset from the calendar — Q1 is Sep–Nov
|
Sodexo S.A. is a provider of on-site services, integrating catering, facilities management, and employee benefits. The company operates through its Services on Site segment, delivering food services and facility management solutions. Sodexo serves clients across multiple verticals, including Business & Industry, Education, Energy & Resources, Healthcare, Seniors, and Sports & Leisure venues. The company operates globally, with specific partnerships noted in Europe, the Americas, and Asia Pacific. Notable clients include Meta and Clariant, for whom Sodexo provides food services and integrated workplace services, respectively. The group includes subsidiaries such as Sodexo France, Sodexo UK & Ireland, and Sodexo USA, among others. Founded in 1966, Sodexo focuses on creating engaging workplaces and environments through food and hospitality services. Summarised from the company's own disclosures, fiscal year ended Oct 2025 |
Industry Specialty Business Services | Homepage sodexo.com |
| Sector Industrials | IR page sodexo.com/investors | |
|
Tags
catering, facilities management, food services, workplace services, employee benefits, hospitality, cleaning services, grounds maintenance, technical support, event services, Sodexo France, Sodexo UK & Ireland, Sodexo USA, Sodexo Canada, Sodexo Australia, Sodexo Asia Pacific, Sodexo Middle East & Africa, Sodexo Latin America, Sodexo Europe, Sodexo Global
|
Press page sodexo.com/news/newsroom |
Metrics
| Valuation | |
|---|---|
| Market cap | € 8.183B |
| Market cap (USD) | $ 8.992B |
| P/E | 26.55 |
| PEG | — |
| P/BV | 2.17 |
| P/S | 0.34 |
| P/OCF | 9.02 |
| P/FCF | 11.86 |
| Dividend yield | 4.9% |
| Turnover / mcap | — |
| Returns | |
|---|---|
| ROE | 8.0% |
| ROI | 9.7% |
| ROIC | 9.7% |
| Profit margin | 1.3% |
| Growth | |
|---|---|
| Revenue growing | No |
| Profits growing | No |
| Revenue up 3y | No |
| Revenue up 5y | No |
| Earnings growth 3y (net profit CAGR) | -18.4% |
| Quality | |
|---|---|
| Profitable | Yes |
| Margin expanding | No |
| Buying back stock | No |
| Diluting (TTM) | No |
| Debt/Equity | — |
| Podcast bulls (TTM) | Sign up |
| Podcast bears (TTM) | Sign up |
| Podcast sentiment (TTM) | Sign up |
| Podcast sentiment % (TTM) | Sign up |
| News sentiment (TTM) | 1 |
| Quality score | -10.5% |
| Insiders | |
|---|---|
| Buys, 1w | Sign up |
| Buys, 1m | Sign up |
| Buys, 1y | Sign up |
| Sells, 1w | Sign up |
| Sells, 1m | Sign up |
| Sells, 1y | Sign up |
Sign up to see this company's insider trades
| Figure | FY 2026 | FY 2025 | FY 2024 | FY 2023 | FY 2022 | FY 2021 | FY 2016 | FY 2015 | FY 2014 | FY 2013 | FY 2012 | FY 2011 |
|---|---|---|---|---|---|---|---|---|---|---|---|---|
| Revenue | 23.963B | 24.074B | 23.798B | 22.637B | 21.125B | 17.428B | 20.245B | 19.815B | 18.016B | — | — | 16.047B |
| Net profit | 304M | 695M | 168M | 794M | 695M | 139M | 637M | 700M | 509M | — | — | 471M |
| Free cash flow | — | — | — | — | 690M | 686M | — | — | — | — | — | — |
Filed figures
Lines the statements and their notes report beside the headline figures, read from the filings' XBRL as filed (no restatement applied), with figures computed from one filing's own lines. Cash-flow lines carry their cash direction: an outflow is negative. Each period links to its filing; a figure's period, report date and tag are in its tooltip.
| Figure | Aug 2021 | Aug 2022 | Aug 2023 | Aug 2024 | Aug 2025 | Aug 2026 |
|---|---|---|---|---|---|---|
| Balance sheet detail | ||||||
| Trade receivables (EUR) | 4.27B | 5.07B | 3.56B | 3.7B | 3.76B | 3.88B |
| ↳ YoY growth | +18.7% | -29.7% | +3.9% | +1.4% | +3.2% | |
| ↳ 5y CAGR | -1.9% | |||||
| Lease liabilities (EUR) | 939M | 943M | 831M | 728M | 664M | 649M |
| Cash and deposits (EUR) | 3.54B | 3.23B | 2.03B | 2.14B | 2.09B | 1.13B |
| Intangible assets (EUR) | 631M | 678M | 448M | 436M | 507M | 500M |
| Right-of-use assets (EUR) | 903M | 895M | 787M | 673M | 616M | 583M |
| Cash flow detail | ||||||
| Operating cash flow (EUR) | 982M | 1.04B | 1.33B | 1.32B | 964M | 907M |
| Purchases of property, plant and equipment (EUR) | -296M | -345M | — | — | — | — |
| Change in receivables (cash effect) (EUR) | -263M | -563M | -204M | -213M | -249M | -43M |
| Change in inventories (cash effect) (EUR) | 0.00 | -68M | -11M | -2M | 9M | -17M |
| Change in payables (cash effect) (EUR) | — | — | -7M | 172M | 171M | 135M |
| Dividends paid (cash effect) (EUR) | 0.00 | -294M | -352M | -1.37B | -388M | -394M |
| Share buybacks (cash effect) (EUR) | -11M | -13M | — | — | — | — |
| Interest paid (cash effect) (EUR) | — | — | — | -148M | -116M | -157M |
| Income taxes paid (cash effect) (EUR) | -145M | -200M | -123M | -179M | -348M | -147M |
| Operating cash flow before change in receivables (EUR) | 1.25B | 1.6B | 1.54B | 1.53B | 1.21B | 950M |
| Free cash flow (OCF - PPE - intangibles) (EUR) | 686M | 690M | — | — | — | — |
| Income detail | ||||||
| Total comprehensive income (EUR) | 368M | 1.55B | 531M | 744M | 476M | 383M |
| Comprehensive income to owners (EUR) | 369M | 1.53B | 523M | 733M | 466M | 384M |
| Reported | Nov 9, 2022 | Nov 9, 2022 | Nov 5, 2024 | Oct 31, 2025 | Oct 31, 2025 | Oct 30, 2026 |
Sign up to see institutional holdings
Sign UpPodcast Mentions
Sign up to see podcast mentions and sentiment
Sign UpRegulated information filed with the AMF (info-financiere.gouv.fr), newest first, titles as filed. Voting-rights totals, own-share transactions, threshold crossings and availability notices are left out. The link opens the filed document. Press releases from the company's own website, newest first.







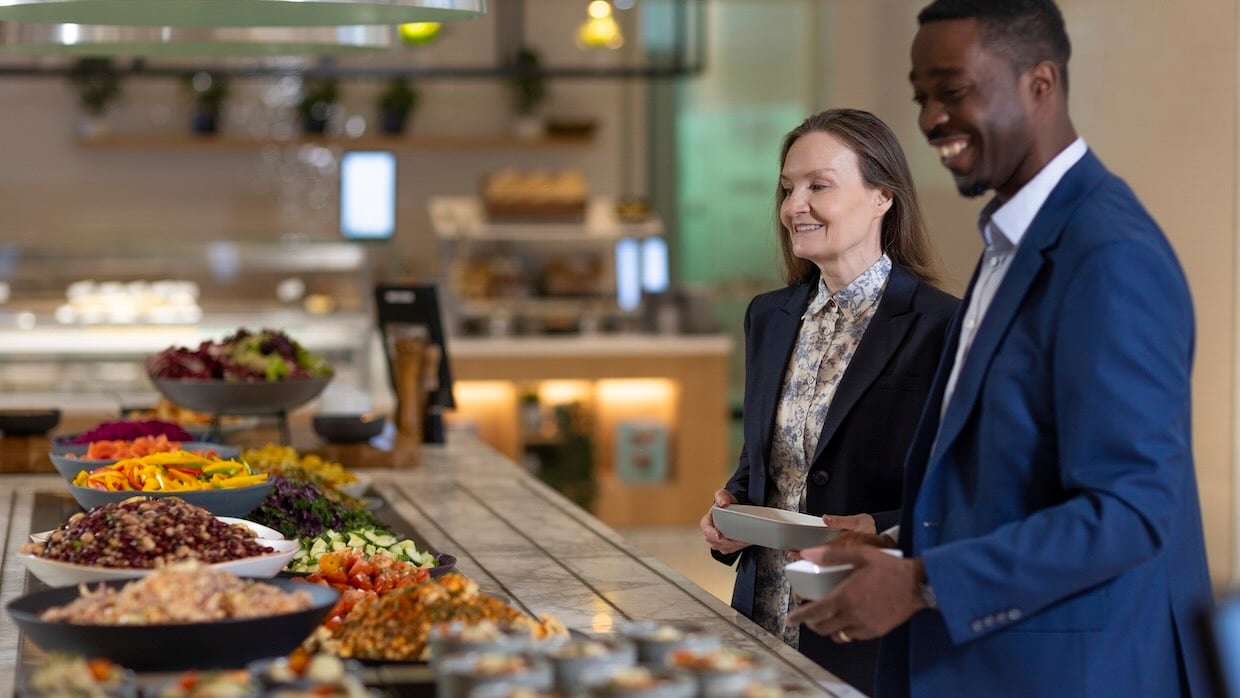


 Sodexo is proud to announce its recognition as one of the World’s Most Ethical Companies® for the second consecutive year. Issued by Ethisphere, a global leader in defining and advancing the standards of ethical business, this annual recognition honors Sodexo’s continuous commitment to business integrity through best-in-class policies and practices.















Prompts
Click prompts to add them under the company line, click again to take one out, then copy the result into your AI chat. Shared by Asian Century Stocks and Uncovered Thai Stocks. Thank you.
Sodexo S.A. (ticker SW), listed in France.
Copied
ETFs Holding Sodexo S.A.
Exchange-traded funds whose newest published daily portfolio holds one of the company's listings, largest weight first.
| ETF | Weight in ETF | Shares | Market value | As of |
|---|---|---|---|---|
| BINV | 1.81% | 153,055 | $ 8.858M | Jun 30, 2026 |
| FPAG | 1.35% | 125,616 | $ 7.27M | Jun 30, 2026 |
| CGV | 1.07% | 21,000 | $ 1.381M | Jul 31, 2026 |
| RCGE | 0.50% | 7,300 | $ 490K | Nov 18, 2026 |
| COPY | 0.47% | 29,568 | $ 1.989M | Aug 31, 2026 |
| DFIS | 0.15% | 128,624 | $ 8.718M | Nov 12, 2026 |
| RGLO | 0.11% | 6,451 | $ 373.337K | Jun 30, 2026 |
| DXIV | 0.07% | 2,355 | $ 159.627K | Nov 12, 2026 |
| DFIC | 0.05% | 107,354 | $ 7.277M | Nov 12, 2026 |
| DFAX | 0.03% | 49,919 | $ 3.384M | Nov 12, 2026 |
| FENI | 0.03% | 46,251 | $ 2.677M | Jun 30, 2026 |
| NTSI | 0.03% | 2,178 | $ 126.124K | Jun 30, 2026 |
| DFAI | 0.02% | 47,307 | $ 3.207M | Nov 12, 2026 |
| AVDE | 0.00% | 13,087 | $ 885.268K | Nov 16, 2026 |