Soitec Reports Second Quarter Revenue And Half-Year Results Of Fiscal Year 2027
Bull 6
Bear 0
Results
SOI
Fiscal year ends March
Quarters are offset from the calendar — Q1 is Apr–Jun
|
Soitec SA is a semiconductor materials company that designs and manufactures engineered substrates, primarily Silicon On Insulator (SOI) wafers, for the microelectronics industry. Founded in 1992 as a spin-off of the CEA research institute, the company utilizes its proprietary SmartCut technology to produce substrates that combine high performance with energy efficiency. Its main business segments serve the Mobile Communications, Automotive & Industrial, and Edge & Cloud AI markets, supplying customers in sectors such as 5G connectivity, electric vehicles, and artificial intelligence infrastructure. Soitec operates a global network of manufacturing sites and sales offices, including facilities in Bernin, Singapore, Shanghai, Tokyo, Hsinchu, Hwaseong, and Hasselt. The company maintains strategic research partnerships with institutions such as the CEA and has established alliances with major semiconductor players including SEH, STMicroelectronics, and GlobalFoundries. Soitec generates the majority of its revenue internationally, with a strong presence in Europe, Asia, and the United States. Summarised from the company's own disclosures, fiscal year ended Jun 2026 |
Industry Semiconductors | Homepage soitec.com |
| Sector Technology | IR page soitec.com/home/investors | |
|
Tags
silicon-on-insulator, engineered substrates, smartcut technology, mobile communications, automotive electronics, edge ai, cloud infrastructure, 5g technology, electric vehicles, rf-soi, fd-soi, semiconductor materials, SmartCut, SOI, SmartSiC, CEA, SEH, STMicroelectronics, GlobalFoundries, TowerJazz, Sony, UMC, CEA-Leti, SOI Industry Consortium, Bernin, Singapore, Shanghai, Tokyo, Hsinchu, Hwaseong, Hasselt
|
Press page soitec.com/home/group/corporate/newsroom |
Metrics
| Valuation | |
|---|---|
| Market cap | € 5.445B |
| Market cap (USD) | $ 6.018B |
| P/E | -24.50 |
| PEG | — |
| P/BV | 4.10 |
| P/S | 9.19 |
| P/OCF | 26.94 |
| P/FCF | 62.70 |
| Dividend yield | — |
| Turnover / mcap | — |
| Returns | |
|---|---|
| ROE | -15.1% |
| ROI | -16.6% |
| ROIC | -7.4% |
| Profit margin | -37.1% |
| Growth | |
|---|---|
| Revenue growing | No |
| Profits growing | No |
| Revenue up 3y | No |
| Revenue up 5y | No |
| Earnings growth 3y (net profit CAGR) | — |
| Quality | |
|---|---|
| Profitable | No |
| Margin expanding | No |
| Buying back stock | Yes |
| Diluting (TTM) | — |
| Debt/Equity | — |
| Podcast bulls (TTM) | Sign up |
| Podcast bears (TTM) | Sign up |
| Podcast sentiment (TTM) | Sign up |
| Podcast sentiment % (TTM) | Sign up |
| News sentiment (TTM) | 10 |
| Quality score | -64.7% |
| Insiders | |
|---|---|
| Buys, 1w | Sign up |
| Buys, 1m | Sign up |
| Buys, 1y | Sign up |
| Sells, 1w | Sign up |
| Sells, 1m | Sign up |
| Sells, 1y | Sign up |
Sign up to see this company's insider trades
| Figure | FY 2026 | FY 2025 | FY 2024 | FY 2023 | FY 2022 | FY 2021 | FY 2020 | FY 2012 | FY 2011 | FY 2010 |
|---|---|---|---|---|---|---|---|---|---|---|
| Revenue | 592.319M | 890.851M | 977.914M | 1.089B | 862.743M | 583.761M | 597.549M | — | — | — |
| Net profit | -220.023M | 91.836M | 178.317M | 233.035M | 201.962M | 72.671M | 109.681M | -56.263M | -17.848M | -44.046M |
| Free cash flow | 86.853M | 29.47M | -11.484M | 76.535M | 73.241M | 64.566M | 46.595M | — | — | — |
Filed figures
Lines the statements and their notes report beside the headline figures, read from the filings' XBRL as filed (no restatement applied), with figures computed from one filing's own lines. Cash-flow lines carry their cash direction: an outflow is negative. Each period links to its filing; a figure's period, report date and tag are in its tooltip.
| Figure | Mar 2019 | Mar 2020 | Mar 2021 | Mar 2022 | Mar 2023 | Mar 2024 | Mar 2025 | Mar 2026 |
|---|---|---|---|---|---|---|---|---|
| Balance sheet detail | ||||||||
| Trade receivables (EUR) | — | 167M | 157M | 280M | 363M | 448M | 463M | 280M |
| ↳ YoY growth | -6.0% | +78.0% | +29.6% | +23.3% | +3.4% | -39.4% | ||
| ↳ 5y CAGR | +22.5% | +12.2% | ||||||
| Cash and deposits (EUR) | 175M | 191M | 644M | 728M | 788M | 708M | 688M | 562M |
| Cash flow detail | ||||||||
| Operating cash flow (EUR) | — | 99.6M | 174M | 254M | 262M | 165M | 201M | 202M |
| Purchases of property, plant and equipment (EUR) | — | -53M | -109M | -181M | -186M | -177M | -172M | -115M |
| Purchases of intangible assets (EUR) | — | -31.1M | -24.2M | -24M | -41.7M | -48.4M | -27.4M | -12.6M |
| Change in receivables (cash effect) (EUR) | — | -22.7M | -2.64M | -42.2M | -155M | -94M | -30M | 145M |
| Change in inventories (cash effect) (EUR) | — | -51.9M | -9.38M | -31M | -35.5M | -19M | -37.6M | 24.4M |
| Change in payables (cash effect) (EUR) | — | 15.5M | 21.4M | 20.9M | 94.6M | -45.4M | -15.4M | -122M |
| Interest paid (cash effect) (EUR) | — | -2M | -2.07M | -3.75M | -6.82M | -12M | -13.9M | -16.4M |
| Income taxes paid (cash effect) (EUR) | — | 25.6M | 14M | -1.89M | -32.4M | -25.2M | -17.3M | 2.68M |
| Share-based compensation (EUR) | — | 19.5M | 20M | 19.5M | 14M | 13.8M | 11.1M | -632,000 |
| Operating cash flow before change in receivables (EUR) | — | 122M | 177M | 296M | 418M | 259M | 231M | 56.9M |
| Free cash flow (OCF - PPE - intangibles) (EUR) | — | 15.5M | 40.3M | 49.3M | 34.9M | -59.9M | 2.05M | 74.3M |
| Income detail | ||||||||
| Research and development expense (EUR) | — | 32.5M | 44.4M | 56.9M | 64.2M | 61.2M | 84.8M | 45.1M |
| ↳ 5y CAGR | +21.2% | +0.3% | ||||||
| Total comprehensive income (EUR) | — | 112M | 57.7M | 207M | 248M | 181M | 92.4M | -267M |
| Comprehensive income to owners (EUR) | — | 112M | 57.7M | 207M | 248M | 181M | 92.4M | -267M |
| Reported | Jul 5, 2021 | Jul 5, 2021 | Jul 5, 2021 | Jun 20, 2022 | Jun 14, 2023 | Jun 5, 2024 | Jun 11, 2025 | Jun 10, 2026 |
Sign up to see institutional holdings
Sign UpPodcast Mentions
Sign up to see podcast mentions and sentiment
Sign UpRegulated information filed with the AMF (info-financiere.gouv.fr), newest first, titles as filed. Voting-rights totals, own-share transactions, threshold crossings and availability notices are left out. The link opens the filed document. Press releases from the company's own website, newest first.
-
[

\Technology\
Explore Soitec's cutting-edge technologies that revolutionize semiconductor solutions, driving advancements in electronics, 5G, and AI.](https://www.soitec.com/home/technology)Innovation
Manufacturing
Ecosytem
-
[
\Products\
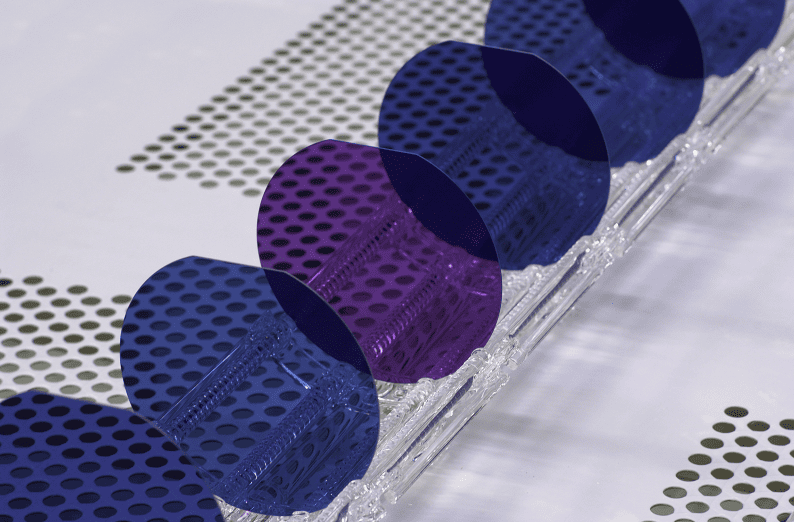
Discover Soitec's wide range of semiconductor products, designed to drive innovation across industries (mobile, automotive, industrial & IoT)](https://www.soitec.com/home/products)Markets
Product Platforms
-
[
\Group\
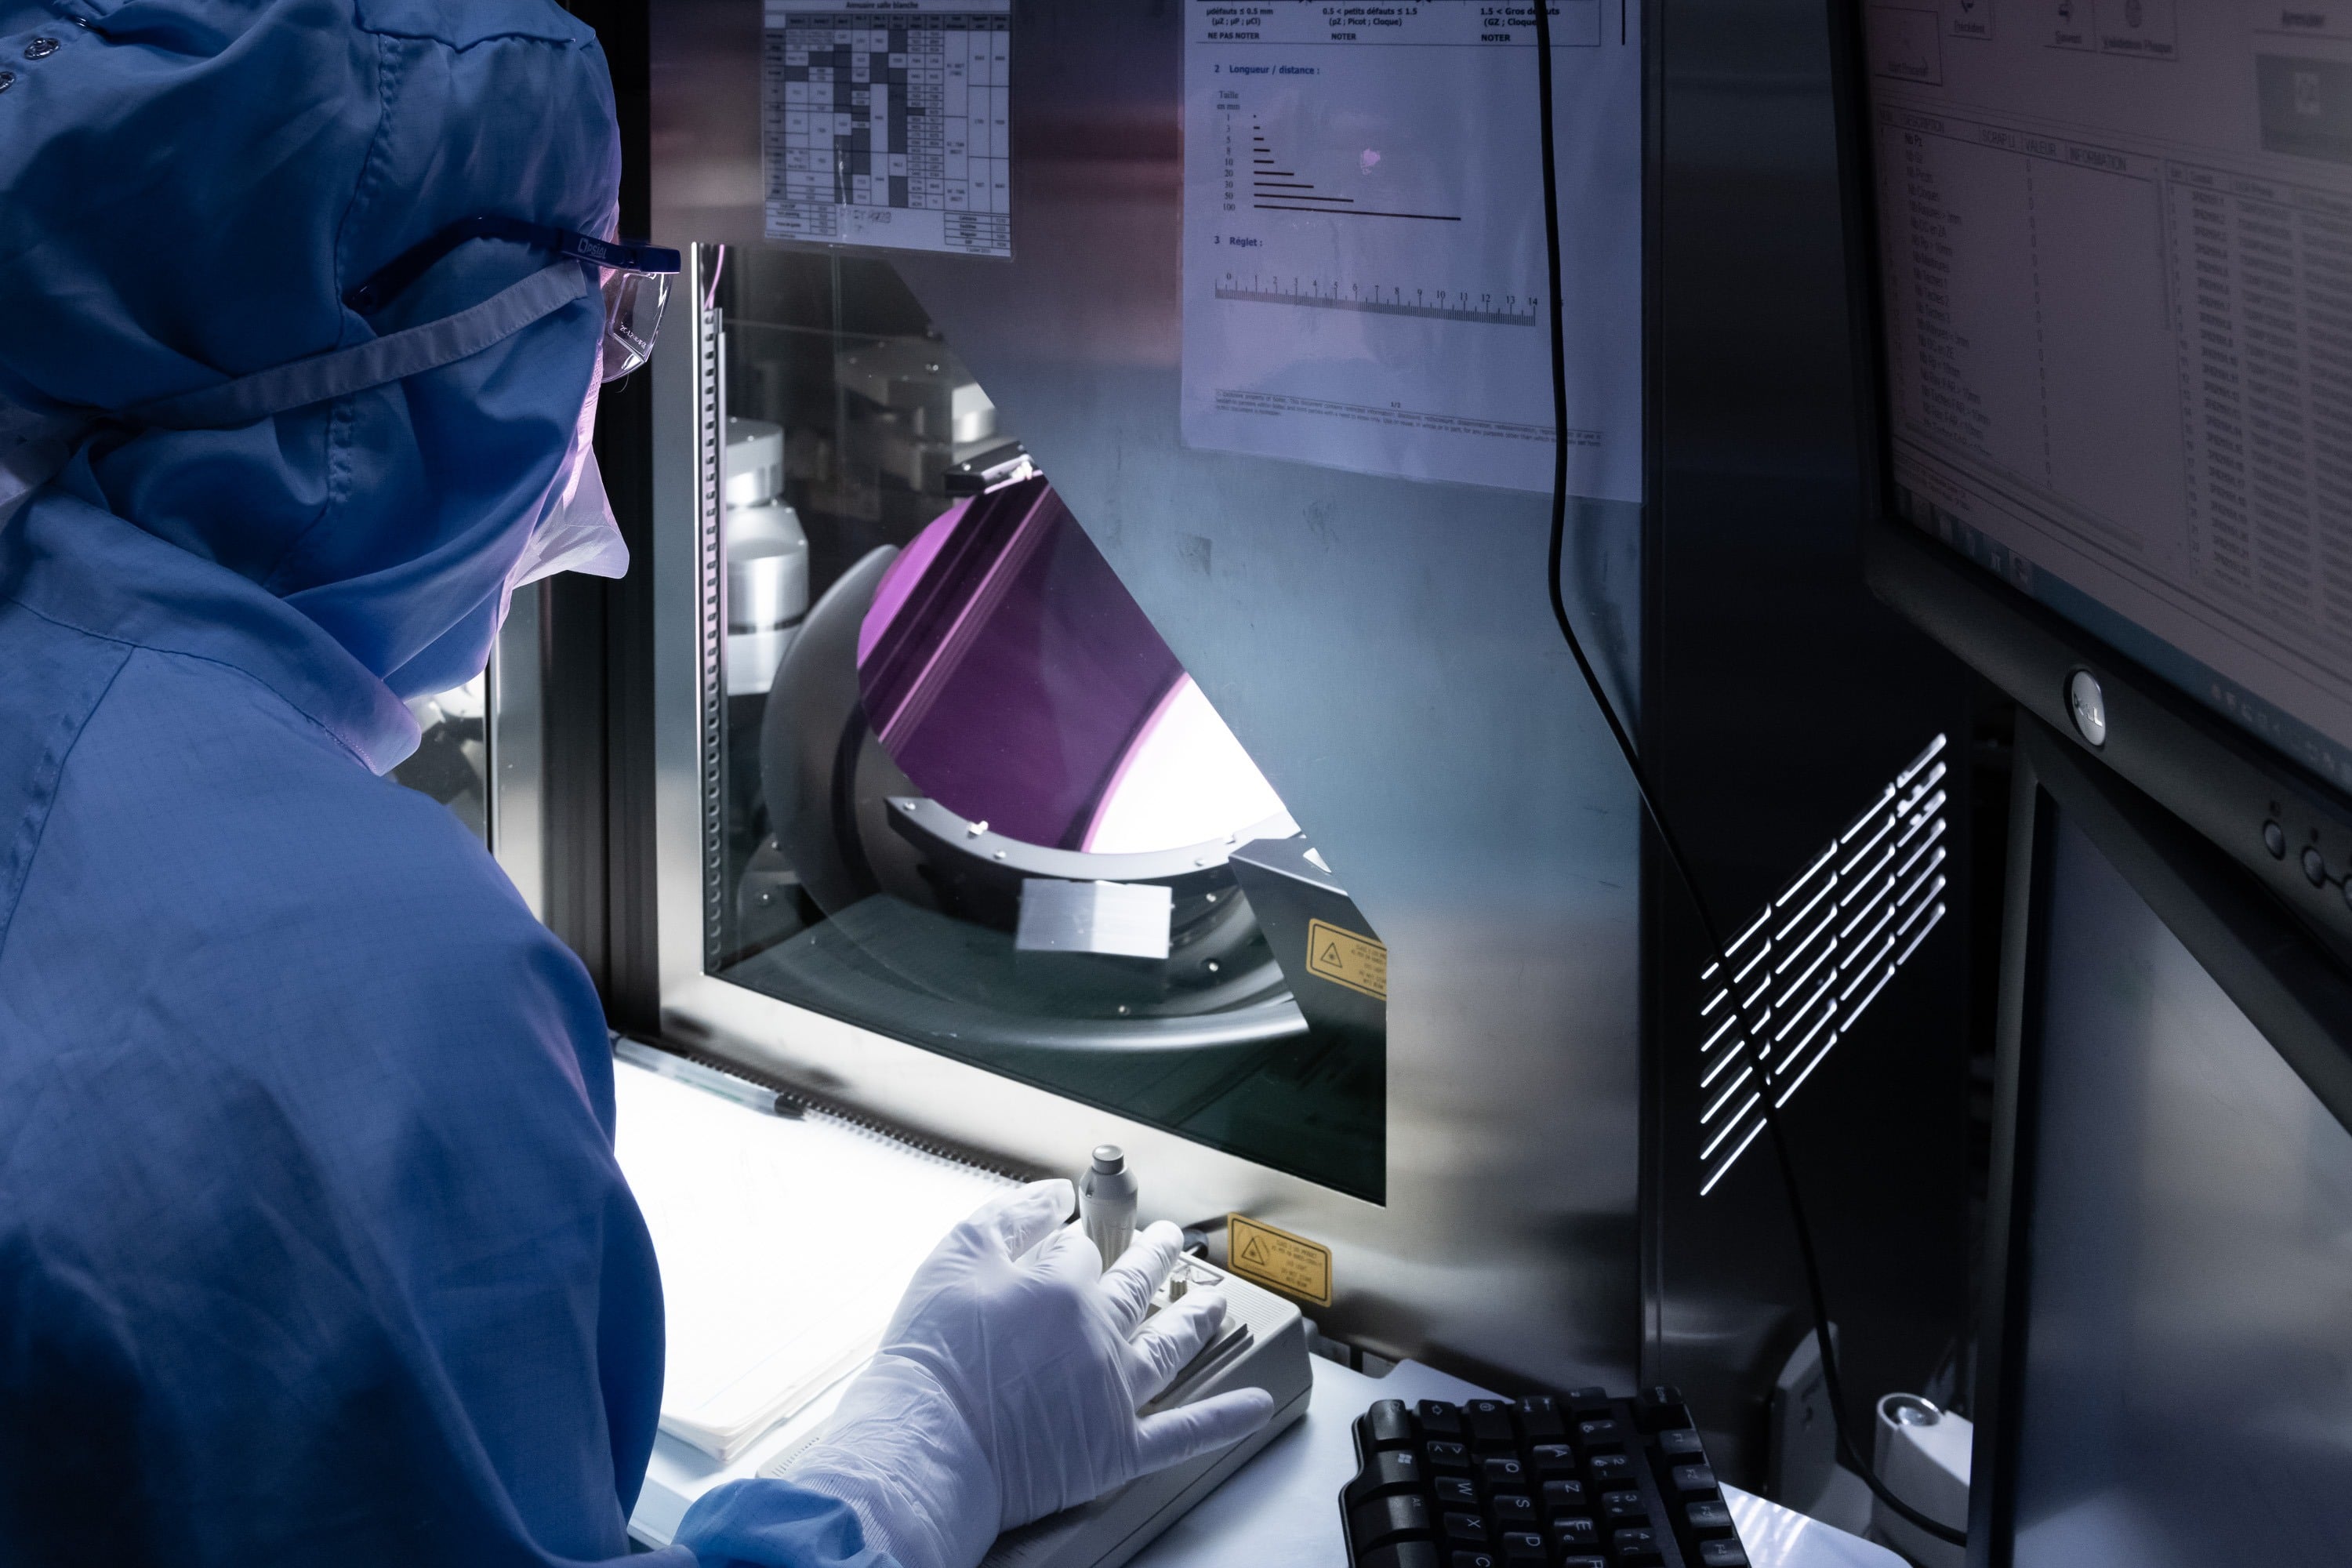
Soitec, a global leader in semiconductor materials, dedicated to driving innovation and delivering high-performance solutions.](https://www.soitec.com/home/group)Corporate
-
[

\People\
Whatever future you want to build, there is an opportunity. Join us at Soitec!](https://www.soitec.com/home/people)Culture
-
[
\Commitments\
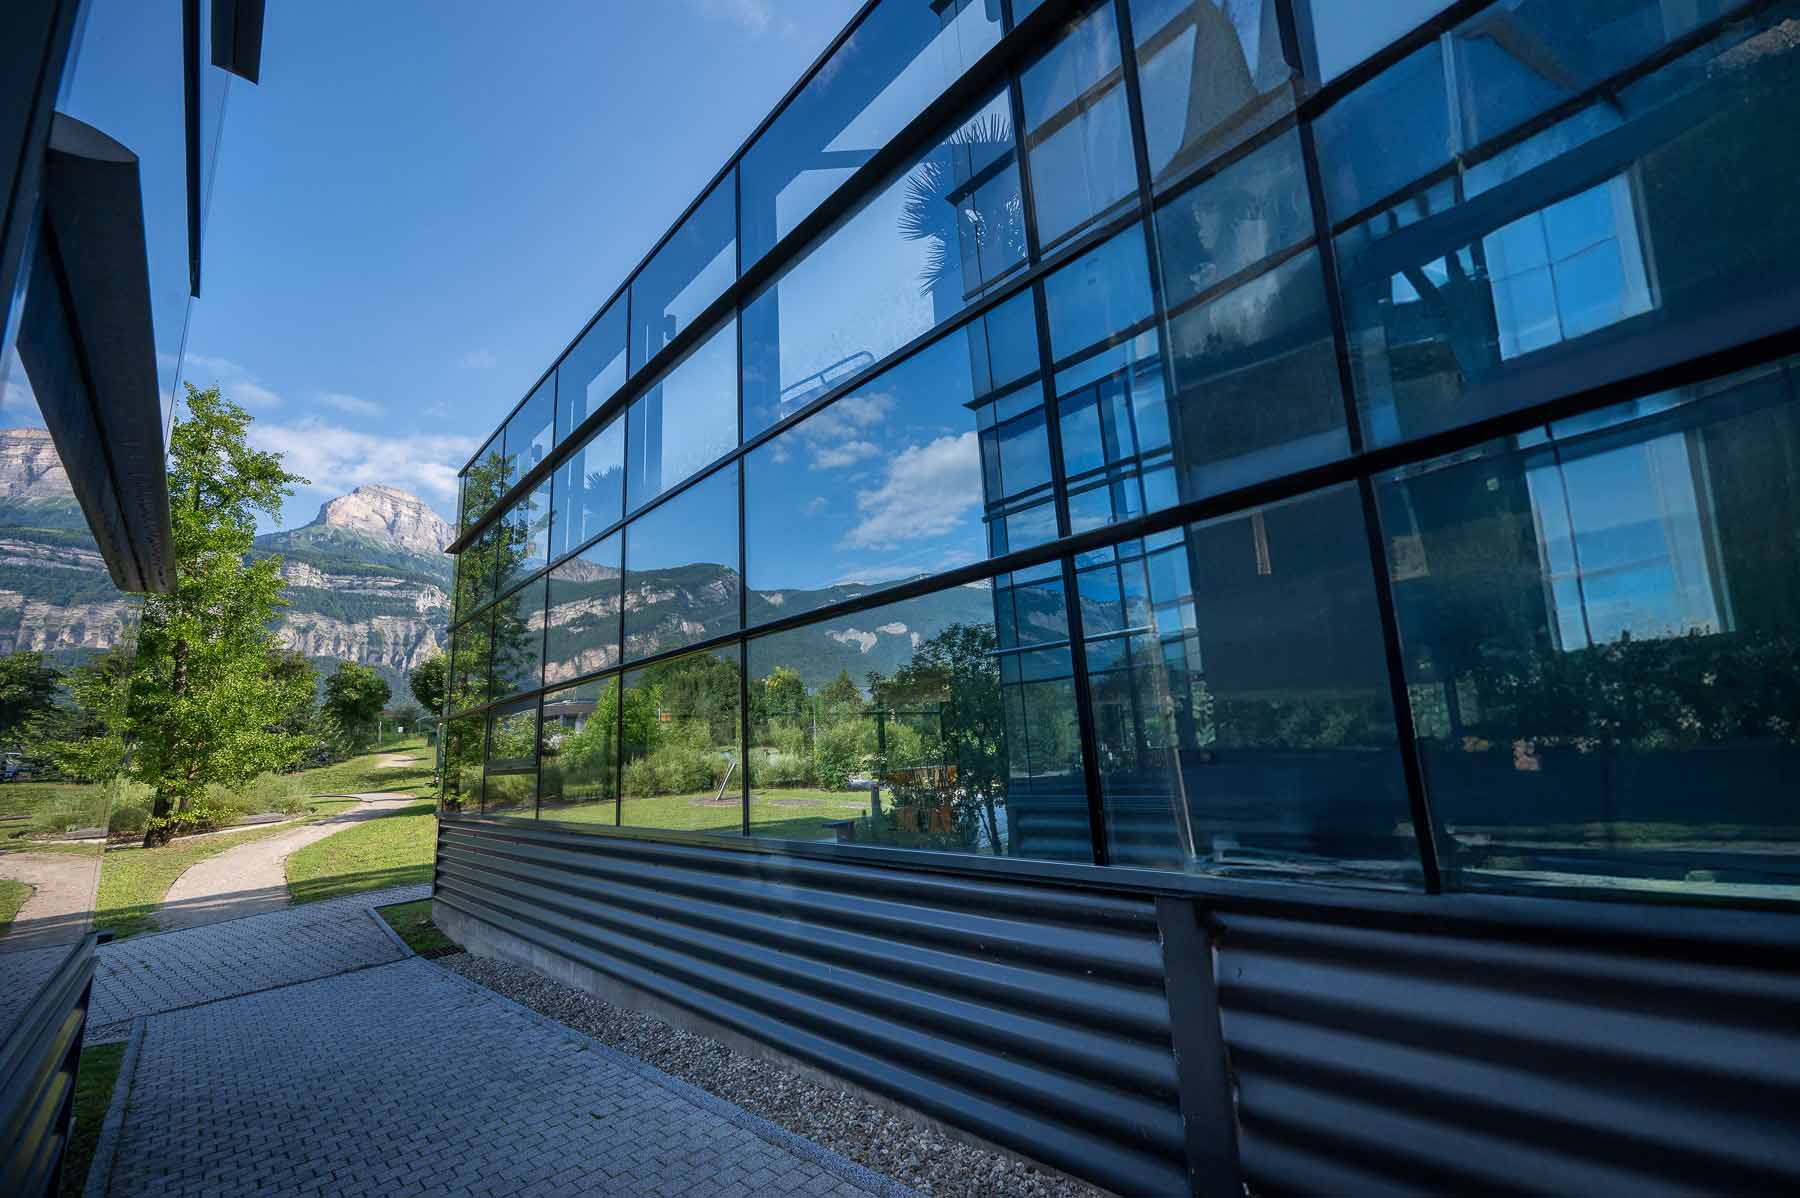
Discover Soitec's commitment to Environmental, Social, and Governance (ESG) principles. Learn how we drive sustainability, ethical practices, and community engagement to build a better future.](https://www.soitec.com/home/commitments)Responsibility
-
[

\Investors\
Explore Strategic Growth, Financial Performance, and Investor Opportunities with Soitec.](https://www.soitec.com/home/investors)Shareholders & Analysts
Governance
Regulated information
English
Technology Products Group People Commitments Investors Contact
Technology
Innovation
Manufacturing
Ecosytem
Products
Markets
Product Platforms
Group
Corporate
People
Culture
Commitments
Responsibility
Investors
Shareholders & Analysts
Governance
Regulated information
When autocomplete results are available use up and down arrows to review and enter to select.
Languages
Regional Page
ICCAD 2026 (Beijing, China)
November 19, 2026 - November 20, 2026
November 19, 2026 - November 20, 2026
Event
QUICK LINKS
Group Jobs at Soitec Investor Relations Shareholders Products Commitments Newsroom Events Media Library
REGIONAL PAGES

Soitec, a world leader in innovative semiconductor materials
©2026 Soitec
Terms of Use Personal Data Accessibility: partially compliant Cookies
English
Prompts
Click prompts to add them under the company line, click again to take one out, then copy the result into your AI chat. Shared by Asian Century Stocks and Uncovered Thai Stocks. Thank you.
Soitec SA (ticker SOI), listed in France.
Copied
ETFs Holding Soitec SA
Exchange-traded funds whose newest published daily portfolio holds one of the company's listings, largest weight first.
| ETF | Weight in ETF | Shares | Market value | As of |
|---|---|---|---|---|
| AVDS | 0.02% | 759 | $ 81.877K | Nov 16, 2026 |
| DFAX | 0.01% | 6,827 | $ 799.706K | Nov 12, 2026 |
| DFAI | 0.00% | 7,203 | $ 843.75K | Nov 12, 2026 |
| DFIC | 0.00% | 3,958 | $ 463.635K | Nov 12, 2026 |
| DFIS | 0.00% | 266 | $ 31.159K | Nov 12, 2026 |
| AVDE | 0.00% | 986 | $ 106.364K | Nov 16, 2026 |
| AVSD | 0.00% | 65 | $ 7,011.83 | Nov 16, 2026 |