|
SEB SA is a manufacturer of small domestic appliances and professional equipment. The company operates through two main segments: Grand Public, which accounts for the majority of sales, and Professional. The Grand Public segment covers small home appliances, including electric cooking, beverage preparation, food preparation, laundry care, floor cleaning, and personal care, as well as cookware and kitchen utensils. The Professional segment focuses on professional coffee machines, high-end hotel equipment, professional culinary preparation, and cooking equipment. The group serves consumers and professional customers globally. Its portfolio includes brands such as Tefal, Supor, Rowenta, WMF, Moulinex, Krups, All-Clad, Schaerer, Hepp, Wilbur Curtis, La San Marco, Zummo, Krampouz, Pacojet, Sofilac, Lacanche, Charvet, and Buyer. The company was founded in 1855 and entered the professional market in 2016 through the acquisition of the WMF group. Summarised from the company's own disclosures, fiscal year ended Mar 2026 |
Industry Household & Personal Products | Homepage groupeseb.com |
| Sector Consumer Defensive | IR page groupeseb.com/fr/vous-etes-analyste-investisseur | |
|
Tags
small home appliances, professional coffee machines, cookware, kitchen utensils, laundry care, personal care, professional culinary equipment, hotel equipment, Tefal, Supor, Rowenta, WMF, Moulinex, Krups, All-Clad, Schaerer, Hepp, Wilbur Curtis, La San Marco, Zummo, Krampouz, Pacojet, Sofilac, Lacanche, Charvet, Buyer, Zhejiang Supor Co. Ltd
|
Press page — |
Metrics
| Valuation | |
|---|---|
| Market cap | € 2.306B |
| Market cap (USD) | $ 2.555B |
| P/E | 19.15 |
| PEG | — |
| P/BV | 0.70 |
| P/S | 0.28 |
| P/OCF | 11.28 |
| P/FCF | 103.39 |
| Dividend yield | — |
| Turnover / mcap | — |
| Returns | |
|---|---|
| ROE | 7.0% |
| ROI | 3.5% |
| ROIC | 5.5% |
| Profit margin | 3.0% |
| Growth | |
|---|---|
| Revenue growing | No |
| Profits growing | No |
| Revenue up 3y | No |
| Revenue up 5y | No |
| Earnings growth 3y (net profit CAGR) | -8.2% |
| Quality | |
|---|---|
| Profitable | Yes |
| Margin expanding | No |
| Buying back stock | No |
| Diluting (TTM) | No |
| Debt/Equity | 105.5% |
| Podcast bulls (TTM) | Sign up |
| Podcast bears (TTM) | Sign up |
| Podcast sentiment (TTM) | Sign up |
| Podcast sentiment % (TTM) | Sign up |
| News sentiment (TTM) | 15 |
| Quality score | -27.8% |
| Insiders | |
|---|---|
| Buys, 1w | Sign up |
| Buys, 1m | Sign up |
| Buys, 1y | Sign up |
| Sells, 1w | Sign up |
| Sells, 1m | Sign up |
| Sells, 1y | Sign up |
Sign up to see this company's insider trades
| Figure | FY 2025 | FY 2024 | FY 2023 | FY 2022 | FY 2021 | FY 2020 | FY 2019 | FY 2018 | FY 2017 | FY 2016 | FY 2012 | FY 2011 | FY 2010 |
|---|---|---|---|---|---|---|---|---|---|---|---|---|---|
| Revenue | 8.169B | 8.266B | 8.006B | 7.96B | 8.059B | 6.94B | 7.354B | 6.812B | 6.485B | 5B | 4.06B | 3.963B | 3.652B |
| Net profit | 244.6M | 232M | 386.2M | 316.2M | 453.8M | 300.5M | 428.3M | 419M | 375M | 258.6M | 210.7M | 260.9M | 243.6M |
| Free cash flow | 22.3M | 359M | 877.8M | 76.2M | 390.2M | 804.1M | — | — | — | — | — | — | — |
Filed figures
Lines the statements and their notes report beside the headline figures, read from the filings' XBRL as filed (no restatement applied), with figures computed from one filing's own lines. Cash-flow lines carry their cash direction: an outflow is negative. Each period links to its filing; a figure's period, report date and tag are in its tooltip.
| Figure | Dec 2019 | Dec 2020 | Dec 2021 | Dec 2022 | Dec 2023 | Dec 2024 | Dec 2025 |
|---|---|---|---|---|---|---|---|
| Balance sheet detail | |||||||
| Trade receivables (EUR) | — | 965M | 935M | 892M | 1.02B | 1.14B | 1.17B |
| ↳ YoY growth | -3.2% | -4.6% | +14.2% | +12.2% | +2.3% | ||
| ↳ 5y CAGR | +3.9% | ||||||
| Borrowings, current (EUR) | — | 1.67B | 1.61B | 1.39B | — | — | — |
| Borrowings, non-current (EUR) | — | 2.29B | 2.23B | 1.92B | — | — | — |
| Cash and deposits (EUR) | 786M | 1.77B | 2.27B | 1.24B | 1.43B | 1.02B | 999M |
| Intangible assets (EUR) | — | 1.26B | 1.29B | 1.31B | 1.35B | 1.4B | 1.4B |
| Net debt (borrowings + leases - cash) (EUR) | — | 2.19B | 1.57B | 2.08B | — | — | — |
| Cash flow detail | |||||||
| Operating cash flow (EUR) | — | 963M | 573M | 276M | 1.02B | 533M | 204M |
| Purchases of property, plant and equipment (EUR) | — | -158M | -183M | -200M | -143M | -174M | -182M |
| Purchases of intangible assets (EUR) | — | -24.1M | -29.7M | -33M | -32.5M | -43.1M | -39.5M |
| Change in receivables (cash effect) (EUR) | — | 108M | 49.3M | 161M | -161M | -98.9M | -63.6M |
| Change in inventories (cash effect) (EUR) | — | -59.4M | -574M | 173M | 193M | -153M | -21.7M |
| Change in payables (cash effect) (EUR) | — | 252M | 243M | -618M | 186M | 17.9M | -18.8M |
| Dividends paid (cash effect) (EUR) | — | -101M | -152M | -204M | -195M | -194M | -207M |
| Income taxes paid (cash effect) (EUR) | — | -159M | -134M | -154M | -148M | -165M | -114M |
| Share-based compensation (EUR) | — | 29.2M | 27.1M | 29.2M | 25.4M | 27.6M | 15.9M |
| Operating cash flow before change in receivables (EUR) | — | 855M | 524M | 115M | 1.18B | 631M | 268M |
| Free cash flow (OCF - PPE - intangibles) (EUR) | — | 780M | 361M | 43.2M | 845M | 316M | -17.2M |
| Income detail | |||||||
| Total comprehensive income (EUR) | — | 248M | 786M | 371M | 274M | 301M | 113M |
| Comprehensive income to owners (EUR) | — | 206M | 714M | 327M | 236M | 252M | 87.1M |
| Reported | Apr 7, 2022 | Apr 7, 2022 | Apr 7, 2022 | Apr 6, 2023 | Apr 4, 2024 | Apr 3, 2025 | Mar 26, 2026 |
Sign up to see institutional holdings
Sign UpPodcast Mentions
Sign up to see podcast mentions and sentiment
Sign UpRegulated information filed with the AMF (info-financiere.gouv.fr), newest first, titles as filed. Voting-rights totals, own-share transactions, threshold crossings and availability notices are left out. The link opens the filed document. Press releases from the company's own website, newest first.
30/10/2026 17:35 (FT) Share price SEB €53.90 +1.70%
 Better Living
-
**Group **
**STRATEGY **
-
**Brands **
**Multi-brand strategy **
Each brand has a well-defined identity, with a specific values which are reflected in the product offering, features and design, as well as in appropriate communication mechanics.
-
-
**Innovation **
**Innovation strategy **
**OPEN INNOVATION **
-
**Commitments **
**OUR CHALLENGES **
We remain convinced that our balanced business model, combining profitable growth and a resolutely responsible approach, creates value for all and plays a full part in our contribution to better living in households around the world.
-
**Finance **
**Finance Home **
Share price SEB €53.90 30/10/2026 - 17:35 (FT)
+1.70% Share price SUPOR RmB42.70 30/10/2026 - 9:00 (FT)
+1.67%Upcoming events
Feb 24 2027
07:30 am (CET)
2026 Sales and results - Press Release
Quiet Period from February 10 to 24, 2027
Email reminder Email reminder Email reminder Add to calendar Add to calendar Add to calendar
Email reminder
Your email address
Send Send Send
Feb 24 2027
10:00 am (CET)
2026 Sales and results - Conference
Quiet Period from February 10 to 24, 2027
Email reminder Email reminder Email reminder Add to calendar Add to calendar Add to calendar
Email reminder
Your email address
Send Send Send
Apr 21 2027
05:40 pm (CET)
1st quarter 2027 sales and financial data
Quiet Period from April 6 to 21, 2027
Email reminder Email reminder Email reminder Add to calendar Add to calendar Add to calendar
Email reminder
Your email address
Send Send Send
-
**Talent **

**HR policy **

**Graduate program **

**Careers **
-
**News **
**News **


**YOU ARE **
Analysts / Investors Analysts / Investors Analysts / Investors
Shareholders Shareholders Shareholders
Journalists Journalists Journalists
Innovation partners Innovation partners Innovation partners
Candidates Candidates Candidates
Supor share
Breadcrumb
-
FINANCE
-
Supor share price

| Corporate Name in Chinese: | 浙江苏泊尔股份有限公司 |
| Corporate Name in English: | ZHEJIANG SUPOR CO.,LTD. |
| Stock Exchange Listed with: | Shenzhen Stock Exchange |
| Short Form of the Stock: | SUPOR |
| Stock Code: | 002032 |
SUPOR share capital breakdown at 12/31/2025

DIVIDENDS DISTRIBUTED IN RESPECT OF THE LAST 5 FINANCIAL YEARS

30/10/2026 17:35 (FT) Share price SEB €53.90 +1.70%
-
**Group **
**STRATEGY **
-
**Brands **
**Multi-brand strategy **
Each brand has a well-defined identity, with a specific values which are reflected in the product offering, features and design, as well as in appropriate communication mechanics.
-
-
**Innovation **
**Innovation strategy **
**OPEN INNOVATION **
-
**Commitments **
**OUR CHALLENGES **
We remain convinced that our balanced business model, combining profitable growth and a resolutely responsible approach, creates value for all and plays a full part in our contribution to better living in households around the world.
-
**Finance **
**Finance Home **
Share price SEB €53.90 30/10/2026 - 17:35 (FT)
+1.70% Share price SUPOR RmB42.70 30/10/2026 - 9:00 (FT)
+1.67%Upcoming events
Feb 24 2027
07:30 am (CET)
2026 Sales and results - Press Release
Quiet Period from February 10 to 24, 2027
Email reminder Email reminder Email reminder Add to calendar Add to calendar Add to calendar
Email reminder
Your email address
Send Send Send
Feb 24 2027
10:00 am (CET)
2026 Sales and results - Conference
Quiet Period from February 10 to 24, 2027
Email reminder Email reminder Email reminder Add to calendar Add to calendar Add to calendar
Email reminder
Your email address
Send Send Send
Apr 21 2027
05:40 pm (CET)
1st quarter 2027 sales and financial data
Quiet Period from April 6 to 21, 2027
Email reminder Email reminder Email reminder Add to calendar Add to calendar Add to calendar
Email reminder
Your email address
Send Send Send
-
**Talent **
**HR policy **
**Graduate program **
**Careers **
-
**News **
**News **
**YOU ARE **
Analysts / Investors Analysts / Investors Analysts / Investors
Shareholders Shareholders Shareholders
Journalists Journalists Journalists
Innovation partners Innovation partners Innovation partners
Candidates Candidates Candidates
SEB SHARE
Breadcrumb
-
FINANCE
-
SEB SHARE PRICE
Groupe SEB data sheet
| Listing | Euronext Paris, Compartment A |
| Introduction date | 27 May 1975 |
| Stockmarket Index | CAC® Mid 60, SBF® 120, CAC® Mid & Small, CAC® All-Tradable, MSCI Small Caps, Euronext CDP Environment France, Euronext Family Business |
| Other information | Eligible for deferred settlement |
| > Number of shares > Capital | 55,337,770 shares of 1€ nomidal 55,337,770 € |
| ISIN code | FR0000121709 |
| Tickers | Reuters : SEBF.PA Bloomberg : SK.FP |
| LEI code | 969500WP61NBK098AC47 |
| 2025 | 2024 | 2023 | 2022 | 2021 | |
|---|---|---|---|---|---|
| Average number of daily transactions (in shares) | 78,913 | 59,888 | 56,580 | 77,708 | 64,434 |
| Price range - Highest (in €) | 95.15 | 120.20 | 115.80 | 142.00 | 159.20 |
| Price range - Lowest (in €) | 46.12 | 87.50 | 78.85 | 55.20 | 115.40 |
| Closing Price at 31 December (in €) | 49.30 | 87.30 | 113.00 | 78.25 | 136.90 |
| Average of the last 30 closing prices of the year (in €) | 48.75 | 89.71 | 107.90 | 77.90 | 134.98 |
SHARE CAPITAL BREAKDOWN
SHARE CAPITAL BREAKDOWN
AT december 31, 2025

BREAKDOWN OF VOTING RIGHTS
AT DECEMBER 31, 2025

Dividend
DILUTED EARNINGS AND DIVIDEND DISTRIBUTED PER SHARE
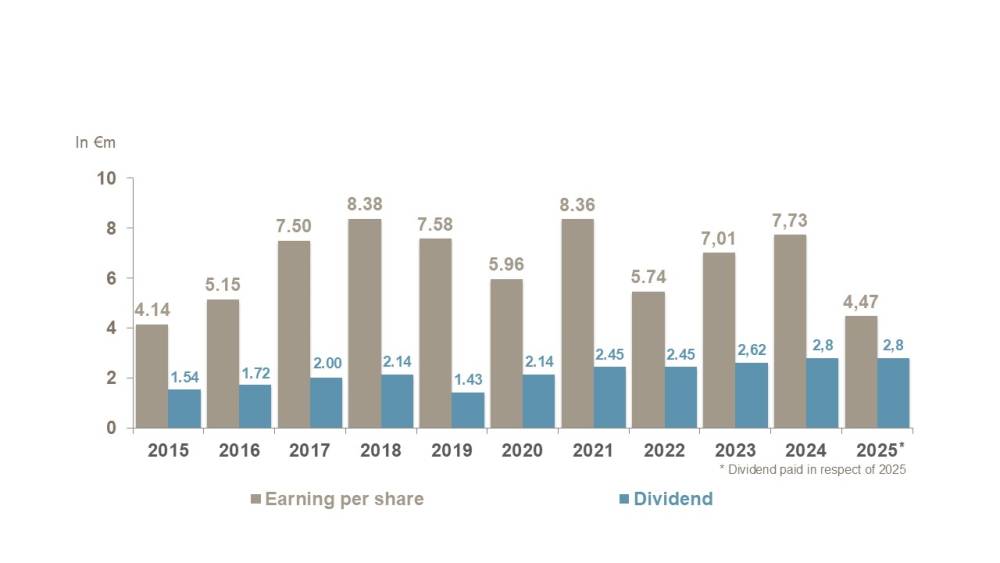
For all pure registered shares held over two consecutive financial years, the Group pays out a loyalty bonus (see the graph and table below) equal to 10% of the dividend (rounded down to an even hundredth where applicable). For a given shareholder, the loyalty bonus does not apply to a number of shares exceeding 0.5% of the share capital. Dividends lapse five years after they are initially paid out, at which point unclaimed dividends are paid to the state.
DIVIDENDS DISTRIBUTED IN RESPECT OF THE LAST 5 FINANCIAL YEARS
| YEAR | NUMBER OF SHARES REMUNERATED | DIVIDEND PER SHARE (IN €) | | | --- | --- | --- | | 2027 (in respect of FY 2026) The amount of the net dividend in respect of FY 2026 results will be proposed at the Annual General Meeting in May 2027. | | | | | 2026 (in respect of FY 2025) | | | | | Dividend Loyalty bonus | 54,880,252 19,739,027 | 2.80 0.280 | | 2025 (in respect of FY 2024) | | | | | Dividend Loyalty bonus | 54,785,816 20,499,673 | 2.80 0.280 | | | 2024 (in respect of FY 2023) | | | | | Dividend Loyalty bonus | 54,397,016 20,390,000 | 2.62 0.262 | | | 2023 (in respect of FY 2022) | | | | | Dividend Loyalty bonus | 55,058,663 20,548,779 | 2.45 0.245 | | | 2022 (in respect of FY 2021) | | | | | Dividend Loyalty bonus | 55,095,825 20,402,820 | 2.45 0.245 | |

 Better Living




Prompts
Click prompts to add them under the company line, click again to take one out, then copy the result into your AI chat. Shared by Asian Century Stocks and Uncovered Thai Stocks. Thank you.
ETFs Holding SEB SA
Exchange-traded funds whose newest published daily portfolio holds one of the company's listings, largest weight first.
| ETF | Weight in ETF | Shares | Market value | As of |
|---|---|---|---|---|
| AVDS | 0.08% | 4,409 | $ 279.311K | Nov 16, 2026 |
| AVDV | 0.07% | 201,549 | $ 12.768M | Nov 16, 2026 |
| AVSD | 0.04% | 2,271 | $ 143.868K | Nov 16, 2026 |
| DFIS | 0.04% | 33,993 | $ 2.15M | Nov 12, 2026 |
| DXIV | 0.03% | 1,077 | $ 68.115K | Nov 12, 2026 |
| DISV | 0.02% | 19,442 | $ 1.23M | Nov 12, 2026 |
| AVDE | 0.01% | 35,138 | $ 2.226M | Nov 16, 2026 |
| DFSI | 0.01% | 1,227 | $ 77.602K | Nov 12, 2026 |
| DFIC | 0.01% | 13,652 | $ 863.42K | Nov 12, 2026 |
| DFAX | 0.00% | 7,966 | $ 503.809K | Nov 12, 2026 |
| DFAI | 0.00% | 6,446 | $ 407.677K | Nov 12, 2026 |
| AVIV | 0.00% | 93 | $ 5,891.57 | Nov 16, 2026 |