GROUPE SFPI LIQUIDIDY CONTRAT H1 2026
Bull 0
Bear 0
Routine
SFPI
|
Groupe SFPI SA is a European industrial group that designs, manufactures, and distributes technical solutions for building safety, air treatment, thermal control, and access security. The company operates through four divisions: SFPI Access, which develops mechanical and electronic locking solutions for residential, commercial, and industrial environments; SFPI Home, which provides carpentry, blinds, and comfort solutions for housing and retail; SFPI Air, which designs air treatment and filtration systems for industrial and tertiary sectors; and SFPI Heat, which produces equipment for thermal flow control and sterilization in industrial processes. The group serves customers in Europe and other international regions, with a presence in numerous countries. Founded in 1985, the company has grown through acquisitions including Dupeux, Dény, Métalux, Neu, Barriquand, Steriflow, Securidev, France Fermetures, Euro Elzett, Delta Neu, Franciaflex, DOM, Eryma, Faber, Ucema, Fevi, SIPA Menuiseries, Omnitech Security, MCM, JKF, Wo&Wo, VIRO, and Tapkey. Summarised from the company's own disclosures, fiscal year ended Oct 2026 |
Industry Building Products & Equipment | Homepage sfpi-group.com |
| Sector Industrials | IR page sfpi-group.com/global/en/investor-relations | |
|
Tags
locking systems, access control, air filtration, thermal control, industrial sterilization, building security, energy efficiency, blinds, carpentry, cloud-based security, SFPI Access, SFPI Home, SFPI Air, SFPI Heat, Dupeux, Dény, Métalux, Neu, Barriquand, Steriflow, Securidev, Picard Serrures, Ronis, Fontaine, France Fermetures, Euro Elzett, Delta Neu, Franciaflex, DOM, Eryma, Faber, Ucem, Fevi, SIPA Menuiseries, Omnitech Security, MCM, JKF, NEU-JKF, Wo&Wo, VIRO, Tapkey
|
Press page sfpi-group.com/global/en/investor-relations/press-releases |
Metrics
| Valuation | |
|---|---|
| Market cap | € 227.375M |
| Market cap (USD) | $ 253M |
| P/E | 15.63 |
| PEG | — |
| P/BV | 0.82 |
| P/S | 0.36 |
| P/OCF | 5.45 |
| P/FCF | — |
| Dividend yield | — |
| Turnover / mcap | — |
| Returns | |
|---|---|
| ROE | — |
| ROI | — |
| ROIC | — |
| Profit margin | — |
| Growth | |
|---|---|
| Revenue growing | No |
| Profits growing | No |
| Revenue up 3y | No |
| Revenue up 5y | No |
| Earnings growth 3y (net profit CAGR) | -23.2% |
| Quality | |
|---|---|
| Profitable | Yes |
| Margin expanding | No |
| Buying back stock | No |
| Diluting (TTM) | No |
| Debt/Equity | 16.8% |
| Podcast bulls (TTM) | Sign up |
| Podcast bears (TTM) | Sign up |
| Podcast sentiment (TTM) | Sign up |
| Podcast sentiment % (TTM) | Sign up |
| News sentiment (TTM) | 2 |
| Quality score | -33.3% |
| Insiders | |
|---|---|
| Buys, 1w | Sign up |
| Buys, 1m | Sign up |
| Buys, 1y | Sign up |
| Sells, 1w | Sign up |
| Sells, 1m | Sign up |
| Sells, 1y | Sign up |
Sign up to see this company's insider trades
Filed figures
Lines the statements and their notes report beside the headline figures, read from the filings' XBRL as filed (no restatement applied), with figures computed from one filing's own lines. Cash-flow lines carry their cash direction: an outflow is negative. Each period links to its filing; a figure's period, report date and tag are in its tooltip.
| Figure | Dec 2020 | Dec 2021 | Dec 2022 | Dec 2023 | Dec 2024 |
|---|---|---|---|---|---|
| Balance sheet detail | |||||
| Trade receivables (EUR) | 91.5M | 90.8M | 106M | 107M | 100M |
| ↳ YoY growth | -0.7% | +17.0% | +0.4% | -6.2% | |
| Borrowings, current (EUR) | 22.6M | 20.3M | 34.4M | 30.4M | 23.1M |
| Borrowings, non-current (EUR) | 75.3M | 59.8M | 66.6M | 68.1M | 46.4M |
| Lease liabilities (EUR) | 11.4M | 10.1M | 20.9M | 19M | 18.8M |
| Cash and deposits (EUR) | 163M | 156M | 126M | 144M | 146M |
| Intangible assets (EUR) | 5.83M | 4.2M | 2.59M | 2.66M | 2.18M |
| Right-of-use assets (EUR) | 14.6M | 13.7M | 24.3M | 20.6M | 18.9M |
| Net debt (borrowings + leases - cash) (EUR) | -53.3M | -65.6M | -4.58M | -26.4M | -57.5M |
| Cash flow detail | |||||
| Operating cash flow (EUR) | 54.9M | 43.3M | 26.4M | 63.4M | 50.9M |
| Change in inventories (cash effect) (EUR) | 6.09M | -29M | -25.1M | 17.8M | 18.6M |
| Dividends paid (cash effect) (EUR) | -50,000 | -5.68M | -7.37M | -4.61M | -2.76M |
| Share buybacks (cash effect) (EUR) | -1.2M | -9.98M | -1.62M | 0.00 | 0.00 |
| Income taxes paid (cash effect) (EUR) | 10.2M | 11.6M | 10.1M | 10.1M | 12.2M |
| Income detail | |||||
| Total comprehensive income (EUR) | 15.9M | 34.3M | 25.5M | 3.6M | 15.4M |
| Comprehensive income to owners (EUR) | 15.8M | 34.1M | 25.6M | 3.89M | 15.2M |
| Reported | Apr 28, 2022 | Apr 28, 2022 | Apr 27, 2023 | Apr 29, 2024 | Apr 29, 2025 |
Sign up to see institutional holdings
Sign UpPodcast Mentions
Sign up to see podcast mentions and sentiment
Sign UpRegulated information filed with the AMF (info-financiere.gouv.fr), newest first, titles as filed. Voting-rights totals, own-share transactions, threshold crossings and availability notices are left out. The link opens the filed document. Press releases from the company's own website, newest first.



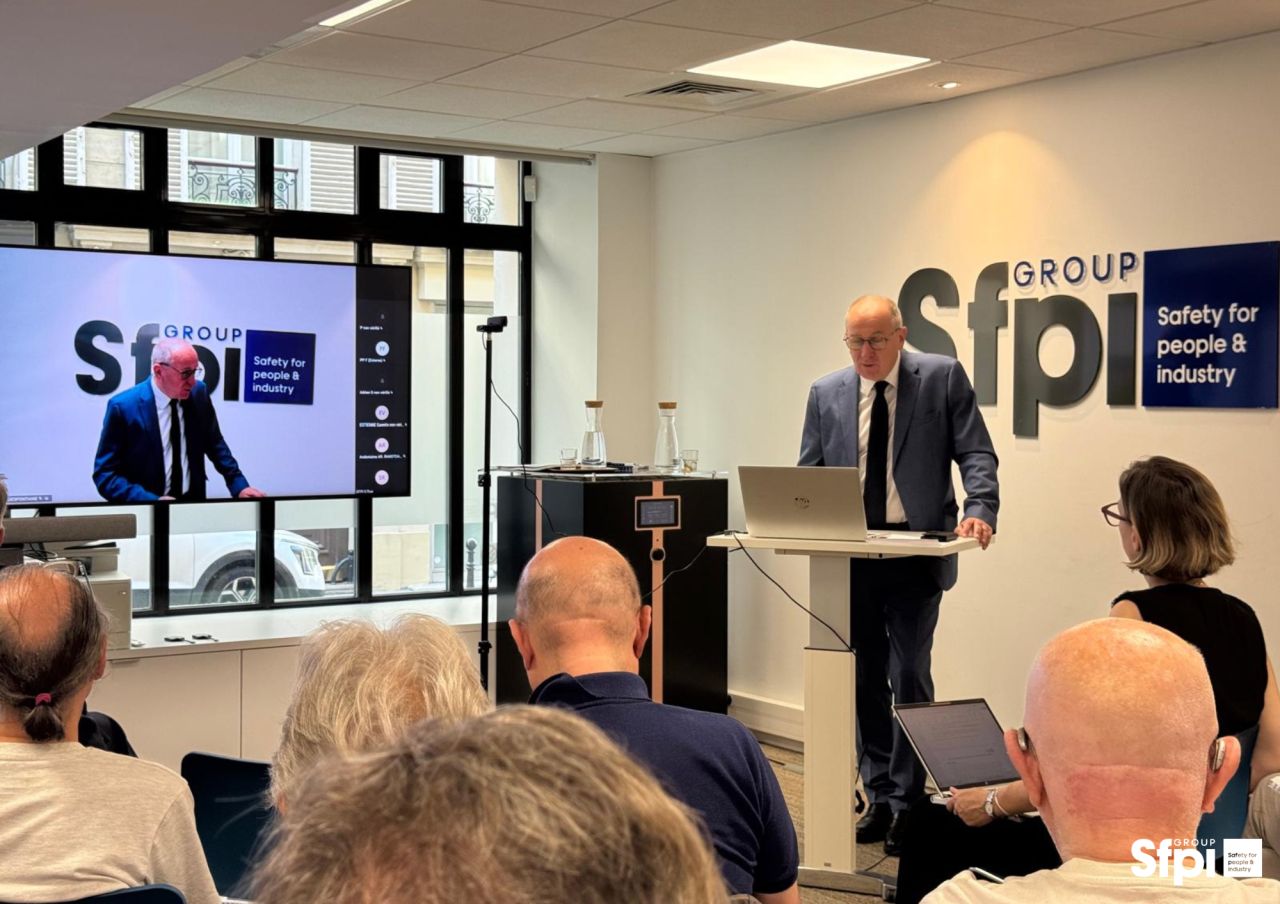
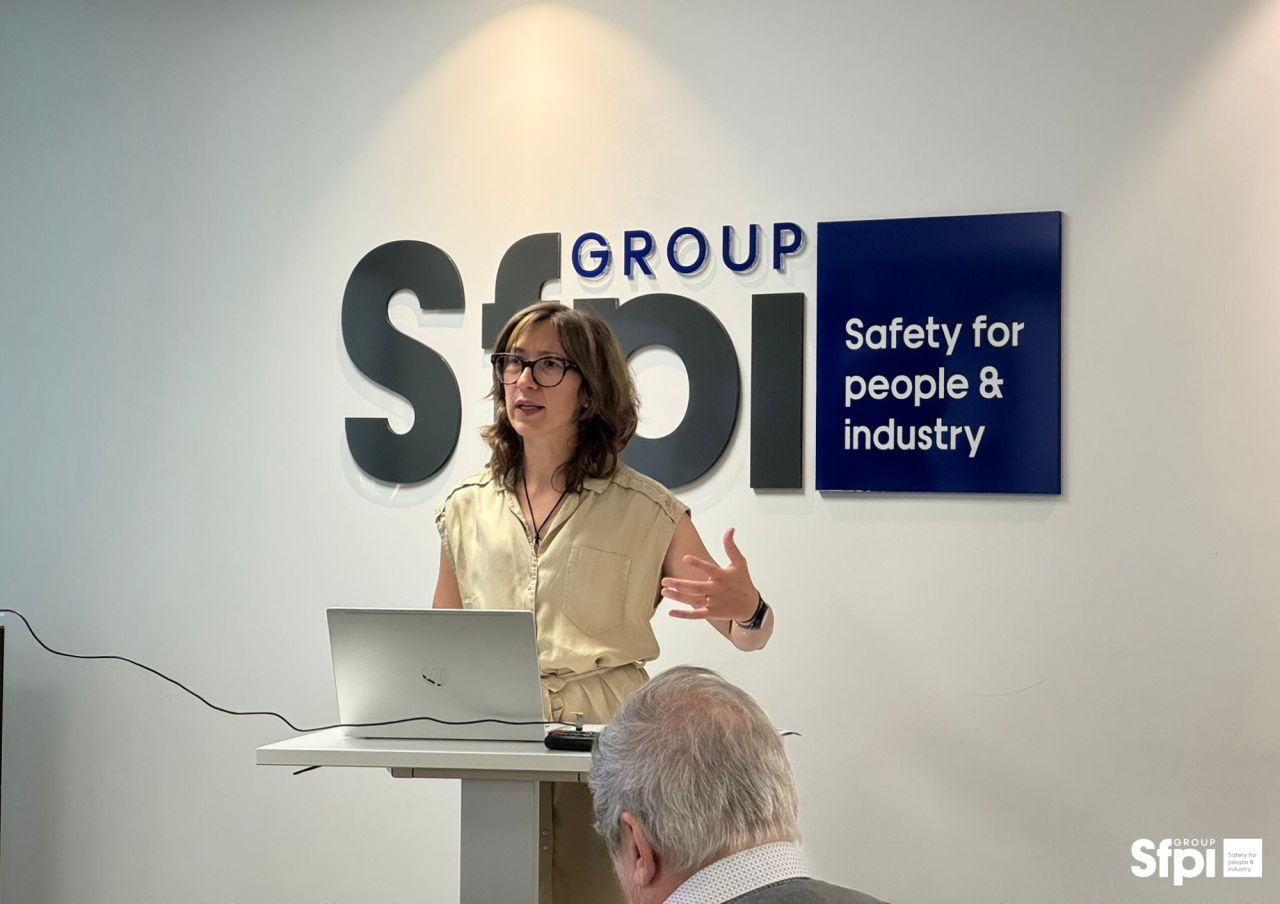
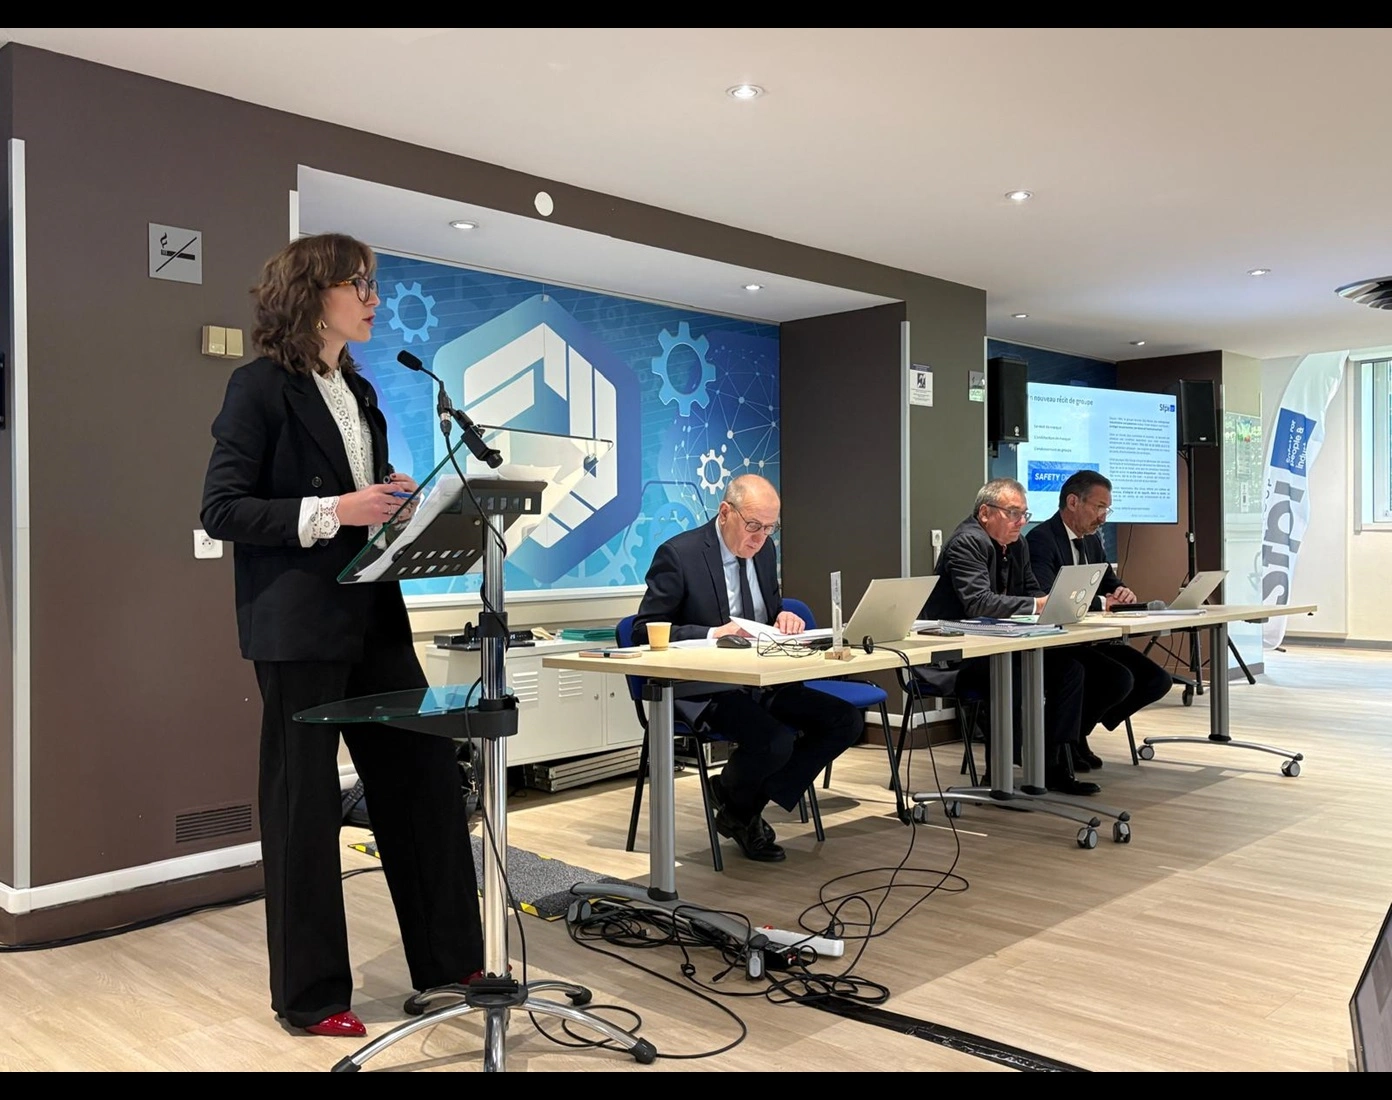
 On April 16, Sfpi Group brought together many former employees and friends for a unique moment of reunion, centered around transmission and connection.
Prompts
Click prompts to add them under the company line, click again to take one out, then copy the result into your AI chat. Shared by Asian Century Stocks and Uncovered Thai Stocks. Thank you.
Groupe SFPI SA (ticker SFPI), listed in France.
Copied
ETFs Holding Groupe SFPI SA
Exchange-traded funds whose newest published daily portfolio holds one of the company's listings, largest weight first.