Skip to main content What is fashion product development? How does fashion product development work? Why fashion product development is reaching a turning point From digital product development to AI-native product development The future of fashion…
Skip to main content
-
What is fashion product development?
-
How does fashion product development work?
-
Why fashion product development is reaching a turning point
-
From digital product development to AI-native product development
-
The future of fashion product development
-
Discover Lectra solution
Share:
What is fashion product development?
Fashion product developmentis the process through which apparel, footwear and accessories move from concept to production.
Situated between design and manufacturing, it ensures that creative ideas can be translated into commercially viable, technically feasible and profitable products.
The process typically begins with market insights, consumer trends and collection planning. It then progresses through design development, material selection, technical specifications, patternmaking, fitting sessions, costing analysis and sourcing decisions before reaching production readiness.
Product development teams operate at the intersection of several functions. They must balance creativity, technical requirements, financial constraints, supplier capabilities and time-to-market objectives.
This role has become increasingly complex. Modern brands manage larger assortments, shorter product cycles and growing volumes of product data. A single garment may generate dozens of versions, technical files, supplier comments, fit reviews and material references before reaching production.
As a result, fashion product development is no longer simply about managing products. It is increasingly about managing information, knowledge and collaboration at scale.
How does fashion product development work?
Successful product development follows a structured process that helps teams balance creativity, quality, speed, and profitability.
1. Material sourcing
Materials have a major impact on quality, cost, sustainability, and manufacturability.
Key considerations include:
Choosing the right materials early helps avoid delays later in development.
2. Patternmaking
Patterns translate design concepts into technical specifications that manufacturers can use.
This stage may involve:
-
Pattern creation
-
Grading
-
Technical adjustments
-
Fit engineering
-
Digital patternmaking
Accuracy at this stage is critical for minimizing costly revisions.
3. Sampling and prototyping
Samples allow teams to validate product concepts before committing to production.
Objectives include:
-
Fit validation
-
Quality assessment
-
Construction review
-
Stakeholder approvals
Historically, multiple physical samples have been required, extending timelines and increasing costs.
4. Costing and production planning
Teams evaluate whether products can meet target margins and business objectives.
Activities include:
This step ensures products remain commercially viable.
5. Manufacturing readiness
Before production begins, all technical information must be finalized and shared with manufacturing partners.
This includes:
-
Tech packs
-
Specifications
-
Measurement standards
-
Bill of materials
-
Production instructions
The quality of this information directly impacts production efficiency and product consistency.
Why fashion product development is reaching a turning point
Fashion industry transformations
The fashion industry has undergone significant transformation in recent years. Global supply chains, shifting consumer expectations, economic uncertainty, and sustainability requirements have increased the complexity of product creation.
-
Shorter product lifecycles: Consumers expect new products and collections more frequently than ever before. Brands must react quickly to trends while maintaining quality and profitability.
-
Increasing supply chain complexity: Modern fashion supply chains often involve multiple suppliers, factories, and regions. Coordinating product information across all stakeholders creates significant operational challenges.
-
Sustainability and compliance pressures: Brands are facing rising expectations regarding traceability, responsible sourcing, and environmental impact. Product development teams must consider these requirements from the earliest stages of creation.
-
Growing product assortments: Many brands are managing larger collections and greater product diversity, increasing the volume of data and decision-making required throughout development.
-
Data fragmentation: Product information is often spread across spreadsheets, emails, shared drives, and disconnected systems, making collaboration difficult and limiting visibility.
Fashion product development challenges
Despite technological advances, many fashion companies continue to face persistent challenges.
-
Manual workflows: Many teams still rely heavily on spreadsheets, emails, and disconnected processes. This creates duplicate work,slower approvals, increased errors, limited visibility.
-
Communication gaps:Product development requires collaboration across multiple departments and external partners. Without centralized information, miscommunication can easily occur between design, sourcing, technical development, and production teams.
-
Long development cycles:Traditional workflows often involve numerous revisions, approvals, and physical samples, extending lead times.
-
Data silos:When product information exists across multiple systems, teams struggle to access accurate, up-to-date data.
-
**Knowledge retention:**Many organizations depend on experienced employees whose expertise is difficult to capture and transfer to future generations of workers.
From digital product development to AI-native product development
How AI is transforming the daily work of product development teams
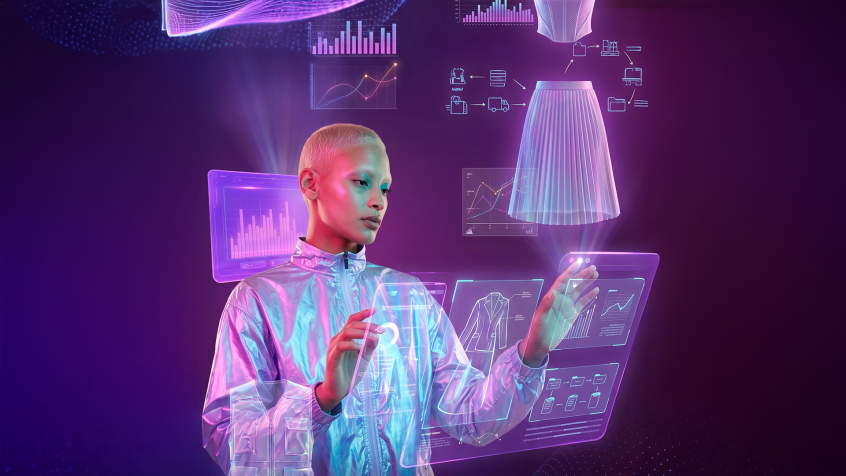
Artificial intelligence is reshaping product development by helping teams work faster, make more informed decisions, and automate repetitive processes.
Rather than replacing human creativity, AI enables professionals to focus on higher-value activities.
AI for trend forecasting:AI can analyze large volumes of market, social, retail, and consumer data to identify emerging trends earlier. Benefits include faster trend detection, improved demand forecasting, more informed collection planning.
AI for design support:AI-powered tools can help generate ideas, analyze consumer preferences, and support concept exploration. Designers remain in control while gaining access to additional insights and inspiration.
AI for workflow automation:Many administrative tasks can now be automated. This reduces manual effort and improves efficiency.
AI for data management: AI enables organizations to better organize, analyze, and leverage product information. Improved access to accurate data supports faster and more confident decision-making.
AI for predictive insights: By analyzing historical and real-time information, AI can help identify potential issues before they impact development timelines or product performance.
Differences between traditional, digital and AI-native product development
Digital product development focused on connecting data and digitizing workflows.
AI-native product development builds on that foundation by making information more accessible and actionable.
| | Traditional product development | Digital product development | AI-native product development |
| Information management | Documents and spreadsheets | Centralized data platforms | Contextual access to knowledge |
| Knowledge ownership | Expertise held by individuals | Shared product data | Shared expertise and product knowledge |
| Information retrieval | Manual information search | Structured search | Conversational search |
| Collaboration model | Functional silos | Connected workflows | Connected and intelligent workflows |
| Decision-making approach | Information-driven decisions | Data-driven decisions | Knowledge-driven decisions |
In this context, AI-native does not mean automated product development. It means embedding intelligence into day-to-day workflows so teams can access relevant information faster, reduce friction and leverage organisational knowledge more effectively.
The future of fashion product development
Next generation of product creation
The future of fashion product development will be increasingly connected, intelligent, and data-driven.
Several trends are expected to shape the next generation of product creation:
-
AI-powered copilots: AI assistants will help teams access information, generate insights, and automate routine tasks.
-
Connected product ecosystems: Product data will flow more seamlessly across design, development, sourcing, and manufacturing processes.
-
Advanced digital workflows:Organizations will continue replacing manual processes with digital collaboration and automation.
-
Increased traceability:Regulatory requirements and consumer expectations will drive greater transparency throughout product development.
-
**Data-driven decision-making:**Successful brands will increasingly rely on real-time intelligence rather than intuition alone.
Organizations that embrace these capabilities will be better positioned to increase agility, improve profitability, and bring innovative products to market faster.
What changes for patternmakers and technical teams?
The impact of AI on patternmaking is often misunderstood. Despite concerns about automation, the expertise of patternmakers remains essential. Garment construction, fit validation, grading strategies and manufacturing feasibility continue to require human judgement.
What is changing is the way technical teams access and use information. Patternmakersincreasingly work in environments where historical patterns, measurement specifications, grading standards and fitting feedback can be retrieved more easily. Instead of spending time searching through archives or requesting information from colleagues, technical teams can focus on problem-solving and product optimisation.
AI is also supporting documentation workflows. Technical standards, construction guidelines and historical development knowledge become easier to access and share across teams. Rather than replacing expertise,AI amplifies the value of expertise by making it more discoverable.
What are the benefits of AI-enabled fashion product development?
The benefits are often less spectacular than popular narratives suggest, but they are highly valuable from an operational perspective.
-
The first benefit isproductivity. Teams spend less time searching for information and more time creating, validating and improving products.
-
The second is collaboration. Shared access to information reduces dependency on specific individuals and improves alignment between departments.
-
Visibilityalso improves. Product information becomes easier to access across the organisation, supporting faster and more informed decisions.
-
From a quality perspective, easier access to historical knowledge helps teams apply proven practices and reduce avoidable mistakes.
-
Finally, improved efficiency contributes to one of the industry's most important objectives: reducing time-to-market without compromising product quality.
Discover Lectra solution
As fashion product development becomes increasingly dependent on knowledge, organisations need better ways to access and leverage information across teams.
Apogy helps fashion companies make product, process and business knowledge more accessible through AI-powered experiences designed for everyday workflows.
For organisations looking to evolve from digital product development toward more knowledge-driven ways of working, this type of capability is becoming increasingly relevant.
Apogy
Reinvent fashion product development
Discover Apogy
Frequently Asked Questions (FAQ)
What is fashion product development?
Fashion product development is the process of transforming a design concept into a manufacturable and commercially viable product through activities such as design refinement, material selection, patternmaking, sourcing and production preparation.
Why is fashion product development important?
It ensures that products meet consumer expectations, quality standards, cost targets and production requirements while supporting business profitability and brand objectives.
What are the main stages of fashion product development?
Key stages include collection planning, product design, material selection, pattern development, fitting, sourcing, costing, product validation and production preparation.
How is AI changing fashion product development?
AI is helping teams access information more efficiently, reuse organisational knowledge, improve collaboration and support decision-making throughout the product development process.
What is the difference between digital product development and AI-native product development?
Digital product development focuses on digitising workflows and product data. AI-native product development builds on these foundations by making information and expertise easier to access and use within everyday workflows.
How is AI affecting patternmaking?
AI can support patternmakers by improving access to historical patterns, grading standards, fitting information and technical documentation. However, human expertise remains essential for garment construction and fit decisions.
Technical glossary
Bill of materials (BOM)
A bill of materials (BOM) is a comprehensive list of all components required to manufacture a product. In fashion, a BOM typically includes fabrics, trims, labels, packaging elements and accessories, together with supplier references and quantities.
Digital product development
Digital product development refers to the use of digital technologies such as product lifecycle management (PLM), 3D design and virtual prototyping to manage and accelerate product creation processes while reducing reliance on physical samples.
Fit development
Fit development is the process of evaluating and refining how a garment fits on the body. It includes fittings, measurement reviews, prototype assessment and design adjustments to ensure that the product meets the brand's fit standards.
Grading
Grading is the process of adapting a base pattern into multiple sizes while maintaining the intended proportions, fit and aesthetic of the garment.
Patternmaking
Patternmaking is the process of transforming a design concept into a set of templates used to cut and assemble a garment. Patterns define the dimensions, shape and construction of each component of the product.
Product lifecycle management (PLM)
Product lifecycle management (PLM) is the process of managing product information, workflows and collaboration from concept development through production and beyond. PLM platforms provide a centralised environment for storing and managing product data.
Product knowledge management
Product knowledge management is the practice of capturing, organising and sharing product-related information across teams. This knowledge may include technical standards, historical collection data, supplier expertise, fit guidelines and development best practices.
Sample development
Sample development is the process of creating prototypes during product development. Samples are used to evaluate design intent, fit, construction methods, material performance and production feasibility before manufacturing begins.
Technical development
Technical development is the process of translating a design concept into a manufacturable product. It includes garment construction, material specifications, fit validation, sizing, grading and production readiness.
Technical package (tech pack)
A technical package, often called a tech pack, is a document used to communicate product requirements to manufacturers and suppliers. It typically includes sketches, measurements, construction details, materials, components and production instructions.
Time-to-market
Time-to-market refers to the period required to bring a product from concept to commercial launch. Reducing time-to-market is a key objective for fashion brands seeking to respond quickly to consumer demand and changing market trends.
Related Content

Fashion
Customer stories
Published on October 29, 2026
Read more
Fashion
Trends & insights
Published on October 19, 2026
Read more

Fashion
Product-related articles
Published on October 16, 2026
Read more
Fashion
Product-related articles
Published on October 13, 2026
Read more
Fashion
Trends & insights
Published on October 8, 2026
Read more
Fashion
Trends & insights
Published on September 15, 2026
Read more
Fashion
Trends & insights
Published on September 15, 2026
Read more
✓
Thanks for sharing!
AddToAny
More…

 Our goal is to progressively extend the use of Apogy across our entire group. Following the implementation within Intimissimi, we plan to involve other brands such as Calzedonia, expanding the number of users and pattern makers working with the solution and creating an increasingly integrated process. This will enable us to adopt an end-to-end approach together with our manufacturing facilities and work in a more standardized and coordinated way across the organization.”