en English Français Italiano 简体中文 日本語 Group Houses Talent Sustainability Finance Press join us Filter by By date From most recent to oldest From oldest to most recent By section Sustainability Finance Press Talent Group Houses 0 results for ""…
en
join us
![]()

Filter by
By date
From most recent to oldest
From oldest to most recent
By section
Sustainability
Finance
Press
Talent
Group
Houses
0 results for ""
Listen
Finance
Thursday, October 22, 2026
Revenue for the 3rd quarter of 2026

Disciplined execution and tangible progress on the Group's strategic priorities in a challenging environment
Focused action plan to restore Gucci desirability and rebuild foundations for sustainable growth
Solid momentum at Saint Laurent, Bottega Veneta, Brioni, Kering Jewelry and Kering Eyewear, with clear action plans to further unlock their full potential
Revenue : €3,345 million
Stable on a reported basis, -1% on a comparable basis
“Third-quarter revenue reflects the phasing we anticipated, in a softer macroeconomic environment.
The recovery of Gucci remains our defining priority. We are steadily strengthening desirability and advancing our product development at pace. Reflecting the complementarity of our portfolio, Saint Laurent, Bottega Veneta and Brioni, as well as Kering Eyewear and Kering Jewelry, continue to extend their strong trajectory and we are doubling down on the renewal of Balenciaga and Alexander McQueen.
Unlocking the Group's full potential requires restoring momentum at Gucci, accelerating on product excellence, delivering our action plan in China, realizing the full benefits of our Group platform and embedding a culture of execution across the organization.
The transformation of Kering is a multi-season undertaking, but the improvements we are seeing across the Group, notably in desirability and key operating indicators, reinforce our confidence in the direction we have set, and the determination of our teams to deliver it.”
Luca de Meo, Directeur général de Kering
Kering revenue in the third quarter of 2026 amounted to €3,345 million, stable as reported and down 1% on a comparable basis year-on-year. The change in reported revenue included a positive currency effect of 1 percentage point and no scope impact.
Third-quarter revenue reflected the anticipated second-half phasing and a more difficult comparison base, compounded by softer macroeconomic trends. Traffic remained the main constraint, while conversion, average price and average ticket remained supportive across most Houses, helped by stronger product execution and improved client engagement.
By channel, in the third quarter:
• Sales from the directly operated retail network, including e-commerce, declined by 3% on a comparable basis, remaining uneven across regions and Houses.
• Wholesale and Other revenues were up 3% on a comparable basis.
In the first nine months of 2026, the Group generated revenue of €10,565 million, down 2% as reported and stable on a comparable basis, while advancing the optimization of its store network. Following 75 net store closures in 2025, Kering completed a further 105 net store closures during the first nine months of the year, including 128 closures and 23 openings, thereby exceeding its full-year objective of 100 net closures ahead of schedule. The Group now plans at least 125 net closures for the full year 2026.
Kering Fashion & Leather Goods
In the third quarter of 2026, Kering Fashion & Leather Goods revenue amounted to €2,743 million, down 1% as reported and 3% on a comparable basis.
The performance of Gucci, which is part of this segment, is detailed in a dedicated section.
Sales in the directly operated retail network were down 4% on a comparable basis. Excluding Gucci, retail sales increased by 2%, driven by continued growth at Saint Laurent, Bottega Veneta and Brioni, underscoring the increasing breadth of the Group’s portfolio.
• Saint Laurent growth was notably driven by sustained momentum in North America and Western Europe, and strong engagement from VICs (Very Important Clients) and Core clients.
• Bottega Veneta again outperformed across key markets, supported by sustained brand desirability, strong momentum in leather goods and successful product introductions. The House also advanced its diversification strategy, notably in ready-to-wear, while benefitting from strong engagement among VICs.
• Balenciaga remained resilient in leather goods, while its ready-to-wear and shoes categories were still challenged.
• Alexander McQueen pursued its repositioning, sharpening its British tailoring identity, enhancing its product offering and streamlining its distribution footprint as part of its turnaround plan.
• Brioni maintained strong growth, supported by its highly personalized client relationship and the strength of its bespoke offer.
Wholesale and Other revenues of the segment increased by 4% on a comparable basis.
of which Gucci
Gucci recorded revenue of €1,291 million in the third quarter, down 4% as reported and down 6% on a comparable basis.
The performance of Gucci reflected a more demanding comparison base and a less pronounced newness effect than in the second quarter. While traffic remained the main constraint, conversion, average price and average ticket improved further, supported by the progressive rollout of new collections.
The House pressed ahead with its product transformation agenda, further refining its product and pricing architecture, enhancing quality and improving time to market. Handbags were at the forefront of these efforts, supported by a richer offering, while ready-to-wear and shoes remain key areas of focus.
Sales from the directly operated retail network declined by 9% on a comparable basis. North America remained the House’s most resilient market against a more demanding comparison base, while lower traffic weighed on performance in Asia Pacific, particularly in Mainland China, and in Japan.
Wholesale and Other revenues were up 35% on a comparable basis in the third quarter. Wholesale, which amounted to €120 million, or 9% of the quarterly sales, was up 45% on a comparable basis, reflecting a low comparison base and order-book effects as new collections came through.
Kering Jewelry
In the third quarter of 2026, Kering Jewelry delivered another strong performance against a more demanding comparison base. Revenue amounted to €239 million, up 12% as reported and 11% on a comparable basis, reflecting the strength of the division’s complementary Houses.
Boucheron maintained strong momentum, supported by the enduring appeal of its iconic collections Quatre and Serpent Bohème and good performance in Japan and South Korea. Pomellato continued to build momentum, particularly in Japan, driven by sustained demand for Nudo, Iconica and Together. Performance at DoDo and Qeelin was mixed, though the Houses moved forward with their product initiatives, notably with Qeelin’s successful launch of Wulu Purple Jade.
Sales in the directly operated retail network increased by 18% on both a reported and a comparable basis, while Wholesale and Other revenues decreased by 6%.
Kering Eyewear
In the third quarter of 2026, Kering Eyewear revenue amounted to €373 million, up 6% as reported and up 4% on a comparable basis, reflecting the resilience of the business despite the anticipated phasing effects between the third and fourth quarters. Performance was supported by ongoing innovation and strong commercial execution across the portfolio, with growth across all regions. Key developments during the quarter included the launch of the Fall Winter 2026 collection of Maui Jim, initiatives celebrating the fortieth anniversary of Lindberg, as well as successful sales and marketing campaigns across key markets.
Corporate & Other
In the third quarter of 2026, revenue from Corporate & Other amounted to €27 million, down 5% on a reported and a comparable basis, primarily reflecting the end of rental income following the real estate transactions.
Within the segment, Ginori 1735 delivered strong double-digit growth, reflecting the steady progress in brand development and desirability across key markets.
Outlook
Kering is fully mobilized on the execution of its strategic plan. The Group continues to prioritize the quality of its revenue and the depth of its transformation, with progress on both fronts: several Houses are showing strong momentum and the recovery at Gucci is gradually taking shape.
While short-term revenue trends reflect a more challenging macroeconomic environment, Kering confirm its objective of improving its recurring operating margin in 2026, supported by the efficiency measures under way, while maintaining strong investment in the desirability of its Houses.
HIGHLIGHTS AND ANNOUNCEMENTS DURING THE THIRD QUARTER
Gucci and L’Oréal entered a 50-year exclusive beauty license, one year ahead of schedule
On July 7, 2026, Gucci and L’Oréal entered into a 50-year exclusive beauty license agreement, expected to become effective in mid-2027, subject to customary regulatory approvals and the early redemption of the existing agreement between Gucci and Coty. By combining the global desirability and distinctive creative vision of Gucci with the unparalleled expertise of L’Oréal in beauty, innovation capabilities and worldwide distribution network, the partnership aims to unlock significant long-term growth opportunities across fragrance and beauty.
Romain Spitzer appointed Chief Executive Officer of Bottega Veneta
On July 15, 2026, Romain Spitzer was appointed Chief Executive Officer of Bottega Veneta, effective since September 1, 2026. He reports to Luca de Meo and joins the Executive Committee of Kering. He brings more than thirty years of international experience in the luxury industry, with extensive expertise in brand
stewardship, retail excellence, and client experience.
Kering Jewelry leadership appointments
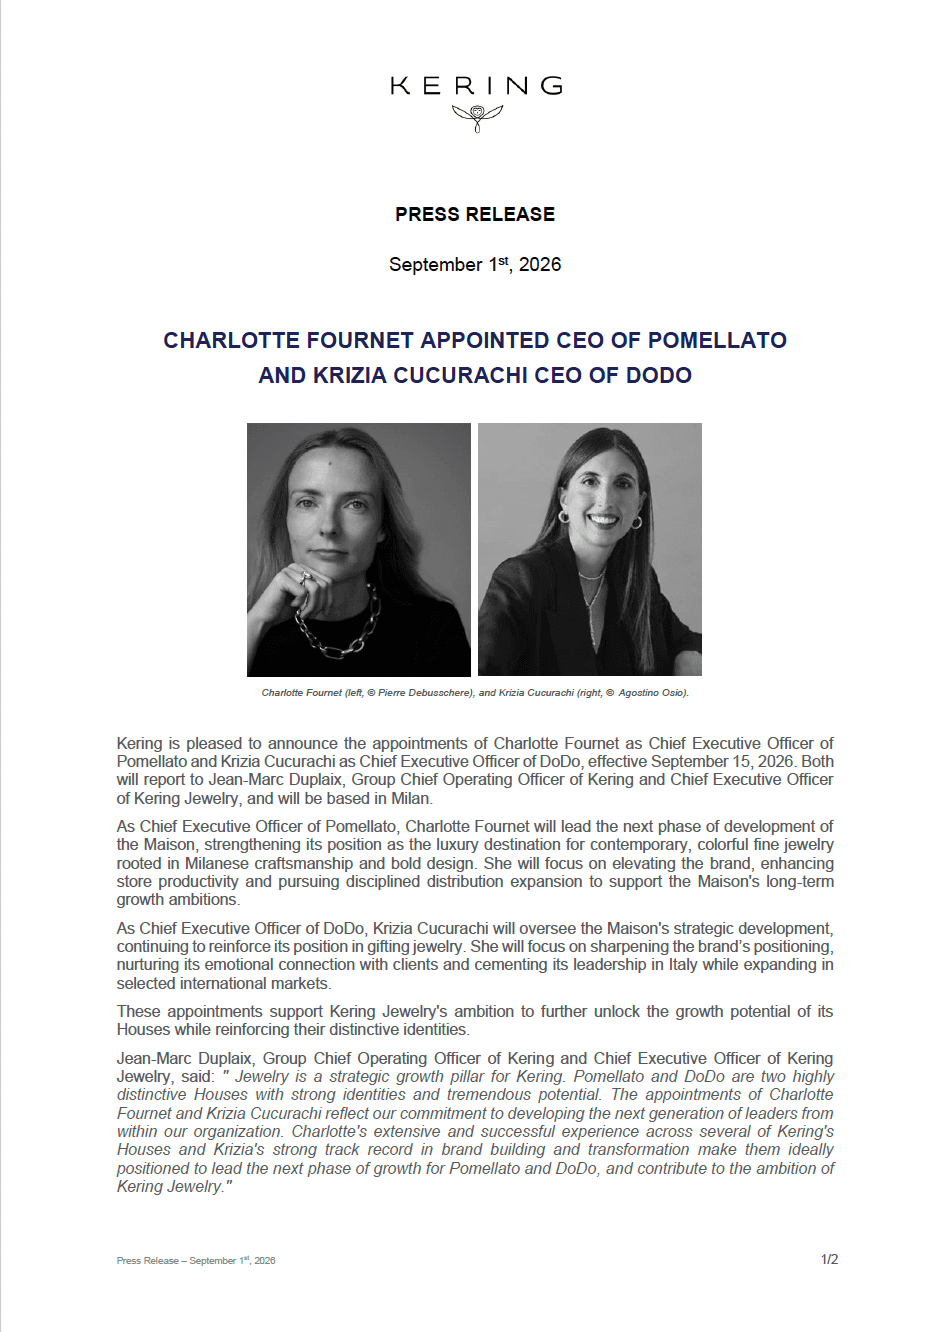
On September 1, 2026, Kering announced the appointment of Charlotte Fournet as Pomellato Chief Executive Officer and Krizia Cucurachi as DoDo Chief Executive Officer, both effective since September 15, 2026, and reporting to Jean-Marc Duplaix, Group Chief Operating Officer and Chief Executive Officer
of Kering Jewelry. These appointments support Kering Jewelry's ambition to further unlock the growth potential of its Houses while reinforcing their distinctive identities.
Sabina Belli appointed President of Kering Italia
On September 1, 2026, Sabina Belli was appointed President of Kering Italia, effective since September 15, 2026, reporting to Luca de Meo, Chief Executive Officer of Kering. In her new role, she represents Kering in Italy and strengthens the Group’s dialogue with public institutions, luxury industry associations and key stakeholders. In addition, she continues to oversee the Kering Accademia per le Eccellenze.
Sophie Maddaloni appointed General Secretary of Kering
On September 1, 2026, Sophie Maddaloni was appointed General Secretary of Kering, effective immediately, joining the Group Executive Committee and reporting to Jean-Marc Duplaix, in his capacity as Group Chief Operating Officer. In her new role, she is responsible for the Group's governance and for
safeguarding its interests, as well as for upholding the highest standards of compliance. She oversees the Legal, Internal Control, Internal Audit, and Security departments, working closely with Executive Management and the Board of Directors.
Departure of Anthony Vaccarello from Saint Laurent
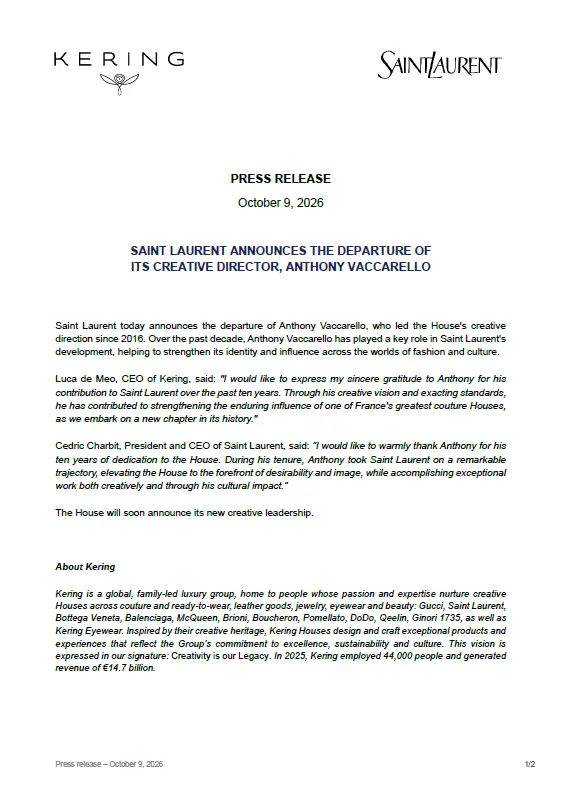
On October 9, 2026, Saint Laurent announced the departure of its creative director, Anthony Vaccarello. Over the past decade, Anthony Vaccarello has played a key role in Saint Laurent's development, helping to strengthen its identity and influence across the worlds of fashion and culture. The House will soon announce its new creative leadership.
Departure of Seán McGirr from Alexander McQueen
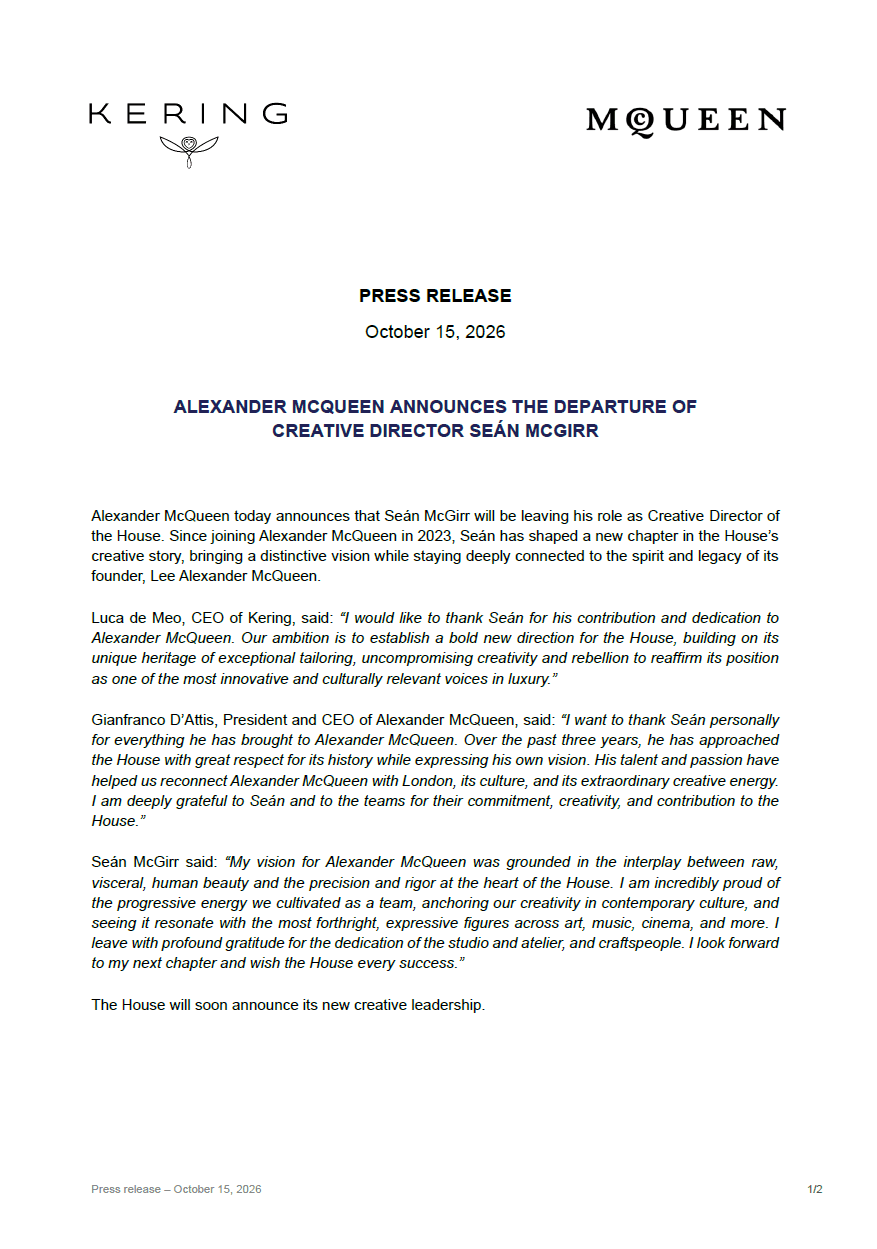
On October 16, 2026, Alexander McQueen announced the departure of its creative director, Seán McGirr. Since joining Alexander McQueen in 2023, Seán has shaped a new chapter in the House’s creative story, bringing a distinctive vision while staying deeply connected to the spirit and legacy of its founder, Lee
Alexander McQueen. The House will soon announce its new creative leadership.
About Kering
Kering is a global, family-led luxury group, home to people whose passion and expertise nurture creative Houses across couture and ready-to-wear, leather goods, jewelry, eyewear and beauty: Gucci, Saint Laurent, Bottega Veneta, Balenciaga, Alexander McQueen, Brioni, Boucheron, Pomellato, DoDo, Qeelin, Ginori 1735, as well as Kering Eyewear. Inspired by their creative heritage, Kering Houses design and craft exceptional products and experiences that reflect the Group’s commitment to excellence, sustainability and culture. This vision is expressed in our signature: Creativity is our Legacy. In 2025, Kering employed 44,000 people and generated
revenue of €14.7 billion.
Contacts
Press
Emilie Gargatte +33 (0)1 45 64 61 20 [email protected]
Marie de Montreynaud +33 (0)6 13 17 14 75 [email protected]
Analysts/investors
Philippine de Schonen +33 (0)6 13 45 68 39 [email protected]
Victoria Gerard +33 (0)6 79 39 85 16 [email protected]
Published on 10/22/2026
Revenue for the 3rd quarter of 2026
see more
Published on 10/15/2026
Alexander McQueen announces the departure of Creative Director Seán McGirr
see more
[](https://www.kering.com/en/news/kering-holds-the-first-kering-generation-award-x-india-ceremony/ "Kering holds the first "Kering Generation Award X India" ceremony")
Published on 10/14/2026
[Kering holds the first "Kering Generation Award X India" ceremony](https://www.kering.com/en/news/kering-holds-the-first-kering-generation-award-x-india-ceremony/ "Kering holds the first "Kering Generation Award X India" ceremony")
[see more](https://www.kering.com/en/news/kering-holds-the-first-kering-generation-award-x-india-ceremony/ "Kering holds the first "Kering Generation Award X India" ceremony")
Published on 10/09/2026
Saint Laurent announces the departure of its creative director, Anthony Vaccarello
see more
Published on 10/08/2026
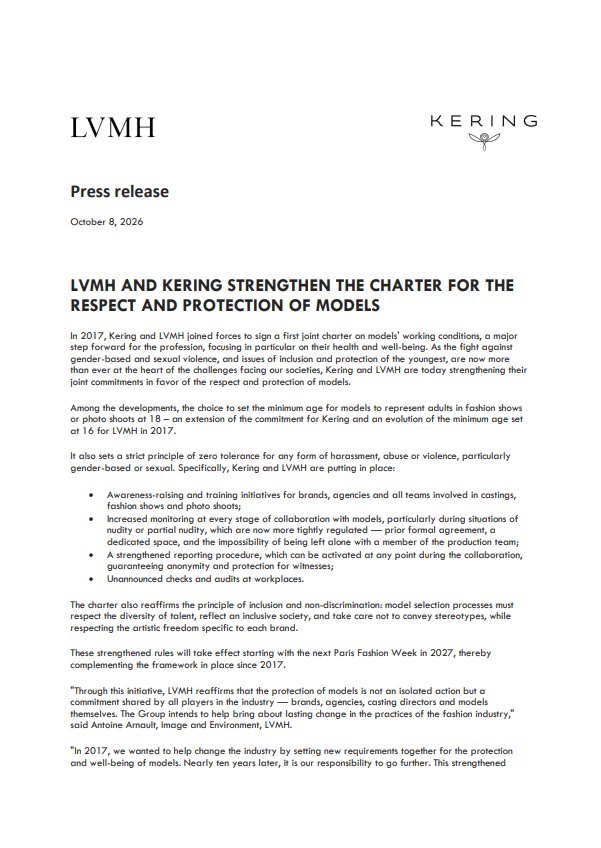
Kering strengthens the charter for the respect and protection of models
see more
Published on 10/07/2026
Kering and the Center for Sustainable Fashion Explore New Ways of Decision-Making in the Luxury Industry
see more
© Kering 2026. All rights reserved