GTT - Statement of own shares dealings from November 2 to 5, 2026
Bull 0
Bear 0
Routine
|
Gaztransport & Technigaz SA is an engineering company specializing in containment systems for the transport and storage of liquefied natural gas (LNG) and other cryogenic gases. The group provides engineering, consultancy, training, maintenance support, and technical design services to shipyards and operators. Its core technologies include the Mark III Flex, NO96 Evolution, and GTT NEXT1 membrane systems for LNG carriers, as well as GTT MARSTM for LPG transport. The company also offers solutions for LNG as a maritime fuel, offshore gas facilities, and multi-gas carriers. Through its subsidiary Elogen, GTT designs and assembles proton exchange membrane electrolysers for green hydrogen production. The group serves customers across the LNG value chain, including major shipyards and energy companies, with operations in Europe, North America, and Asia. Notable subsidiaries include Cryovision for services, GTT Training Ltd for education, and Ascenz Marorka for digital fleet performance solutions. The company was formed in 1994 from the merger of Gaztransport and Technigaz. Summarised from the company's own disclosures, fiscal year ended Apr 2026 |
Industry Engineering & Construction | Homepage gtt.fr |
| Sector Industrials | IR page gtt.fr | |
|
Tags
lng containment systems, cryogenic engineering, lng carriers, green hydrogen, electrolyser design, maritime fuel solutions, offshore gas facilities, fleet performance management, shipyard advisory, lpg transport, Mark III Flex, NO96 Evolution, GTT NEXT1, GTT MARSTM, Elogen, Cryovision, GTT Training Ltd, Ascenz Marorka, Vessel Performance Solutions, GTT Energy, Sloshield, HEARS, GTT North America, GTT South East Asia Pte., GTT Strategic Ventures
|
Press page gtt.fr/news |
Metrics
| Valuation | |
|---|---|
| Market cap | € 5.748B |
| Market cap (USD) | $ 6.446B |
| P/E | 13.85 |
| PEG | 0.29 |
| P/BV | 9.34 |
| P/S | 7.16 |
| P/OCF | 13.58 |
| P/FCF | — |
| Dividend yield | 2.8% |
| Turnover / mcap | — |
| Returns | |
|---|---|
| ROE | 78.7% |
| ROI | 70.1% |
| ROIC | 69.0% |
| Profit margin | 51.5% |
| Growth | |
|---|---|
| Revenue growing | Yes |
| Profits growing | Yes |
| Revenue up 3y | Yes |
| Revenue up 5y | No |
| Earnings growth 3y (net profit CAGR) | 47.7% |
| Quality | |
|---|---|
| Profitable | Yes |
| Margin expanding | No |
| Buying back stock | No |
| Diluting (TTM) | No |
| Debt/Equity | 6.8% |
| Podcast bulls (TTM) | Sign up |
| Podcast bears (TTM) | Sign up |
| Podcast sentiment (TTM) | Sign up |
| Podcast sentiment % (TTM) | Sign up |
| News sentiment (TTM) | 163 |
| Quality score | 27.8% |
| Insiders | |
|---|---|
| Buys, 1w | Sign up |
| Buys, 1m | Sign up |
| Buys, 1y | Sign up |
| Sells, 1w | Sign up |
| Sells, 1m | Sign up |
| Sells, 1y | Sign up |
Sign up to see this company's insider trades
Filed figures
Lines the statements and their notes report beside the headline figures, read from the filings' XBRL as filed (no restatement applied), with figures computed from one filing's own lines. Cash-flow lines carry their cash direction: an outflow is negative. Each period links to its filing; a figure's period, report date and tag are in its tooltip.
| Figure | Dec 2018 | Dec 2019 | Dec 2020 | Dec 2021 | Dec 2022 | Dec 2023 | Dec 2024 | Dec 2025 |
|---|---|---|---|---|---|---|---|---|
| Balance sheet detail | ||||||||
| Trade receivables (EUR) | — | — | 104M | 70.8M | 118M | 158M | 186M | 190M |
| ↳ YoY growth | -31.8% | +66.7% | +34.1% | +17.7% | +2.0% | |||
| ↳ 5y CAGR | +12.8% | |||||||
| Cash and deposits (EUR) | 173M | 169M | 142M | 204M | 213M | 268M | 343M | 347M |
| Intangible assets (EUR) | — | 2.76M | 4.89M | 10.4M | 18.5M | 23.1M | 37.3M | 168M |
| Cash flow detail | ||||||||
| Operating cash flow (EUR) | — | 128M | 154M | 213M | 139M | 216M | 361M | 423M |
| Purchases of property, plant and equipment (EUR) | — | -9.02M | -13.7M | -16M | -20.5M | -43.1M | -61.7M | -40.3M |
| Change in receivables (cash effect) (EUR) | — | 12.6M | -18.7M | 33M | -46.8M | -40.2M | -27.9M | 4.3M |
| Change in inventories (cash effect) (EUR) | — | -3.46M | 691,000 | 1.05M | -4M | -6.14M | -10M | 8.9M |
| Change in payables (cash effect) (EUR) | — | 5.37M | 3.73M | 2.83M | 2.43M | 8.59M | 12.2M | -15.9M |
| Dividends paid (cash effect) (EUR) | — | -122M | -158M | -116M | -122M | -126M | -229M | -290M |
| Share buybacks (cash effect) (EUR) | — | -1.9M | -1,000 | -113,000 | — | — | — | — |
| Interest paid (cash effect) (EUR) | — | -54,000 | -154,000 | -74,000 | -6,000 | -199,000 | -454,000 | -800,000 |
| Income taxes paid (cash effect) (EUR) | — | -35.2M | -39.9M | -34.9M | -17.5M | -51.3M | -74.4M | -78.1M |
| Share-based compensation (EUR) | — | 2.26M | 2.56M | 2.12M | 3.42M | 1.98M | 3.36M | 6M |
| Operating cash flow before change in receivables (EUR) | — | 116M | 172M | 179M | 186M | 256M | 389M | 419M |
| Free cash flow (OCF - PPE - intangibles) (EUR) | — | 119M | 140M | 196M | 119M | 173M | 300M | 383M |
| Income detail | ||||||||
| Total comprehensive income (EUR) | — | 142M | 199M | 135M | 130M | 200M | 348M | 414M |
| Reported | Apr 27, 2021 | Apr 27, 2021 | Apr 25, 2022 | Apr 25, 2022 | Apr 29, 2024 | Apr 29, 2024 | Apr 25, 2025 | Apr 27, 2026 |
Sign up to see institutional holdings
Sign UpPodcast Mentions
Sign up to see podcast mentions and sentiment
Sign UpRegulated information filed with the AMF (info-financiere.gouv.fr), newest first, titles as filed. Voting-rights totals, own-share transactions, threshold crossings and availability notices are left out. The link opens the filed document. Press releases from the company's own website, newest first.

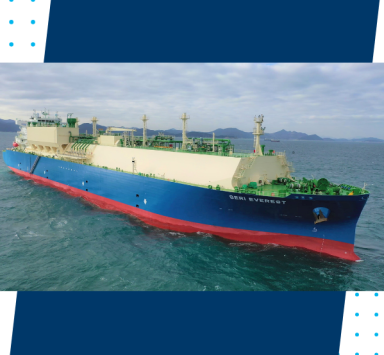
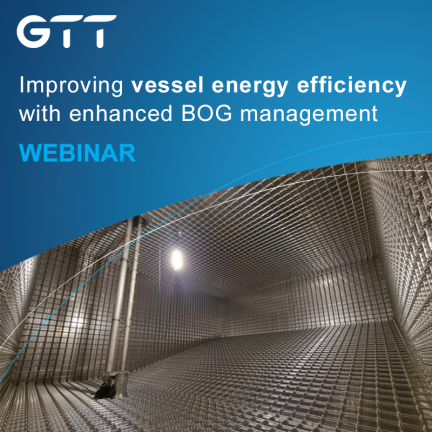
 Delivered in July 2021, Le Commandant Charcot, PONANT’s luxury exploration cruise ship, is equipped with two LNG tanks featuring GTT Mark III technology.Those tanks have been improved to sustain a maximum pressure of 2 bar gauge (barg), offering significant advantages, from environmental considerations to additional operational flexibility in a safe manner.### Speakers
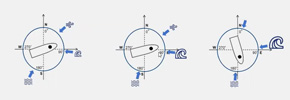 Offshore units (FLNG or FSRU) are loaded by LNG carriers during ship-to-ship operations. During this process, the LNG carrier tanks go through all filling levels, from high to low. In order to improve the operation window of the offshore units, GTT provides a unique digital solution for live sloshing risk prediction based on the weather forecast, the ship particulars and the operating conditions.### Speakers
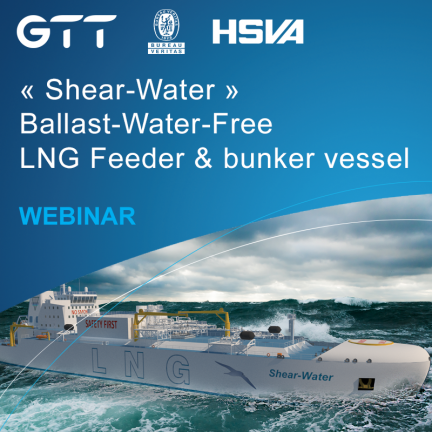
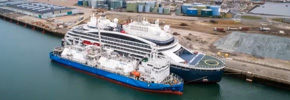 GTT, PONANT and GASUM will share their return on experience on the successful bunkering operations on Le Commandant Charcot, highlighting all the key decisions to take from concept design phase to hoses connection on the bunkering day.### SpeakersJean-Benoît Bensoussan (
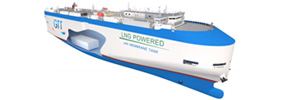 GTT has developed an innovative, efficient and future proof solution for PCTC as an alternative to the usual Type C arrangement. This webinar is the opportunity to show latest PCTC market review insights and dive into the most valuable technical aspects such as overall compactness and increase pressure setting (2barg).### Speakers
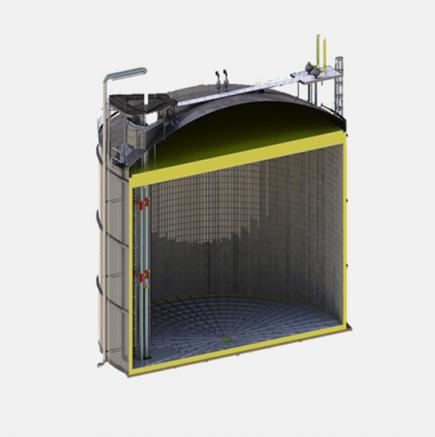
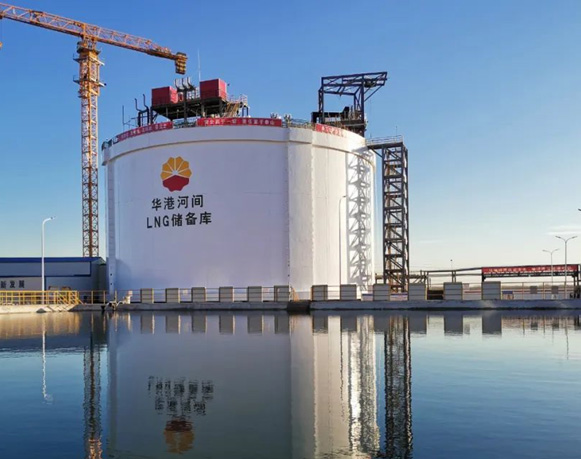
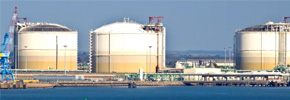 The surge in the demand for new LNG facilities in the context of constant search to reduce environmental impact as well as rising cost of raw materials (Nickel for example), makes the selection of membrane full containment tank more and more attractive for LNG land storage. Latest updates on the ongoing constructions will be shared including the world’s largest membrane full containment LNG tanks.### Speakers
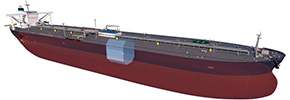 Currently in the doldrums, Very Large Crude Carriers (VLCC) shipbuilding market is expected to rebound by the end of 2022.In partnership with major shipyards from China and Korea, GTT (Gaztransport & Technigaz) has developed several designs for long-range LNG-fuelled VLCCs. Fuel tank integration in the vessel has been optimized in order to take full advantage of the Mark III system, offering enhanced trading flexibility and reduced #OPEX.### Speakers
Prompts
Click prompts to add them under the company line, click again to take one out, then copy the result into your AI chat. Shared by Asian Century Stocks and Uncovered Thai Stocks. Thank you.
Gaztransport & Technigaz SA (ticker GTT), listed in France.
Copied
ETFs Holding Gaztransport & Technigaz SA
Exchange-traded funds whose newest published daily portfolio holds one of the company's listings, largest weight first.
| ETF | Weight in ETF | Shares | Market value | As of |
|---|---|---|---|---|
| ASCI | 3.28% | 11,398 | $ 2.572M | Jul 31, 2026 |
| BCIL | 2.75% | 11,658 | $ 2.41M | Nov 12, 2026 |
| ABLG | 1.21% | 862 | $ 194.529K | Jul 31, 2026 |
| KNOW | 1.05% | 342 | $ 72.644K | Jun 30, 2026 |
| ILOW | 0.92% | 70,307 | $ 17.134M | Aug 31, 2026 |
| PIEQ | 0.48% | 30,327 | $ 6.442M | Jun 30, 2026 |
| FFGX | 0.32% | 769 | $ 173.541K | Jul 31, 2026 |
| DFIS | 0.26% | 73,938 | $ 15.285M | Nov 12, 2026 |
| AVIV | 0.25% | 25,384 | $ 5.208M | Nov 16, 2026 |
| CGIC | 0.17% | 20,589 | $ 4.231M | Nov 16, 2026 |
| DFSI | 0.11% | 6,521 | $ 1.348M | Nov 12, 2026 |
| AVDE | 0.10% | 96,493 | $ 19.797M | Nov 16, 2026 |
| FFDI | 0.10% | 82 | $ 18.505K | Jul 31, 2026 |
| DFIC | 0.08% | 56,317 | $ 11.642M | Nov 12, 2026 |
| DXIV | 0.06% | 745 | $ 154.008K | Nov 12, 2026 |
| DFAX | 0.05% | 28,718 | $ 5.937M | Nov 12, 2026 |
| DFAI | 0.03% | 27,813 | $ 5.75M | Nov 12, 2026 |