R � apport d’activité BRINGING PEOPLE TOGETHER R � apport d’activité BRINGING PEOPLE TOGETHER THE AMUNDI EVIAN - FRANCE CONGRESSO BAZIL MOBILE - SÃO PAULO, BRÉSIL Sommaire 7 / Le message du Président Bienvenue dans le monde de l'événement La…
R
� apport
d’activité
BRINGING PEOPLE TOGETHER
R
� apport
d’activité
BRINGING PEOPLE TOGETHER
THE AMUNDI EVIAN - FRANCE
CONGRESSO BAZIL MOBILE - SÃO PAULO, BRÉSIL
Sommaire
7 / Le message du Président
Bienvenue
dans le monde
de l'événement
La complémentarité
des métiers de
GL events
8 / 2025 en chiffres
10 / Profil de l’entreprise
12 / Gouvernance
22 / Métiers & marchés
34 / GL events Live
72 / GL events Venues
104 / GL events Exhibitions
GL EVENTS RAPPORT D'ACTIVITÉ 2025 / 4
FOIRE EUROPÉENNE DE STRASBOURG - FRANCE
Un Groupe
international
26 / Amérique latine
66 / Asie
95 / Europe
130 / Moyen-Orient - Afrique
WORLD SKILLS 2025 - AICHI, JAPON
GL events, le Groupe
140 / Chiffres clés - analyse
149 / Critères « Environnementaux, Sociaux et de Gouvernance »
163 / Ressources Humaines
166 / Relations institutionnelles
167 / Sécurité & sûreté
168 / Juridique & Compliance
175 / Système d'information, data et digital
181 / Partenariats & mécénats
184 / Fondation GL events
188 / Histoire & étapes clés
196 / Cahier de l’actionnaire
Le document d'enregistrement universel, déposé auprès de l’AMF, est disponible sur le site du Groupe www.gl-events.com
ou sur le site de l’AMF www.amf-france.org
JEUX OLYMPIQUES ET PARALYMPIQUES DE MILAN CORTINA 2026 - ITALIE
LE MESSAGE DU PRÉSIDENT
la preuve d’un modèle vertueux, où l’excellence de l’exécution
est le gage de notre performance financière et de notre
capacité à investir pour l’avenir, en poursuivant notre
expansion internationale.
OLIVIER GINON
PRÉSIDENT
L’année 2025 est venue sceller la pertinence de nos choix
stratégiques, confirmer la performance de notre modèle
et démontrer la qualité de nos équipes sur l’ensemble
des métiers du Groupe. La robustesse de notre Groupe
construite année après année sur les fondations de
notre modèle intégré s’est à nouveau illustrée. 2024 était
indéniablement une très belle année. Après avoir marqué,
nous avons su transformer l’essai. Avec détermination et
passion, nous avons transformé cet élan en une nouvelle
phase de croissance durable.
Si notre force motrice est avant tout le développement,
notre dynamique commerciale s’est accompagnée en
2025 d’une exigence opérationnelle et d’une expertise
en ingénierie événementielle qui nous permettent de
nous dépasser. Notre ambition a été consacrée par la
confiance accordée ou renouvelée par les plus grands
clients mondiaux. Notre sélection pour les Jeux d’hiver
de Milan Cortina 2026 comme les Jeux Asiatiques et
Para-asiatiques d’Aichi-Nagoya 2026 n’est pas le fruit du
hasard, l’attribution par l’État français de la concession du
Stade de France pour les trente prochaines années n’est
pas due à une bonne étoile mais le résultat de décennies
d’expertise, d’une capacité éprouvée à livrer des projets
d’une complexité inédite et de dossiers solides prouvant
notre savoir-faire sur l’ensemble de la chaîne de valeur.
La croissance continue que connaît le Groupe s’accompagne
d’une performance croissante en matière de rentabilité. C’est
Complémentaires, nos trois grandes familles d’activités
confortent leur trajectoire avec succès. GL events Live conçoit
et livre des solutions adaptées à tout type d’événements
en relevant constamment des défis, quels que soient les
terrains de jeu. Renforcés par des projets structurants,
le pôle a su développer une expertise amont avec des
activités de scoping et de design. Au service des filières
et des communautés qu’elles recouvrent, GL events
Exhibitions poursuit sa transformation vers un modèle axé
sur les contenus. Tout en accompagnant la dynamique et la
performance des salons, le pôle a renforcé ses positions avec
l’intégration de nouvelles verticales marché, notamment en
matière de santé et de culture, diversifiant ses expertises.
Enfin, GL events Venues continue d'étendre son réseau
mondial en embrassant de nouveaux sites et des destinations
stratégiques tout en développant son maillage territorial
f rançais. Le pôle opère un réel changement d’échelle
avec un réseau enrichi porté par une vision à long terme.
Parallèlement, notre expansion internationale se poursuit
avec le succès du Japon, de l’Afrique du Sud, de l’Amérique
du Sud et des États-Unis portés notamment par les grands
événements sportifs et institutionnels et par la pertinence
de nos choix stratégiques.
Au regard du chemin exceptionnel parcouru en 2025,
comment ne pas saluer la première de nos richesses, la vraie
force du Groupe : les femmes et les hommes qui portent,
avec expertise et implication, notre réussite et nos valeurs.
Jour après jour, sur le terrain, ce sont eux qui font vivre notre
ambition. C’est à travers leurs idées, leur engagement et
leurs actes que notre vision d’un événementiel à impact
positif et durable trouve une concrétisation tangible pour
nos clients, pour les territoires et pour tous nos partenaires.
Dotées d’un esprit pionnier, d’une ingéniosité tout-terrain
et de la passion du métier, les équipes multiculturelles qui
façonnent le visage du Groupe et de ses filiales s’adaptent aux
enjeux du moment tant en matière de RSE, de cybersécurité
que d’intégration de l’intelligence artificielle.
À l’écoute de nos marchés et de nos clients, nous nous
projetons à travers des solutions innovantes, de nouveaux
formats, de nouveaux outils, de nouvelles idées qui nous
positionnent comme un groupe de référence, aux avantpostes de la filière événementielle.
À l’aube de 2026, forts de ces accomplissements, conscients
de l’instabilité géopolitique dans laquelle nous évoluons,
nous regardons l’avenir avec une détermination intacte,
prêts à écrire le prochain chapitre de notre histoire et tout
faire pour décrocher de nouveaux records.
GL EVENTS RAPPORT D'ACTIVITÉ 2025 / LE MESSAGE DU PRÉSIDENT / 7
2025 EN CHIFFRES
Bienvenue
dans le monde
de l'événement
1 721,1
2025
en chiffres
de chiffre d’affaires dont
55 % à l’international
6 800
événements conçus
et équipés
60
sites gérés** totalisant
plus de 2 400 000 m2
d’espaces d’accueil
GL EVENTS RAPPORT D'ACTIVITÉ 2025 / 2025 EN CHIFFRES / 8
M€*
4 380
événements accueillis
2025 EN CHIFFRES
PAYS-BAS
LA HAYE
FRANCE
AMIENS NANCY
BORDEAUX NANTES
BREST ORLÉANS
CAEN POITIERS
CANNES PARIS
CASSENEUIL REIMS
CLERMONT-FERRAND RENNES
LILLE ROANNE
LYON SAINT-ÉTIENNE
MARSEILLE STRASBOURG
METZ TOULOUSE
MONTPELLIER
ROYAUME-UNI
CASTLE DONINGTON
EDIMBOURG
LONDRES
NEWBURY
MADELEY
PETERBOROUGH
UTTOXETER
BELGIQUE
BRUXELLES
HONGRIE
BUDAPEST
ALLEMAGNE
DUSSELDORF
ITALIE
MILAN
TURIN
MONACO
TÜRKIYE
ANKARA
ISTANBUL
JAPON
AICHI-NAGOYA
OSAKA
TOKYO
CHINE
BEIJING
DONGGUAN
GUANGZHOU
HAIKOU
HANGZHOU
HARBIN
HONG KONG
MACAO
NANNING
NINGBO
QINGDAO
SANYA
SHANGHAI
SHENZHEN
TAIYUAN
WUXI
XIAMEN
ZHUHAI
ESPAGNE
BARCELONE
MADRID
MAROC
CASABLANCA
ÉTATS-UNIS
LOS ANGELES
NEW YORK
MIAMI
CÔTE D’IVOIRE
ABIDJAN
ÉMIRATS ARABES UNIS
DUBAÏ
QATAR
DOHA
ARABIE SAOUDITE
RIYAD
VIETNAM
HANOÏ
CHILI
SANTIAGO
250,4
BRÉSIL
RIO DE JANEIRO
SALVADOR
SANTOS
SÃO PAULO
M€
Ebitda*
AFRIQUE DU SUD
DURBAN
JOHANNESBOURG
LE CAP
AUSTRALIE
SYDNEY
6 310
collaborateurs dont
44,5 % à l’international
90
implantations dans le monde
2 300
événements organisés dont
226 salons propriétaires
37 congrès propriétaires
1 842800
visiteurs et exposants
- Hors application de la norme IAS 29
** Chiffre mars 2026
GL EVENTS RAPPORT D'ACTIVITÉ 2025 / 2025 EN CHIFFRES / 9
PROFIL DE L’ENTREPRISE
GL events,
spécialiste international
de l’événement
La force du modèle du Groupe :
une complémentarité des métiers pour répondre
aux attentes et aux exigences de tous ses clients.
La vocation première de GL events est de permettre
les rencontres : congrès et conventions, événements et
manifestations culturels, sportifs, institutionnels, corporate,
salons et expositions à destination des professionnels ou
du grand public.
La spécificité et la force du modèle du Groupe sont d’intégrer
en complémentarité l’essentiel des métiers de la filière
événementielle. GL events accompagne ainsi ses clients en
France et à l’international dans leurs projets d’événements, de
la définition jusqu’à la réalisation, qu’ils soient publics ou privés,
entreprises, institutions ou organisateurs de manifestations.
Aux côtés des collectivités, le Groupe contribue à l’attractivité
des territoires ainsi qu’au rayonnement économique. Pour
les grands événements internationaux, Jeux olympiques,
coupes du monde, rencontres internationales, GL events
s’est progressivement imposé comme un partenaire de
référence des organisateurs internationaux.
Présent dans plus de 20 pays, coté sur l’Eurolist Euronext
Compartiment B Paris, GL events a réalisé en 2025 un
chiffre d’affaires de 1 721,1 M€.
ABRAFARMA FUTURE TRENDS - SÃO PAULO, BRÉSIL
GL EVENTS RAPPORT D'ACTIVITÉ 2025 / PROFIL DE L’ENTREPRISE / 10
PROFIL DE L’ENTREPRISE
MARCHÉS
CONGRÈS
ENTERTAINMENT
MÉTIERS
GRANDS ÉVÉNEMENTS
SPORTIFS & CULTURELS
Réceptif
Conseil*
LIVE
Construction
ÉQUIPER
Location
d’espaces
Marketing
Communication
Services**
Hospitalité
CONVENTIONS
Animation de
communautés
EXHIBITIONS
VENUES
ORGANISER
ACCUEILLIR
SALONS
EXPOSITIONS
Sport & culture
Food
& Beverage
CORPORATE
Trois pôles complémentaires
La complémentarité des métiers constitue la force du
modèle de GL events :
GL events Live propose des solutions clés en main, du
conseil et de la conception à la réalisation de tous les
événements, corporate, institutionnels, sportifs.
GL events Exhibitions anime des f ilières et des
communautés à travers la création de contenus et la
gestion d’un portefeuille de salons professionnels et grand
public des filières agroalimentaires, transition écologique,
textile / mode, industrie, construction, bâtiment, santé…
GL events Venues anime un réseau de 60 sites
événementiels en France et à l’international (centres de
congrès, parcs d’expositions, salles de spectacles et halles
multifonctionnelles).
Développement et création de solutions
durables
GL events développe depuis sa création en 1978 une stratégie
d’implantations locales et durables pour dynamiser les acteurs
de la filière événementielle. Le Groupe compte aujourd’hui une
centaine d’agences dans le monde, grâce à des collaborations
Services
exposants
Production
Commercialisation
INSTITUTIONNELS
*Conseil
Ingénierie événementielle
Conception et organisation
**Services
Accueil
Installation générale
Aménagement & décor
Énergie
Agencement
Stand
Signalétique
Audiovisuel
Mobilier
avec des partenaires locaux ou à des acquisitions de sociétés
de référence sur leur marché. Il a su évoluer, s’adapter et
engager la transition environnementale et sociétale.
La stratégie d’innovation et de transformation se déploie
sur l’ensemble des activités, tout particulièrement en ce qui
concerne les enjeux RSE, en réduisant l’empreinte carbone
des événements et des activités, limitant l’utilisation du jetable,
optimisant l’économie circulaire et favorisant la diversité et
le développement des territoires.
Des actifs déterminants
Les actifs de GL events et sa capacité logistique couvrent
aujourd’hui toute la chaîne d’approvisionnement, de la
fabrication au montage, ce qui lui permet d’équiper tous
les événements dans des délais contraints. Son parc d’actifs
opérationnels renforce aussi son statut d’acteur de référence.
Il se différencie dans un environnement concurrentiel
international par une marque forte et une image à laquelle
sont associés rigueur, respect de la promesse donnée et
qualité de prestations. Ses expertises couvrent l’ensemble
des métiers, des salons à forte notoriété et un réseau
international de sites événementiels complémentaires.
GL EVENTS RAPPORT D'ACTIVITÉ 2025 / PROFIL DE L’ENTREPRISE / 11
GOUVERNANCE
GL events
et la gouvernance
d’entreprise : le Conseil
d'administration*
OLIVIER GINON
PRÉSIDENT DIRECTEUR
GÉNÉRAL
NICOLAS DE TAVERNOST
VICE-PRÉSIDENT DU
CONSEIL D'ADMINISTRATION
ANNE-SOPHIE GINON
ADMINISTRATRICE
SOPHIE SIDOS
ADMINISTRATRICE
LIONEL YVANT
ADMINISTRATEUR
(REPRÉSENTANT DE
TRÉVISE PARTICIPATIONS)
CAROLINE GINON
ADMINISTRATRICE
GL EVENTS RAPPORT D'ACTIVITÉ 2025 / GOUVERNANCE / 12
GOUVERNANCE
DANIEL HAVIS
PRÉSIDENT DU COMITÉ
D'AUDIT
FANNY PICARD
PRÉSIDENTE DU COMITÉ
RSE
JOSEPH AGUERA
PRÉSIDENT DU COMITÉ
DES NOMINATIONS ET
RÉMUNÉRATIONS
GRÉGORY GUISSARD
ADMINISTRATEUR
(REPRÉSENTANT DE
TRÉVISE PARTICIPATIONS)
MAUD BAILLY
ADMINISTRATRICE
MARC MICHOULIER
ADMINISTRATEUR
DAVID AMAR
CENSEUR
GRÉGORY SOPPELSA
CENSEUR
ÉRICK ROSTAGNAT
CENSEUR
COMMISSAIRES AUX COMPTES
MAZA-SIMOËNS – FIFTY BEES
Benjamin SCHLICKLIN
FORVIS-MAZARS
Emmanuel CHARNAVEL
Arnaud FLECHE
GL EVENTS RAPPORT D'ACTIVITÉ 2025 / GOUVERNANCE / 13
GRAND PRIX DE FORMULE 1 - SÃO PAULO, BRÉSIL
GOUVERNANCE
« Notre modèle nous permet
d’anticiper, de nous adapter et de
nous renforcer dans un environnement
de plus en un plus exigeant. »
OLIVIER FERRATON
DIRECTEUR GÉNÉRAL DÉLÉGUÉ DE GL EVENTS
L’année 2025 s’inscrit dans un contexte de transition pour
le secteur événementiel, marqué par un environnement
économique et géopolitique instable, une pression
concurrentielle accrue et des attentes clients en constante
évolution. Pour GL events, cette année post-Jeux olympiques
s’est révélée plus exigeante, mais largement anticipée. Dès
2024, le Groupe avait préparé ce rebond en mobilisant
ses trois pôles autour d’une vision claire à moyen terme,
construite sur un horizon de trois à cinq ans.
Anticipation et mobilisation, marqueurs structurants
de 2025
Cette capacité d’anticipation constitue l’un des marqueurs
structurants de 2025. Les équipes ont été pleinement
mobilisées pour préparer les projets à venir et sécuriser
les portefeuilles d’activités en renforçant les collaborations
internes. Plusieurs dossiers emblématiques en France comme
à l’international tels que l’attribution de la concession du
Stade de France, la COP16, les Jeux d’hiver de Milan Cortina
ou la reprise de plusieurs nouveaux salons ont confirmé la
solidité du modèle intégré du Groupe, notamment autour
de grands événements sportifs, institutionnels et culturels.
L’année 2025 apparaît ainsi comme la concrétisation de
dynamiques engagées de longue date.
Dans un marché en mutation, la performance du Groupe
repose sur un équilibre entre continuité et évolution. Il
ne s’agit pas d’une transformation radicale, mais d’une
évolution naturelle de l’organisation, marquée par le
renforcement de nos zones géographiques et de certains
métiers. Les zones Amériques, Moyen-Orient, Asie et Afrique
ont progressivement gagné en importance, traduisant la
maturation de la présence internationale de GL events et
la volonté de ne pas dépendre d’un seul marché. Cette
diversification géographique permet d’absorber les cycles,
de mieux gérer les risques et d’identifier de nouveaux
relais de croissance.
La force du modèle intégré et des collaborations
transverses
La solidité du modèle repose également sur la
complémentarité accrue entre les trois grandes familles
d’activité - conception et équipement, organisation et accueil.
En 2025, les collaborations transverses se sont intensifiées,
portées par une meilleure circulation de l’information, des
compétences et des expertises. Cette logique collective
constitue un levier majeur de compétitivité, en permettant
de proposer des offres globales, adaptées à des projets de
plus en plus complexes, tout en renforçant la crédibilité du
Groupe auprès des clients publics et privés.
La croissance du Groupe en 2025 ne se mesure pas
uniquement à l’aune des résultats financiers. Elle se traduit
aussi par la capacité à sécuriser des contrats stratégiques,
GL EVENTS RAPPORT D'ACTIVITÉ 2025 / GOUVERNANCE / 15
GOUVERNANCE
à maintenir un niveau élevé de qualité opérationnelle et
à renforcer la valeur perçue des projets livrés. Dans un
contexte de hausse des coûts et de contraintes budgétaires
accrues chez les clients, GL events a poursuivi une stratégie
de différenciation fondée sur la créativité, le savoir-faire,
la responsabilité environnementale et la maîtrise de
l’exécution.
Des fondamentaux solides en appui des prochaines
étapes de développement
L’ancrage national demeure une force, un socle stratégique.
La solidité du Groupe et de ses filiales sur le marché français,
et notamment à Paris, reste un facteur clé de crédibilité
à l’international. Source d’activité dans la récurrence, cet
ancrage offre la possibilité de tester de nouveaux formats
et de capitaliser sur des savoir-faire reconnus avant leur
déploiement à plus grande échelle. Cet équilibre entre force
domestique et développement international constitue un
pilier du modèle GL events.
Talents et compétences comme moteur
de performance
Les projets menés en 2025 ont également mis en lumière
l’importance des compétences et des ressources humaines.
Le Groupe peut s’appuyer sur une crédibilité historique et
sur des équipes expérimentées et engagées, capables de
mobiliser des outils innovants pour améliorer la productivité
et de répondre aux nouvelles exigences du marché. En
parallèle, une nouvelle génération de talents émerge,
avec des profils plus jeunes, agiles et ouverts aux enjeux
environnementaux et sociétaux. L’enjeu réside désormais
dans la capacité à renforcer les passerelles entre excellence
technique, compétences relationnelles et collaboration
transversale dans une approche multiculturelle.
Cette attention portée à l'humain se traduit par un
engagement fort pour garantir la sûreté et la sécurité de
chaque collaborateur, partout dans le monde. La démarche
RSE du Groupe, initiée dès 2009, intègre la prévention
des risques et le suivi des incidents comme des axes
prioritaires. Les risques et les menaces inhérents au
contexte international requièrent un pilotage renforcé de la
politique de sûreté du Groupe à l’échelle mondiale. Enjeu
majeur pour le Groupe, la politique de sûreté prévoit la
protection des salariés, des actifs et des activités au service
d’une confiance forte de toutes les parties prenantes et
de la résilience du Groupe.
Une visibilité accrue synonyme d’opportunité,
de responsabilité et d’exigence
Dans un environnement où les projets sont de plus en plus
exposés, médiatiquement comme politiquement, la visibilité
acquise par GL events constitue à la fois une opportunité
et une responsabilité. Le Groupe ne travaille plus en retrait :
sa notoriété impose un niveau d’exigence accru, tant sur le
plan opérationnel que sur celui des engagements. Cette
exposition renforce la nécessité d'accompagner durablement
les compétences, d’encourager la formation, de partager
l’information et de cultiver l’état d’esprit collectif, afin de
garantir la croissance dans la durée.
À l’issue de l’exercice 2025, plusieurs enseignements se
dégagent : l’importance de l’anticipation, la valeur du
collectif, la nécessité de conjuguer rigueur opérationnelle
et capacité d’adaptation. Ces éléments dessinent une
trajectoire claire pour la suite : poursuivre le renforcement
des collaborations internes, accompagner la montée en
puissance des zones géographiques, jouer pleinement la
complémentarité des offres et continuer à se positionner
là où le Groupe n’est pas attendu.
Ces fondamentaux constituent les leviers sur lesquels
GL events s’appuiera pour aborder les prochaines étapes
de son développement, dans un secteur où la capacité à
conjuguer vision, exécution et responsabilité demeure un
facteur déterminant de performance durable.
GL EVENTS RAPPORT D'ACTIVITÉ 2025 / GOUVERNANCE / 16
EXPOSITION UNIVERSELLE 2025, PAVILLON UNION EUROPÉENNE - OSAKA, JAPON
GOUVERNANCE
Comité
exécutif *
OLIVIER GINON
PRÉSIDENT DIRECTEUR GÉNÉRAL
OLIVIER FERRATON
DIRECTEUR GÉNÉRAL DÉLÉGUÉ DE
GL EVENTS, PRÉSIDENT DIRECTEUR
GÉNÉRAL DE GL EVENTS LIVE
CHRISTOPHE CIZERON
DAMIEN TIMPERIO
MAXIME ROSENWALD
SYLVAIN BECHET
PATRICIA SADOINE
FANNY CHAVAUX
PRÉSIDENT DIRECTEUR GÉNÉRAL
DE GL EVENTS VENUES
DIRECTEUR GÉNÉRAL FINANCES
ET INVESTISSEMENTS
PRÉSIDENT DIRECTEUR GÉNÉRAL
DE GL EVENTS EXHIBITIONS
DIRECTRICE JURIDIQUE
ET COMPLIANCE GROUPE
GL EVENTS RAPPORT D'ACTIVITÉ 2025 / GOUVERNANCE / 18
DIRECTEUR GÉNÉRAL DÉLÉGUÉ
DE GL EVENTS LIVE
DIRECTRICE DES RESSOURCES
HUMAINES
GOUVERNANCE
AUDREY CHAVANCY
DIRECTRICE RSE & RISQUES
GROUPE
DENIS TOMASICCHIO
BRUNO LARTIGUE
DANIEL CHAPIRO
BENJAMIN THÉVENET
DIRECTEUR DES SYSTÈMES
D'INFORMATION GROUPE
DIRECTEUR GÉNÉRAL DÉLÉGUÉ
DE GL EVENTS VENUES
SECRÉTAIRE DU COMITÉ EXÉCUTIF,
DIRECTEUR DES RELATIONS
INSTITUTIONNELLES
SECRÉTAIRE GÉNÉRAL
DE GL EVENTS LIVE
Comité exécutif international
INÈS GINON
PRÉSIDENTE DE GL EVENTS
GREATER CHINA
MILENA PALUMBO
DIRECTRICE GÉNÉRALE GL EVENTS
AMÉRIQUE LATINE – BRÉSIL – CHILI
JEAN-GUILLAUME LACOSTE
CEO GL EVENTS MIDDLE EAST
AND AFRICA
GL EVENTS RAPPORT D'ACTIVITÉ 2025 / GOUVERNANCE / 19
SCOTT JAMESON
DIRECTEUR GÉNÉRAL GL EVENTS UK
GOUVERNANCE
Comité exécutif
Le Comité exécutif décide des stratégies du Groupe
(globale et déclinaison par métier). Il étudie les projets
d’investissement (dont les croissances externes) à proposer
au Conseil d’administration et met en œuvre sur l’ensemble
du Groupe les orientations de stratégie de développement
et de contrôle.
Comité d’investissement
Le Comité est composé du Directeur Général Finances et
Investissements ainsi que des Directeurs de pôles. Il se réunit
pour examiner et valider la conformité des investissements
par rapport à la politique budgétaire, la rentabilité attendue,
les possibilités d'harmonisation et d'optimisation. Par
ailleurs, il intervient lorsque des investissements demandés
ne sont pas prévus dans l'enveloppe initiale.
Comités de direction par pôle
Les Comités de direction par pôle réunissent les dirigeants des
business units par métier pour assurer un suivi opérationnel
et financier de chacune des sociétés rattachées. Ils travaillent
également sur le renforcement des synergies commerciales
entre les métiers du Groupe et s'assurent de la mise en
œuvre de la politique d'entreprise.
Comité d'audit
Le Comité d’audit a pour mission de porter un regard
indépendant sur les risques du Groupe, leur gestion et
leur traduction en informations financières.
Le Comité d’audit exerce les missions prévues à l’article
L. 821-67 du Code de commerce et dans la charte du Comité
d’audit, approuvée par le Conseil d’administration. Ainsi,
il assiste notamment le Conseil d’administration dans les
domaines suivants :
— �le suivi du processus d’élaboration de l’information
financière et des informations en matière de durabilité
et le cas échéant, la formulation des recommandations
pour en garantir l’intégrité,
— �le suivi de l’efficacité des systèmes de contrôle interne et
de gestion des risques, ainsi que le cas échéant de l’audit
interne, en ce qui concerne les procédures relatives à
l’élaboration et au traitement de l’information comptable
et financière, et de l’information en matière de durabilité,
sans qu’il soit porté atteinte à son indépendance,
— �l’examen critique des comptes annuels et de l’information
périodique,
— �l’émission d’une recommandation sur les commissaires
aux comptes et les auditeurs de durabilité proposés à
la désignation ou au renouvellement,
— �la surveillance de l’adéquation du contrôle interne compte
tenu de la perception des risques et de l’efficacité de l’audit
tant interne qu’externe, et de manière plus générale, veille
dans ces domaines au respect de la réglementation et
à la conformité juridique, qui constituent des facteurs
essentiels de la réputation et de la valorisation du Groupe,
— �le suivi de la réalisation des missions de commissaires aux
comptes en charge de la certification des comptes et de
la certification des informations en matière de durabilité
en tenant compte des constatations et conclusions de
la Haute Autorité de l’Audit,
— �le respect des conditions d’indépendance requises des
intervenants pour l’exercice des missions de certifications
des comptes et de certification des informations en
matière de durabilité,
— �l’approbation de la fourniture par les commissaires
aux comptes des services autre que la certification des
comptes,
— �l’approbation de la fourniture par les commissaires
aux comptes des services autre que la certification des
informations en matière de durabilité,
— �l’examen des résultats de la mission de certification des
comptes, de la mission de certification des informations
en matière de durabilité ainsi que de la manière dont
ces missions ont contribué à l’intégrité de l’information
financière et de l’information en matière de durabilité et
le rôle que le Comité d’audit a joué dans ce processus,
— �la revue de la démarche du déploiement de la loi Sapin
II et du règlement RGPD,
— �la revue de la cartographie des risques du Groupe et
celle spécifique au risque de fraude, ainsi que la revue,
conjointement avec le Comité RSE, de la cartographie
des risques RSE (Double Matérialité) du Groupe,
— �l’examen du projet de rapport sur les informations en
matière de durabilité, en lien avec le Comité RSE.
Comité des rémunérations
et des nominations
Le Comité des rémunérations et des nominations détermine
en début d’année la rémunération des managers du
Groupe pour l’année en cours et s’assure de l’exhaustivité,
de la cohérence et de l’équilibre entre les différents
éléments qui composent ladite rémunération. Il définit
également les critères d’attribution des objectifs qualitatifs
(développement/RSE/transformation digitale…). En outre,
le Comité des rémunérations et des nominations est
chargé d’examiner les propositions de plans d’attribution
de stock-options et actions gratuites. Le Comité des
rémunérations et des nominations est informé des arrivées/
départs des principaux managers et est consulté sur les
nominations et les renouvellements des membres du
Conseil d’administration et des dirigeants mandataires
sociaux. Il traite également de la question du plan de
succession des dirigeants mandataires sociaux en relation
avec la Direction des ressources humaines.
GL EVENTS RAPPORT D'ACTIVITÉ 2025 / GOUVERNANCE / 20
JAZZ À VIENNE - FRANCE
GOUVERNANCE
Comité stratégique
Le Comité Stratégique en tant qu’émanation
du Conseil d’administration émet des avis consultatifs et agit
sous l’autorité et la responsabilité du Conseil d’administration
à qui il rend compte.
Il a pour mission d’approfondir les sujets présentés au
Conseil d’administration par le Comité exécutif ou par le
Président Directeur Général, relatifs au plan stratégique
incluant le développement d’activités nouvelles ou l’abandon
d’activités existantes, la concentration d’investissements ou
d’efforts commerciaux sur tel ou tel pays, ou au contraire le
désengagement dans une zone géographique, les cibles
de clientèle à privilégier, le développement des synergies
entre les différents métiers, l’organisation du Groupe,
l’intéressement des salariés, la transition énergétique
ou technologique, et plus généralement sur tout autre
question de nature stratégique.
En 2025, le Comité stratégique a particulièrement traité
des sujets suivants :
— Opérations de croissance externe
— Politique d’innovation
— Plan à moyen terme et réorganisation et adaptation du
Groupe pour faire face à ces points de développement.
Comité RSE
Le Comité RSE donne aux membres du Conseil
d’administration un avis sur les nouveaux enjeux RSE
applicables au sein du Groupe (contexte réglementaire,
marché, etc.) et leur présente un bilan des actions menées
au cours de l’année.
Sans préjudice des compétences du Conseil, le Comité RSE
est notamment chargé des missions suivantes :
ٱexaminer la stratégie, les ambitions, les politiques et les
engagements du Groupe en matière de RSE (éthique
et conformité, droits humains, hygiène/santé/sécurité
des personnes, environnement, ressources humaines,
responsabilité sociétale) et formuler des recommandations
à cet égard ;
ٱs’assurer de l’ambition de la stratégie et des actions RSE
menées et communiquées par le Groupe.
À ce titre le Comité RSE :
ٱs’assure que l’organisation interne de la RSE est cohérente
au regard de la stratégie visée ;
ٱintervient également en matière de discrimination et
de représentation de la diversité et veille, en tenant
compte du contexte métier, à la mise en œuvre d’une
politique visant l’équilibre femmes hommes et à l’équité
à chaque niveau hiérarchique de l’entreprise ;
ٱreçoit chaque année la présentation de la cartographie
des risques RSE / matrice de double matérialité du
Groupe ; il revoit, conjointement avec le Comité d’audit,
les risques et opportunités ainsi identifiés et est tenu
informé de leur évolution et des caractéristiques des
systèmes de gestion y associés ;
ٱexamine les politiques, référentiels et chartes du Groupe
sur les sujets RSE et s’assure de leur efficacité ;
ٱdonne un avis sur la déclaration annuelle de performance
extra-f inancière et, de manière générale, de toute
information requise par la législation en vigueur en
matière de RSE et fait des recommandations pour les
éditions suivantes.
GL EVENTS RAPPORT D'ACTIVITÉ 2025 / GOUVERNANCE / 21
MÉTIERS & MARCHÉS
Métiers & marchés
Transformation, nouveaux
équilibres et perspectives
de croissance
Un contexte géopolitique et
économique incertain
En 2025, l’environnement international est resté marqué
par de fortes incertitudes sur les plans géopolitiques
et économiques. Les conflits en cours, la montée des
tensions entre grandes puissances et l’affaiblissement de la
coopération internationale ont contribué à un climat mondial
instable. Dans ce contexte, les échanges commerciaux se
sont fragmentés et ont été davantage soumis à des mesures
protectionnistes, freinant la dynamique économique globale.
Après une période de relative résistance, la croissance
mondiale a montré des signes de ralentissement. Si l’inflation
a reculé dans de nombreuses régions, le niveau de risque
est resté élevé, avec la possibilité de chocs économiques,
financiers ou sociaux susceptibles de se diffuser rapidement.
Sources : IMF - World Economic outlook 2025 / World Economic
Forum - Global Risks Report 2025 & 2026
Le marché de l’événementiel en 2025 :
consolidation de l’activité et poursuite
des transformations
Face à un contexte international marqué par l’incertitude et
la fragmentation des échanges, le marché de l’événementiel
confirme en 2025 son entrée dans une phase de consolidation.
Ainsi, à l’échelle mondiale, 47 % des entreprises du secteur
enregistrent une croissance de leur activité supérieure à
5 %, tandis qu’environ 40 % font état d’une activité stable,
traduisant un retour à des trajectoires de développement plus
lisibles bien que toujours sensibles au contexte économique
et géopolitique. Cette dynamique est largement portée
par les régions Asie-Pacifique, Moyen-Orient & Afrique et
Amérique centrale & du Sud, qui concentrent les principaux
relais de croissance. En Asie-Pacifique, quatre marchés sur
cinq analysés par l’Union des Foires Internationales (UFI)
affichent une progression significative de l’activité malgré
une situation plus stable en Chine. Le Moyen Orient &
Afrique se distingue par des niveaux de confiance parmi
les plus élevés au monde, notamment aux Émirats arabes
unis où près de 80 % des acteurs anticipent une hausse de
l’activité et des revenus. En Amérique centrale et du Sud,
la reprise est plus contrastée mais globalement positive,
portée par le Mexique et le Brésil qui contribuent activement
à la dynamique mondiale du secteur.
Sources : UFI- Global Exhibition Barometer (36e édition)
Lieux d’accueil : un socle d’infrastructures
renforcé à l’international
Selon le World Map of Exhibition Venues 2025, le marché
international des lieux d’accueil événementiels et des
sites d’exposition s’appuie sur un parc d’infrastructures
développé et en constante expansion. Le réseau mondial
recense 1 530 sites d’exposition de plus de 5 000 m²,
représentant 44,3 millions de m² disponibles, un niveau
inédit à l’échelle internationale. Cette capacité structure
l’attractivité des territoires et conditionne l’aptitude des
pays à accueillir des foires, salons, congrès et grands
événements professionnels. La répartition géographique
confirme le poids stratégique de certaines régions. L’AsiePacifique concentre 16,9 millions de m², devant l’Europe avec
16,1 millions de m² et l’Amérique du Nord avec 7,6 millions
de m². La Chine s’impose comme l’acteur central du
marché, avec 13,66 millions de m² répartis sur 323 sites,
traduisant une politique volontariste d’investissement dans
les infrastructures événementielles et une position de hub
majeur pour les événements internationaux.
Sources : UFI & IWC – World Map of Exhibition Venues 2025
GL EVENTS RAPPORT D'ACTIVITÉ 2025 / MÉTIERS & MARCHÉS / 22
MÉTIERS & MARCHÉS
Une amélioration des revenus et de
la rentabilité des sites événementiels
D’après l’UFI Global Exhibition Barometer, le secteur enregistre
en 2025 une amélioration simultanée des revenus et de la
rentabilité. Plus d’un tiers des entreprises déclarent une
hausse supérieure à 5 % de leurs revenus liés à la location
d’espaces, tandis que 39 % observent une progression
équivalente sur les services proposés. Environ un tiers
des acteurs font également état d’une augmentation de
leurs profits opérationnels supérieure à 10 % sur un an.
Cette dynamique se reflète dans les perspectives d’emploi,
puisque près de 40 % des entreprises prévoient de renforcer
leurs effectifs dans les mois à venir.
Sources : UFI - Global Exhibition Barometer (36e édition)
Prestations de services événementielles :
un pilier structurant de la chaîne
de valeur
Dans le prolongement de l’amélioration des résultats
économiques observée dans les derniers mois de l’année,
le marché des prestations de services événementielles
confirme son rôle central dans la structuration et la montée
en gamme du secteur. Portées par la reprise des foires, salons
et événements professionnels, les activités de services liées
aux expositions, incluant le design de stands, la gestion
opérationnelle et la logistique, représentent un marché
estimé à près de 38 milliards de dollars à l’échelle mondiale.
Parallèlement, le segment de la location d’équipements
événementiels (audiovisuel, éclairage, mobilier, scènes)
atteint environ 15,3 milliards de dollars (+5,5% vs 2024),
traduisant l’importance croissante des dispositifs techniques
et scénographiques dans la qualité des événements.
L’ensemble de ces prestations s’inscrit désormais comme un
facteur clé de différenciation, contribuant à l’enrichissement
de l’expérience des exposants et des visiteurs tout en
accompagnant la professionnalisation et l’innovation des
modèles événementiels.
Sources : WiseGuy reports – Event exhibition services market
& Event Equipment Rental market
Des formats événementiels en mutation
Dans un contexte de concurrence accrue, les attentes des
exposants, des visiteurs et des organisateurs évoluent. Plus
d’un tiers des acteurs considèrent désormais nécessaire de
faire évoluer les formats de foires, salons et congrès afin de
proposer des expériences plus engageantes. Les dispositifs
immersifs et les contenus à forte valeur ajoutée prennent
une place croissante, dans un environnement où la qualité
de l’expérience devient un facteur clé de différenciation.
La transformation numérique accompagne ces évolutions.
D’après l’UFI, en 2025, 87% des entreprises du secteur
déclarent utiliser l’intelligence artificielle, principalement
pour optimiser l’organisation des événements, améliorer
l’expérience des participants et développer de nouvelles
opportunités commerciales. Cette digitalisation renforce
l’efficacité opérationnelle tout en répondant aux attentes
d’un public de plus en plus habitué à des parcours fluides
et personnalisés.
Sources : UFI - Global Exhibition Barometer (36e édition)
Vers un événementiel plus structuré,
responsable et sélectif en France
En 2025, le marché français de l’événementiel confirme
sa solidité et s’inscrit pleinement dans la dynamique de
consolidation observée à l’échelle internationale. Les foires
et salons professionnels retrouvent un niveau d’activité
quasi équivalent à celui d’avant crise avec une activité
atteignant 99 % de 2019 en Île-de-France, une progression
du nombre d’exposants et une fréquentation globalement
stable. Cette reprise reste toutefois différenciée selon les
segments, les salons grand public retrouvant leur rythme
plus progressivement dans un contexte de consommation
encore contraint. Parallèlement, le marché du MICE et
des événements d’entreprise demeure particulièrement
dynamique : près de neuf entreprises sur dix ont organisé au
moins un événement sur la période 2024-2025, confirmant
le rôle stratégique de l’événementiel dans le développement
commercial et l’engagement des équipes. Les usages
évoluent sensiblement avec une montée en puissance des
séminaires résidentiels qui concentrent désormais près de
60 % des budgets au détriment des formats plus festifs.
Cette dynamique s’accompagne d’arbitrages budgétaires
plus structurés : si une majorité d’entreprises prévoit une
hausse ou une stabilisation de ses dépenses en 2026, la mise
en concurrence des prestataires et l’exigence de retour sur
investissement se renforcent. Enfin, la RSE s’impose comme
un critère structurant, avec une intégration croissante
des lieux labellisés et une baisse significative du surcoût
associé, facilitant l’adoption de pratiques plus durables.
Sources : CCI Paris Île-de-France - Baromètre de l’activité
des salons en Île-de-France / Kactus/iftm - Baromètre 2025
Meetings & Events / opinionway pour UNIMEV – Étude
Opinion entreprises & événementiel
Le marché de l’événementiel conf irme sa capacité
d’adaptation. Entre consolidation des volumes, évolution des
formats, transformation digitale et montée en puissance des
enjeux environnementaux, le secteur poursuit sa mutation.
Sensible à la conjoncture économique mais porté par des
fondamentaux solides, il demeure un moteur économique
et relationnel majeur, appelé à se développer dans une
logique de croissance maîtrisée et durable.
GL EVENTS RAPPORT D'ACTIVITÉ 2025 / MÉTIERS & MARCHÉS / 23
CONVENTION UNIMEV - MATMUT STADIUM - LYON, FRANCE
Amérique latine
Dans un environnement économique contrasté, le Groupe a
poursuivi sa consolidation en s’appuyant sur un modèle intégré
combinant gestion de sites, organisation de salons et déploiement
de solutions événementielles. Fort d’un ancrage territorial solide
et d’une organisation mieux structurée, GL events renforce sa
capacité à accompagner les grands rendez-vous économiques
et les filières stratégiques en Amérique latine. La zone constitue
également un vivier de talents et d’expertises pour les projets
internationaux du Groupe.
DISTRITO ANHEMBI - SÃO PAULO, BRÉSIL
AMÉRIQUE LATINE
Brésil
« En Amérique latine, GL events
est passé d'acteur solide à leader
structurant, capable de piloter,
d’unifier et de projeter ses expertises
à l’échelle d’une région entière. »
MILENA PALUMBO
DIRECTRICE GÉNÉRALE GL EVENTS AMÉRIQUE LATINE –
BRÉSIL – CHILI
L’année 2025 a constitué un véritable point d’inflexion pour
GL events en Amérique latine. Dans un environnement
économique globalement contrasté, la zone a franchi un cap
décisif, en affirmant des positions de leadership claires sur
ses marchés clés, en structurant son organisation régionale.
Plus qu’une année de croissance, cette période a posé les
fondations d’un modèle durable à l’échelle du continent.
Sur le plan macroéconomique, le contexte reste hétérogène.
La croissance reste forte, principalement au Brésil, malgré
une stabilité économique toujours fragile. Cette situation
rend d’autant plus significative la performance réalisée par
GL events : devenir leader dans des marchés qui ne sont
pas en forte expansion constitue un signal fort de solidité
et de pertinence stratégique.
À moyen terme, certaines évolutions structurelles, comme
l’accord entre le Mercosur et l’Union européenne, pourraient
soutenir les filières exportatrices et les salons B2B, même
s’il ne faut pas s’attendre à des effets immédiats.
Des positions de leader consolidées au Brésil
et au Chili
Au Brésil, 2025 est l'année de la création d’une nouvelle
division dédiée à la gestion des tribunes initialement
utilisées sur les Jeux olympiques et paralympiques de Paris
2024. Cette activité a permis de remporter un contrat sans
précédent sur six ans avec la Formule 1 et de cinq ans pour le
MotoGP et SailGP. En l’espace d’un an, GL events est devenu
le principal fournisseur de tribunes du marché brésilien,
GL EVENTS RAPPORT D'ACTIVITÉ 2025 / UN GROUPE INTERNATIONAL / 27
AMÉRIQUE LATINE
positionné sur les événements sportifs internationaux les
plus emblématiques. Les actifs ont été déployés de manière
stratégique entre São Paulo, Goiânia et Rio de Janeiro afin
de couvrir efficacement les grands bassins événementiels
du pays.
Le Chili a connu une dynamique comparable avec l’intégration
d’Espacio Riesco, principal parc des expositions du pays. Cette
opération a profondément transformé le positionnement
de GL events, devenu la plus grande entreprise de gestion
de sites événementiels au Chili. Elle s’est accompagnée du
transfert de quatre grands salons B2B au sein du portefeuille
de FISA, faisant de GL events le leader incontesté des salons
professionnels dans le pays.
Une organisation régionale pour unifier et développer
Plus largement, GL events confirme son leadership régional
sur l’activité salons. À São Paulo, les surfaces gérées par le
Groupe dépassent largement celles de ses concurrents.
L’intégration d’Espacio Riesco est venue prolonger cette
logique au Chili, donnant au Groupe une empreinte
structurante sur les deux principales économies de la région.
L’année a également été marquée par une réflexion
approfondie sur la maturité du secteur événementiel
en Amérique latine. Le marché reste très concentré
géographiquement, notamment au Brésil, où près de
80 % de l’activité se situe à São Paulo. En dehors de cette
métropole, les salons professionnels peinent à atteindre une
taille critique. Cette réalité impose une approche sélective
du développement, privilégiant les projets à fort potentiel
et une structuration rigoureuse plutôt qu’une dispersion
géographique.
Déploiement de marques fortes et d'expertises
reconnues
Sur le segment des salons, le Brazil Motor Show a été
relancé avec succès à Anhembi, après plusieurs années
d’interruption. Plus important que lors de sa dernière
édition historique, l’événement illustre la capacité du
marché brésilien à se réinventer autour de manifestations
emblématiques à une échelle sans équivalent en Europe.
Parallèlement, des marques fortes ont été déployées à
l’instar de Hyvolution. Après une première édition au Chili,
la préparation de la première édition brésilienne, prévue à
São Paulo en 2026, illustre la capacité du Groupe à déployer
ses expertises vers des marchés émergents de l’hydrogène.
Enfin, la région Amérique latine s’affirme comme un véritable
vivier d’expertises pour les projets internationaux du Groupe.
Les équipes locales, habituées à gérer des événements de
très grande ampleur dans une approche multiculturelle,
développent des compétences directement mobilisables à
l’international. La mobilité des talents et le multiculturalisme,
particulièrement marqués au Brésil, constituent des atouts
majeurs pour l’intégration sur des projets globaux.
À l’issue de cette année charnière, la région Amérique latine
aborde la suite avec une visibilité renforcée : leadership
consolidé au Brésil et au Chili, organisation régionale
structurée, marques internationales déployées et talents
pleinement intégrés à la dynamique du Groupe. Autant
de bases solides pour préparer les prochaines étapes du
développement de GL events sur le continent.
C’est dans cette logique qu’a été créée, en 2025, une cellule
congrès dédiée à l’ensemble de la zone Amérique latine.
Cette organisation regroupe les équipes, les politiques
commerciales pour les congrès, qu’ils se tiennent au Chili ou
au Brésil. Grâce aux équipes commerciales, les opportunités
sont désormais abordées de manière unifiée, avec la possibilité
de proposer plusieurs destinations simultanément. Cette
structuration constitue un levier clé pour développer l’activité
congrès, notamment au Chili, où le potentiel de croissance
reste important.
GL EVENTS RAPPORT D'ACTIVITÉ 2025 / UN GROUPE INTERNATIONAL / 28
BIENAL DO LIVRO - RIO DE JANEIRO, BRÉSIL
AMÉRIQUE LATINE
Chili
l’intérêt croissant de grands acteurs
internationaux. Ces évolutions,
visibles notamment sur le marché
des grandes infrastructures et de
l’entertainment, témoignent d’un
environnement plus concurrentiel,
mais aussi de perspectives renforcées
sur la place de Santiago comme
destination d’événements et de
spectacles à l’échelle régionale.
Dans ce contexte, GL events a
franchi un cap au Chili, 2025 étant
la meilleure année de son histoire.
Cette performance est le résultat
de la dynamique conjointe de nos
quatre business units, Espacio Riesco,
Metropolitan, FISA et Tarpulin qui
tirent un bénéf ice croissant de
leurs complémentarités. Elle reflète
également la maturité de notre
ancrage territorial dix ans après
l’arrivée du Groupe dans le pays :
une trajectoire construite pas à pas,
la structure étant passée de trois
collaborateurs en 2015 à plus de 420
aujourd’hui.
FRANCISCO SOTOMAYOR
DIRECTEUR GÉNÉRAL
GL EVENTS CHILI
Au Chili, l’année a été particulièrement
dense, reflet d’une actualité
nationale qui a fortement structuré
l’agenda des grands rendez-vous
économiques et institutionnels. Pour
nos métiers, cela s’est traduit par une
intensification des échanges et des
prises de parole au sein des salons,
notamment via les programmes
de conférences et de congrès.
Sur le plan macroéconomique, le
pays a retrouvé une dynamique
plus favorable avec une inflation
revenue à des niveaux plus proches
des standards historiques. Cette
stabilisation a contribué à soutenir
la reprise et l’activité du secteur
événementiel.
Dans le même temps, le secteur a
connu une accélération notable des
mouvements stratégiques, portée par
L’intégration d’Espacio Riesco a
constitué un tournant structurant.
Avec cet équipement, GL events
consolide son ancrage au Chili en
s’appuyant sur un lieu emblématique :
le principal parc d’expositions du pays
et l’un de ses plus grands centres
événementiels. Au-delà de la
dimension infrastructurelle, l’enjeu
a été organisationnel. Une phase de
restructuration a été engagée pour
aligner les méthodes, renforcer le
management, simplifier certains
périmètres et faire évoluer le
modèle opérationnel, notamment
via l’externalisation du Food &
Beverage. Cette transformation a
demandé un accompagnement
soutenu des équipes, dans un
calendrier volontairement rapide.
Elle s’est néanmoins traduite par un
résultat concret : dès cette première
année, Espacio Riesco a enregistré
sa meilleure performance historique,
démontrant son potentiel et la
capacité des équipes à conduire
une transition exigeante.
« Un modèle intégré
pour une performance
historique : 2025, l'année
de tous les records
pour GL events au Chili
qui dix ans après son
arrivée, franchit un cap
historique et s'impose
comme un leader
incontesté. »
Côté FISA, les performances ont,
elles aussi, été exceptionnelles. Le
salon Expomin a signé sa meilleure
édition, dans un contexte de
croissance forte du secteur minier
chilien. L’événement a rassemblé
plus de 1 370 exposants issus de
35 pays et plus de 83 000 visiteurs,
confirmant son rôle de plateforme
structurante pour toute la filière.
Un autre marqueur majeur est
venu renforcer cette édition : pour
la première fois, l’ensemble des
émissions carbone liées au salon a
été neutralisé, avec une validation des
autorités chiliennes. Cette démarche
illustre une ambition claire, faire
progresser nos standards RSE sur
l’ensemble de nos sites et de nos
événements, en cohérence avec
les attentes croissantes des filières
et des parties prenantes.
L’intégration du salon Food Service,
équivalent chilien du Sirha Lyon,
a constitué un autre point fort.
L’édition a atteint des niveaux
GL EVENTS RAPPORT D'ACTIVITÉ 2025 / UN GROUPE INTERNATIONAL / 30
ESPACIO RIESCO - SANTIAGO, CHILI
record, avec environ 800 exposants
et plus de 50 000 visiteurs, ainsi
qu’une participation internationale
renforcée. Ce rendez-vous ouvre
des perspectives importantes, en
s’appuyant sur une complémentarité
naturelle avec l’expertise des équipes
du Groupe en matière de food et
hospitalité.
stratégie assumée : l’industrie reste
au centre, en particulier les projets
miniers et industriels de long terme, et
la diversification doit rester maîtrisée.
Cette spécialisation, renforcée
depuis la période Covid, permet
une meilleure rotation des biens,
une rentabilité plus robuste et une
lisibilité accrue du modèle.
Au Metropolitan, l'année a battu
également un record. Bien que
le centre de conventions soit
volontairement de taille plus réduite,
il s’est distingué par une montée en
puissance continue avec plus de 250
événements accueillis et 160 000
visiteurs. Son positionnement haut de
gamme, couplé à une exigence forte
sur l’expérience client, confirme la
pertinence de ce site dans le paysage
événementiel de Santiago.
Au-delà des résultats, l’année a
posé un socle stratégique pour la
suite. Deux accords structurants
ont été conclus : une joint-venture
sur dix ans avec le syndicat forestier
chilien autour d’Expocorma, et une
joint-venture sur six ans avec la
Chambre chilienne de la construction
pour Edifica, référence du secteur
à l’échelle sud-américaine hors
Brésil. Ces partenariats confirment
le positionnement de GL events
Chili comme acteur de référence
sur des filières majeures : mines,
construction, bois, food, industrie.
Enfin, Tarpulin poursuit une trajectoire
de consolidation portée par une
Ils renforcent aussi la responsabilité
opérationnelle : l’arrivée de plusieurs
nouveaux salons représente une
accélération forte, notamment pour
FISA, qui devra piloter cette croissance
tout en maintenant un haut niveau
de qualité.
L’enjeu est donc double : consolider
une année record en la transformant
en performance durable et accom
pagner l’intégration complète des
biens et des équipes dans une logique
de synergies, de standardisation
progressive et d’élévation continue
des standards, notamment RSE. Dans
un marché chilien en mouvement,
GL events dispose désormais d’une
plateforme solide, pleinement
articulée entre gestion de sites,
organisation de salons et fourniture
de solutions industrielles. Un modèle
intégré au service d’une ambition
claire : continuer à grandir, sans perdre
en cohérence, ni en exigence.
GL EVENTS RAPPORT D'ACTIVITÉ 2025 / UN GROUPE INTERNATIONAL / 31
ESPACIO RIESCO - SANTIAGO, CHILI
GL EVENTS RAPPORT D'ACTIVITÉ 2025 / UN GROUPE INTERNATIONAL / 33
GL EVENTS,
SES MÉTIERS
GL EVENTS LIVE
GL events
Live
Une solution globale
de services
169 000 places de tribunes
728 000 m2 de structures
événementielles
7 bureaux d’études
(structures et tribunes)
100 000 mètres linéaires
de cloisonnement
- de 315 000 m2
de production annuelle
effective de signalétique
en France (l’équivalent
de 45 terrains de rugby)
3 700 références mobilier
GL EVENTS RAPPORT D'ACTIVITÉ 2025 / GL EVENTS, SES MÉTIERS / 34
GL EVENTS LIVE
968,8
de chiffre d’affaires
12
3 751
16
collaborateurs
sites logistiques de premier plan :
- En France*
- À l’international :
Royaume-Uni, Arabie saoudite, Afrique
du Sud, Dubaï, Chili, Brésil, Chine, USA
expertises métiers
de déchets par rapport à 2024
et 60 % de taux de tri
- Paris Nord, Paris Sud, Lyon, Nantes
GL EVENTS RAPPORT D'ACTIVITÉ 2025 / GL EVENTS, SES MÉTIERS / 35
CENTRE DES CONGRÈS TEMPORAIRE - NICE, FRANCE
GL EVENTS LIVE
OLIVIER FERRATON
DIRECTEUR GÉNÉRAL DÉLÉGUÉ DE
GL EVENTS, PRÉSIDENT DIRECTEUR
GÉNÉRAL DE GL EVENTS LIVE
MAXIME ROSENWALD
DIRECTEUR GÉNÉRAL DÉLÉGUÉ
DE GL EVENTS LIVE
BENJAMIN THÉVENET
SECRÉTAIRE GÉNÉRAL
DE GL EVENTS LIVE
« Portés par l’énergie des Jeux de Paris 2024,
nous avons fait de 2025 une année de consolidation
et de projection vers l’avenir. »
Une année pour consolider les bases et préparer la suite
Après une année 2024 exceptionnelle, marquée par une
mobilisation hors norme, 2025 a été une année pour se
remettre en ordre de marche. L’objectif était clair. Consolider
l’activité, assurer la continuité des projets et préparer les
prochaines échéances, en France comme à l’international.
En France, GL events Live a maintenu un bon niveau
d’activité. Les équipes sont restées mobilisées pour
répondre aux besoins, dans les délais, avec un niveau
d’exigence constant. Cela nous a permis de préserver
notre socle d’activité tout en continuant à développer de
nouvelles opportunités.
À l’international, la dynamique s’est poursuivie. Nous
avons continué à nous développer sur plusieurs zones
clés comme le Maroc, l’Afrique du Sud, les États-Unis ou
encore l’Asie. Cette organisation, structurée par grandes
zones géographiques, nous permet d’être plus réactifs et de
mobiliser rapidement les bonnes équipes selon les projets.
Des projets structurants et une activité qui
se développe en France comme à l’international
L’année a aussi été marquée par plusieurs projets importants.
Nous avons notamment accompagné des opérations
comme l’Exposition universelle d’Osaka, la Coupe du monde
des clubs de la FIFA aux États-Unis ou encore le Sommet
des océans à Nice. Ces projets montrent notre capacité
à intervenir sur des contextes très différents, souvent
complexes, en mobilisant plusieurs expertises.
Dans la continuité des Jeux, nous avons également fait évoluer
nos solutions. De nouveaux produits comme les structures
QWAD ou Céleste ont été déployés. Ils répondent à des
besoins plus durables et ouvrent de nouvelles perspectives
pour nos métiers.
En parallèle, plusieurs grands projets ont été signés en 2025,
notamment les Jeux asiatiques d’Aichi-Nagoya et les Jeux
olympiques d’hiver de Milan-Cortina, qui sont entrés en
phase opérationnelle début 2026. Ces projets demandent
un travail important en amont pour structurer les équipes,
organiser les méthodes et sécuriser le développement
commercial sur des opérations multi-pays et multi-métiers.
L’héritage de Paris 2024 est très concret. Nous avons
renforcé nos façons de préparer et de piloter les chantiers,
amélioré le suivi des sous-traitants et gagné en rigueur
sur l’ensemble des opérations. Ces acquis sont aujourd’hui
partagés dans toutes les équipes.
GL EVENTS RAPPORT D'ACTIVITÉ 2025 / GL EVENTS, SES MÉTIERS / 37
GL EVENTS LIVE
EXPOSITION UNIVERSELLE 2025 - OSAKA, JAPON
La diversification reste aussi un axe important. Nos activités
évoluent vers des formats plus longs, parfois proches de
la construction temporaire. Des projets comme la piscine
transitoire olympique de Lille en sont un bon exemple.
Cela nous permet de répondre à des besoins plus larges
que le seul événementiel.
Une organisation plus intégrée, au service de
la performance et des projets
Nous intervenons également de plus en plus tôt dans les
projets. Le travail de conception et de design, renforcé
avec l’expérience des Jeux, nous permet d’accompagner
les clients dès les premières phases et de mieux sécuriser
les projets.
La coordination entre les métiers a continué de progresser.
Les équipes travaillent de manière plus intégrée, que ce
soit entre autres sur l’installation générale, l’énergie ou le
staffing. Cela se traduit concrètement par une meilleure
fluidité dans les projets.
L’humain reste au cœur de tout cela. Les équipes ont
beaucoup appris ces dernières années. Nous continuons à
les accompagner, à les former et à structurer des équipes
capables de gérer des projets de plus en plus complexes,
en France comme à l’international.
2025 nous a permis de consolider nos bases, de tirer les
enseignements des Jeux et de préparer les prochaines étapes.
GL EVENTS RAPPORT D'ACTIVITÉ 2025 / GL EVENTS, SES MÉTIERS / 38
Maison & Objet
DU 16 AU 20 JANVIER
En janvier 2025, GL events Live a réalisé une prestation
complète de signalétique durable pour Maison & Objet, en
concevant plus de 2 000 enseignes réutilisables alignées
sur l’identité du salon. Ce projet illustre l’intégration de
solutions innovantes et écoresponsables au service de
grands événements professionnels.
GL EVENTS RAPPORT D'ACTIVITÉ 2025 / TEMPS FORTS 2025 GL EVENTS LIVE / 39
Rolex Monte-Carlo Masters 2025
DU 5 AU 13 AVRIL
Tournoi emblématique du circuit international de
tennis, le Rolex Monte-Carlo Masters mobilise depuis
plus de 25 ans les équipes du pôle GL events Live pour
la réalisation de ses installations événementielles. À
l’occasion de l’édition 2025, les équipes ont transformé
le Monte-Carlo Country Club pour accueillir spectateurs,
partenaires et joueurs dans des espaces d’hospitalité
et d’accueil sur mesure. Structures temporaires,
aménagement des espaces, signalétique et habillage
des tribunes ont été déployés sur l’ensemble du site,
contribuant à offrir une expérience immersive à la
hauteur du prestige de l’événement.
GL EVENTS RAPPORT D'ACTIVITÉ 2025 / TEMPS FORTS 2025 GL EVENTS LIVE / 41
Conférence des Nations Unies
sur les océans (UNOC3)
DU 9 AU 13 JUIN
À l’occasion de la 3e Conférence des Nations Unies sur
les océans, GL events Live a conçu et réalisé le centre
de congrès temporaire « OcéaNice », installé sur le port
de Nice pour accueillir les délégations internationales.
Pensé pour répondre aux exigences d’un sommet
mondial, ce dispositif éphémère a mobilisé les
expertises du Groupe en ingénierie, construction et
aménagement d’espaces événementiels. Ce projet
d’envergure illustre la capacité de GL events à concevoir
des infrastructures temporaires complexes pour des
rendez-vous diplomatiques et institutionnels majeurs.
GL EVENTS RAPPORT D'ACTIVITÉ 2025 / TEMPS FORTS 2025 GL EVENTS LIVE / 42
GL EVENTS LIVE
la demande pour des infrastructures
événementielles temporaires ne cesse
de croître. Dans ce contexte, Flow
Solutions a accompagné un large
éventail de projets, allant de grands
événements culturels et sportifs à
des initiatives institutionnelles ou
touristiques. Les équipes y déploient
des solutions complètes d’énergie
temporaire et de CVC, essentielles
au bon fonctionnement des
installations événementielles dans
des environnements climatiques
pa r t i c u l i è re m e n t ex i g ea n t s ,
consolidant ainsi la présence de Flow
Solutions dans une région devenue
stratégique pour le développement
international du pôle Live.
JONATHAN CALVERT
FLOW SOLUTIONS – MIDDLE EAST
(LIVE DIVISION)
« Au Moyen-Orient,
l’année 2025 a permis
de franchir une
nouvelle étape dans
le développement de
Flow Solutions, filiale
spécialisée dans les
solutions temporaires
d’énergie et de CVC
(chauffage, ventilation
et climatisation) du
pôle GL events Live. »
Parmi les réalisations emblématiques
de l’année figure le projet du Liwa
Festival, dans le désert d’Abu Dhabi.
Pour cet événement, les équipes ont
déployé un dispositif énergétique
hybride combinant production
solaire et stockage par batteries afin
d’alimenter les installations du site.
Cette installation constitue l’une des
plus importantes centrales solaires
temporaires jamais mises en œuvre
pour un événement. Elle illustre à la
fois l’expertise technique des équipes
d’ingénierie et l’orientation croissante
vers des solutions énergétiques plus
durables, adaptées aux contraintes
climatiques et environnementales
de la région.
Dans une région caractérisée par
une forte croissance des grands
événements, des projets culturels
et des initiatives gouvernementales
d’envergure, les équipes ont poursuivi
leur montée en puissance tout en
aff irmant leur positionnement
technique sur des projets de plus
en plus complexes.
L’année a été portée par une
dynamique commerciale soutenue,
notamment aux Émirats arabes
unis et en Arabie saoudite, deux
marchés en pleine transformation où
Au-delà de l’exploitation opéra
tionnelle, Flow Solutions a également
renforcé son rôle de partenaire
d’ingénierie sur des projets
internationaux. Les équipes du MoyenOrient ont ainsi apporté leur expertise
pour plusieurs opérations d’envergure,
notamment dans le cadre de la Coupe
du monde des clubs de la FIFA aux
États-Unis. Ces missions de design
et de conseil illustrent l’évolution
du métier, qui ne se limite plus à la
fourniture d’équipements mais s’étend
désormais à l’accompagnement
technique en amont des projets.
Cette montée en puissance s’est
traduite par un volume d’activité
particulièrement soutenu. En
2025, Flow Solutions a contribué
à la réalisation de plus de 250
projets dans la région, au service
d’une clientèle diversifiée associant
institutions publiques, organisateurs
d’événements, acteurs culturels et
opérateurs sportifs. Cette activité
confirme la capacité des équipes à
concevoir et exploiter des systèmes
temporaires d’alimentation électrique,
de refroidissement et de climatisation
fiables dans des environnements
variés, tout en maintenant des
standards élevés en matière de
performance opérationnelle.
Cette croissance rapide s’est
néanmoins accompagnée de défis
importants. L’intensification des
projets dans la région a notamment
nécessité une mobilisation accrue
des ressources opérationnelles ainsi
qu’une gestion particulièrement
attentive de la disponibilité des
équipements. Pour y répondre, les
équipes ont optimisé l’utilisation de
leur flotte de matériel et renforcé leurs
méthodes de planification afin de
garantir la continuité des opérations.
Flow Solutions s’impose progres
sivement comme un acteur de
référence dans le domaine des
utilités temporaires au MoyenOrient. L’expertise développée par
les équipes régionales est aujourd’hui
reconnue au sein même du Groupe
comme un centre d’excellence en
matière d’ingénierie énergétique et
de conception technique.
GL EVENTS RAPPORT D'ACTIVITÉ 2025 / TEMPS FORTS 2025 GL EVENTS LIVE / 43
GL EVENTS RAPPORT D'ACTIVITÉ 2025 / TEMPS FORTS 2025 GL EVENTS LIVE / 44
Exposition Universelle d’Osaka 2025
DU 13 AVRIL AU 13 OCTOBRE
Pendant six mois, l’Exposition Universelle d’Osaka
a rassemblé des publics internationaux autour de
grands thèmes sociétaux. GL events Live a contribué à
la réalisation de prestations techniques et logistiques
pour plusieurs pavillons à l’Exposition Universelle
d’Osaka, confirmant la portée internationale de
notre savoir-faire.
Heavent Paris
DU 4 AU 6 NOVEMBRE
Heavent Paris, le salon de référence des professionnels
de l’événementiel. GL events a présenté l’étendue de
ses savoir-faire et de ses métiers. Sur un espace conçu
comme une vitrine immersive, les équipes du Groupe
ont mis en scène leurs expertises en conception,
production et aménagement d’événements, illustrant
la complémentarité des activités du pôle Live,
Exhibitions et Venues. Ce rendez-vous majeur de
la filière a également été l’occasion de valoriser les
innovations et les solutions déployées par le Groupe
pour accompagner la transformation du secteur
événementiel.
GL EVENTS RAPPORT D'ACTIVITÉ 2025 / TEMPS FORTS 2025 GL EVENTS LIVE / 46
Equita Lyon
DU 29 OCTOBRE AU 2 NOVEMBRE
Partenaire engagé de la filière équestre, le groupe
GL events, à travers son entité GL events Equestrian
Sport, contribue au rayonnement international des
disciplines équestres en tant qu’organisateur et
aménageur d’événements de premier plan, avec une
attention particulière portée au bien-être animal.
GL EVENTS RAPPORT D'ACTIVITÉ 2025 / TEMPS FORTS 2025 GL EVENTS LIVE / 47
Prod&Pack
DU 18 AU 20 NOVEMBRE
En novembre 2025, GL events a organisé le salon
Prod&Pack, rendez-vous de référence des acteurs
du process, de l’emballage et de la logistique. À
cette occasion, les équipes de GL events Live ont
assuré l’installation complète de l’événement, avec
12 000 m² de stands, zones communes, espaces VIP
et salles de conférences, mobilisant l’ensemble de
leurs expertises, de la conception au mobilier et à
l’audiovisuel.
La Fête des Lumières
DU 6 AU 9 DÉCEMBRE
En décembre 2025, GL events Audiovisual and
Power a participé à l’édition annuelle de La Fête
des Lumières à Lyon en concevant et installant le
show lumière sur la Place des Jacobins avec 8 totems
et 68 projecteurs, contribuant ainsi à l’animation
culturelle emblématique de la ville.
GL EVENTS RAPPORT D'ACTIVITÉ 2025 / TEMPS FORTS 2025 GL EVENTS LIVE / 48
WorldSkills Marseille 2025
DU 16 AU 18 OCTOBRE
À l’occasion de la 48e compétition mondiale des
métiers, GL events a mobilisé la complémentarité
de ses expertises pour transformer le Parc Chanot
en un espace de compétition international. En
quelques jours, les équipes de GL events Live ont
assuré le démontage puis l’aménagement de près
de 30 000 m², avec le déploiement de structures,
cloisons modulaires, signalétique, équipements
audiovisuels et mobilier pour accueillir les épreuves.
GL EVENTS RAPPORT D'ACTIVITÉ 2025 / TEMPS FORTS 2025 GL EVENTS LIVE / 49
Grand Prix de Formule 1 du Brésil
9 NOVEMBRE
Les équipes du pôle GL events Live, en collaboration
avec GL events Brésil, ont déployé un dispositif
technique d’envergure sur le circuit d’Interlagos.
Pendant près de trois mois de chantier, plus de
120 collaborateurs ont participé à l’installation de
tribunes temporaires totalisant 41 000 places, dont la
rénovation complète de la tribune G avec 21 000 sièges.
Couvertures de tribunes, plateformes accessibles,
aménagements et mobilier ont été mis en place
pour accueillir les spectateurs dans les meilleures
conditions.
GL EVENTS RAPPORT D'ACTIVITÉ 2025 / TEMPS FORTS 2025 GL EVENTS LIVE / 51
GL EVENTS LIVE
FABRICE GUÉRIN
DIRECTEUR GÉNÉRAL LIVE
GRAND OUEST
« L’année 2025 s’inscrit
pour nous dans un
contexte particulier
après plusieurs
exercices marqués
par des événements
exceptionnels comme
la Coupe du Monde de
Rugby 2023 et les Jeux
olympiques de Paris
2024. »
L’enjeu en 2025 était clair : maintenir
un niveau d’activité suff isant et
rentable af in de préserver cette
structuration, tout en continuant à
investir et à maintenir nos objectifs
de performance.
Ces dernières années, nous avons
notamment renforcé plusieurs
fonctions clés af in de disposer
d’une organisation solide capable
d’accompagner la croissance de
nos projets.
Pour y parvenir, nous avons travaillé
autour de trois axes commerciaux
majeurs. Le premier consistait à
maintenir et consolider nos parts
de marché sur nos segments
historiques. Le deuxième était de
maximiser le potentiel de nos clients
existants en développant de nouvelles
prestations sur les événements que
nous accompagnons déjà. Cela passe
notamment par une approche
d’ensemblier, en mobilisant les
différents savoir-faire du Groupe afin
de proposer des solutions globales et
intégrées. Le troisième levier reposait
sur une présence commerciale
renforcée dans les territoires. Être au
plus près des réseaux économiques
locaux nous permet d’identifier plus
rapidement les opportunités et de
transformer ces contacts en projets
concrets.
Notre activité couvre plusieurs
segments complémentaires. Nous
intervenons sur l’événementiel avec
la location de structures, de tribunes
et d’aménagements intérieurs.
Nous accompagnons également
de nombreux salons à travers les
installations générales, les stands et
les espaces communs. Nous réalisons
ponctuellement des structures de
courte et moyenne durée dans le
cadre de projets spécifiques. Cette
diversité de métiers nous permet
d’intervenir sur des événements
très variés, aussi bien dans le Grand
Ouest qu’au-delà.
Parmi les projets emblématiques, les
24 Heures du Mans occupent une
place particulière. Nous y intervenons
sur plusieurs déclinaisons de
l’événement, notamment les éditions
automobile, classique et camion. Ces
projets mobilisent de nombreuses
expertises du Groupe, qu’il s’agisse
de signalétique, d’aménagement,
d’audiovisuel, de mobilier ou encore
d’infrastructures techniques.
Au-delà de ces grandes opérations,
nos clients sont également de plus
en plus exigeants. Ils attendent des
réponses rapides, des propositions
créatives et toujours plus de valeur
ajoutée, souvent dans des contraintes
budgétaires fortes. Cela nous
oblige à faire preuve d’intelligence
commerciale et d’agilité, en
structurant nos offres de manière
fine pour proposer des solutions
pertinentes tout en maîtrisant les
coûts.
La dimension environnementale
prend également une place croissante
dans nos activités. Nous travaillons
notamment avec des partenaires
spécialisés af in de récupérer et
réemployer certains matériaux
après démontage, comme le bois
ou certaines consommables. En
parallèle, les investissements réalisés
pour les Jeux olympiques de Paris
2024 ont renforcé notre parc matériel,
ce qui nous permet aujourd’hui de
répondre à davantage de projets
simultanément tout en favorisant
le réemploi des équipements.
En 2025, nous avons également
engagé une démarche de certi
fication ISO 20121 afin de structurer
davantage nos pratiques en matière
d’événementiel responsable. Cette
démarche permet de formaliser
des actions déjà en place et de leur
donner davantage de cohérence et
de visibilité.
Mais au-delà des projets et des
méthodes, la réussite repose avant
tout sur l’engagement collectif. Dans
notre métier, rien ne fonctionne sans
la mobilisation de l’ensemble de la
chaîne : les équipes commerciales,
les bureaux d’études, les chargés
d'affaires, le dépôt, les équipes terrain
mais aussi les sous-traitants et les
partenaires.
Nous exerçons un métier de passion.
Il nous demande beaucoup d’énergie
et d’engagement, mais il a aussi une
particularité précieuse : ce que nous
construisons contribue à créer des
moments de partage et de plaisir.
GL EVENTS RAPPORT D'ACTIVITÉ 2025 / TEMPS FORTS 2025 GL EVENTS LIVE / 52
24 Heures du Mans
DU 10 AU 14 JUIN
Épreuve mythique du sport automobile, les 24 Heures
du Mans mobilisent chaque année les équipes du pôle
GL events Live pour la mise en place d’infrastructures
temporaires destinées à accueillir spectateurs, partenaires
et médias. Tribunes, structures d’hospitalité et espaces
d’accueil sont déployés sur l’ensemble du circuit afin de
répondre aux exigences d’un événement international
rassemblant des centaines de milliers de passionnés.
Ces réalisations illustrent le savoir-faire technique du
Groupe dans la conception et l’installation d’équipements
temporaires pour les plus grands événements sportifs.
GL EVENTS RAPPORT D'ACTIVITÉ 2025 / TEMPS FORTS 2025 GL EVENTS LIVE / 53
GL EVENTS LIVE
ANTONY DE OLIVEIRA
DIRECTEUR DE PROJET
JEUX OLYMPIQUES ET
PARALYMPIQUES D’HIVER
MILAN CORTINA 2026
« Le projet des Jeux
olympiques et
paralympiques d’hiver de
Milan Cortina constitue
l’un des grands chantiers
structurants engagés par
le pôle GL events Live
dans la continuité de
Paris 2024. »
Si la livraison opérationnelle
intervient en 2026, l’année 2025 a
été déterminante pour structurer
l’organisation, mobiliser les équipes
et lancer les premières phases de
déploiement sur l’ensemble des sites.
Dès l’automne 2024, les équipes
du Groupe se sont mobilisées pour
préparer le projet Milan Cortina, avec
un premier noyau chargé de structurer
la réponse technique et d’initier les
premières phases de préparation
opérationnelle. Rapidement, le projet
prend une dimension internationale,
mobilisant des expertises issues de
plusieurs entités du Groupe afin de
répondre à des enjeux techniques,
logistiques et environnementaux
particulièrement exigeants.
Le périmètre opérationnel couvre 19
sites répartis entre Milan et plusieurs
clusters alpins, notamment Bormio,
Cortina d’Ampezzo et Tesero. Dans
ces territoires, les sites sont souvent
éloignés les uns des autres, parfois
séparés par plusieurs heures de
route à travers les massifs alpins.
Cette conf iguration impose
une organisation for tement
d é c e n t r a l i s é e . C h a q u e s i te
fonctionne ainsi comme une
unité autonome, pilotée par un
coordinateur technique et des
équipes locales responsables
de l’ensemble des opérations
quotidiennes : installation des
inf rastructures temporaires,
exploitation des équipements,
sécurité, nettoyage, gestion des
déchets ou encore déneigement.
La structuration des équipes s’est
faite progressivement, en mobilisant
d’abord des ressources internes
issues de différentes business units
du Groupe, avant d’intégrer des
collaborateurs italiens et des renforts
opérationnels. Cette coopération
f ranco-italienne, appuyée par
GL events Italie, constitue un élément
central du dispositif et permet
d’ancrer le projet dans les territoires
tout en capitalisant sur l’expérience
internationale du Groupe.
Au-delà de la dimension technique,
Milan Cortina représente également
un projet structurant pour les équipes.
Après l’expérience de Paris 2024,
le Groupe a choisi de s’appuyer
largement sur ses ressources
internes pour transmettre les savoirfaire et accompagner l’évolution
des collaborateurs. De nombreux
chefs de projet ont ainsi élargi leur
périmètre de responsabilités, tandis
que de jeunes profils accèdent à des
fonctions de coordination sur site.
Le projet devient ainsi une véritable
école interne, où l’expérience des
grands événements internationaux
se transmet entre générations.
Les Jeux d’hiver présentent des
contraintes très différentes de
celles des Jeux d’été. Les volumes
d’installations sont parfois plus réduits,
mais les exigences techniques et
environnementales sont particu
lièrement élevées, notamment en
raison du contexte montagnard et des
conditions climatiques. Les équipes
interviennent aussi bien sur des
infrastructures sportives existantes,
des stations de ski intégrées à
des zones résidentielles que sur
des espaces vierges nécessitant
des aménagements temporaires
complets.
Parmi les déf is emblématiques
figure l’aménagement des vestiaires
destinés aux équipes de la NHL pour
les compétitions de hockey sur glace :
quatorze vestiaires ont été réalisés
en seulement six semaines, dans
un environnement nécessitant
une coordination étroite entre les
installations techniques et la gestion
de la glace, un élément vivant qui
impose un contrôle précis de la
température et des conditions du
terrain de jeu.
Les opérations doivent également
composer avec des conditions
climatiques parfois extrêmes, en
altitude, entre 1 500 et 3 000 mètres.
La conception des structures, la
gestion des charges de neige, la
sécurisation des cheminements
et la protection des équipements
techniques ont été intégrées dès
la phase de conception af in de
garantir la continuité et la sécurité
des opérations.
Le projet s’inscrit par ailleurs
dans un cadre environnemental
particulièrement exigeant. Une
annexe dédiée à la durabilité, intégrée
au contrat avec la Fondazione Milano
Cortina, définit les engagements à
respecter sur l’ensemble des sites.
Dans ces zones alpines souvent
situées à proximité d’espaces
protégés du réseau Natura 2000, la
priorité est donnée à des installations
temporaires, réversibles et à faible
impact sur les milieux naturels.
Dans cette logique, les équipes
privilégient des solutions techniques
permettant de protéger les sols et
les écosystèmes, comme l’utilisation
de géotextiles ou de trackways
limitant la compaction des terrains.
Le projet s’inscrit également dans
une logique de réemploi, dans la
continuité des pratiques mises en
œuvre lors des Jeux de Paris 2024,
avec la réutilisation de nombreux
équipements et matériaux.
GL EVENTS RAPPORT D'ACTIVITÉ 2025 / TEMPS FORTS 2025 GL EVENTS LIVE / 54
SIAE 2025
DU 16 AU 22 JUIN
Depuis plus de 25 ans, GL events accompagne le
Salon International de l’Aéronautique et de l’Espace
avec une approche globale mobilisant l’ensemble
de ses expertises. Pour l’édition 2025, plus de 100
collaborateurs ont participé pendant deux mois
au déploiement de plus de 16 000 m² d’espaces.
Structures temporaires, stands clé en main, chalets
d’affaires, installations audiovisuelles, signalétique,
mobilier et services d’accueil ont été coordonnés
par les équipes du Groupe.
GL EVENTS RAPPORT D'ACTIVITÉ 2025 / TEMPS FORTS 2025 GL EVENTS LIVE / 55
Festival de Cannes
DU 13 AU 24 MAI
À l’occasion du Festival de Cannes, l’un des plus grands
rendez-vous culturels et médiatiques au monde, les équipes
du pôle GL events Live participent à la métamorphose de
la Croisette et du Palais des Festivals. Tribunes, structures
temporaires et espaces d’accueil sont installés pour
accompagner projections, cérémonies et événements
partenaires. Chaque année, ce dispositif technique
contribue à accueillir professionnels du cinéma, médias
et public dans un cadre emblématique, au cœur de l’un
des événements les plus suivis au monde.
GL EVENTS RAPPORT D'ACTIVITÉ 2025 / TEMPS FORTS 2025 GL EVENTS LIVE / 56
International Multihull Show
DU 23 AU 27 AVRIL
Salon de référence dédié aux catamarans
et trimarans, l’International Multihull Show
rassemble chaque année les acteurs majeurs du
nautisme à La Grande-Motte. Pour cet événement
international, les équipes du pôle GL events Live
déploient des structures temporaires, espaces
d’accueil et aménagements techniques destinés
à accompagner l’exposition des multicoques et
l’accueil des visiteurs professionnels et passionnés.
Monaco Yacht Show
DU 24 AU 27 SEPTEMBRE
Référence mondiale du yachting de luxe, le
Monaco Yacht Show réunit chaque année
constructeurs, designers et acheteurs
internationaux dans le Port Hercule. Les
équipes du pôle GL events Live y déploient
structures temporaires, espaces d’exposition et
aménagements destinés à accueillir exposants
et visiteurs dans un environnement portuaire
contraint. Cette réalisation témoigne de l’expertise
du Groupe dans la conception d’infrastructures
événementielles haut de gamme pour les grands
rendez-vous internationaux du secteur nautique.
GL EVENTS RAPPORT D'ACTIVITÉ 2025 / TEMPS FORTS 2025 GL EVENTS LIVE / 57
Cannes Yachting Festival
DU 9 AU 14 SEPTEMBRE
Rendez-vous majeur de la plaisance internationale,
le Cannes Yachting Festival mobilise chaque année
les équipes du pôle GL events Live pour la réalisation
d’infrastructures temporaires dédiées à l’accueil des
exposants et des visiteurs. Sur les quais du Vieux Port
et de Port Canto, tribunes, structures d’exposition et
espaces d’accueil sont déployés afin d’accompagner
les plus grands chantiers navals et marques du secteur.
Cette intervention illustre le savoir-faire du Groupe
dans la mise en place de dispositifs événementiels
techniques dans des environnements portuaires
complexes.
GL EVENTS RAPPORT D'ACTIVITÉ 2025 / TEMPS FORTS 2025 GL EVENTS LIVE / 59
LOU RUGBY - LYON, FRANCE
GL EVENTS SPORTS
« En s’appuyant sur le LOU Rugby
et la confiance renouvelée de la
Matmut, GL events Sports a renforcé
son engagement sociétal et enrichi
l’expérience spectateur et visiteur. »
MARC-ANTOINE GINON
PRÉSIDENT DE GL EVENTS SPORTS ET DU LOU RUGBY
L’écosystème sportif poursuit sa croissance tandis que les
usages évoluent. La digitalisation modifie les habitudes
des spectateurs tandis que la consommation du sport
dépasse les frontières des enceintes sportives. Le sport
spectacle conduit à une recherche d’émotion, d’expériences
à sensation et de contenus plus immersifs. GL events
Sports s’adapte dans un marché concurrentiel qui fait de
toutes ces dimensions des leviers de compétitivité. Pour
GL events Sports, 2025 a été une année de consolidation,
dans une dynamique de continuité, marquée par des
choix structurants et une vision affirmée du sport comme
espace de rencontre, d’émotion et d’engagement collectif.
LOU Rugby : une nouvelle gouvernance pour
une ambition durable
Au cœur de cette dynamique, le LOU Rugby a vécu une
saison riche de symboles et de performances. La qualification
en finale de la Challenge Cup à Cardiff face à Bath, les
dix ans du club en Top 14 et le renouvellement de sa
gouvernance ont constitué des temps forts majeurs. Le
passage de relais après douze années de présidence de
Yann Roubert à une nouvelle présidence, la venue puis la
prolongation de Karim Ghezal pour trois saisons ont ouvert
une nouvelle phase, fondée sur la continuité sportive et la
construction dans la durée. La stratégie s’inscrit dans un
projet collectif avec un directeur sportif : développement
des jeunes, plan de succession, transversalité accrue entre
les différentes équipes du LOU et renforcement du lien
avec les supporters.
Une confiance renouvelée de la Matmut et le rugby
féminin comme axe de développement
Le renouvellement du naming du Matmut Stadium et la
prolongation du partenariat avec la Matmut traduisent
la confiance et la vision partagée. Au-delà de l’apport
économique, ce partenariat accompagne durablement le
club sur les enjeux RSE, l’inclusion et l’accessibilité, tout en
s’élargissant à l’équipe féminine. Cette dernière constitue
un axe de développement stratégique : la volonté est claire
de structurer un modèle économique pérenne autour du
rugby féminin, convaincue que sa montée en puissance
est à la fois un enjeu sportif, sociétal et d’attractivité pour
développer la marque LOU Rugby.
Le développement de GL events Sports se poursuit avec
l’entretien et la modernisation continue des infrastructures,
le travail des identités de marque et l’intégration d’une
stratégie de merchandising pour le LOU Rugby. Le projet
de construction du centre d’hébergement et de formation
du LOU Rugby s’inscrit dans la même ambition : renforcer
l’attractivité du centre de formation, rassurer les familles
et offrir aux jeunes joueurs des conditions d’accueil et
GL EVENTS RAPPORT D'ACTIVITÉ 2025 / GL EVENTS, SES MÉTIERS / 61
GL EVENTS LIVE
ÉQUIPE DU LOU RUGBY - LYON, FRANCE
de travail à la hauteur des exigences du haut niveau. Il
traduit une conviction forte : la performance sportive se
construit aussi par la qualité des environnements et des
parcours proposés.
L'expérience spectateur : vers un modèle toujours
plus engagé
L’expérience spectateur a continué de se transformer.
Plus digitale, plus expérientielle, plus personnalisée, elle
repose sur une meilleure articulation entre communication,
billetterie, animations et hospitalité. Les formats d’événements
évoluent, devenant plus courts, hybrides et adaptés aux
nouveaux usages, tout en intégrant progressivement des
standards RSE plus exigeants. Si les stades pleinement
exemplaires restent un horizon à atteindre, les actions
engagées témoignent d’une trajectoire assumée.
Sur le plan environnemental et social, plusieurs initiatives
ont été renforcées au Matmut Stadium. L’incitation à la
mobilité douce s’est traduite par l’installation d’un parc à
vélos à l’intérieur du stade. Des dispositifs d’audiodescription
ont été développés pour permettre aux personnes
aveugles ou malvoyantes de vivre pleinement les matchs,
avec des bénévoles formés, des tablettes tactiles et des
expérimentations sur plusieurs rencontres. Un audit de
gestion des déchets, mené avec des étudiants de l’Institut
Supérieur de l’Environnement, a permis d’identifier des
leviers d’amélioration concrets. En parallèle, des actions
d’inclusion ont été menées avec le Fonds de dotation
LOU Attitude : accueil d’enfants en situation de handicap
ou malades, immersion dans les vestiaires, découverte du
stade et du patrimoine sportif.
Plus largement, le Matmut Stadium aff irme son rôle
d’agora urbaine, ouverte au-delà des jours de match.
Visites, événements culturels, actions solidaires, e-sport
ou initiatives caritatives permettent de faire vivre le lieu
toute l’année, en écho à la vision de Tony Garnier d’un stade
comme espace de rassemblement citoyen.
Pour GL events Sports, 2025 ne s’est pas arrêtée aux
f rontières du rugby grâce au savoir-faire reconnu des
équipes expertes de GL events Equestrian Sport. La
confiance renouvelée de la Maison Hermès à travers
l’organisation du Saut Hermès, la réussite du Printemps
des Sports Équestres à Fontainebleau ou encore le succès
croissant d’Equita Lyon – illuminé par la victoire d’Olivier
Perreau au Grand Prix 5* du Longines Equita Lyon – après
une prestation remarquée à Paris 2024, illustrent la capacité
de ces équipes à faire rayonner les sports équestres. Enfin,
le partenariat avec Arkéa, devenu namer du tournoi de
golf Ovalgreen, témoigne d’une stratégie d’élargissement
des disciplines et des formats.
GL EVENTS RAPPORT D'ACTIVITÉ 2025 / GL EVENTS, SES MÉTIERS / 62
GL EVENTS SPORTS
de dimension internationale. Dans
un environnement patrimonial
exceptionnel et contraint, les équipes
ont mobilisé l’ensemble de leur savoirfaire : installation de la carrière et du
sable, montage des tribunes (4 300
places), coordination logistique pour
l’accueil d’environ 130 chevaux, mise
en place de la scénographie conçue
par la Maison Hermès et déploiement
des expertises GL events Audiovisual
and Power, GL events Live, GL events
Mobilier et SignExpo. La réussite de
l’événement illustre la capacité du
Groupe à orchestrer, en délais très
courts, une production sportive et
scénographique de très haut niveau.
SYLVIE ROBERT
PRÉSIDENTE DE GL EVENTS
EQUESTRIAN SPORT
« En 2025,
GL events Equestrian
Sport a confirmé son
positionnement d’acteur
de référence de la filière
équestre européenne,
à travers une année
dense, marquée par des
événements majeurs et un
renforcement structurant
des engagements en
matière de bien-être
animal et de RSE. »
L’un des temps forts de l’année est
le Saut Hermès au Grand Palais,
concours international de saut
d’obstacles labellisé CSI 5*, le plus
haut niveau de la Fédération Équestre
Internationale (FEI). L’édition 2025
est particulièrement symbolique
avec le retour dans un Grand Palais
rénové. Les équipes de GL events
Equestrian Sport y interviennent
comme prestataire et partenaire de
la Maison Hermès pour l’organisation
de son plus grand événement sportif
Au printemps, le Printemps des Sports
Équestres à Fontainebleau a signé
sa 4e édition sur le site mythique du
Grand Parquet. L’événement accueille
notamment les Championnats de
France Pro de saut d’obstacles
organisés avec la Fédération Française
d’Équitation, un CSI 5*, un CDI 5*
(dressage) ainsi qu’un CSI réservé
aux cavaliers de moins de 25 ans. Cet
événement en extérieur, organisé sur
un terrain emblématique qui avait
accueilli des événements tests des
Jeux de Paris 2024, confirme l’ancrage
de GL events Equestrian Sport dans
le très haut niveau international.
À l’automne, la 31ème édition d’Equita
Lyon et du Longines Equita Lyon,
Concours Hippique International
(CHI), organisée à Eurexpo Lyon, a
rassemblé près de 200 000 visiteurs,
3 500 chevaux et les meilleures nations
équestres. L’événement accueille
quatre étapes de Coupe du Monde
FEI™ : saut d’obstacles Longines
FEI Jumping World Cup™, dressage
FEI Dressage World Cup™, attelage
FEI Driving World Cup™ et saut
d’obstacles poney FEI Jumping Ponies’
Trophy™. Véritable vitrine du modèle
intégré du Groupe, Equita mobilise
l’ensemble des expertises sur un site
exploité par le Groupe, démontrant
la cohérence entre organisation,
installation et exploitation.
Sur le plan sportif, 2025 a été marquée
par la victoire d’Olivier Perreau lors
de l’étape Coupe du Monde à Equita
Lyon. Cavalier partenaire de GL events
depuis 2019, il a également décroché
la médaille de bronze par équipes
aux Jeux olympiques de Paris 2024
au Château de Versailles, avec sa
jument GL events Dorai d’Aiguilly,
illustrant l’engagement durable du
Groupe auprès des athlètes.
Les enjeux RSE se sont intensifiés.
Le Saut Hermès s’inscrit dans une
démarche exigeante, notamment au
regard de la norme ISO 20121. GL events
accompagne la collecte de données,
la gestion des déchets spécifiques
(dont le fumier), l’identif ication
et le réemploi des matériaux et
l’optimisation logistique. Sur ses
événements propriétaires, le pôle
privilégie les structures réutilisables,
le compostage du fumier (avec des
pistes de valorisation énergétique à
l’étude), le circuit court en restauration
et la réduction des plastiques à usage
unique. À Equita Lyon, le stockage du
sable à proximité permet de limiter
significativement les transports et
l’empreinte carbone.
Enfin, le bien-être animal constitue un
axe stratégique. Héritage des Jeux de
Paris 2024, un comité bien-être animal
pérenne accompagne désormais
l’évolution des pratiques, aux côtés
d’un Horse Welfare Coordinator
(coordinateur du bien-être équin),
vétérinaire reconnu, présent sur
chaque événement. Son rôle est
d’assister les officiels, sensibiliser les
cavaliers et contribuer à l’évolution
des standards, au-delà des exigences
réglementaires de la FEI.
Portée par une équipe d’une vingtaine
de collaborateurs passionnés,
mêlant expérience historique et
nouvelle génération, GL events
Equestrian Sport consolide ainsi en
2025 un modèle alliant excellence
sportive, maîtrise opérationnelle et
responsabilité.
GL EVENTS RAPPORT D'ACTIVITÉ 2025 / GL EVENTS, SES MÉTIERS / 63
GL EVENTS RAPPORT D'ACTIVITÉ 2025 / GL EVENTS, SES MÉTIERS / 64
SAUT HERMÈS - PARIS, FRANCE
Asie
En 2025, la zone Asie a poursuivi son développement
dans un environnement économique en mutation et
des marchés de plus en plus exigeants. Le Groupe y
déploie un modèle intégré combinant organisation
de salons, solutions événementielles et gestion
d’infrastructures. Cette complémentarité d’expertises
permet d’accompagner l’évolution de secteurs
stratégiques tels que la santé, l’industrie ou les
nouvelles économies de l’expérience. Portée par
des équipes locales engagées et par des synergies
renforcées avec l’ensemble du Groupe, la zone Asie
confirme son rôle dans la stratégie internationale
de GL events.
CACLP - HANGZHOU, CHINE
ASIE
GL events
Greater China
« En Chine, la croissance effrénée
a laissé place à une quête de qualité,
d'innovation et de valeur. »
INÈS GINON
PRÉSIDENTE DE GL EVENTS GREATER CHINA
En 2025, GL events Greater China a évolué dans un
environnement contrasté, marqué par le ralentissement
de la croissance en Chine et par la professionnalisation de
l’industrie des salons. Ainsi, face à un marché en phase de
maturation et à un environnement économique global plus
complexe, GL events Greater China a adapté son approche
2025 en faisant preuve d’agilité, combinant la consolidation
et le renforcement des activités existantes avec en parallèle
des développements stratégiques à long terme, tels que
l'acquisition d'une nouvelle plateforme dédiée au secteur
vétérinaire, l'ouverture opérationnelle du parc des expositions
de Pékin et la création de l'international office. Simultanément,
les équipes ont activement préparé l'avenir en renforçant les
synergies entre entités, en accompagnant la professionnalisation
du secteur et en se déployant sur des projets hors frontière.
Un contexte de marché plus exigeant, une stratégie
plus sélective
En 2025, la Chine est entrée dans une phase de croissance
plus modérée qui impose davantage d’exigence, d’efficacité
et de sélectivité. Cette évolution se traduit par un marché des
salons plus mature et concurrentiel où la simple croissance
des volumes ne suffit plus : il devient impératif de créer de la
valeur par la qualité des plateformes, l'excellence des services
et l'innovation des modèles économiques proposés. C'est dans
ce cadre que GL events Greater China a orienté son action,
alliant stabilisation, structuration et développement ciblé.
De nouveaux projets structurants reflets d'une agilité et
d’une capacité d’écoute des marchés.
Un des faits marquants de l'année a été le lancement d'une
nouvelle plateforme événementielle dédiée au secteur
vétérinaire. Pensée comme une offre annuelle intégrée plutôt
qu'une simple commercialisation de mètres carrés, cette
solution illustre la volonté des équipes Chine de se positionner
sur des filières à fort potentiel, dans un marché vétérinaire
asiatique en pleine structuration et encore peu régulé.
Entre le développement du marché des animaux de compagnie,
et la structuration du marché des animaux d’élevage (sécurité
alimentaire et enjeux sanitaires, industrialisation etc.), une
GL EVENTS RAPPORT D'ACTIVITÉ 2025 / UN GROUPE INTERNATIONAL / 67
WESAVC - TIANJIN, CHINE
plateforme permettant de structurer, d’échanger des
connaissances, de former ou encore de présenter des
innovations se révèle particulièrement pertinente.
Parallèlement, l’ouverture du parc des expositions de
Pékin, malgré des délais de mise en œuvre très courts,
a démontré le savoir-faire des équipes et a permis de se
positionner sur l’offre des prestations de services à Pékin.
Ce projet reconfirme la capacité du Groupe à s’associer
avec des partenaires d’États locaux sur des projets de
premier rang. Si le développement du portefeuille de salons
reste un enjeu essentiel pour les prochaines années, cette
première année d'exploitation s'est révélée porteuse et
confirme notre savoir-faire en matière de gestion de sites.
À Hong Kong, GL events Greater China a été confronté
à une pression concurrentielle accrue. Nos équipes y
ont renforcé l’engagement du Groupe en diversifiant
son offre de mobilier et de fournitures avec des produits
recyclés, conçue pour être réutilisable et intégrée dans une
logique circulaire. Cette démarche illustre notre volonté
de promouvoir une approche plus responsable et durable
de l’événementiel, tout en proposant un positionnement
différenciant sur ce marché.
En capitalisant sur le marché chinois pour accélérer le
développement international, l’International Off ice –
historiquement structuré autour de la commercialisation
de l’offre salons – élargit son périmètre afin de proposer une
offre intégrée et diversifiée : promotion de l’offre GL events
et valorisation des destinations du Groupe.
Expansion régionale et positionnement différenciant
Parallèlement, GL events Greater China a posé des bases
importantes en dehors de la Chine continentale, notamment
au Vietnam. L’année a permis de réaliser sur un marché
en plein développement des prestations de services et de
conseil relatifs à des manifestations d’importance. Ce mandat
témoigne du haut niveau de confiance accordé aux équipes
en charge et ouvre des perspectives de développement
autour de l’ensemble des compétences du groupe, qu’il
s’agisse d’organisation ou d’installation d’événements
comme de gestion d’infrastructures événementielles.
Renforcement des synergies et collaborations pour
une montée en puissance dans la perspective des
opportunités 2026
2025 a été une année dense pour GL events Greater China, faite
à la fois de stabilisation, de structuration et de développement.
Si GL events Greater China a su naviguer avec agilité dans
un environnement complexe, posant des bases solides
pour son développement futur, c’est qu’elle peut compter
sur des équipes engagées. 2025 a été l’occasion pour elle
de multiplier les synergies et collaborations tant au sein de
la zone Asie qu'avec l'ensemble du Groupe, en participant
notamment à un séminaire fédérateur en France. L'année
2026 s'annonce comme une année d'accélération, riche
en projets et en opportunités. Les priorités seront axées
sur la consolidation des nouvelles plateformes en Chine, la
poursuite des activités de développement notamment au
Vietnam et la participation à plusieurs projets hors frontières,
notamment au Japon. En confirmant son rôle de pilier de la
stratégie internationale du Groupe, la zone Asie est prête à
capter les nouveaux relais de croissance de la région.
GL EVENTS RAPPORT D'ACTIVITÉ 2025 / UN GROUPE INTERNATIONAL / 68
ASIE
Japon
manque pas de projets, mais
arrive à bout de souffle. De grands
programmes nationaux monopolisent
les ressources, entraînant une forte
pression sur les coûts et les délais,
dans un environnement extrêmement
réglementé. Cette tension s’est
particulièrement ressentie autour
de l’Exposition universelle d’Osaka :
reportée après celle de Dubaï, avec
un temps de planification réduit,
des budgets contraints et des pays
participants arrivant tardivement,
cette manifestation de portée
internationale s’est par ailleurs
organisée dans un cadre juridique
japonais très strict.
THOMAS QUEMIN
DIRECTEUR DE GL EVENTS JAPAN
« Au Japon, GL events
contribue à bâtir l'avenir
de l'événementiel
en relevant le défi
de transformer les
contraintes d'un marché
complexe en opportunités
de croissance. »
Dans un Japon confronté à une
chute démographique marquée, à un
secteur de la construction sous tension
et à un déficit d’espaces réceptifs,
GL events Japan a franchi un cap
structurant en se positionnant sur des
projets emblématiques pour le pays et
son rayonnement. L'activité de 2025 a
constitué un véritable tremplin pour
le Groupe, qui confirme sa capacité à
s’ancrer durablement sur ce marché
tout en y apportant des solutions
nouvelles.
Le contexte économique et sectoriel
est paradoxal : la construction ne
C’est dans ce contexte que GL events
Japan a pu jouer pleinement son
rôle de facilitateur et de bâtisseur.
GL events Japan fait partie des
rares sociétés étrangères à cumuler
une licence d’architecture et une
licence de construction, conditions
indispensables pour exercer ses
métiers, y compris pour des
structures temporaires comme les
tentes ou les gradins. C'est d’ailleurs
ce qui lui permet d’intervenir sur des
projets de construction temporaire
ambitieux.
L’Exposition universelle d’Osaka a
été l’occasion de mettre à profit
un savoir-faire et des structures
temporaires éprouvés et adaptés aux
normes locales. C’est cette expertise
qui permet de garantir des temps
de montage et une empreinte
environnementale maîtrisés, pour
la livraison de pavillons en un temps
record. Cette hybridation entre
événementiel et construction semipermanente devient désormais un
axe stratégique fort, dans un pays
où l’offre d’espaces événementiels
est encore insuffisante et les taux
d’occupation très élevés.
À travers l’activité des trois pôles,
l’implantation géographique se
structure autour de Tokyo, AichiNagoya et Osaka. Année clé en matière
de ressources humaines, 2025 a permis
la constitution d’une équipe allant
jusqu’à près de 170 personnes pour
l’exploitation de pavillons. Ce vivier
de talents constitue un socle pour les
opérations futures, à commencer par
les Jeux Asiatiques et Para-Asiatiques
d’Aichi-Nagoya. L’année marque
ainsi le lancement opérationnel du
modèle DBO (Design, Build, Operate)
et des Venue Operations Services, en
capitalisant sur l'inertie positive créée
par l’Exposition universelle. Ceci vient
se conjuguer au savoir-faire en matière
de gestion de site et d’animation du
territoire à travers l’exploitation du
parc des expositions Aichi Sky Expo
ainsi qu’à l’expertise d’organisation
de salons avec Tranoï Tokyo.
Comme dans les autres géographies,
GL events construit son activité en
s’appuyant sur des partenaires et
fournisseurs locaux ainsi qu’une
relation de conf iance avec les
acteurs publics et les collectivités.
Ainsi, GL events Japan entretient des
relations de qualité avec le Ministry
of Economy, Trade and Industry, les
préfectures d’Osaka et de Nagoya,
ainsi qu’avec des acteurs majeurs de
l’architecture et de la construction
comme Nikki Sekkei et Nishio Rent
All. Ils accompagnent désormais
le Groupe sur les futurs projets de
constructions semi-permanentes.
Si 2025 a été une année de défi, dans
un contexte culturel et politique
exigeant, elle a permis de poser une
ambition durable, de consolider une
expertise locale et de jeter les bases de
l'héritage des Jeux Asiatiques et ParaAsiatiques dans le développement
du Groupe au Japon.
GL EVENTS RAPPORT D'ACTIVITÉ 2025 / UN GROUPE INTERNATIONAL / 69
TOURISM EXPO JAPAN - AICHY, JAPON
GL EVENTS RAPPORT D'ACTIVITÉ 2025 / UN GROUPE INTERNATIONAL / 70
GL EVENTS VENUES
GL events
Venues
Le réseau
international
de 60 sites
événementiels
Un réseau international et diversifié
ٱ60 sites dans le monde.
ٱUne grande variété de lieux : centres de congrès, parcs
des expositions, espaces réceptifs, salles de concerts,
arénas et stades.
ٱImplantation dans les destinations majeures du tourisme
d’affaires.
Une offre de services complète et engagée
ٱOffre et qualité de service homogènes d’un site à l’autre :
accueil, audiovisuel, mobilier, restauration…
ٱFiabilité des équipements et respect de la sécurité
sanitaire, des personnes et des données.
ٱUne démarche événementielle responsable : de la
gestion du lieu à l’exploitation en événement.
Un moteur de développement territorial
ٱPartenaire des collectivités, institutions et communautés
locales.
ٱContribution directe à l’économie des territoires.
ٱParticipation à l’animation sociale, culturelle et économique
des territoires.
GL EVENTS RAPPORT D'ACTIVITÉ 2025 / GL EVENTS, SES MÉTIERS / 72
GL EVENTS VENUES
514,1
60
28
M€
de chiffre d’affaires
sites gérés*
4 380
1 525
événements accueillis
2,4
collaborateurs
117
salons et événements
organisés
80 %
M
de m d’espaces d’accueil
2
destinations
d'électricité renouvelable
consommée et 4 276 MWh
d’électricité renouvelable
produite sur Eurexpo et Aïchi
GL EVENTS RAPPORT D'ACTIVITÉ 2025 / GL EVENTS, SES MÉTIERS / 73
STADE DE FRANCE - PARIS, FRANCE
GL EVENTS VENUES
CHRISTOPHE CIZERON
PRÉSIDENT DIRECTEUR GÉNÉRAL
DE GL EVENTS VENUES
DANIEL CHAPIRO
DIRECTEUR GÉNÉRAL DÉLÉGUÉ
DE GL EVENTS VENUES
CLÉMENT GUERCI
DIRECTEUR GÉNÉRAL ADJOINT
EN CHARGE DU DÉVELOPPEMENT
DE GL EVENTS VENUES
« 2025 se révèle comme une année charnière avec un changement
d’échelle pour le pôle Venues, pour lequel expansion, intégration
et performance se conjuguent pour révéler la solidité d’un
modèle en pleine maturité et son ouverture sur l’international. »
Le pôle Venues a connu en 2025 une année de très forte
intensité, marquée à la fois par une accélération de son
développement, une intégration réussie de nouveaux sites
et une performance d’exploitation en nette progression.
Dans un contexte économique et géopolitique instable,
cette dynamique témoigne de la solidité du modèle du pôle
et de sa capacité à conjuguer vision stratégique, excellence
opérationnelle et engagement humain. L'année a combiné
croissance externe, intégration de sites emblématiques et
structuration stratégique dans la continuité des orientations
portées par la direction du pôle et dans une dynamique
d’expansion maîtrisée.
Un réseau enrichi de nouveaux sites sur quatre
continents
L’année a été particulièrement structurante avec l’entrée dans
le périmètre de sept nouveaux sites sur quatre continents.
Le Parc Chanot à Marseille, Capital International Exhibition
& Convention Center (CIECC) à Pékin, Guangzhou Expo
Center à Canton, le Parc des expositions d’Abidjan, Espacio
Riesco à Santiago du Chili ainsi que le Stade de France,
sont venus renforcer un réseau déjà riche et diversifié. Ces
intégrations, souvent menées dans des délais très courts
et des contextes complexes, illustrent la maturité du pôle
Venues et sa capacité à accueillir des équipements de
grande taille tout en maintenant un haut niveau d’exigence
opérationnelle.
La réussite de ces projets repose sur une structuration
progressive des méthodes d’intégration. Les processus ont
été standardisés dans plusieurs domaines clés, permettant
une acculturation plus rapide des équipes, une montée en
performance accélérée et un accueil fluide au sein du réseau
international. La capacité des équipes locales à adhérer au
projet GL events et la vitesse d’appropriation des standards
du Groupe constituent des indicateurs majeurs de succès,
tant sur le plan humain que financier.
En 2025, le Stade de France a été une illustration parfaite
de cette dynamique. Son intégration a marqué une
étape importante dans l’élargissement des activités du
pôle au service du sport et du divertissement, avec une
alternance de grands événements sportifs et de concerts
dans un calendrier particulièrement dense. Au-delà de
GL EVENTS RAPPORT D'ACTIVITÉ 2025 / GL EVENTS, SES MÉTIERS / 75
GL EVENTS VENUES
la performance économique, ce projet a été un véritable
test de réactivité et de mobilisation collective. En quelques
mois, les équipes ont su reprendre l’exploitation, adapter
les organisations, sécuriser les opérations et embarquer
l’ensemble des collaborateurs autour des valeurs et des
exigences du Groupe.
Cette capacité d’adaptation constitue l’une des forces du
pôle Venues. Elle s’illustre aussi bien dans la gestion de
sommets internationaux de tout premier plan, comme le
G20 en Afrique du Sud ou le sommet de l’OTAN au World
Forum de La Haye, que dans l’accueil de manifestations
culturelles, sportives ou BtoC. Dans certains cas, un seul
événement a représenté l’équivalent de plusieurs années
d’activité, démontrant la capacité des sites à se transformer
pour répondre à des cahiers des charges exceptionnels.
Au-delà des volumes, 2025 confirme la capacité du pôle à
absorber des opérations complexes grâce à des processus
d’intégration désormais éprouvés, tant sur le plan financier
qu’opérationnel et humain. L’enjeu n’est pas uniquement
d’ajouter des sites au réseau, mais de les inscrire rapidement
dans une logique de performance durable, d’attractivité
renforcée et de cohérence avec le modèle intégré du Groupe.
La gestion d’opérations complexes et l’expérience
client sont au cœur de cette performance
L’attribution du contrat de concession du Stade de France
constitue évidemment le fait marquant de l’année. Ce
dossier, préparé sur plusieurs exercices, a mobilisé l’ensemble
des expertises du Groupe, juridique, financière, technique,
communication, dans une logique de travail transversal
particulièrement exigeante. C'est ce qui a permis de
présenter à l’État français un projet différenciant, fondé sur
une vision d’animation du site, d’ouverture à son écosystème
et de gouvernance élargie. Les différentes séquences
de négociation, ainsi que les procédures contentieuses
engagées par le concurrent sortant, ont renforcé la solidité
du projet et confirmé la capacité du Groupe à mener des
dossiers d’envergure nationale dans un cadre institutionnel
complexe.
À l’international, la stratégie demeure claire : cibler
prioritairement les grandes capitales économiques et
politiques, notamment en Europe, où des opportunités
ont été activement explorées en 2025. Même lorsque les
opérations n’aboutissent pas, le travail engagé permet de
poser des bases relationnelles et d’affiner la compréhension
des marchés, préparant les développements futurs.
L’ouverture du Parc des Expositions d’Abidjan marque une
étape stratégique importante. Le contrat conclu avec l’État
ivoirien permet d’expérimenter un nouveau marché à fort
potentiel de croissance. Cette implantation traduit une lecture
prospective des dynamiques économiques régionales et
la volonté d’anticiper les évolutions du continent africain.
Le développement passe aussi par la dynamique des
sites composant déjà le réseau dont l’activité anime les
territoires à travers une exigence opérationnelle reconnue.
En 2025, les équipes ont poursuivi l’amélioration continue
des parcours visiteurs et exposants, en travaillant à la fois
sur l’hospitalité, les services, le back-office et l’accueil. Les
offres restauration ont continué d’évoluer, tout comme les
dispositifs audiovisuels et les solutions IT événementielles,
avec une digitalisation accrue des services, notamment
sur la billetterie. Ces évolutions contribuent à renforcer
l’attractivité des sites et à répondre aux attentes de publics
de plus en plus diversifiés.
Une vision à long terme et une transformation
durable pour structurer l’avenir
Le pôle Venues s’inscrit dans une trajectoire de
transformation durable de ses actifs. Les enjeux énergétiques,
environnementaux et sociétaux sont pleinement intégrés
aux projets d’exploitation et de rénovation. Des sites comme
le Parc Chanot à Marseille illustrent cette ambition, avec
des travaux engagés qui transforment à la fois l’off re
commerciale, l’empreinte environnementale et l’image
du site auprès des collectivités et du public. Moins d’un an
après leur lancement, les premiers résultats sont visibles
et reconnus.
Cette approche s’inscrit dans une vision de moyen et long
terme, formalisée à travers des feuilles de route par site et
une feuille de route stratégique "Vision 2050" renouvelée
pour le pôle. L’objectif est clair : être présent dans les
grandes capitales et les destinations stratégiques, tout en
restant capable de s’adapter rapidement aux évolutions
des marchés, des formats événementiels et des attentes
institutionnelles. La diversification géographique, la variété
des typologies de sites et des activités constituent des
leviers majeurs de résilience et de croissance.
La taille du réseau permet désormais d’envisager des offres
intégrées à destination des producteurs et des partenaires,
en structurant des logiques de tournées multi-sites, de
partenariats transverses ou de dispositifs de sponsoring
élargis. Cette montée en puissance implique une réflexion
organisationnelle, avec la création de nouvelles lignes
d’activité et une coordination accrue entre les équipements.
La dimension humaine reste centrale dans cette trajectoire.
Le pôle Venues a été particulièrement impacté pendant la
crise sanitaire, avec la fermeture de nombreux sites. Trois
ans plus tard, la reprise est spectaculaire. Cette réussite
repose sur des équipes issues de contextes très différents,
GL EVENTS RAPPORT D'ACTIVITÉ 2025 / GL EVENTS, SES MÉTIERS / 76
GL EVENTS VENUES
PARC DES EXPOSITIONS - ABIDJAN, CÔTE D'IVOIRE
accompagnées dans leurs parcours de formation et
embarquées dans un projet collectif. Le rôle des ressources
humaines, de la formation et du management de proximité
est à cet égard déterminant.
Par une programmation diversifiée, le pôle Venues poursuit
la densification de l’activité des sites qu’il gère. Salons,
congrès, événements d’entreprise, manifestations culturelles,
spectacles immersifs ou événements grand public cohabitent
désormais au sein des équipements. La Sucrière a été
pionnière dans cette hybridation des usages, aujourd’hui
déployée sur d’autres sites du réseau.
À l’issue de l’exercice 2025, le pôle aborde les prochaines
années avec des ambitions claires : poursuivre son
développement international, renforcer ses synergies
internes, consolider la performance d’exploitation et continuer
à faire de ses sites des lieux vivants, responsables et ouverts
à tous les publics. Le pôle Venues conjugue expansion
géographique, capacité d’ingénierie institutionnelle
et transformation de son offre, tout en consolidant ses
fondamentaux opérationnels. Cette combinaison constitue
le socle des prochaines étapes de développement, dans un
environnement international toujours plus concurrentiel.
Avec plus de 4 000 manifestations accueillies chaque année
et plus de 20 millions de visiteurs, le pôle Venues confirme
son rôle de vitrine d’attractivité pour les territoires.
GL EVENTS RAPPORT D'ACTIVITÉ 2025 / GL EVENTS, SES MÉTIERS / 77
Tournée Indochine
2025
Les Zéniths et Arénas du réseau GL events
Venues ont accueilli plusieurs concerts de la
tournée du groupe Indochine.
GL EVENTS RAPPORT D'ACTIVITÉ 2025 / TEMPS FORTS 2025 GL EVENTS VENUES / 79
GL EVENTS VENUES
des équipements de loisirs et de
renforcer l’ouverture du parc hors
période d’exploitation.
Ces aménagements répondent
également à un objectif d’attractivité.
À Marseille, la possibilité de vivre
en extérieur une grande partie de
l’année constitue un atout. Offrir
aux congressistes et aux visiteurs
des espaces qualitatifs, favorables
aux temps de pause et aux
rencontres, devient un argument
commercial concret. Le programme
d’investissement est tenu et optimisé :
des marges dégagées permettront
de moderniser l’auditorium du Palais
des Congrès, notamment les assises,
renforçant ainsi la qualité d’accueil.
PIERRE ARVIS
DIRECTEUR GÉNÉRAL
MARSEILLE CHANOT
La première année de pleine
exploitation du Parc Chanot dans
le cadre d’une délégation de service
public de trois ans s’est traduite par
la concrétisation immédiate des
engagements du Groupe. La durée
atypique de la concession, assortie
d’un cahier des charges exigeant,
place le site dans une logique de
démonstration. L’enjeu est clair :
tenir les engagements, installer une
nouvelle dynamique et préparer,
avec la Ville, la prochaine étape de
développement à plus long terme.
La priorité a été donnée à la
transformation et à l’ouverture
du parc . Sur les 17 hectares
bénéficiant d’une localisation en
centre-ville, un programme de
désimperméabilisation de 20 000 m²
a été amorcé conformément aux
engagements pris. Les premières
zones, notamment autour du Palais
des Arts, ont été végétalisées et
réaménagées avec du mobilier
urbain. Les effets sont déjà visibles : les
habitants et les scolaires s’approprient
progressivement les espaces et le
site commence à s’inscrire comme
un lieu de vie au-delà des seuls
événements. La seconde tranche,
le « cœur de Chanot », a été lancée
dans les délais. Elle permettra d’élargir
ces espaces extérieurs, d’installer
Sur le plan commercial, 2025 a été
marquée par des résultats tangibles.
La Foire Internationale de Marseille,
événement central représentant près
d’un tiers de l’activité, enregistre une
hausse de 15 % de la fréquentation,
soit environ 260 000 visiteurs, dans
un contexte pourtant difficile pour
le modèle des foires. Plus de 1 000
exposants ont participé à cette
édition, saluée par les acteurs
économiques locaux.
Le site a également accueilli la finale
nationale des WorldSkills pendant
trois jours. Près de 10 000 jeunes et
accompagnants ont fréquenté le parc,
démontrant la capacité à gérer des flux
importants, à déployer une installation
générale complexe et à enchaîner
deux grands événements dans des
délais contraints, immédiatement
après la Foire. La satisfaction de
l’organisateur confirme la pertinence
d’un modèle intégré, permettant de
maîtriser l’ensemble des espaces et
des prestations.
En parallèle, un travail de fond a été
engagé pour renforcer l’attractivité
future du site, avec la préparation de
grands rendez-vous structurants à
venir et la mobilisation du réseau
international du Groupe pour capter
de nouveaux congrès.
« Une première année
sous le signe de
la concrétisation
rapide et de l’ancrage
territorial. ”
L’année 2025 a également été
l’occasion de dialoguer avec
l ’e n s e m b l e d e l ’é co sys tè m e
marseillais au service duquel le Parc
doit renforcer son rôle. Des liens
étroits ont été noués avec le bureau
des congrès, l’office du tourisme, les
agences de développement territorial
et les acteurs économiques locaux.
L’objectif est partagé : renforcer le
rayonnement de Marseille comme
destination événementielle.
Côté équipes, un management
plus transversal a été mis en place,
favorisant les échanges entre les
équipes du Parc Chanot et les autres
sites du réseau du pôle Venues. Le
recrutement d’une directrice générale
adjointe en charge des manifestations
accueillies a renforcé la structuration
commerciale et opérationnelle.
L’ancrage social du site s’est
concrétisé notamment par l’accueil
pérenne de l’Agence pour l’éducation
par le sport (APPELS) au Palais
des Arts, offrant un lieu fixe à ses
actions d’accompagnement des
jeunes. Le dialogue régulier avec
les comités d’intérêt de quartier
permet par ailleurs, de concilier
activité événementielle et qualité
de vie en centre-ville.
Au terme de cette première année,
le Parc Chanot démontre sa capacité
à honorer une DSP exigeante, à
transformer concrètement son outil
et à s’inscrire durablement dans le
développement de la destination
Marseille.
GL EVENTS RAPPORT D'ACTIVITÉ 2025 / TEMPS FORTS 2025 GL EVENTS VENUES / 80
Foire internationale de Marseille
DU 26 SEPTEMBRE AU 6 OCTOBRE
La Foire de Marseille a célébré son centenaire
en réunissant exposants et grand public autour
d’une programmation festive et commerciale. Elle
reste un rendez-vous incontournable du territoire,
au cœur de la vie économique et sociale locale.
GL EVENTS RAPPORT D'ACTIVITÉ 2025 / TEMPS FORTS 2025 GL EVENTS VENUES / 81
Wsava Congress
DU 25 AU 27 SEPTEMBRE
Le Riocentro a accueilli le congrès mondial
vétérinaire WSAVA, réunissant 3 000 participants
internationaux. Ce rendez-vous confirme l’ancrage
du site sur le marché des congrès scientifiques
internationaux.
MIDEM
DU 29 AU 31 JANVIER
Partenaire du MIDEM à Cannes, GL events Venues a mobilisé
son réseau pour accueillir les acteurs internationaux de
l’industrie musicale. Ce rendez-vous a illustré la capacité des
sites à recevoir des formats hybrides mêlant networking,
conférences et expériences immersives. Il s’inscrit dans
une dynamique de développement des événements
culturels à forte valeur ajoutée.
GL EVENTS RAPPORT D'ACTIVITÉ 2025 / TEMPS FORTS 2025 GL EVENTS VENUES / 82
WorldSkills & Abilympics
DU 16 AU 18 OCTOBRE
En octobre 2025, GL events Venues a accueilli
simultanément la 48e Compétition nationale des métiers
à Marseille Chanot et WorldSkills Japan & Abilympics à
Aichi Sky Expo au Japon. Une mobilisation coordonnée
qui témoigne de la dimension internationale du réseau.
GL EVENTS RAPPORT D'ACTIVITÉ 2025 / TEMPS FORTS 2025 GL EVENTS VENUES / 83
EAGE
EAGE
DU 2 AU 5 JUIN
Le MEETT a accueilli le congrès annuel de
l’association européenne des géoscientifiques
et ingénieurs, réunissant 5 500 participants et
170 exposants. Conférences, ateliers et exposition
ont rythmé cet événement international, porté
par une organisation fluide et une forte exigence
technique.
DU 2 AU 5 JUIN
Le MEETT a accueilli le congrès annuel de l’Association
européenne des géoscientifiques et ingénieurs,
réunissant 5 500 participants et 170 exposants.
Conférences, ateliers et exposition ont rythmé cet
événement international, porté par une organisation
fluide et une forte exigence technique.
GL EVENTS RAPPORT D'ACTIVITÉ 2025 / TEMPS FORTS 2025 GL EVENTS VENUES / 84
Cérémonie du Guide Michelin
31 MARS
Metz Congrès a accueilli la cérémonie du Guide
Michelin 2025, récompensant 78 nouvelles tables
étoilées et mettant à l’honneur les meilleurs chefs
de France autour de l’excellence gastronomique. Ce
temps fort a renforcé la visibilité du site sur la scène
événementielle nationale.
GL EVENTS RAPPORT D'ACTIVITÉ 2025 / TEMPS FORTS 2025 GL EVENTS VENUES / 85
GL EVENTS VENUES
Eurexpo Lyon, de nombreux salons
d’envergure se sont tenus, parmi
lesquels Global Industrie, Pollutec,
Longines Equita Lyon, Solutrans et
le SIRHA Lyon.
Le Centre de Congrès de Lyon a
reçu des rendez-vous de référence
tels que le Congrès de la Société
Française de Cardiologie, Patrimonia
et les Journées Francophones de
Nutrition.
Les sites ont également accueilli
des événements corporate qui
ont attiré un large public avec des
manifestations ouvertes à tous,
comme la Foire de Lyon, le Salon
Automobile de Lyon et le Salon du
Randonneur.
SYLVAIN DOUCE
DIRECTEUR GÉNÉRAL
DESTINATION LYON
« En 2025, la destination
Lyon s’appuie sur une
activité soutenue et
confirme la solidité
de ses sites au sein du
paysage événementiel
français et européen. »
Portée par la complémentarité
d’Eurexpo Lyon, du Centre de
Congrès de Lyon, de La Sucrière et
du Matmut Stadium, l’offre lyonnaise
continue de répondre à des formats
variés et à des événements de
plus en plus exigeants. Dans un
marché concurrentiel, cet équilibre,
associé à un ancrage territorial fort
et à une exigence opérationnelle
constante, constitue un levier clé
pour poursuivre le développement
de la destination.
Les résultats traduisent cette
dynamique. Les sites lyonnais ont
accueilli de grands événements. À
L a Sucrière a poursuivi son
positionn ement hybride, entre
culture, expositions et événements
d’entreprise, tandis que le Matmut
Stadium a renforcé son activité
événementielle hors jours de match.
Cette diversité de programmation,
entre congrès internationaux, salons
professionnels, événements corporate
et manifestations grand public,
permet de maintenir une activité
équilibrée dans le temps.
L’année 2025 a marqué une étape
importante pour Eurexpo Lyon, avec la
préparation et la mise en perspective
de son extension, destinée à
accompagner la croissance des salons
et à renforcer la compétitivité du site
face aux standards internationaux.
Cette dynamique repose notamment
sur des équipements déployés sur les
sites, tels que le parc photovoltaïque
d’Eurexpo Lyon et la déchetterie
du Centre de Congrès de Lyon. Ces
installations contribuent à améliorer
la performance énergétique et à
optimiser la gestion des déchets
lors des événements.
E n p a r a l l è l e , l e s d e u x s i te s
poursuivent leur engagement dans
le cadre de la certification ISO 20121,
dédiée au management responsable
de l’activité événementielle.
Pour accompagner ces évolutions et
renforcer leur montée en gamme,
les sites lyonnais s’appuient sur des
investissements et des démarches
d’innovation, menés en lien avec les
collectivités, les institutions partenaires
et l’écosystème événementiel local.
La complémentarité entre les quatre
sites demeure un levier déterminant.
Pilotés dans une logique coordonnée,
ces équipements offrent une capacité
modulable, adaptée à des jauges
variées et à des formats complexes.
Cette approche renforce la lisibilité
de l’off re lyonnaise auprès des
organisateurs.
Sur le plan humain, 2025 a confirmé
la solidité des équipes. La stabilisation
des organisations, la montée en
compétences et la polyvalence
des collaborateurs ont permis
d’absorber un calendrier dense tout
en maintenant un haut niveau de
qualité de service. Cette dynamique
s’inscrit dans une attention renforcée
portée à l’expérience collaborateur,
illustrée notamment par l’obtention
de la certification Great Place To
Work® France 2025.
Au-delà des volumes, 2025 a été une
année d’exigence opérationnelle. Les
équipes ont travaillé à la fluidité des
parcours visiteurs, à la fiabilité des
dispositifs techniques, à la montée
en gamme des prestations et à
son attractivité auprès de filières
innovantes, notamment sur les
congrès scientifiques à forte valeur
ajoutée.
À l’issue de l’exercice, la destination
Lyon s’inscrit dans une dynamique
de long terme avec une ambition
claire. Renforcer l’impact économique
des congrès accueillis, attirer des
événements structurants pour
les filières régionales et continuer
à développer l’attractivité de la
destination lyonnaise à l’échelle
européenne.
GL EVENTS RAPPORT D'ACTIVITÉ 2025 / TEMPS FORTS 2025 GL EVENTS VENUES / 86
Expositions culturelles du réseau
2025
Les sites du réseau GL events Venues ont accueilli plusieurs
expositions culturelles majeures à Strasbourg, Lyon et Paris.
Expériences immersives et formats innovants ont permis
de diversifier les usages des lieux et d’élargir les publics.
ٱÀ Strasbourg, Antoine de Saint-Exupéry, le Petit
Prince parmi les hommes, Van Gogh, the immersive
experience
ٱÀ la Sucrière, Pompéi, Titanic : Un voyage immersif
ٱJurassic World, l’aventure Lego® à Paris Montreuil Expo
GL EVENTS RAPPORT D'ACTIVITÉ 2025 / TEMPS FORTS 2025 GL EVENTS VENUES / 87
Sommet de l’OTAN
DU 24 AU 25 JUIN
Le World Forum de La Haye a accueilli le Sommet
de l’OTAN, réunissant chefs d’État et délégations
internationales. Ce rendez-vous stratégique souligne
le rôle du site dans l’accueil de grandes rencontres
diplomatiques et institutionnelles.
GL EVENTS RAPPORT D'ACTIVITÉ 2025 / TEMPS FORTS 2025 GL EVENTS VENUES / 88
Sommet du G20
DU 22 AU 23 NOVEMBRE
Le Johannesburg Expo Centre a accueilli le Sommet
du G20, réunissant les dirigeants des principales
économies mondiales. Un événement de premier
plan, inscrit dans le calendrier des grandes rencontres
internationales.
GL EVENTS RAPPORT D'ACTIVITÉ 2025 / TEMPS FORTS 2025 GL EVENTS VENUES / 89
Clermont Fèira
DU 21 AU 25 MAI
Clermont Auvergne events a relancé la Foire de
Clermont avec Clermont Feira, réunissant plus de
400 exposants et 27 000 visiteurs. Fortement ancré
dans son territoire, l’événement a valorisé les acteurs
régionaux et redynamisé un rendez-vous historique
au service de l’économie locale.
GL EVENTS RAPPORT D'ACTIVITÉ 2025 / TEMPS FORTS 2025 GL EVENTS VENUES / 90
GL EVENTS VENUES
En 2025, les collectivités investissent
de plus en plus dans le sport,
l’entertainment, de nouvelles salles
renforcent la concurrence, l’enjeu
a été clair : consolider l’exploitation
d’un “multi-équipements” très dense,
tout en affirmant la place de l’Aréna
comme levier d’attractivité et d’activité
économique pour le territoire.
PAUL SÉCHAUD
DIRECTEUR GÉNÉRAL
ORLÉANS EVENTS
« L'agilité opérationnelle
est la clé du succès
d'un modèle multiéquipements unique
comme l’Aréna
d’Orléans qui accueille
un club résident.
Du sport au spectacle,
le modèle d’exploitation
performant est au
service de l’attractivité
du territoire. »
La singularité d’Orléans tient au fait
que l’Aréna accueille un club résident
de basket. Cela structure la vie du
site : bureaux, vestiaires, espaces
d’entraînement, staff médical, salle
de presse… tout est intégré et notre
responsabilité est d’assurer des
conditions optimales pour que le
club se concentre sur sa performance
sportive et son développement
économique.
Concrètement, cela se traduit par
une mécanique d’exploitation très
technique. Enchaîner un match de
basketball, un spectacle, puis un
match de handball nécessite des
reconf igurations rapides car les
parquets sont différents selon les
compétitions, les tribunes doivent
être ajustées, la scène montée et
démontée, les dispositifs lumière
et vidéo doivent être reparamétrés
à ch a q u e fo i s . Ce tte a g i l i té
opérationnelle est devenue un
marqueur de notre modèle. Elle
repose sur des équipes expertes
et engagées capables de répondre
et d'anticiper de fortes exigences
opérationnelles.
En 2023-2024, l’effet nouveauté
et un contexte de compétitions
internationales ont fortement
tiré l’activité sportive. En 2025,
la dynamique s’est normalisée :
moins d’échéances internationales,
davantage de concurrence entre
équipements et une bataille plus
forte pour capter certains matchs.
Nous avons compensé en renforçant
la programmation de spectacles et
en consolidant les recettes associées.
L’exemple le plus emblématique est
l’accueil de la tournée d’Indochine :
six dates à guichets fermés, qui ont
conf irmé la capacité du site à
accueillir des productions majeures.
Parallèlement, l’enjeu a été de
structurer une offre d’hospitalités
à la hauteur de l’équipement : 28
loges, 6 salons, près de 500 places
VIP. Cette montée en puissance
passe par des offres clé en main
pour les entreprises et par une
exploitation fine des espaces, au
service des relations publiques,
de l’événementiel corporate et de
l’expérience spectateur.
Le modèle orléanais repose sur une
coopération étroite avec les acteurs
publics du territoire. La stratégie
se mène ensemble avec une veille
active sur les opportunités, une
mobilisation des réseaux, un soutien
financier lorsque les fédérations
demandent des conditions d’accueil
spécif iques. Cette coordination
est un facteur décisif pour attirer
des événements et maximiser les
retombées locales.
Enfin, l’année 2025 a renforcé des
passerelles opérationnelles au
sein du réseau, notamment sur les
sujets d’hospitalités et de billetterie.
L’objectif est simple : partager
les bonnes pratiques, accélérer
l’apprentissage collectif et consolider,
site par site, un modèle d’exploitation
performant.
GL EVENTS RAPPORT D'ACTIVITÉ 2025 / TEMPS FORTS 2025 GL EVENTS VENUES / 91
Stade de France®
5 AOÛT
Le Stade de France® a rejoint le réseau GL events
Venues dans le cadre d’une concession de 30
ans, renforçant le portefeuille d’infrastructures
majeures du Groupe. Concerts et événements
sportifs ont marqué les premières semaines
d’exploitation, amorçant une nouvelle dynamique
pour ce site emblématique.
GL EVENTS RAPPORT D'ACTIVITÉ 2025 / TEMPS FORTS 2025 GL EVENTS VENUES / 93
SQUARE - BRUXELLES, BELGIQUE
Europe
EUROPE
Belgique
et des délais contraints. Dans le
même esprit, Live.eu a poursuivi
le développement d’une expertise
hors frontières, en accompagnant
des événements et dispositifs en
Afrique et en Amérique latine, et en
confirmant une aptitude à s’adapter
à des environnements variés, souvent
complexes, tout en maintenant une
exigence de qualité et de fiabilité.
« La capacité à exporter
nos savoir-faire est
devenue un levier clé
de performance. »
ARIANE DEGUELLE
CEO GL EVENTS BELGIQUE
Dans un environnement économique
et institutionnel exigeant, marqué
par une pression concurrentielle
forte et une concentration accrue
des grands donneurs d’ordre,
une dynamique s’est néanmoins
imposée comme un marqueur très
positif : la capacité des équipes
belges à exporter leur savoir-faire et
à travailler au-delà de leur marché
domestique, au service de clients
institutionnels comme de projets
internes au Groupe.
Cette “Belgique qui s’exporte”
s’est illustrée à travers plusieurs
opérations menées à l’international.
Les équipes de GL events Belgium
ont notamment contribué à une
part significative des agencements
liés au sommet de l’OTAN à La Haye,
démontrant leur capacité à intervenir
dans des contextes opérationnels
différents, avec des standards élevés
Au-delà de ces missions, l’année
a également été marquée par un
renforcement des collaborations au
sein du Groupe, dans une logique
de mobilité des compétences. Des
opérations ont été conduites avec
le World Forum, mais aussi avec
d’autres implantations comme
Pretoria et Cape Town en Afrique
du Sud, ou encore avec des équipes
historiquement rattachées à Reims,
au service de projets portés par des
institutions européennes. Cette
capacité à mobiliser des expertises
complémentaires, selon les besoins,
constitue un levier concret de
performance et de différenciation :
la prestation belge ne se limite plus
à un périmètre local, elle s’intègre
à un réseau et gagne en impact.
Sur le territoire, l’un des enjeux
majeurs a consisté à consolider
les événements de grande jauge,
en particulier à SQUARE - Brussels.
Dans un équipement de taille
contrainte, la croissance se joue
sur l’excellence opérationnelle et
la capacité à accueillir des formats
ambitieux : des manifestations
autour de 3 000 participants, souvent
institutionnelles, à forte intensité
logistique et exigences de services.
Plusieurs rendez-vous structurants
ont ainsi été confirmés ou reconduits,
traduisant un travail de fond sur
la fidélisation, l’organisation et la
qualité de l’expérience client.
Un autre temps fort a contribué à
renforcer la visibilité des équipes
belges : l’évolution du marché des
contrats-cadres européens. Dans un
contexte de concentration accrue
des appels d’offres institutionnels,
GL events Belgium s’est positionnée
sur des dispositifs structurants,
illustrant sa capacité à opérer sur des
volumes significatifs et à s’inscrire
dans des organisations complexes,
en lien étroit avec les expertises
du Groupe.
Cette dynamique s’est accompagnée,
dès 2025, d’un travail de fond sur
la consolidation et la projection
des activités. Le lancement d’un
programme d’embellissement
et d’équipement des espaces à
SQUARE - Brussels, le renforcement
des partenariats avec les acteurs
voisins et la poursuite de l’exportation
des savoir-faire belges ont posé les
bases d’un développement plus
transversal. GL events Belgium
affirme ainsi un positionnement clair :
un ancrage local solide, combiné à
une capacité accrue à contribuer
à des projets internationaux, au
service des clients institutionnels
et des ambitions du Groupe.
GL EVENTS RAPPORT D'ACTIVITÉ 2025 / UN GROUPE INTERNATIONAL / 95
EUROPE
Royaume-Uni
SCOTT JAMESON
DIRECTEUR GÉNÉRAL
GL EVENTS UK
« Dans un marché
exigeant, 2025 nous
a permis de consolider
nos fondamentaux et
de sécuriser des
contrats structurants
qui préparent l’avenir. »
Un marché sous pression,
une année de consolidation
En 2025, l’activité de GL events UK s’est
déployée dans un environnement
particulièrement exigeant. L’année n’a
pas bénéficié de l’effet d’entraînement
d’un grand événement international
comparable aux cycles précédents,
ce qui a mécaniquement réduit les
opportunités à forte visibilité. Dans le
même temps, le contexte économique
britannique a évolué avec l’entrée
en vigueur de nouvelles mesures
fiscales et sociales, entraînant une
hausse significative des charges et
du coût du travail.
Ces évolutions ont eu un impact
direct sur les clients du secteur de
l’hospitalité et de l’événementiel,
confrontés à une augmentation de
leurs coûts sans toujours pouvoir
ajuster leurs propres tarifs. La pression
sur les prix s’est accentuée, chaque
projet étant plus disputé. Par ailleurs,
de nombreux contrats conclus à la
sortie de la période post-COVID sont
arrivés à échéance, faisant de 2025 une
année dense en renouvellements et
en mises en concurrence.
Dans ce contexte, GL events UK a
dû renforcer son positionnement
et affirmer sa différenciation, dans
un marché où la demande tend à se
polariser entre offres très premium
et solutions à bas coût. Cependant,
l’année a permis de consolider les
fondamentaux et de préparer les
cycles suivants.
Des contrats de long terme
qui sécurisent l’avenir
Si 2025 n’a pas été portée par un
événement vitrine, elle a en revanche
permis de sécuriser plusieurs contrats
pluriannuels significatifs. Le projet de
tribune de 16 000 places à Silverstone,
surnommé « Lando Stand », constitue
à ce titre un jalon majeur. Conclu
pour neuf ans, il illustre la capacité
des équipes à s’inscrire dans des
partenariats de long terme sur
des sites emblématiques du sport
britannique.
Dans la même dynamique, GL events
UK a renouvelé son engagement
auprès du RHS Chelsea Flower Show
pour une durée de cinq ans à compter
de 2026, conf irmant sa position
sur l’un des rendez-vous les plus
prestigieux du calendrier britannique.
Un accord de cinq ans a également
été conclu avec The R&A pour The
Open Championship, représentant
chaque année un volume significatif
de tribunes déployées sur différents
sites.
Parallèlement, Flow a consolidé sa
présence sur le marché des festivals
et de l’énergie temporaire, Field and
Lawn a livré plusieurs installations
remarquées, tandis qu’Xpect a
maintenu une activité soutenue
dans la location de mobilier pour
les expositions au Royaume-Uni
et en Europe, et que les équipes
Stadia ont accompagné plusieurs
clubs majeurs dans l’évolution de
leurs infrastructures. Les activités
industrielles ont également confirmé
leur capacité à intervenir sur des
projets liés aux enjeux de transition
énergétique.
Cette diversification des expertises
constitue un atout déterminant
dans un marché tendu. Elle permet
de lisser les cycles, de renforcer la
complémentarité entre métiers et
d’offrir aux clients une réponse globale
et intégrée.
GL EVENTS RAPPORT D'ACTIVITÉ 2025 / UN GROUPE INTERNATIONAL / 96
CHELTENHAM FESTIVAL - ROYAUME-UNI
INTERNATIONAL
Une base européenne solide,
tournée vers l’adaptation
Le Royaume-Uni reste un marché
exigeant, mais structurant pour le
Groupe. Il combine une forte maturité
événementielle, une concentration
d’acteurs internationaux et une
culture contractuelle très compétitive.
Cette exposition permanente à un
environnement concurrentiel dense
oblige les équipes à maintenir un haut
niveau d’exigence opérationnelle, de
rigueur contractuelle et de réactivité
commerciale.
En 2025, l’enjeu principal n’a pas
été l’expansion spectaculaire, mais
l’adaptation. Adapter l’offre à un
marché qui se polarise, renforcer
les partenariats locaux pour sécuriser
l’exécution des projets, ajuster les
modèles économiques face à la
pression sur les marges et poursuivre
la réflexion sur le développement
de nouvelles opportunités, notam
ment dans la gestion de sites et
l’événementiel corporate.
Les synergies internationales jouent
un rôle d’appui plus qu’un levier
direct. La filiale britannique mobilise
régulièrement des expertises issues
d’autres entités du Groupe pour
répondre à certains appels d’offres
ou structurer des réponses techniques
complexes. Cette capacité à s’appuyer
sur un réseau global constitue un
avantage dans un marché où la
crédibilité opérationnelle et la maîtrise
réglementaire sont déterminantes.
Sur le plan humain, l’année 2025 a
été marquée par un symbole fort
de fidélité et d’engagement : trois
collaborateurs ont célébré quarante
années d’ancienneté au sein de
l’entreprise. Cet attachement de long
terme illustre la solidité de la culture
interne et la capacité à construire des
parcours durables, notamment à
travers les programmes de formation
et de développement permettant
d’accompagner les équipes dans un
environnement en mutation.
Les actions RSE se sont inscrites
dans la continuité, avec des initiatives
locales et des engagements
communautaires, notamment dans
le soutien au sport et à des actions
environnementales de proximité.
Dans un marché sous pression, la
sécurisation de contrats pluriannuels,
la solidité des équipes et la préparation
active des échéances futures
constituent un socle robuste pour
aborder les prochaines années avec
lucidité et ambition.
GL EVENTS RAPPORT D'ACTIVITÉ 2025 / UN GROUPE INTERNATIONAL / 97
EUROPE
Hongrie, Italie
GABOR GANCZER
DIRECTEUR GÉNÉRAL HUNGEXPO
& LINGOTTO FIERE
« L’année 2025 confirme
la montée en puissance
des activités du Groupe
en Europe centrale
et méridionale,
avec deux trajectoires
complémentaires à
Budapest et à Turin.
Dans des contextes
économiques et
politiques distincts,
les deux sites illustrent
la capacité d’adaptation
et d’accélération du
modèle GL events. »
Hongrie : une année record
portée par une diversification
stratégique de Hungexpo
À Budapest, 2025 s'est soldée par
un record. Hungexpo a atteint
ses plus hauts niveaux en chiffre
d’affaires et compte désormais plus
de 110 collaborateurs, reflet d’un
développement soutenu et d’un
renforcement des compétences
locales. Derrière cette performance
d’ensemble se cache toutefois
une situation nuancée. Les mani
festations organisées restent
exposées à la conjoncture hongroise,
particulièrement tendue dans les
secteurs de l’agriculture, de la
construction et de l’industrie. Ces
f ragilités ont pesé sur certains
événements propriétaires.
La dynamique a été compensée
par une forte croissance des
activités accueillies et, surtout, par
le développement spectaculaire de
l’activité studios. Lancé pendant la
période Covid, le Movie Studio est
devenu un pilier stratégique. En
2025, il a accueilli plusieurs tournages
internationaux d’envergure. Si certains
contrats restent confidentiels à ce
stade, ils positionnent Budapest
comme une plateforme hybride,
capable d’accueillir à la fois salons,
congrès et grandes productions
audiovisuelles. Cette diversification
renforce la résilience du modèle face
aux cycles économiques sectoriels.
Sur le plan environnemental,
Hungexpo a f ranchi une étape
structurante. Depuis 2025, le site
fonctionne exclusivement à l’énergie
verte. Une contribution spécifique
à la durabilité est assumée par les
exposants, permettant de financer
une partie des actions engagées.
Le tri sélectif est désormais géné
ralisé et rendu obligatoire sur
les manifestations accueillies,
y compris pour les productions
audiovisuelles. Ces choix impliquent
des coûts supplémentaires, mais ils
traduisent une montée en maturité
environnementale cohérente avec
les engagements du Groupe.
Derrière cette activité en plein essor
se trouvent des équipes hongroises
expertes et engagées. Pour rester
à la pointe des évolutions de leur
métier, elles bénéficient d’un plan
de formation visant à s’approprier les
nouvelles technologies et améliorer
les pratiques tout en grandissant au
sein de l’entreprise.
Turin : l'année de l'accélération
et du redressement confirmé
pour le Lingotto Fiere
À Turin, 2025 s’inscrit dans une
dynamique d’accélération confirmée.
Depuis la reprise du Lingotto Fiere,
l'activité a quasiment doublé, avec
une trajectoire qui rapproche le
site de son point d’équilibre.
Cette progression valide les choix
stratégiques engagés et peut être
considérée comme un véritable
tournant dans le redressement du
site, qui aspire toujours à bénéficier
d’un soutien plus important des
acteurs publics.
Le développement commercial
s’appuie à la fois sur la hausse des
manifestations accueillies et sur le
lancement du projet Lingotto Studios,
inspiré de l’expérience hongroise. En
2025, une série internationale tournée
à Turin a ouvert un nouveau relais
de croissance pour le site.
GL EVENTS RAPPORT D'ACTIVITÉ 2025 / UN GROUPE INTERNATIONAL / 98
HUNGEXPO - BUDAPEST, HONGRIE
Parallèlement, un programme
d’investissements conséquent a
été engagé, portant en priorité
sur la sécurité et la conformité des
infrastructures. La modernisation
esthétique du site reste à venir et
conditionnée à la poursuite de la
croissance économique.
Un autre marqueur fort de 2025
réside dans l’évolution des relations
institutionnelles. Après une période
initiale tendue, le dialogue avec la
Ville et les autorités locales s’est
considérablement renforcé. Le site
est désormais identifié comme un
outil structurant de la vie économique
turinoise. L’implication du Groupe
dans les Jeux olympiques et
paralympiques de Milan Cortina
a renforcé cette reconnaissance,
positionnant GL events comme
partenaire stratégique sur les grands
dossiers internationaux. Cette visibilité
contribue à consolider la place du
Lingotto dans l’écosystème local et
à ouvrir des perspectives pour de
futurs projets.
Enfin, la structuration interne a été un
axe prioritaire à Turin. L’introduction du
smart working et le renouvellement
des équipements témoignent d’une
volonté d’améliorer le cadre de
travail et d’ancrer durablement la
performance.
GL EVENTS RAPPORT D'ACTIVITÉ 2025 / UN GROUPE INTERNATIONAL / 99
EUROPE
Pays-Bas
Un sommet comme accélérateur
durable
L’accueil du Sommet de l’OTAN a
constitué un moment charnière pour
le World Forum The Hague et, plus
largement, pour GL events aux PaysBas. Dans une ville déjà reconnue
comme la ville internationale de
la paix et la justice, l’événement
a conf irmé la cohérence d’un
positionnement construit de longue
date autour des organisations
internationales, des institutions
juridiques, des ONG et des entreprises
de cybersécurité.
MICHIEL MIDDENDORF
DIRECTEUR GÉNÉRAL WORLD
FORUM THE HAGUE
Au-delà de la dimension protocolaire,
le Sommet a représenté le plus grand
projet jamais réalisé par le World
Forum. Il a démontré, de façon
très concrète, la capacité du site
à opérer à un niveau d’exigence
digne des plus grands rendez-vous
internationaux. Cette réussite tient
autant à la mobilisation locale qu’à
l’appartenance au groupe GL events.
L’ensemble des expertises du
Groupe a été sollicité. Les équipes
de GL events Live en Belgique ont
assuré une large part des finitions et
des montages, tandis que GL events
Audiovisual & Power, en France, a
piloté une distribution électrique
particulièrement complexe. Les
experts cybersécurité du Groupe
ont accompagné la préparation
numérique de l’événement, enjeu
critique pour un sommet de cette
nature. Les fonctions compliance
et finance ont apporté un cadre
méthodologique et un pilotage
renforcé pour un projet d’une
ampleur inédite pour le site. Cette
capacité à mobiliser rapidement
des ressources internationales a
constitué un facteur déterminant
de sécurisation et d’efficacité. Elle
a également renforcé le sentiment
d’appartenance des équipes locales
à un ensemble structuré, capable
d’intervenir sur tous les volets
critiques d’un événement de cette
envergure. Cette coopération a
permis aux équipes du World Forum,
positionnées comme gestionnaires
de site, de proposer des solutions
complètes.
Un héritage tangible pour la ville
et le site
L’impact du Sommet dépasse
largement la période de l’événement.
Sur le plan des inf rastructures,
l’installation de 14 000 m² d’espaces
temporaires a été l’occasion de
faire un choix structurant avec
la création d’une nouvelle ligne
électrique. Réalisé en huit mois,
un délai exceptionnel pour ce type
d’infrastructures, ce raccordement
permet aujourd’hui d’éviter le recours
aux générateurs pour les grands
événements à venir. L’investissement
bénéficie durablement au site et
renforce son niveau d’exigence
environnementale.
L’inf rastructure numérique a
également été profondément
renforcée, avec une montée en
puissance signif icative de la
connectivité en fibre optique. Ce
socle technologique place désormais
le World Forum à un niveau de
performance adapté aux congrès
internationaux les plus exigeants.
Sur le plan institutionnel, le Sommet
a agi comme un catalyseur. La Ville
de La Haye a engagé une réflexion
à long terme sur le rôle du World
Forum dans le profil international
de la destination. Un groupe projet
travaille désormais sur un horizon
de quarante à cinquante ans, avec
l’identification des investissements
GL EVENTS RAPPORT D'ACTIVITÉ 2025 / UN GROUPE INTERNATIONAL / 100
SOMMET DE L'OTAN - LA HAYE, PAYS-BAS
nécessaires pour moderniser et
adapter le site aux exigences futures,
laissant entrevoir une transformation
ambitieuse, en cohérence avec
l’ambition internationale de la ville.
Marque, attractivité et
dynamique internationale
Le Sommet a profondément renforcé
la perception du World Forum dans
son écosystème. L’établissement est
désormais identifié comme un acteur
de référence capable d’accueillir des
événements de niveau international
stratégique. Cette reconnaissance a
consolidé la relation avec la Ville de
La Haye et conforté le rôle du site
dans le dispositif international de
la destination.
Le travail mené dès l'amont avec les
parties prenantes locales a permis
de transformer un événement
générateur de contraintes en levier
de fierté et de cohésion territoriale
durable.
Pour les équipes, l’événement a
constitué un moment de forte
mobilisation et de fierté collective.
Il a également renforcé l’attractivité
du site auprès des talents. La nouvelle
génération de collaborateurs exprime
une attente croissante de travailler
sur des projets porteurs de sens.
L’ancrage du World Forum dans des
thématiques liées à la paix, à la justice,
à la coopération internationale ou à
l’innovation en matière de sécurité
contribue à nourrir cette dynamique.
Commercialement, les retombées
se sont matérialisées rapidement.
Quelques mois après le Sommet,
le World Forum a accueilli la
première édition du European
Defense Innovation Forum, illustrant
l’émergence de nouveaux formats liés
aux enjeux stratégiques européens. La
dynamique post-OTAN a également
réactivé l’intérêt de comptes
nationaux et renforcé l’attractivité du
site auprès d’entreprises souhaitant
s’associer à l’image de La Haye.
GL EVENTS RAPPORT D'ACTIVITÉ 2025 / UN GROUPE INTERNATIONAL / 101
SOMMET DE L'OTAN - LA HAYE, PAYS-BAS
GL EVENTS RAPPORT D'ACTIVITÉ 2025 / UN GROUPE INTERNATIONAL / 103
GL EVENTS EXHIBITIONS
GL events
Exhibitions
Un acteur de
référence proche
des communautés
Transition écologique &
énergétique
9%
Santé & beauté
16 %
Divers 3 %
Agriculture,
pêche & mines
5%
Culture,
diverstissement &
foires 7 %
Mode 18 %
Food and hospitality
19 %
Habitat &
immobilier 4 %
% du CA 2025 par filière
GL EVENTS RAPPORT D'ACTIVITÉ 2025 / GL EVENTS, SES MÉTIERS / 104
Industrie 19 %
GL EVENTS EXHIBITIONS
150
événements propriétaires
(salons, congrès, compétitions)
19 950
congressistes
720
collaborateurs
27 583
exposants
238,1
M€
de chiffre d'affaires
5
salons dédiés à
la transition énergétique
et écologique organisés
1 815 297
visiteurs
GL EVENTS RAPPORT D'ACTIVITÉ 2025 / GL EVENTS, SES MÉTIERS / 105
PARIS GAMES WEEK - PARIS, FRANCE
GL EVENTS EXHIBITIONS
« Au-delà de leur rôle de marketplace,
nos événements s’imposent comme
des lieux de référence de contenus
à valeur ajoutée, où se rassemblent
les communautés et se dessinent
les transformations des filières. »
DAMIEN TIMPERIO
PRÉSIDENT DIRECTEUR GÉNÉRAL GL EVENTS EXHIBITIONS
L’année 2025 a permis à GL events Exhibitions de poursuivre
sa trajectoire de développement tout en préparant l’avenir.
Le pôle a pleinement bénéficié d’une biennalité favorable
et de la prime au leader dont il bénéficie sur ses marchés.
Cette dynamique a permis de consolider ses rendez-vous
structurants, tout en engageant activement les évolutions
nécessaires à la transformation du métier. Dans un contexte
économique parfois incertain pour les filières, ces résultats
témoignent de la solidité du modèle et de la pertinence
des orientations stratégiques engagées.
Dynamique et performance des salons en France
Le début d’année a été porté par une édition particulièrement
réussie de Sirha Lyon qui confirme son rôle de locomotive
pour l’ensemble de la division food. Cette performance valide
les investissements réalisés et conforte les développements
régionaux à venir, notamment avec Smahrt Toulouse
et Sirha Méditerranée à Marseille. D’autres événements
majeurs ont également confirmé leur trajectoire : Global
Industrie a signé une belle édition lyonnaise tandis que
Piscine Global a poursuivi sa dynamique et que Première
Vision, malgré les tensions persistantes dans les secteurs
du textile et de la mode, parvient à se stabiliser en volume,
en fréquentation et en performance économique. Ces
indicateurs positifs valident la transformation engagée,
positionnant Première Vision comme un salon de solutions
au service des entreprises de la filière.
Développement stratégique avec la filière santé
et la Pop Culture
L’année 2025 a également été marquée par l’organisation du
salon SantExpo, une étape clé de la construction de la division
santé Health & Science. La première édition, organisée par
les équipes de la division, a dépassé les attentes, tant sur le
plan des contenus que de la fréquentation et des résultats
financiers. Elle confirme l’intérêt stratégique de structurer
une division santé, appelée à se développer durablement.
Sur le segment BtoC, 2025 a été marquée par la co-organisation
de la Paris Games Week. Cette reprise rapide d’un événement
emblématique, repositionné dans une trajectoire positive
dès sa première édition, illustre la capacité des équipes
à intervenir efficacement sur des formats grand public.
Elle ouvre la voie à la structuration d’une division dédiée
à la pop culture, dont les premiers déploiements seront à
prévoir dès 2026.
Expansion internationale et synergies des marques
À l’international, la dynamique reste soutenue et différenciée
selon les zones. Au Chili, Expomin a signé une édition
exceptionnelle, confirmant la pertinence du développement
de GL events Exhibitions dans le pays, avec l’intégration
de nouveaux événements, dont un salon majeur dédié au
food service en lien étroit avec la division Sirha Food. Cette
complémentarité renforce la logique d’internationalisation
de nos marques fortes, amorcée notamment avec Sirha
Arabia et les concours internationaux comme le Bocuse d’Or.
GL EVENTS RAPPORT D'ACTIVITÉ 2025 / GL EVENTS, SES MÉTIERS / 107
GL EVENTS EXHIBITIONS
En Arabie saoudite, la deuxième édition de Sirha Arabia reste
encourageante. Le renforcement des équipes locales et la
structuration progressive de GL events Saudi confirment
la pertinence de poursuivre notre développement dans
la région.
En Asie, la dynamique de Tranoï au Japon est particulièrement
notable, avec une croissance de près de 50 % et deux
éditions organisées en 2025. Cette réussite valide la stratégie
d’ancrage à Tokyo et ouvre la voie à l’introduction de nos
produits notamment dans l’univers du Denim dès 2026.
Au Brésil, la Biennale du livre de Rio a démontré la capacité
de GL events Exhibitions à faire évoluer des événements
matures vers des formats plus expérientiels, proches du
festival, dans un contexte où les salons traditionnels du
livre peinent à se renouveler.
Parallèlement en Chine, le contexte reste plus complexe,
notamment pour les secteurs de la mode et de la construction.
Les équipes demeurent mobilisées pour adapter les formats,
tandis que la filière santé, portée par CACLP, se maintient
après plusieurs années de forte croissance.
Transformation structurelle vers un modèle axé
sur le contenu
Au-delà des événements eux-mêmes, 2025 marque une
évolution plus structurelle de notre métier. Longtemps
centrés sur la commercialisation de mètres carrés, les
salons évoluent vers des rendez-vous clés pour les filières
qu’ils rassemblent. Ils deviennent des plateformes où se
rencontrent innovation, expertise et prospective, à travers
des contenus à forte valeur ajoutée et des temps forts
structurants pour les industries.
Cette transformation permet de faire évoluer le modèle
économique des événements : en diversifiant les sources
de revenus et en développant de nouveaux formats de
partenariat et de collaboration avec les acteurs institutionnels,
économiques et financiers intéressés par les dynamiques
sectorielles et les données produites par nos événements.
Cette mutation s’accompagne d’une évolution de l’organisation.
La création de fonctions transverses, notamment la Direction
des Partenariats, vise à accompagner les divisions dans la
valorisation de leurs contenus et à développer des offres multiévénements, en France comme à l’international. Parallèlement,
le pôle intègre progressivement l’intelligence artificielle dans
les métiers, encadrée par le comité IA du Groupe.
Les enjeux RSE ont connu en 2025 une montée en puissance
significative. Mais l’ambition va au-delà de l’impact direct
des événements. Le pôle accompagne désormais les
filières qu’elle soutient dans leurs propres transitions. La
RSE devient un levier structurant des salons et congrès,
positionnés comme des espaces de réflexion, de solutions
et de projection pour les industries.
Fort des transformations engagées et des succès rencontrés
en 2025, GL events Exhibitions aborde l’année 2026 avec une
ambition claire : consolider ses nouvelles divisions et accélérer
sa mutation en plateforme de contenu. La transformation
structurelle devrait permettre d’enrichir l'expérience exposantsvisiteurs et de capitaliser sur l’expertise comme nouvelle
source de revenus. Enfin, le développement international
restera un axe majeur, en renforçant les synergies entre les
marques fortes du Groupe. Ainsi, 2026 s'annonce comme
une année importante pour confirmer le rôle de GL events
Exhibitions en tant que partenaire stratégique, moteur de
la performance et de la transition des filières.
GL EVENTS RAPPORT D'ACTIVITÉ 2025 / GL EVENTS, SES MÉTIERS / 108
Paysalia & Rocalia 2025
DU 2 AU 4 DÉCEMBRE
En décembre 2025, Paysalia et Rocalia, salons majeurs
des secteurs du paysage et de la pierre naturelle,
ont réuni la filière à Eurexpo Lyon autour d’enjeux
d’innovation, de durabilité et de transmission.
L’expérience immersive a inclus plus de 100
conférences, concours et espaces de formation,
consolidant ces salons comme des rendez-vous
incontournables du secteur.
GL EVENTS RAPPORT D'ACTIVITÉ 2025 / TEMPS FORTS 2025 GL EVENTS EXHIBITIONS / 109
Expomin
DU 22 AU 26 AVRIL
Organisée par FISA, filiale de GL events au Chili, Expomin a été
distinguée par le ministère chilien de l’environnement dans
le cadre du programme HuellaChile pour son engagement
en matière de durabilité. La plus grande foire minière
d’Amérique latine, qui a réuni plus de 83 000 visiteurs et 1 372
exposants, a mis en œuvre un dispositif complet de mesure
et de réduction de son empreinte carbone : plan de mobilité
durable, installations d’énergie solaire, programme de recyclage
et sensibilisation des participants. Cette reconnaissance
souligne l’ambition de GL events d’inscrire la transition
environnementale au cœur de ses grands événements
internationaux.
GL EVENTS RAPPORT D'ACTIVITÉ 2025 / TEMPS FORTS 2025 GL EVENTS EXHIBITIONS / 110
GL EVENTS EXHIBITIONS
Industrie ou la Biennale du Livre de
Rio ; événements matures nécessitant
une optimisation particulière ou
encore segments plus f ragiles,
notamment en BtoC ou sur certains
marchés internationaux qualifiés
de tendus. L’enjeu a été d’adapter
le pilotage à chaque typologie tout
en garantissant un équilibre global
entre rentabilité et développement.
DELPHINE GAILLOT
DIRECTRICE FINANCE ET
ADMINISTRATION EXHIBITIONS
« Dans un environnement
à la fois porteur
et plus exigeant,
la direction finance et
administration a joué
un rôle structurant. »
Si la biennalité favorable de certains
grands rendez-vous a soutenu la
dynamique du pôle Exhibitions, le
contexte économique et géopolitique,
plus instable sur certaines zones et
filières, a renforcé la nécessité d’un
pilotage rigoureux et différencié.
La première priorité a été d’assurer
un monitoring précis et régulier fin
de la performance des événements.
La finance a accompagné les équipes
opérationnelles dans l’analyse du
mix produits, des niveaux de prix
et des structures de coûts, en
tenant compte de la diversité des
situations : événements en forte
croissance comme Sirha Lyon, Global
Au-delà du suivi opérationnel, 2025 a
été marquée par un accompagnement
actif des mouvements de portefeuille
et des projets de développement.
Intégrations, acquisitions ciblées,
joint-ventures et co-organisations
ont rythmé l’année. Pour chaque
opération, qu’il s’agisse d’intégrations
en Europe du Nord, en Amérique
latine ou en Asie, de la structuration
de partenariats dans le food service
à la reprise en gestion d’événements
comme Paris Games Week, la finance
a contribué à la préparation des
business plans, à l'identification des
axes potentiels d'amélioration de la
profitabilité et à l’intégration rapide
dans les standards financiers du
Groupe.
Cette dynamique s’inscrit dans
l’évolution plus large du modèle
du pôle Exhibitions. Les salons ne
se déploient plus uniquement selon
un modèle propriétaire classique
mais s’appuient de plus en plus
sur des logiques de coproduction
et de partenariats, en particulier à
l’international. La finance intervient
alors très en amont pour structurer les
équilibres économiques, formaliser
les schémas contractuels et sécuriser
la création de valeur dans des
environnements multipartites. Ce
rôle de business partner s’est renforcé,
en lien étroit avec les équipes
opérationnelles et les nouvelles
fonctions transverses dédiées aux
partenariats et à la valorisation des
contenus des événements.
Dans un contexte de tensions accrues
sur certains marchés, la préservation
de la trésorerie a également
représenté un objectif majeur. Les
difficultés ponctuelles rencontrées
par certains clients ou prestataires
ont nécessité un suivi renforcé
des encaissements et une gestion
opérationnelle dédiée. L’objectif a été
de sécuriser les flux du pôle tout en
maintenant des relations équilibrées
avec les partenaires stratégiques.
Cette vigilance s’inscrit pleinement
dans la discipline financière globale
du Groupe et dans la recherche d’une
création de valeur durable.
Depuis plusieurs années, les
équipes f inance sont fortement
impliquées dans la digitalisation
des parcours exposants et
partenaires : dématérialisation
des contrats, commandes et
paiements en ligne, pour une totale
intégration du flux Order to Cash
dans les systèmes du Groupe. Les
synergies de travail au quotidien entre
équipes digitale et finance illustrent
cette modernisation des pratiques
administratives et financières.
Enf in, 2025 a été une année clé
de préparation à la réforme de la
facturation électronique. Anticipé
dès 2023, ce chantier mobilise la
f inance, l’IT et les opérationnels
autour d’un objectif commun :
sécuriser la conformité réglementaire
tout en simplifiant et harmonisant
les processus internes. Au-delà de
l’obligation légale, cette réforme
est abordée comme un levier
d’optimisation et de clarification
des rôles au sein des équipes.
GL EVENTS RAPPORT D'ACTIVITÉ 2025 / TEMPS FORTS 2025 GL EVENTS EXHIBITIONS / 111
Bienal do livro Rio
DU 12 AU 22 JUIN
La Bienal do Livro Rio 2025 a confirmé son rôle majeur
dans la vie culturelle brésilienne. Dans une ville qui s’est
vue décerner le statut de Capitale mondiale du livre par
l’UNESCO, l’événement a réuni 740 000 visiteurs, 1 850
auteurs et permis la vente de 6,8 millions d’ouvrages.
Transformé en véritable « Book Park », le Riocentro
a accueilli rencontres, expériences immersives et
programmes éducatifs, illustrant la capacité de GL events
à concevoir des événements culturels d’envergure et à
contribuer au rayonnement des filières et des territoires.
GL EVENTS RAPPORT D'ACTIVITÉ 2025 / TEMPS FORTS 2025 GL EVENTS EXHIBITIONS / 113
GL EVENTS EXHIBITIONS
JÉRÔME SECCHI
DIRECTEUR ACTIVITÉS CONGRÈS
& SANTÉ
« La création de la
division santé baptisée
Health & Science marque
une étape structurante
avec une organisation
dédiée, dotée d’une
identité propre et
d’une stratégie de
croissance claire. »
Cette structuration est le résultat de
plusieurs dynamiques convergentes :
-
La montée en puissance significative
des congrès médicaux, activité
historique du Groupe,
-
L’organisation pendant 5 éditions
de SantExpo, événement majeur
de la filière hospitalière et médicosociale qui rassemble près de 35 000
visiteurs et génère un volume
d’activité significatif,
-
Une première opération de croissance
externe ciblée avec l’intégration de
la société montpelliéraine B4 Event,
spécialisée dans les événements santé,
notamment en gériatrie.
-
Le troisième pilier est celui du
Medical Education. Cette activité,
menée en partenariat avec des
laboratoires pharmaceutiques et
des leaders d’opinion clés (KOL),
repose sur la création et l’animation
de communautés médicales
spécialisées, autour de marques telles
que Synergie Parcours de soins ou
Synergie Résistance. Dans ce cadre,
GL events intervient pleinement
comme créateur et orchestrateur
de contenus, en structurant des
lignes éditoriales et en valorisant les
productions scientifiques auprès des
communautés concernées.
Health & Science repose aujourd’hui
sur trois métiers complémentaires :
- Le premier est celui des salons,
avec SantExpo comme locomotive.
Véritable plateforme fédératrice, ce
rendez-vous rassemble dirigeants
d’hôpitaux, directions médicales,
DSI, directions juridiques, institutions
publiques, éditeurs de logiciels,
acteurs de la logistique et industriels
du dispositif médical. Il constitue un
espace stratégique d’échanges sur
l’organisation des soins, l’innovation
et l’impact de l’intelligence artificielle
dans les établissements de santé.
Plus encore que pour d’autres
filières, le secteur santé accorde
une place centrale au contenu. Dans
un congrès médical, le programme
scientifique est le moteur principal de
la participation. Les communications
sont évaluées par des comités
scientif iques, selon des critères
stricts de qualité académique.
L’éditorialisation, la gestion des droits
d’exploitation et la valorisation des
travaux présentés constituent ainsi
des savoir-faire clés.
- Le deuxième pilier est l’activité
congrès, structurée autour de
contrats pluriannuels avec des
sociétés savantes. L’année 2025
a d’ailleurs été marquée par des
premières éditions significatives,
notamment l’organisation de
3CVD, premier congrès commun
des sociétés savantes françaises
de chirurgie digestive, ainsi que du
congrès européen SECEC dédié
à la chirurgie de l’épaule et du
coude. Ces opérations illustrent
la capacité du Groupe à gérer des
dispositifs scientifiques exigeants,
dans des domaines variés tels
que l’ophtalmologie, la chirurgie,
l’orthopédie, l’infectiologie, la
cardiologie, la dermatologie ou
encore l’oncologie, pour lesquels la
qualité des contenus constitue le
critère central d’attractivité.
En parallèle, la division s’inscrit dans
une logique de transversalité accrue
avec les autres entités du Groupe. Les
expertises digitales et data ont permis
de construire une base de données
santé, désormais considérée comme
un actif stratégique. Des synergies
sont également développées avec
le réseau des sites GL events Venues,
certains congrès se tenant dans des
sites gérés par le Groupe ou faisant
l’objet d’appels à destination au sein
du réseau.
À l’issue de 2025, Health & Science
s’affirme comme une division à part
entière, capable d’organiser salons,
congrès et opérations de Medical
Education. Cette triple compétence,
rare sur le marché, constitue un levier
différenciant pour accompagner
durablement la transformation des
filières santé et scientifiques, en
France comme à l’international.
GL EVENTS RAPPORT D'ACTIVITÉ 2025 / TEMPS FORTS 2025 GL EVENTS EXHIBITIONS / 114
SANTEXPO
DU 20 AU 22 MAI
Organisé par GL events Exhibitions en partenariat
avec la Fédération hospitalière de France, SantExpo
a réuni plus de 35 000 participants et plus de 700
exposants autour des grandes transformations du
système de santé. Avec 530 intervenants et plus de
230 prises de parole, le salon a abordé les enjeux
majeurs du secteur : innovation technologique,
prévention, santé des femmes, transition écologique
et vieillissement de la population.
GL EVENTS RAPPORT D'ACTIVITÉ 2025 / TEMPS FORTS 2025 GL EVENTS EXHIBITIONS / 115
SIRHA Lyon
DU 23 AU 27 JANVIER
Pour sa 22e édition, Sirha Lyon confirme son statut
de rendez-vous mondial de la restauration, de
l’hospitalité et du food service. Organisé à Eurexpo
Lyon, le salon a réuni plus de 200 000 professionnels
et 2 300 exposants sur 140 000 m². Cet événement
emblématique témoigne de la complémentarité
des savoir-faire du Groupe.
GL EVENTS RAPPORT D'ACTIVITÉ 2025 / TEMPS FORTS 2025 GL EVENTS EXHIBITIONS / 116
Paris Games Week
DU 30 OCTOBRE AU 2 NOVEMBRE
GL events Exhibitions rejoint l’organisation de la Paris
Games Week en tant que co-producteur aux côtés
du SELL et de Fimalac Entertainment, marquant
une nouvelle étape pour le rendez-vous majeur du
jeu vidéo en France. Cette édition 2025 propose une
expérience renouvelée, plus immersive et festive, avec
notamment une grande scène installée au Dôme
de Paris dédiée aux compétitions eSport, concerts
et rencontres avec les créateurs de contenus. Avec
de nouveaux espaces dédiés aux professionnels, aux
familles et à la création européenne, l’événement
confirme son rôle de plateforme de référence pour
l’écosystème du gaming.
GL EVENTS RAPPORT D'ACTIVITÉ 2025 / TEMPS FORTS 2025 GL EVENTS EXHIBITIONS / 117
Global Industrie
DU 11 AU 14 MARS
Rendez-vous majeur de l’écosystème industriel, Global
Industrie a rassemblé à Eurexpo Lyon plus de 50 000
professionnels et 2 500 exposants. Le salon met en lumière
les innovations et savoir-faire qui façonnent l’industrie de
demain à travers des démonstrations technologiques,
des conférences et rencontres d’experts. L’édition 2025
a également été marquée par le lancement de La
Grande Consultation de l’Industrie, une enquête menée
avec Ipsos auprès de 50 000 décideurs industriels afin
d’identifier les grandes tendances du secteur et d’éclairer
ses évolutions futures.
GL EVENTS RAPPORT D'ACTIVITÉ 2025 / TEMPS FORTS 2025 GL EVENTS EXHIBITIONS / 119
Foire de Lyon
DU 4 AU 14 AVRIL
Pour sa 105e édition, la Foire de Lyon a rassemblé près de 850
exposants autour du thème fédérateur de la Pop Culture. Ce
rendez-vous incontournable du grand public a proposé une
programmation riche mêlant innovations, artisanat, gastronomie,
e-sport et animations familiales. Au cœur de l’événement, le
Quartier des Gones a mis à l’honneur les savoir-faire lyonnais
et les acteurs du territoire. Fidèle à son engagement, la Foire
de Lyon a également poursuivi ses actions en faveur d’une
organisation plus responsable, intégrant une démarche RSE
à chaque édition.
GL EVENTS RAPPORT D'ACTIVITÉ 2025 / TEMPS FORTS 2025 GL EVENTS EXHIBITIONS / 120
Estetika
DU 30 JUILLET AU 2 AOÛT
Estetika s’impose comme l’un des principaux rendezvous de l’esthétique et du bien-être en Amérique
latine. L’événement a réuni plus de 27 000 visiteurs
et 200 marques sur plus de 13 000 m² d’exposition.
Associé au Congrès Scientifique International de
l’Esthétique, le salon propose un programme riche de
conférences, symposiums et ateliers animés par plus
de 150 experts. Pendant quatre jours, professionnels
de la beauté, de la santé et du bien-être se retrouvent
pour découvrir les dernières innovations du secteur
et échanger autour des évolutions du marché.
GL EVENTS RAPPORT D'ACTIVITÉ 2025 / TEMPS FORTS 2025 GL EVENTS EXHIBITIONS / 121
Première Vision Paris
DU 11 AU 13 FÉVRIER
Rendez-vous international de référence pour les
professionnels de la mode, Première Vision Paris
a réuni près de 30 000 visiteurs issus de 126 pays
et 1 100 exposants venus d’une quarantaine de
pays. Le salon a mis à l’honneur les savoir-faire et
les innovations textiles qui façonnent l’avenir de
l’industrie. Conférences, rencontres d’affaires et
outils digitaux dédiés au networking ont rythmé
cette édition, marquée notamment par l’annonce
du lancement de l’Observatoire International de la
Création, destiné à analyser les grandes mutations
du secteur.
GL EVENTS RAPPORT D'ACTIVITÉ 2025 / TEMPS FORTS 2025 GL EVENTS EXHIBITIONS / 123
Espacio Food & Service
DU 30 SEPTEMBRE AU 2 OCTOBRE
Avec 50 129 visiteurs et plus de 800 entreprises
exposantes réunies sur 35 000 m², Espacio Food &
Service a battu un record de fréquentation pour sa
13e édition. Organisé à Santiago, le salon confirme
son statut de plus grand rendez-vous de l’industrie
alimentaire en Amérique latine. Cette édition marque
également une étape stratégique avec l’intégration
de l’événement au portefeuille de FISA, filiale de
GL events au Chili, et à l’écosystème international
de la division Sirha Food, renforçant les liens entre
les acteurs du secteur à l’échelle mondiale.
GL EVENTS RAPPORT D'ACTIVITÉ 2025 / TEMPS FORTS 2025 GL EVENTS EXHIBITIONS / 124
Tranoï Tokyo
DU 3 ET 4 SEPTEMBRE
Déployé dans le cadre de la Japan Fashion Week,
Tranoï Tokyo confirme l’ambition internationale de la
marque Tranoï portée par GL events Exhibitions. Pour
sa troisième édition, le salon a réuni 250 exposants et
plus de 3 000 visiteurs, affirmant son rôle de vitrine
pour les créateurs et de plateforme de rencontres
pour les acheteurs internationaux. Aux côtés de
Tranoï Paris et de l’entité Tranoï Showcase dédiée aux
formats événementiels hybrides, cette implantation
asiatique illustre la stratégie de développement de
GL events dans l’univers de la mode et de la création
à l’international.
GL EVENTS RAPPORT D'ACTIVITÉ 2025 / TEMPS FORTS 2025 GL EVENTS EXHIBITIONS / 125
CACLP
DU 22 AU 24 MARS
Événement de référence dédié à l’industrie du
diagnostic in vitro (IVD), CACLP confirme son rôle
central dans l’écosystème mondial des technologies
médicales. Le salon réunit chaque année les
principaux acteurs du secteur autour d’une exposition
commerciale de premier plan et d’un programme
de conférences scientifiques. Plateforme d’échanges
et d’innovation, CACLP accompagne le dynamisme
du marché chinois tout en renforçant les connexions
internationales entre industriels, chercheurs et
professionnels de la santé.
GL EVENTS RAPPORT D'ACTIVITÉ 2025 / TEMPS FORTS 2025 GL EVENTS EXHIBITIONS / 127
WESAVC – East-West Small
Animal Veterinary Conference
DU 21 AU 23 MAI
Rendez-vous majeur de la médecine vétérinaire en
Asie, la conférence WESAVC a réuni à Xiamen plusieurs
milliers d’experts, chercheurs et vétérinaires venus de
Chine et d’une vingtaine de pays. Dédié à la médecine
des animaux de compagnie, l’événement propose un
programme riche de forums scientifiques, conférences
et sessions spécialisées couvrant de nombreux
domaines cliniques. Plateforme d’échanges et de
diffusion des connaissances, WESAVC contribue à
accompagner les évolutions de la médecine vétérinaire
et le développement du secteur en Asie.
GL EVENTS RAPPORT D'ACTIVITÉ 2025 / TEMPS FORTS 2025 GL EVENTS EXHIBITIONS / 128
CFIA
DU 4 AU 6 MARS
Rendez-vous structurant et incontournable de
l’industrie agroalimentaire en Europe, le CFIA Rennes a
une nouvelle fois rassemblé l’ensemble de l’écosystème
du secteur autour de l’innovation, des technologies
et des solutions industrielles. Organisé par le pôle
Exhibitions, le salon réunit chaque année industriels,
fournisseurs et experts pour échanger sur les évolutions
du marché, les enjeux de performance et de transition
durable. Conférences, démonstrations et rencontres
professionnelles ont rythmé cette édition.
GL EVENTS RAPPORT D'ACTIVITÉ 2025 / TEMPS FORTS 2025 GL EVENTS EXHIBITIONS / 129
Moyen-Orient Afrique
En 2025, la zone Moyen-Orient et Afrique confirme son rôle dans
la dynamique internationale du Groupe, portée par des marchés
en structuration et des besoins croissants en infrastructures
événementielles. Dans des environnements contrastés, les équipes
renforcent leur ancrage local et leur capacité opérationnelle,
en s’appuyant sur un modèle intégré. Cette complémentarité
permet d’accompagner des projets d’envergure et de contribuer
durablement au développement des territoires.
SIRHA ARABIA - RIYAD, ARABIE SAOUDITE
MOYEN-ORIENT - AFRIQUE
Moyen-Orient
« Passer d’une logique
d’investissement massif à
une logique de performance
durable crée de nouvelles
opportunités pour un acteur
intégré comme GL events
dès lors que le contexte
géopolitique permettra
à la région de retrouver
une dynamique positive. »
JEAN-GUILLAUME LACOSTE
CEO GL EVENTS MIDDLE EAST AND AFRICA
Une région qui change de cycle, mais pas d’ambition
En 2025, la zone Middle East a confirmé sa place parmi les
territoires les plus stratégiques de l’industrie événementielle
mondiale. Les économies du Golfe ont poursuivi leurs plans
de diversification autour du tourisme, de la culture, du sport,
de l’industrie et des grands projets d’infrastructures. Le
calendrier régional était résolument dense, porté par des
échéances majeures à l’horizon 2030 et au-delà, en l’absence
de signes avant-coureurs des conflits venus perturber pour
une durée encore inconnue la quiétude de la région.
Après plusieurs années d’investissements massifs, parfois
accélérés, les États et les grands donneurs d’ordre sont entrés
dans une phase de rationalisation. Les projets ambitieux sont
désormais soumis à des exigences accrues de rentabilité, de
planification financière et de performance opérationnelle.
Le passage d’une logique d’expansion rapide à une logique
de performance durable redéfinit les règles du jeu. Tout
porte à croire que cette tendance sera d’autant plus vraie
compte tenu de l’actualité du début d’année 2026.
Dans ce contexte plus structuré, la concurrence internationale
s’intensif ie. De nombreux opérateurs mondiaux se
positionnent sur les marchés de la gestion de sites, des
structures temporaires, de l’énergie ou de l’entertainment.
L’attractivité du territoire est confirmée, mais la différenciation
devient essentielle. Le modèle intégré de GL events, capable
d’intervenir sur l’ensemble de la chaîne de valeur, de la
conception à l’exploitation, constitue un atout déterminant
face à des donneurs d’ordre qui privilégient désormais des
partenaires globaux, fiables et capables de maîtriser des
dispositifs complexes.
2025, une année de consolidation, d’ancrage local
et de montée en puissance opérationnelle
Après un cycle exceptionnel marqué par de grands
événements internationaux, l’année 2025 s’inscrit dans
une logique de consolidation. L’activité régionale est restée
soutenue et les performances ont été supérieures aux
objectifs budgétaires, confirmant la solidité des positions
acquises ces dernières années. Cette dynamique repose
GL EVENTS RAPPORT D'ACTIVITÉ 2025 / UN GROUPE INTERNATIONAL / 131
MOYEN-ORIENT - AFRIQUE
d’abord sur l’installation d’une récurrence plus forte, avec
des relations consolidées auprès de clients publics et privés.
Elle traduit également une évolution du positionnement
du Groupe, de plus en plus associé en amont des projets
structurants.
Le développement de l’activité énergie, portée par
l’entreprise Flow, illustre cette montée en puissance. Les
investissements réalisés dans les actifs et les équipes
locales ont renforcé la capacité opérationnelle et permis
d’accélérer la croissance. L’ancrage régional, avec des
matériels positionnés sur place et des équipes formées
localement, répond à une attente clé du marché : rapidité
d’exécution, conformité réglementaire et maîtrise des
coûts logistiques. Dans un environnement où la proximité
opérationnelle est déterminante, cette implantation
constitue un avantage concurrentiel décisif.
Parallèlement, l’année a été consacrée à la préparation
des grands événements prévus sur la région et désormais
soumis au retour au calme de pays qui se retrouvent
malgré eux au cœur d’un conflit majeur : Coupe d’Asie
2027, Expo 2030 à Riyad, Coupe du monde 2034 ou encore
les développements de Qiddiya. L’enjeu ne se limite plus
à la livraison des opérations, mais consiste à intervenir dès
les phases de cadrage et d’ingénierie.
Performance durable, héritage et transition
La transformation du marché régional s’accompagne
d’une évolution des attentes. Les grands événements ne
sont plus uniquement des vitrines internationales ; ils sont
pensés comme des leviers de transformation économique
et sociale. La notion d'héritage devient centrale. Au-delà
des inf rastructures livrées, les territoires attendent un
transfert de compétences, une montée en expertise des
équipes locales et un impact durable sur l’écosystème.
GL events a de ce fait choisi de renforcer ses dispositifs
de formation et favorise la mobilité des talents au sein
de la région. Cette circulation des expertises contribue à
installer un socle de compétences locales solide, en phase
avec les ambitions des pays hôtes.
La transition énergétique constitue également un axe
structurant. Si les solutions traditionnelles demeurent
majoritaires pour des raisons opérationnelles, la demande de
dispositifs plus sobres progresse. L’optimisation énergétique,
l’intégration progressive de solutions alternatives et
l’anticipation des évolutions réglementaires font désormais
partie intégrante des réflexions stratégiques. L’objectif est
clair : conjuguer performance opérationnelle, maîtrise
des coûts et réduction de l’empreinte environnementale.
En 2025, la zone Moyen orient a f ranchi une étape de
maturité. Après une phase d’expansion rapide, elle est
entrée dans un cycle de consolidation stratégique,
orienté vers la performance durable, l’innovation et
l’ancrage territorial. Dans un environnement exigeant et
hautement concurrentiel, elle devait être un de territoire
de développement du Groupe à l’international et un
laboratoire d’excellence opérationnelle pour les grands
projets de la décennie à venir si le conflit n’était pas venu
contrarier cette trajectoire.
GL EVENTS RAPPORT D'ACTIVITÉ 2025 / UN GROUPE INTERNATIONAL / 132
PARC DES EXPOSITIONS - ABIDJAN, CÔTE D'IVOIRE
GL EVENTS RAPPORT D'ACTIVITÉ 2025 / UN GROUPE INTERNATIONAL / 133
MOYEN-ORIENT - AFRIQUE
Afrique du Sud
mesure. Dans ce contexte de reprise
confirmée, l’année a été marquée par
un événement exceptionnel : l’accueil
du premier G20 jamais organisé sur
le continent africain. Pour l’Afrique
du Sud, comme pour l’ensemble de
la filière événementielle locale, ce
sommet a constitué un moment
unique. Plus de 130 événements
ont été organisés à travers le pays,
mobilisant de nombreux acteurs
du secteur.
ADELE HARTDEGEN
CEO CENTRE D’EXPOSITIONS
DE JOHANNESBURG,
AFRIQUE DU SUD
« 2025 a été l’année du
retour à pleine capacité
avec en point d’orgue un
événement structurant
pour le continent. »
Alors que l’Afrique du Sud a connu
une reprise plus lente que l’Europe ou
les États-Unis après la période Covid,
les lieux d’exposition et de congrès
ont retrouvé en 2025 des niveaux
d’activité comparables à 2018-2019.
Les salons professionnels et les
événements grand public ont renoué
avec leurs niveaux de fréquentation
historiques et l’écosystème local s’est
densifié avec l’apparition de nouvelles
petites et moyennes entreprises,
notamment dans les métiers de
l’inf rastructure et du stand sur
Pour GL events, l’impact a été
particulièrement structurant.
Les deux rendez-vous majeurs, le
Sommet ministériel en février 2025
et le sommet des chefs d’État en
novembre 2025, ont été accueillis au
centre d’expositions de Johannesburg.
Les dispositifs ont été livrés en
étroite collaboration entre le centre
d’expositions de Johannesburg et
GL events Live en Afrique du Sud,
démontrant la complémentarité
des expertises locales et la capacité
à opérer sur des projets d’État à forte
dimension protocolaire.
Au-delà de la réussite opérationnelle,
saluée pour sa fluidité et sa qualité
d’exécution, cet événement a
renforcé la visibilité internationale
du pays et confirmé sa capacité à
accueillir des rencontres d’envergure
mondiale. Pour GL events, il a
consolidé une crédibilité stratégique
sur le marché sud-africain et dans
l’écosystème du tourisme d’affaires.
Les premières retombées se
traduisent déjà par une amélioration
qualitative des demandes entrantes
et des opportunités identifiées pour
les années à venir.
Un portefeuille solide et
des événements propriétaires
structurants
Au-delà de cet événement emblématique, l’activité repose sur un
portefeuille d’événements sécurisé
sur plusieurs années. De nombreux
salons professionnels, notamment
dans les secteurs des mines et de
l’emballage, réservent leurs éditions
deux à trois ans à l’avance, certains
étant conf irmés jusqu’en 2028.
Electra Mining Africa, plus grand
salon minier du continent, illustre
cette stabilité avec des engagements
pluriannuels récurrents.
Côté grand public, des rendez-vous
majeurs comme Comic Con Africa
bénéficient également d’une visibilité
à moyen terme, confirmant la solidité
du calendrier.
GL events Af rique du Sud peut
aussi compter sur un événement
propriétaire emblématique : le Rand
Show. Créé il y a plus de 130 ans, il
demeure le plus ancien événement
grand public d’Afrique. Il rassemble
chaque année entre 85 000 et
90 000 visiteurs et mobilise très
en amont les équipes. Ce salon,
détenu conjointement par le centre
d’expositions de Johannesburg et
GL events Live, illustre la capacité du
Groupe à s’inscrire dans la durée et
à faire évoluer un modèle historique
vers des formats contemporains,
attractifs et fédérateurs.
La division Live poursuit également
ses engagements sur des événements
sportifs majeurs, notamment dans le
golf, avec des contrats pluriannuels
en cours. L’ensemble témoigne d’un
modèle équilibré entre grands
événements institutionnels, salons
professionnels structurants et
GL EVENTS RAPPORT D'ACTIVITÉ 2025 / UN GROUPE INTERNATIONAL / 134
G20 - JOHANNESBOURG, AFRIQUE DU SUD
rendez-vous grand public à forte
notoriété locale.
À noter, la progression de la
sensibilité environnementale dans
les demandes clients. Les projets
intègrent de plus en plus des
exigences liées à la durabilité, qu’il
s’agisse de solutions modulaires
réutilisables ou de démarches plus
responsables dans la conception
des stands et des infrastructures.
Un modèle opérationnel singulier
et une ambition continentale
L’une des spécificités du Johan
nesburg Expo Centre réside dans son
modèle opérationnel. Le modèle de
multi-compétences qui fait la force
des équipes sud-africaines contribue
à structurer une organisation agile
et performante. Les équipes des
trois entités locales, GL events
Venues, GL events Live et GL events
Exhibitions, fonctionnent de manière
transversale, avec un partage des
ressources selon les besoins des
projets. Cette coopération fluide
constitue un levier d’efficacité et
de cohérence et renforce l’impact
global du Groupe sur le territoire.
Pour les années à venir, la priorité
stratégique est claire : accompagner
l’Afrique du Sud dans sa capacité
à attirer de grands événements
internationaux. L’expérience acquise
avec le G20 positionne GL events
comme un partenaire crédible
auprès des autorités publiques pour
les futurs projets d’envergure, qu’il
s’agisse de sommets internationaux,
de conférences multilatérales ou
de grands rendez-vous sectoriels.
L’objectif est double, contribuer au
développement économique du
pays par l’accueil de manifestations
structurantes tout en affirmant le
rôle de l’Af rique du Sud comme
porte d’entrée événementielle vers
le continent africain.
GL EVENTS RAPPORT D'ACTIVITÉ 2025 / UN GROUPE INTERNATIONAL / 135
PARC DES EXPOSITIONS - ABIDJAN, CÔTE D'IVOIRE
MOYEN-ORIENT - AFRIQUE
Côte d'Ivoire
un site de 16 hectares à proximité
immédiate de l’aéroport, offrent des
équipements rares dans la sous-région
ouest-africaine. L’enjeu principal a
donc consisté à remettre le site à
niveau, à en préserver les installations
et à créer les conditions d’une
exploitation durable et performante.
VALÉRY GISSAT
DIRECTEUR GÉNÉRAL DU PARC
DES EXPOSITIONS D'ABIDJAN
Une reprise stratégique pour
un site à haut potentiel
Livré en juillet 2023 et initialement
exploité par l’État, le site est entré
début 2025 dans une nouvelle
dynamique avec la reprise de sa
gestion par GL events. Ce passage
de témoin a fait de l’exercice un
temps fondateur, centré sur la
professionnalisation de la filière
événementielle locale et la montée
en gamme de l’offre.
Le contexte ivoirien présente des
spécif icités fortes. Si le pays ne
dispose pas encore d’une culture
événementielle et de congrès
mature, il bénéficie en revanche
d’infrastructures de très haut niveau
et d’un potentiel de développement
considérable. Le parc d’expositions et
le centre de congrès, implantés sur
La structuration opérationnelle
comme priorité
L’année a ainsi été consacrée à
la structuration opérationnelle :
poursuite des recrutements, formation
des équipes, déploiement des outils
Groupe, mise en place d’une politique
commerciale, définition des grilles
tarifaires et constitution d’un réseau
de partenaires : audiovisuel, logistique,
Food & Beverage, sécurité, nettoyage
et main-d’œuvre. Des investissements
ciblés ont également été réalisés pour
disposer sur place d’un maximum de
matériels, notamment audiovisuels
et logistiques et pour compléter les
capacités du site avec des structures
temporaires adaptées aux besoins
des clients.
Une ambition forte, des résultats
prometteurs et un modèle
gagnant
Ces efforts ont permis d’obtenir des
résultats supérieurs aux prévisions
initiales. Por tée notamment
par l’accueil de manifestations
gouvernementales majeures, l’activité
a affiché une meilleure rentabilité
que prévue. Cette performance
confirme la pertinence du modèle
de management retenu, contrat
de gestion dans lequel GL events
intervient pour structurer, sécuriser et
accompagner le développement du
site, avec un fort soutien des autorités
publiques.
La complémentarité avec les autres
entités du Groupe s’est concrétisée
à plusieurs niveaux. Les équipes de
GL events Audiovisual & Power ont
accompagné le site à travers des
audits, des actions de maintenance
et des programmes de formation,
appelés à se poursuivre. La partici
pation, pour la première fois, au
salon IBTM à Barcelone aux côtés
des équipes Groupe a également
constitué un levier majeur de
visibilité et de professionnalisation,
tant pour les équipes locales que
pour l’écosystème ivoirien.
« 2025 a marqué
une étape déterminante
pour le site d’Abidjan,
avec le passage d’une
phase de mise en
service à une véritable
structuration des
activités. »
À l’issue de cette première phase,
les perspectives sont ambitieuses.
L’objectif est de poursuivre la montée
en puissance du site, avec une activité
appelée à s’intensifier dès 2026, la
création d’un bureau des congrès,
des projets d’extension des surfaces
d’exposition, l’installation de panneaux
photovoltaïques et la mise en place
d’un système de billetterie interne
afin de sécuriser les flux et rassurer
les clients internationaux. Avec
une équipe de 14 collaborateurs,
Abidjan s’inscrit désormais comme
un projet structurant, à la croisée
du développement territorial, de la
professionnalisation des métiers et du
savoir-faire international de GL events.
GL EVENTS RAPPORT D'ACTIVITÉ 2025 / UN GROUPE INTERNATIONAL / 137
ROSE FESTIVAL - TOULOUSE, FRANCE
GL events,
le Groupe
140 / CHIFFRES CLÉS - ANALYSE
149 / CRITÈRES « ENVIRONNEMENTAUX,
SOCIAUX ET DE GOUVERNANCE »
163 / RESSOURCES HUMAINES
168 / JURIDIQUE & COMPLIANCE
175 / SYSTÈME D'INFORMATION,
DATA ET DIGITAL
188 / HISTOIRE & ÉTAPES CLÉS
196 / CAHIER DE L’ACTIONNAIRE
GL EVENTS RAPPORT D'ACTIVITÉ 2025 / GL EVENTS, LE GROUPE / 139
CHIFFRES CLÉS - ANALYSE
ÉVOLUTION DU CHIFFRE D’AFFAIRES (M€)
ET DE LA MARGE EBITDA (%)
1800
1721,1
1700
1635,2
1600
1500
1427,3
1400
1315,3
1300
240
1200
1100
900
200
945,9 (55%)
12,8%
800
14,5%
14,2%
14,0%
1000
160
700
600
400
300
120
619,6 (38%)
635,8 (45%)
500
80
728,5 (55%)
40
200
100
0
0
2022*
2023*
2024*
2025*
International
France
EBITDA
- DONNÉES HORS APPLICATION DES NORMES IFRS 16 ET IAS 29
RÉSULTAT NET PART DU GROUPE, CAPACITÉ D’AUTOFINANCEMENT
ET RÉSULTAT OPÉRATIONNEL COURANT (ROC)
180
172,5
170
160
148,4
150
151,6
135,3 133,7
140
130
121,7
120
110
102,9
100
90
86,3
77,2
80
64,0
70
60
176,2
57,1
50
40
30
20
10
0
2022*
2023*
2024*
Résultat net part du Groupe
2025*
Capacité d’autofinancement
ROC
- DONNÉES HORS APPLICATION DES NORMES IFRS 16 ET IAS 29
GL EVENTS RAPPORT D'ACTIVITÉ 2025 / GL EVENTS, LE GROUPE / 140
CHIFFRES CLÉS - ANALYSE
« GL events dispose aujourd’hui
des bases solides pour absorber
l’instabilité et poursuivre
sa croissance. »
SYLVAIN BECHET
DIRECTEUR GÉNÉRAL FINANCES ET INVESTISSEMENTS
L’exercice 2025 bénéf icie d’un cycle de croissance
particulièrement porteur pour GL events. Après la dynamique
soutenue de 2024, l’année écoulée a confirmé la solidité
de la trajectoire engagée. Ce nouveau souffle s’est imposé
comme un véritable tremplin, projetant le Groupe dans une
dynamique continue sur la triennale 2024-2026.
Cette performance s’explique d’abord par la capacité du
Groupe à absorber les chocs et à tirer parti de son nouveau
dimensionnement. GL events a désormais atteint une taille,
une organisation métiers et une implantation géographique
qui lui permettent de faire face à un environnement
économique et géopolitique instable, tout en poursuivant son
développement. Le Groupe s’est doté de leviers financiers,
organisationnels et opérationnels robustes pour accompagner
la croissance et la performance opérationnelle.
Une performance financière solide et durable
En 2025, la croissance du Groupe se mesure à plusieurs
niveaux. Les indicateurs financiers traduisent une amélioration
continue de la performance globale, marquée notamment
par une progression de la rentabilité par action, reflet d’une
création de valeur durable. Cette dynamique est portée par
une meilleure maîtrise des coûts, une discipline renforcée
en matière d’investissements et une gestion active du cycle
d’endettement. La stratégie engagée depuis la période
post-Covid porte ses fruits : le niveau d’endettement recule,
le levier financier s’apprécie et les marges progressent de
manière structurelle. Cette trajectoire s’inscrit dans une
logique de long terme, engagée dès 2019, et confirme la
solidité du modèle économique.
Un développement géographique équilibré, maîtrisé
et stratégique
Le bon équilibre et le déploiement des implantations
géographiques constituent un autre marqueur fort de
la performance 2025. Malgré les tensions géopolitiques,
GL events a poursuivi son développement en Af rique
du Sud, au Moyen-Orient, en Asie et en Amérique latine.
L’Asie-Pacifique illustre bien cette dynamique contrastée :
si la Chine traverse une phase de « digestion » après une
période d’hypercroissance, d’autres zones, comme le Japon
ou le Vietnam, offrent de nouvelles perspectives. Ainsi, le
Japon a confirmé la pertinence du positionnement du
Groupe, notamment à travers des projets structurants, tandis
que le Vietnam apparaît comme un relais de croissance
prometteur, porté par des acteurs industriels tournés
vers l’export.
En France, le contexte politique et économique reste
exigeant, mais le Groupe continue d’y investir de manière
stratégique. L’exploitation du Stade de France en est
une illustration majeure. Cet engagement assumé sur
le long terme positionne GL events sur le marché de
GL EVENTS RAPPORT D'ACTIVITÉ 2025 / GL EVENTS, LE GROUPE / 141
CHIFFRES CLÉS - ANALYSE
l’entertainment, non comme producteur de contenus,
mais comme partenaire au service des acteurs culturels
et sportifs. Il s’agit de mettre à disposition un savoir-faire,
des infrastructures et une expertise opérationnelle, tout
en diversifiant les sources de revenus et en renforçant la
visibilité du Groupe.
Une stratégie d’investissement sélective, durable et
porteuse
Les choix d’investissement réalisés en 2025 s’inscrivent dans
une philosophie claire : des investissements raisonnables,
raisonnés et plus eff icients. La discipline en matière
de capex reste forte, avec une attention particulière
portée à la création de valeur et au cash-flow. Certains
investissements passés, notamment au Brésil, illustrent
cette approche : ils génèrent aujourd’hui des flux financiers
positifs et contribuent pleinement à la performance du
Groupe. Cette sélectivité permet d’éviter les effets d’éviction
entre projets et de préserver l’équilibre global.
L’attractivité financière de GL events s’est également
renforcée, comme en témoigne l’évolution récente
de l’actionnariat. L’arrivée de nouveaux investisseurs
institutionnels et familiaux tels qu’Atream, Trévise
Participations ou Amar Family Off ice constitue un
marqueur fort de confiance dans le modèle économique,
la gouvernance et les perspectives du Groupe. Cette
diversification de la base actionnariale accompagne
la montée en puissance de GL events et soutient des
engagements de long terme, notamment sur des contrats
structurants.
Parallèlement, les enjeux de durabilité occupent désormais
une place pleine et entière dans les décisions d’investissement.
La performance énergétique, la décarbonation, la circularité
des actifs et la conformité aux exigences CSRD influencent
directement les arbitrages f inanciers. Le modèle du
Groupe, fondé sur un fort ancrage territorial et sur la
réutilisation d’actifs et de matériaux, intègre naturellement
ces dimensions. Les critères RSE sont désormais considérés
comme des facteurs de création de valeur à long terme,
au même titre que les indicateurs financiers.
Dans ce contexte, les équipes finance jouent un rôle central.
Leur positionnement en tant que véritables partenaires
stratégiques des équipes opérationnelles, contribue à
sécuriser les projets, à accompagner la croissance des
sites et à piloter les risques liés à l’inflation, aux évolutions
du mix d’activités et aux incertitudes géopolitiques. Cette
proximité avec les métiers permet de créer de la valeur,
tout en conservant une exigence élevée en matière de
performance et de discipline financière.
À l’issue de l’exercice 2025, GL events aborde les prochaines
années avec des fondamentaux solides : une capacité
confirmée à créer de la valeur durable, une diversification
géographique équilibrée, une discipline d’investissement
renforcée et une organisation f inancière pleinement
au service de la stratégie. Ces éléments constituent les
bases d’une trajectoire de croissance maîtrisée, capable
d’accompagner les ambitions du Groupe dans un
environnement en constante évolution, de maîtriser ses
risques et de créer de la valeur.
Notre politique de retour aux actionnaires, combinant un
dividende solide et une performance boursière positive,
reflète notre confiance dans nos perspectives et notre
engagement à partager les fruits de notre croissance.
GL EVENTS RAPPORT D'ACTIVITÉ 2025 / GL EVENTS, LE GROUPE / 142
CHIFFRES CLÉS - ANALYSE
En Italie, cela se traduit par un travail
fin sur le mix d’activités, une attention
accrue portée à la structure des
charges et une capacité à ajuster
rapidement les dispositifs en fonction
des réalités du marché.
Le Lingotto Fiere, dont GL events
est propriétaire, illustre cette
volonté de pilotage durable. Un
plan d’investissement important a
été engagé en 2025, accompagné
d’un programme de maintenance
et d’amélioration des infrastructures
visant à préserver la qualité du site
et à en renforcer l’attractivité. Cette
politique d’investissement raisonnée
s’inscrit dans la même philosophie
que celle défendue au niveau du
Groupe : investir de manière sélective,
en cohérence avec la génération de
cash-flow et la création de valeur à
long terme.
MIRKO SUPPO
RESPONSABLE FINANCE
GL EVENTS ITALIE
« Dans la continuité de
la trajectoire financière
portée par le Groupe,
l’année 2025 a confirmé
la solidité et la capacité
d’adaptation des équipes
italiennes dans un
environnement exigeant. »
Si la rentabilité des activités
d’organisation reste un point
d’attention, la performance globale
du périmètre italien témoigne d’une
discipline accrue et d’une meilleure
maîtrise des équilibres économiques.
En 2025, GL events Italie a consolidé
son chiffre d’affaires et amélioré
significativement la marge sur les
activités les plus structurantes du
site. Si certaines manifestations
organisées en propre continuent de
peser sur la rentabilité, les équipes ont
su compenser cette fragilité par une
stratégie d’expansion commerciale
ciblée et par une politique tarifaire
alignée avec les orientations du
Groupe.
L’un des temps forts de l’année a été
la montée en puissance des Jeux
olympiques et paralympiques d’hiver
de Milan Cortina. Pour les équipes
finance italiennes, le défi ne s’est pas
limité au suivi budgétaire : il a impliqué
un accompagnement transversal
des équipes opérationnelles,
notamment du pôle Live, sur les
volets f iscaux, administratifs et
de contrôle de gestion. Ce travail
a constitué un véritable exercice
de transversalité et d’optimisation
des synergies. En 2025, les équipes
italiennes ont cherché à installer un
esprit de collaboration plus étroit,
en multipliant les échanges avec
les directions opérationnelles et en
apportant des données financières
plus fines et plus réactives aux chefs
de projet.
améliorer l’efficience des coûts et
contribuer aux décisions stratégiques
au sein des comités de direction.
Au-delà des Jeux d’hiver, des
événements structurants comme
le Salon du livre ou Artissima, qui
bénéf icie d’un contrat triennal
2025-2027, renforcent la visibilité
du site de Turin et confirment la
confiance des partenaires publics
et privés. Pour la fonction finance,
ces rendez-vous constituent
des laboratoires de pilotage :
concentration des équipes, exigence
opérationnelle élevée et coordination
étroite entre les métiers.
Dans un contexte où le Groupe
a changé d’échelle et s’aff irme
comme une grande entreprise dotée
de leviers financiers robustes, la
filiale italienne contribue à cette
dynamique. Comme pour l’ensemble
des fonctions f inance, l’objectif
n’est pas seulement de produire
des états financiers fiables, mais
d’accompagner la performance des
sites et des événements, d’anticiper
les risques et d’éclairer les choix
d’investissement. L’action de la
fonction finance est ainsi pleinement
intégrée à la stratégie et à la création
de valeur du Groupe.
Cette double posture, réactive et
proactive, structure désormais
l’action de la fonction finance locale.
Réactive, pour répondre rapidement
aux demandes internes et sécuriser
les projets en cours. Proactive, pour
proposer des pistes d’optimisation,
GL EVENTS RAPPORT D'ACTIVITÉ 2025 / GL EVENTS, LE GROUPE / 143
CHIFFRES CLÉS - ANALYSE
COMPTE DE RÉSULTAT CONSOLIDÉ (M€)
2024*
2025*
1 635,2
1 721,1
EBITDA
231,8
250,4
RÉSULTAT OPÉRATIONNEL COURANT
151,6
176,2
RÉSULTAT OPÉRATIONNEL
147,6
165,6
RÉSULTAT FINANCIER
-30,4
-32,7
IMPÔT
-30,2
-36,9
RÉSULTAT NET DES SOCIÉTÉS INTÉGRÉES
+87
+96
MISE EN ÉQUIVALENCE ET MINORITAIRES
-10,4
-9,7
RÉSULTAT NET PART DU GROUPE
+77,2
+86,3
CHIFFRE D’AFFAIRES
— �EBITDA :
14,5 % DU CHIFFRE
D'AFFAIRES
— �MARGE
OPÉRATIONNELLE
COURANTE : 10,2 % DU
CHIFFRE D'AFFAIRES
— �RÉSULTAT NET PART
DU GROUPE : + 11,7 %
- DONNÉES HORS APPLICATION DES NORMES IFRS 16 ET IAS 29
BILAN CONSOLIDÉ SIMPLIFIÉ (M€)
BILAN 2024*
Actifs
incorporels
871,0
Actifs
corporels
et fi. et id.
481,9
Matériel
locatif
168,8
BILAN 2025*
Capitaux
propres
623,9
Dette
financière
nette
516,6
Actifs
incorporels
866,8
Actifs
corporels
et fi. et id.
500,9
Dette
financière
nette
471,3
Provisions
31,0
Provisions
33,2
RFR
348,0
Capitaux
propres
651,3
Matériel
locatif
155,5
- DONNÉES HORS APPLICATION DES NORMES IFRS 16 ET IAS 29
GL EVENTS RAPPORT D'ACTIVITÉ 2025 / GL EVENTS, LE GROUPE / 144
RFR
369,6
CHIFFRES CLÉS - ANALYSE
ÉVOLUTION DE L'ENDETTEMENT NET (M€)*
517*
CAF
nette IS**
-207
AK Stade
de France
-18
CAPEX
81
M&A
40
BFR
-13
Dividendes
versés
34
Autres
-7
471*
Variation
de change
20
— �CAF NETTE D'IS : + 5,1 %
— �CAPEX INTÉGRANT
LES INVESTISSEMENTS
DU SITE D'ANHEMBI
(14,8 M€)
Coût de
l’endettement
25
Cash-flow opérationnel
139 M€
31/12/24
31/12/25
- DONNÉES HORS APPLICATION DE LA NORME IFRS 16
** CAF NETTE D’IMPÔT AVANT COÛT DE L’ENDETTEMENT HORS APPLICATION DES NORMES IFRS 16 ET IAS 29
INTERMODAL & NT EXPO - SÃO PAULO, BRÉSIL
GL EVENTS RAPPORT D'ACTIVITÉ 2025 / GL EVENTS, LE GROUPE / 145
CHIFFRES CLÉS - ANALYSE
Cette hétérogénéité des situations
s’est traduite par des dynamiques
très contrastées selon les zones
géographiques. Si certains pays
européens ont évolué dans un climat
attentiste, d’autres régions ont offert
des perspectives plus favorables,
comme le Brésil ou certaines zones
d’Amérique latine. À l’inverse, des
marchés comme la Chine restent
marqués par un ralentissement
durable post-Covid ainsi que par
des crises sectorielles qui impactent
certaines de nos verticales, tandis que
le Moyen-Orient demeure dépendant
de facteurs macroéconomiques
spécifiques, notamment liés aux
politiques de dépenses publiques
et plus récemment les facteurs
géopolitiques. Cette diversité de
contextes confirme la pertinence
de la stratégie de diversification
géographique du Groupe, conçue
pour limiter l’exposition à un seul
cycle économique.
JÉRÔME MAILHES
DIRECTEUR CORPORATE
DÉVELOPPEMENT GROUPE
« L’environnement
dans lequel GL events
a su navigué en 2025
a été marqué par une
succession de facteurs
d’instabilité, à la fois
politiques, institutionnels
et économiques. »
En France comme à l’international,
les incertitudes liées aux politiques
publiques, aux cadres fiscaux ou
encore aux tensions géopolitiques
ont pesé sur les décisions
d’investissement. Dans ce contexte, la
stabilisation progressive de l’inflation
a toutefois contribué à recréer un
terrain plus lisible, propice à la reprise
de projets de développement sur
certains marchés.
Pour l'activité fusions et acquisitions,
l’année 2025 s’est avérée dense,
d a va n t a g e o r i e n té e ve r s l a
consolidation que vers la multiplication
des opérations finalisées. Si le marché
du M&A est resté actif, il a également
été plus sélectif, présentant des
opportunités souvent plus complexes,
portant sur des entreprises de taille
significative ou des actifs structurants.
Plusieurs dossiers ont été engagés ou
approfondis, avec des temporalités
longues, appelées à se concrétiser
en 2026. Cette réalité illustre une
évolution du marché : les cycles
d’acquisition s’allongent, les exigences
de préparation s’intensifient et la
qualité de l’exécution devient un
facteur déterminant.
Cette approche sélective correspond
pleinement à l’esprit pionnier et à
l’ingéniosité du Groupe. Chaque
opération est envisagée comme
un projet stratégique à part entière,
intégrant très en amont les enjeux
opérationnels, humains et culturels.
Le développement ne se limite
pas à une logique de croissance de
périmètre, mais vise à renforcer des
positions existantes, à équilibrer des
portefeuilles d’activités, à compléter
des offres ou à accompagner des
dynamiques de marché locales.
En 2025, plusieurs opérations ont
ainsi permis de consolider des
participations déjà détenues ou de
renforcer des verticales clés.
Sur le pôle Venues, le renforcement
du réseau de sites en Amérique
latine, notamment au Chili avec
Espacio Riesco, s’inscrit dans cette
logique de continuité et d’ancrage
territorial. Du côté du pôle Exhibitions,
des acquisitions ciblées sont
venues compléter des plateformes
existantes, comme dans le secteur
de l’hydrogène en Amérique du Sud,
en cohérence avec le développement
d’Hyvolution à l’international. En
Chine, l’opération WESAVC vient
conforter la position du Groupe sur
le secteur du diagnostic, appliqué
à l'environnement vétérinaire,
en complément d’événements
structurants déjà existants. D’autres
opérations, comme le salon du
pain et de la boulangerie Bake &
Snack ou l’agence spécialisée dans
l’organisation de colloques, congrès
et journées scientifiques B4Event,
traduisent une volonté d’équilibrer
les calendriers de biennalité ou
de structurer de nouvelles filières,
notamment dans le champ de la
santé.
GL EVENTS RAPPORT D'ACTIVITÉ 2025 / GL EVENTS, LE GROUPE / 146
CHIFFRES CLÉS - ANALYSE
TOURISM EXPO JAPAN - AICHY, JAPON
Ces projets ont été menés en étroite
coordination avec les pôles et les
équipes locales. Chaque opération
s’appuie sur un sponsor opérationnel
identifié dès les premières phases,
garantissant une lecture fine des
enjeux terrain et une meilleure
anticipation de l’intégration. Cette
logique de coopération transverse
est devenue un marqueur fort de
la démarche M&A du Groupe. Les
équipes développement travaillent de
manière intégrée avec les fonctions
opérationnelles, juridiques et
financières, afin de préparer l’aprèsacquisition bien en amont de la
finalisation de l’acquisition.
L’intégration post-acquisition
constitue en effet un levier clé de
création de valeur. En 2025, des
progrès significatifs ont été réalisés
dans la préparation de cette étape,
avec une implication accrue des
équipes opérationnelles dès les
phases amont. Cette anticipation
permet d’aligner les organisations,
de sécuriser les trajectoires de
développement et de préserver les
cultures locales, tout en inscrivant
les entités dans le modèle GL events.
Cette approche est particulièrement
adaptée aux marchés non
anglo-saxons, dans lesquels les
codes culturels, managériaux et
économiques diffèrent fortement.
L’organisation du service M&A repose
sur une équipe volontairement
transverse et agile, capable
d’intervenir sur des terrains variés
et des environnements complexes.
Après une année de préparation,
plusieurs leviers se dessinent
notamment le développement du
marché américain du spectacle
vivant avec des actifs structurants tels
que les stades et arénas. L’attention
portée aux typologies d’actifs,
notamment les sociétés propriétaires
d’infrastructures, ouvre également
de nouvelles perspectives. Autant de
chantiers qui s’inscrivent dans une
trajectoire de croissance maîtrisée,
au service d’un Groupe capable
d’évoluer dans des environnements
multiples, tout en conservant une
forte cohérence stratégique.
GL EVENTS RAPPORT D'ACTIVITÉ 2025 / GL EVENTS, LE GROUPE / 147
CRITÈRES « ENVIRONNEMENTAUX, SOCIAUX ET DE GOUVERNANCE »
« Plus qu'une responsabilité, un
avantage concurrentiel : en 2025,
GL events a fait de sa démarche
RSE un atout stratégique majeur.
Diffuser une culture RSE partagée
constitue un enjeu central. »
AUDREY CHAVANCY
DIRECTRICE RSE & RISQUES GROUPE
2025 nous a permis de f ranchir une étape clé dans la
structuration et l’accélération de la démarche RSE du
Groupe. Après plusieurs années d’engagements progressifs,
les fondamentaux ont été consolidés tout en laissant une
place croissante aux initiatives portées par les entités et les
équipes opérationnelles. Cette dynamique s’est traduite par
une multiplication de démarches volontaires, notamment
en matière de certifications, engagées à l’initiative des
directions des entités et des métiers.
Ces initiatives, ancrées dans les réalités de terrain, ont
permis de faire émerger des projets concrets, adaptés aux
spécificités de chaque activité. Elles témoignent d’une
appropriation croissante des enjeux RSE par les équipes,
au-delà des cadres strictement réglementaires.
L’année a également été marquée par la prise en main
de projets complexes, en particulier sur les sujets de
biodiversité et d’accessibilité, démontrant la capacité du
Groupe à intégrer ces dimensions dans des contextes
opérationnels exigeants.
La stratégie RSE s’articule autour des trois piliers People,
Planet et Communities, en cohérence avec la charte de
durabilité du Groupe et la publication du premier rapport
CSRD.
Sur le pilier People, les actions menées ont permis de renforcer
concrètement les engagements du Groupe en matière de
diversité et d’inclusion. Le taux d’emploi des personnes en
situation de handicap a connu une augmentation d’un point
par rapport à 2023, traduisant les efforts engagés pour mieux
accompagner les collaborateurs dans la reconnaissance
de leur statut et favoriser un environnement de travail
plus inclusif. L’égalité femmes-hommes a constitué un
axe structurant, avec le lancement du programme de
mentorat interne Ment’her Ship. Ce dispositif a rassemblé
près de 165 collaborateurs, en France et à l’international, et
répond à un besoin fort de partage, de transmission et de
mise en réseau. Il s’inscrit dans une logique de valorisation
des parcours et de meilleure connaissance des expertises
internes, sans se substituer à des dispositifs de coaching
ou d’accompagnement de carrière.
Sur le pilier Planet, GL events a franchi un cap avec le
lancement des trajectoires de décarbonation par métier. Les
activités les plus émettrices ont été ciblées en priorité, avec
une structuration renforcée des données et le démarrage
de projets pilotes. En parallèle, plusieurs business units ont
engagé des démarches d’éco-conception et de réemploi,
portant notamment sur la réutilisation du bois et des
matériaux, l’évolution des méthodes d’agencement ou
l’optimisation des décors. L’année a également posé les
GL EVENTS RAPPORT D'ACTIVITÉ 2025 / GL EVENTS, LE GROUPE / 149
CRITÈRES « ENVIRONNEMENTAUX, SOCIAUX ET DE GOUVERNANCE »
CENTRALE PHOTOVOLTAÏQUE EN OMBRIÈRE EUREXPO - LYON, FRANCE
bases d’une prise en compte plus structurée des ressources,
eau, matériaux, biodiversité, dans un contexte réglementaire
complexe, mais largement porté par les attentes des clients,
des filières et des territoires.
transformer les contraintes réglementaires en leviers de
performance et d’investissement à long terme, notamment
sur les sujets énergétiques et d’accessibilité numérique
à horizon 2026.
Le pilier Communities accompagne la montée en puissance
des achats responsables, avec la mise à jour de la charte
fournisseurs et son intégration progressive dans les processus
du Groupe. Les actions de conformité, notamment en
matière d’anticorruption et d’éthique des affaires, ont été
poursuivies et consolidées. Les initiatives d’insertion par le
sport ont également été renforcées, en particulier à travers
le partenariat avec Sport dans la Ville, contribuant à ancrer
les activités de GL events dans leur environnement social
et territorial, tout en impliquant les collaborateurs.
Cette maturité se reflète également dans les réponses
aux appels d’offres. En 2025, la notation RSE du Groupe
a constitué un critère déterminant dans l’obtention des
projets stratégiques, confirmant la valeur concurrentielle
d’une démarche structurée, crédible et reconnue. La
mobilisation conjointe des expertises métiers, notamment
sur les enjeux de biodiversité et d’accessibilité, illustre la
capacité du Groupe à aligner performance opérationnelle
et exigences extra-financières.
L’année 2025 a par ailleurs été marquée par une intensification
des exigences réglementaires environnementales et
sociales. Pour accompagner les pôles et les business units,
une veille réglementaire bimestrielle a été structurée, en
lien étroit avec les directions opérationnelles, notamment
dans les activités de bâtiment, les plus impactées par les
nouvelles obligations. Cette approche différenciée permet
d’anticiper les évolutions, d’assurer la conformité et de
Au-delà des projets, la diffusion d’une culture RSE partagée
constitue un enjeu central. Réseau de référents, réunions
mensuelles, webinaires, tutoriels, retours d’expérience
et temps de restitution contribuent à une appropriation
progressive à tous les niveaux de l’entreprise. Une attention
particulière a également été portée à l’intégration des
nouvelles équipes, comme Marseille, Abidjan et le Stade
de France, afin de garantir un socle commun dès leur
arrivée dans le Groupe.
GL EVENTS RAPPORT D'ACTIVITÉ 2025 / GL EVENTS, LE GROUPE / 150
CRITÈRES « ENVIRONNEMENTAUX, SOCIAUX ET DE GOUVERNANCE »
propre. La logique retenue repose
sur une responsabilisation locale,
avec des objectifs adaptés aux
typologies de chaque site, avant
consolidation à l’échelle nationale
pour garantir cohérence et lisibilité.
Le déploiement opérationnel des
plans d’action s’accélérera à partir
de 2026.
ANTOINE RADIX
RESPONSABLE REPORTING RSE
ET PROJETS CLIMAT
« En 2025,
la décarbonation est
entrée dans une phase
de structuration concrète
au sein du Groupe. »
Après un temps de cadrage
stratégique, l’enjeu a été de traduire
les ambitions en trajectoires
opérationnelles, adaptées aux réalités
de chaque site et de chaque métier.
L’objectif n’est pas d’appliquer un
modèle unique, mais de construire
des plans d’action différenciés,
ancrés dans les activités terrain.
Un premier chantier structurant
a concerné l’ensemble des sites
Venues en France. Engagé avec
l’appui du cabinet Ekodev, le projet
vise à définir, pour chaque site, une
trajectoire de décarbonation propre.
Les stades, centres de congrès
et parcs d’exposition n’ont ni les
mêmes usages, ni les mêmes postes
d’émissions dominants. L’année 2025
a permis de consolider les bilans
carbone, d’identifier les principaux
leviers d’action et de formaliser des
feuilles de route spécifiques. Les
travaux ont porté sur l’énergie, la
gestion des déchets, la restauration
et l’organisation d’événements en
Un deuxième chantier majeur a
porté sur les métiers structures et
tribunes, en France et au RoyaumeUni. Le périmètre inclut Hall Expo,
Spaciotempo, Sodem System, Brelet
CE, Jaulin, GL events Live GrandOuest et Locabri en France, ainsi
que GL events UK, Aganto et Field
& Lawn au Royaume-Uni. Là encore,
l’accompagnement méthodologique
d’Ekodev a permis de structurer la
démarche.
La spécificité de ces activités réside
dans la nature des actifs déployés
et la logistique déployée pour livrer
les événements. La décarbonation
ne se limite pas à la consommation
énergétique des chantiers, elle
interroge la conception même des
structures, les matériaux utilisés,
leur durée de vie et leur logistique.
Les ateliers menés en 2025 ont fait
émerger plusieurs leviers prioritaires.
L’éco-conception constitue un axe
central, avec l’intégration progressive
de matériaux à plus faible intensité
carbone et une réflexion accrue sur
le recours à des matériaux recyclés
ou recyclables. L’allongement de la
durée de vie des actifs est également
déterminant, en maximisant
leur utilisation pour éviter des
renouvellements prématurés et
réduire l’empreinte globale.
La dimension logistique s’est
imposée comme un second pilier.
Les structures et tribunes circulent
en permanence entre les sites et
les pays. L’optimisation des flux,
notamment par un recours accru
au transport ferroviaire, fluvial et
maritime lorsque cela est possible,
a été étudiée. Certaines entités ont
déjà expérimenté ces alternatives.
En 2025, la priorité a été donnée à
l’identification et à la quantification
des actions potentielles. L’étape
suivante consistera à hiérarchiser
ces leviers en fonction de leur
impact carbone et de leur faisabilité
opérationnelle, afin de déployer
un plan d’action priorisé dès 2026.
Un troisième projet, validé en
2025, concerne les activités santé
de GL events Exhibitions. Il s’agit
d’un projet pilote visant à définir
une trajectoire de décarbonation
adaptée aux spécificités des salons et
congrès médicaux. L’ambition est de
tester une méthode sur une verticale
stratégique, puis de capitaliser sur
cette expérience pour accompagner
progressivement les autres divisions
du pôle Exhibitions.
Au-delà des projets eux-mêmes,
l’année a permis de renforcer
la cohérence internationale de
la démarche. Si les obligations
réglementaires sont principalement
pilotées au niveau holding, la
structuration des données et
du reporting progresse dans les
filiales internationales. Au Brésil, par
exemple, un travail spécifique a été
engagé pour fiabiliser les indicateurs
extra-financiers et consolider le suivi
des plans d’action. Cette montée en
maturité du reporting constitue un
socle indispensable pour inscrire la
trajectoire de décarbonation dans
la durée.
En 2025, la décarbonation n’est
donc plus seulement un objectif
affiché. Elle devient un cadre d’action
structuré, décliné par métier, articulé
autour de priorités mesurables et
intégré aux décisions opérationnelles.
L’enjeu des prochaines années
sera d’en démontrer l’impact
concret, en conciliant exigence
environnementale, performance
économique et compétitivité.
GL EVENTS RAPPORT D'ACTIVITÉ 2025 / GL EVENTS, LE GROUPE / 151
CRITÈRES « ENVIRONNEMENTAUX, SOCIAUX ET DE GOUVERNANCE »
Une politique RSE ancrée,
au cœur du business
model et de la stratégie
du groupe GL events
Depuis sa création, l’aventure entrepreneuriale du groupe GL events est fondée sur une culture de la responsabilité et du respect de
son écosystème à tous les niveaux de l’entreprise. C’est dans cet esprit que la Direction Générale a souhaité engager dès 2009 une
démarche spécifique de Développement Durable, assumant une dynamique pionnière de prise en compte des enjeux sociaux et
environnementaux. Le management éthique que ce soit au travers du déploiement de la démarche anti-corruption, le respect des
enjeux de sécurité et sûreté ou encore la formation demeure le socle de la démarche RSE du Groupe, représentée par l’ensemble
des Hommes et des Femmes qui le constitue.
En 2025, GL events a publié une Charte de durabilité visant
à structurer et guider la mise en œuvre de cette politique
à l’échelle du Groupe. Organisée autour de trois axes, elle
décline neuf engagements :
People
ٱAssurer la santé et la sécurité des collaborateurs,
partenaires et visiteurs
ٱFavoriser le développement et l’épanouissement au travail
ٱRenforcer la diversité et l’inclusion
Planet
ٱRéduire l’empreinte carbone du Groupe sur l’ensemble
des scopes 1, 2 et 3
ٱLimiter l’utilisation du jetable et développer les pratiques
d’économie circulaire
ٱPréserver la biodiversité et les ressources naturelles
Communities
ٱContribuer au développement économique, durable
et social des territoires
ٱAgir de manière éthique dans les relations avec les
parties prenantes
ٱDéployer des pratiques d’achats responsables en associant
les fournisseurs
Cette stratégie est au cœur des métiers et du business model
circulaire du Groupe. Les actions afférentes sont portées
par toutes les entités du Groupe et ses collaborateurs en
lien continu avec leurs différentes parties prenantes, en
France comme à l’international.
L’ensemble des résultats opérationnels de cette politique
est présenté ci-après et détaillés dans l’état de durabilité
du Document d’Enregistrement Universel.
GL EVENTS RAPPORT D'ACTIVITÉ 2025 / GL EVENTS, LE GROUPE / 152
CRITÈRES « ENVIRONNEMENTAUX, SOCIAUX ET DE GOUVERNANCE »
2025
Une politique RSE
ambitieuse
En 2025, GL events publie son deuxième état de durabilité, élaboré conformément aux exigences de la CSRD, illustrant la
structuration progressive de sa stratégie et le renforcement de la qualité du reporting.
Depuis la publication du premier état de durabilité, des avancées significatives ont été réalisées. Les travaux engagés ont permis
d’approfondir la prise en compte des enjeux émergents, notamment liés à la biodiversité, à la gestion de l’eau et à la pollution,
tout en consolidant les politiques, actions et trajectoires déjà définies sur les thématiques climatiques et d’économie circulaire.
Les enjeux sociaux ont également fait l’objet de progrès, en particulier à travers la structuration d’indicateurs plus robustes
et le déploiement de politiques dédiées, notamment en matière de sûreté des événements. En parallèle, les dispositifs de
gouvernance ont été maintenus et renforcés afin de soutenir la performance globale de la démarche RSE du Groupe.
Planet
People
ٱMise en place d’une trajectoire
de réduction des émissions sur
le pôle Venues France et les
entités structures et tribunes
en France et au Royaume-Uni
ٱCréation d’un Water Contest
pour mesurer et réduire les
consommations d’eau sur les
sites du pôle Venues
ٱMise en place d’un forfait
mobilité douce pour nos
collaborateurs en France
ٱMise en place de la Global
Working Conditions Policy,
désormais applicable à
l’ensemble des activités et
collaborateurs du Groupe dans
le monde.
ٱSignature d’une convention avec
l’AGEFIPH pour structurer une
politique handicap sur 3 ans
ٱCréation d’un comité Diversité
et Inclusion pour faire vivre la
diversité et l’inclusion au sein du
Groupe, en mesurant l’impact
des actions et en donnant la
parole aux équipes.
Gouvernance
ٱPremière publication des états
de durabilité en conformité avec
les exigences de la CSRD.
ٱDéploiement des formations sur
les risques de corruption et de
trafic d’influence.
ٱCréation et déploiement
d’une nouvelle charte achats
responsable pour renforcer
la performance, la durabilité
et l’éthique dans toute la
chaîne d’approvisionnement
événementielle.
GL EVENTS RAPPORT D'ACTIVITÉ 2025 / GL EVENTS, LE GROUPE / 154
CRITÈRES « ENVIRONNEMENTAUX, SOCIAUX ET DE GOUVERNANCE »
Plus précisément, en termes de résultats de la performance extra-financière :
Planet
People
Baisse de
4%
6%
-20%
35%
14h
527
-10%
1359
du taux de fréquence
des accidents du travail
par rapport à 2024
et de
des émissions par € de CA
pour les pôles Venues et
Live par rapport à 2024
Baisse de
15%
de la
quantité de déchets tonnes
déchets par € de CA vs 2024*
4276
Communities
de formations en moyenne
par collaborateur
du taux de rotation
des effectifs
du chiffre d’affaires du
Groupe est couvert par au
moins une certification ISO
collaborateurs formés sur
les risques de corruption
et de trafic d’influence.
collaborateurs formés à
la lutte contre les risques
de fraude depuis 2019
MWh
d’électricité renouvelable,
équivalent à la consom
mation annuelle de
1 900 foyers en France
- Données hors site d’Anhembi au Brésil
car d’importants déchets issus des travaux
ont été comptabilités en 2025
GL EVENTS RAPPORT D'ACTIVITÉ 2025 / GL EVENTS, LE GROUPE / 155
CRITÈRES « ENVIRONNEMENTAUX, SOCIAUX ET DE GOUVERNANCE »
Le déploiement de
la politique RSE performante
et reconnue au cœur de
son écosystème
La contribution de GL events
aux objectifs de développement
durable de l’ONU
Les objectifs de développement durable ont été créés par les
Nations Unies pour tracer la voie vers un avenir meilleur et plus
durable pour l'ensemble de la population, en abordant les défis
mondiaux tels que la pauvreté, les inégalités, le changement
climatique, la dégradation de l'environnement, la prospérité, la
Une performance RSE évaluée
et reconnue
Comme chaque année et ce depuis
2015, le groupe GL events est noté
par Ethifinance / Gaïa Research,
agence de notation de la perfor
mance RSE, sur 170 critères sociaux, environnementaux,
de gouvernance et de parties prenantes externes. Les
résultats annuels détaillés de cette campagne d’évaluation
sont systématiquement présentés au Comité exécutif du
Groupe ainsi qu’aux instances du Conseil d’administration,
que sont le Comité RSE et le Comité d’audit. Le score 2025
relatif aux données 2024 est en évolution avec un score de
72/100 vs 68/100 lors de l’exercice précédent.
paix et la justice. Le groupe GL events a spécifiquement choisi
13 objectifs de développement durable qui sont pertinents
pour ses activités, sa structure organisationnelle, sa présence
géographique et ses parties prenantes. C’est pourquoi, ils ont
été pleinement intégrés à l’exercice de double matérialité de
la CSRD et déploiement des actions RSE afin de s’assurer
de la cohérence des enjeux mondiaux avec les enjeux du
Groupe et de ses parties prenantes.
En 2024, le Groupe a obtenu la meilleure
note de A , selon le score carbone
développé par Axylia.
De plus, en 2025, GL events a répondu
pour la troisième fois au CDP climat et
eau.
Le Groupe a obtenu un score de B, vs B- en
2024, sur les enjeux climatiques et un score de B-, vs C en
2024, sur les enjeux liés à l’eau. Cela atteste que les bases
et les plans d’action en place permettent de structurer
une trajectoire de réduction des émissions alignée avec les
Accords de Paris, ainsi qu’une stratégie de gestion de l’eau.
GL EVENTS RAPPORT D'ACTIVITÉ 2025 / GL EVENTS, LE GROUPE / 156
CLEANUP DAY - SANTIAGO, CHILI
SIRHA LYON - FRANCE
CRITÈRES « ENVIRONNEMENTAUX, SOCIAUX ET DE GOUVERNANCE »
Contribution RSE au sein des
organisations et fédérations
professionnelles
Des partenariats d’actions
au service du développement
socio-économique des territoires
Le groupe GL events est présent au sein
des différentes organisations et
fédérations professionnelles telles que
l’UNIMEV (Union Nationale de Métiers
de l’événementiel) ou encore l’UFI et
participe activement aux sections/
commissions environnementales du secteur. Ces
participations permettent le partage de bonnes pratiques
et de réflexions autour de la transition sociale et
environnementale.
Grâce à la présence de ses entités au plus près des territoires
et la transversalité de ses métiers, le Groupe agit comme
un catalyseur et se positionne comme un ambassadeur de
l’attractivité économique et sociale partout où il opère. Des
rencontres sont organisées régulièrement afin de prendre
en compte les attentes et besoins des différentes parties
prenantes, d’améliorer le dialogue et de coconstruire des
solutions ou actions communes : délégants, professionnels
de filières ou de territoires, représentants associatifs, culturels
ou sportifs.
Pour illustrer, le Groupe signe un engagement pour la
croissance verte en faveur de l’économie circulaire le 7
février 2022 aux côtés de l’UNIMEV. Ce dispositif proposé
par les pouvoirs publics engage réciproquement le secteur
événementiel et l’État dans la gestion responsable des
déchets. Les objectifs fixés ainsi que les contreparties
demandées sont très flexibles, ils concernent la transition
vers l’économie circulaire et en particulier :
Dans ce contexte, de nombreuses actions ont été menées en
2025 avec des associations structurantes telles que :
ٱMise en place d'un partenariat Je ne suis pas un Handicap
et Okeenea.
ٱSignature d’une convention avec l’AGEFIPH et
contractualisation avec Clever Connect pour favoriser
l'emploi des personnes en situation de handicap.
— La réduction à la source des déchets et l’amélioration
de leur valorisation
— Le développement du réemploi
— La réduction du gaspillage alimentaire
Le Groupe a également contribué à la
mise à jour du référentiel de la norme
ISO 20121 : 2024 ; ISO 20121 est une
référence en matière de management
responsable de l'activité événementielle.
En 2025, 35% du chiffre d’affaires du Groupe est couvert
par au moins une certification ISO.
GL EVENTS RAPPORT D'ACTIVITÉ 2025 / GL EVENTS, LE GROUPE / 159
THE CAMP - POUZILHAC, FRANCE
GL EVENTS RAPPORT D'ACTIVITÉ 2025 / GL EVENTS, LE GROUPE / 161
DUODAY - BRIGNAIS, FRANCE
RESSOURCES HUMAINES
« Les équipes RH sont pleinement
mobilisées pour accompagner
les transformations et les
développements rapides du Groupe,
en sachant que le capital humain
est ce qu’il a de plus précieux. »
FANNY CHAVAUX
DIRECTRICE DES RESSOURCES HUMAINES
Après des exercices marqués par une forte mobilisation
des équipes et des transformations rapides, le contexte RH
en France comme à l’international appelle à consolider les
fondamentaux, tout en préparant l’ouverture de nouveaux
chantiers. Dans un environnement économique et
géopolitique incertain, la priorité est restée claire : sécuriser les
parcours, accompagner la croissance du Groupe et préserver
ce qui fait la singularité humaine de GL events. L’année
2025 est de ce fait placée sous le signe de la continuité et
de la structuration pour la fonction Ressources Humaines.
L'intégration réussie des nouveaux collaborateurs :
un enjeu clé
Reflet de l’activité du Groupe et de celle de ses filiales,
la dynamique de l’année a été fortement marquée par
l’intégration de nouveaux collaborateurs et de nouveaux
périmètres. Chaque arrivée constitue une richesse, à la fois
humaine et culturelle, mais aussi un enjeu d’intégration et
de transmission. En 2025, une part importante du travail
RH a ainsi porté sur le processus d’intégration : structurer
les parcours d’intégration (onboarding), clarifier les repères,
transmettre les codes, les valeurs et la culture du Groupe.
Cette démarche, déclinée au niveau des structures ou
des projets sous une formule repensée, a vocation à se
déployer progressivement à l’international, à mesure que
le réseau se développe et que les projets se multiplient
sur tous les continents.
La marque employeur – trait d’union entre tous les
continents et socle d’une entreprise durablement
multiculturelle
La formalisation de la marque employeur s’est imposée comme
un socle essentiel. Elle ne se limite pas à un discours : elle vise à
expliciter ce que signifie travailler au sein d’une des structures
du groupe GL events, ce qui fédère les équipes, ce que l’on
attend d’un manager, la manière dont les responsabilités
sont confiées et la place laissée à l’initiative, à l’autonomie
et aux responsabilités. Cette clarification est indispensable
pour accompagner les évolutions managériales, soutenir la
fidélisation et permettre la transmission intergénérationnelle
du savoir-faire. Dans un Groupe où les carrières se construisent
souvent au fil des projets et des opportunités, l’enjeu est de
donner de la lisibilité sans rigidifier les parcours.
La dimension multiculturelle est devenue un axe structurant.
Le développement international du Groupe, l’intensification
des projets multi-pays et la diversif ication des zones
d’intervention imposent une montée en maturité sur ces
sujets. En 2025, les premières pierres ont été posées : penser
systématiquement les dispositifs RH dans leur déclinaison
internationale, renforcer la maîtrise de la donnée RH à
l’échelle mondiale, et amorcer une réflexion sur une identité
employeur partagée, capable de faire le lien entre des
cultures, des pratiques et des attentes différentes. Cette
approche multiculturelle constitue un noyau commun,
GL EVENTS RAPPORT D'ACTIVITÉ 2025 / GL EVENTS, LE GROUPE / 163
JOBS DATING, GLOBAL INDUSTRIE - PARIS, FRANCE
ciment d’un travail en équipe, partout dans le monde. Le
partage de cette culture peut faire l’objet de dispositifs
spécifiques. Ainsi, à l’approche des Asian Games 2026 d’Aichi
Nagoya au Japon, les équipes projet ont été sensibilisées à
la culture japonaise : clés de lecture, usages professionnels,
compréhension des codes du quotidien. L’objectif est
clair : éviter les incompréhensions, fluidifier les relations et
améliorer les conditions de travail sur des projets de plus en
plus exigeants. Cette approche a vocation à être structurée
et pérennisée, afin d’industrialiser l’accompagnement des
équipes internationales, tant sur les aspects professionnels
que sur l’équilibre de vie.
Diversité, inclusion et qualité de vie au travail :
des actions de fond
Les sujets de diversité, d’inclusion et de qualité de vie au
travail ont continué de faire l’objet d’un travail de fond. En
2025, les actions se sont concentrées notamment sur le
handicap, avec un effort important de sensibilisation des
managers, d’accompagnement administratif et de pédagogie
interne. Ces démarches ont permis d’accompagner de
nouveaux collaborateurs et de libérer la parole sur ces
sujets. Elles s’inscrivent dans une logique de continuité,
avec l’ambition d’élargir progressivement le périmètre de
réflexion au-delà du handicap.
Expertise et compétences : la formation comme levier
Plus largement, la formation a occupé une place centrale.
Dans un monde en constante mutation, alors que les
métiers évoluent tout comme les outils, l’accompagnement
des collaborateurs dans l’acquisition de compétences est
fondamental. L’essor de l’intelligence artificielle a donné
lieu à un premier temps de sensibilisation large, destiné
à donner des repères communs aux collaborateurs et aux
managers. L’enjeu n’est pas de former des experts, mais de
permettre à chacun de comprendre les usages possibles,
d’identifier ses besoins et de construire, par métier, une
feuille de route adaptée. Cette démarche, engagée en
2025, se poursuivra en 2026 avec une approche plus ciblée
par fonctions.
Enfin, la transversalité est apparue comme un enjeu majeur.
La structuration d’une communauté RH internationale,
formée à un rôle de partenaires stratégiques, vise à
décloisonner les pôles et à créer un langage commun.
Dans un Groupe où les zones géographiques prennent
une place croissante, l’enjeu est désormais d’articuler
efficacement la logique des pôles avec celle des territoires,
pour accompagner une croissance durable et cohérente.
Au cœur de ces chantiers, une conviction demeure : la
force de GL events repose sur ses équipes. Transmettre une
culture, accompagner des parcours, valoriser les talents et
donner envie de s’inscrire dans la durée constituent les
leviers essentiels de la performance humaine et collective
du Groupe.
GL EVENTS RAPPORT D'ACTIVITÉ 2025 / GL EVENTS, LE GROUPE / 164
RESSOURCES HUMAINES
Les valeurs du groupe GL events
Esprit pionnier
Oser explorer de nouvelles voies,
innover avec audace et ouvrir la
voie vers l’avenir, chez GL events
nous sommes tous développeurs
et tous entrepreneurs.
Solidarité
Ingéniosité
Avancer ensemble, réussir en
unissant nos forces et jouer sur
nos complémentarités, voilà notre
mentalité.
Trouver des solutions créatives
et efficaces là où d’autres voient
des obstacles, tel est l’état d’esprit
qui nous anime.
Passion
Mettre tout notre cœur, notre
expertise et notre énergie pour créer
des expériences ou des rencontres
mémorables et vibrantes, c’est
notre point commun.
GL EVENTS RAPPORT D'ACTIVITÉ 2025 / GL EVENTS, LE GROUPE / 165
RELATIONS INSTITUTIONNELLES
BRUNO LARTIGUE
SECRÉTAIRE DU COMITE EXÉCUTIF,
DIRECTEUR DES RELATIONS INSTITUTIONNELLES
L’année 2025 s’inscrit dans la continuité directe de la trajectoire
engagée par le Groupe depuis plus d’une décennie. Après les
grands succès opérationnels de 2024, marqués notamment
par les Jeux olympiques et paralympiques de Paris, l’enjeu
est désormais de consolider cet héritage et de prolonger
la dynamique engagée au service du développement des
territoires.
Aujourd’hui, les activités du Groupe, qu’il s’agisse des
infrastructures opérées par GL events Venues, des grandes
opérations menées par GL events Live ou des salons organisés
par GL events Exhibitions, participent pleinement à cette
dynamique. L’événementiel constitue en effet un levier puissant
d’attractivité pour les territoires, au croisement du tourisme,
du sport, de la culture et du développement économique.
Chaque événement, qu’il soit sportif, culturel, professionnel ou
grand public, génère des retombées multiples : fréquentation
touristique, dynamisme économique local, rayonnement
international et mobilisation des acteurs locaux.
Dans ce contexte, le rôle de GL events dépasse largement
celui d’un opérateur technique. Le Groupe agit comme un
partenaire des collectivités et des institutions publiques
dans la mise en œuvre de politiques d’attractivité et de
développement territorial. L’événement devient ainsi un
outil stratégique au service de l’image, de l’économie et de
la vitalité sociale des territoires.
L’année 2025 marque une étape importante dans la
valorisation de la filière événementielle dans son ensemble.
Longtemps perçue comme une activité ponctuelle ou
conjoncturelle, cette filière s’affirme désormais comme
un véritable secteur économique structurant. Elle mobilise
une chaîne de valeur très large, allant de l’ingénierie
événementielle à la logistique, en passant par l’hospitalité,
la production, les infrastructures et les services associés.
Les Jeux olympiques et paralympiques d’hiver de Milan
Cortina 2026 constituent une nouvelle étape importante. Ils
illustrent la continuité de l’engagement du Groupe dans les
grands événements sportifs internationaux, mais également
sa capacité à adapter ses expertises à des contextes très
différents, qu’il s’agisse d’environnements urbains ou de
sites alpins particulièrement exigeants.
Au-delà de ces échéances immédiates, la réflexion s’inscrit
déjà dans une trajectoire plus longue, notamment en
vue des Jeux olympiques et paralympiques des Alpes
françaises en 2030. Cette perspective ouvre une nouvelle
phase de préparation et de coordination entre les différents
acteurs publics et privés concernés. L’expérience acquise
ces dernières années constitue un atout précieux pour
accompagner cette ambition et contribuer à structurer un
projet cohérent à l’échelle des territoires alpins.
Dans cette dynamique, l’événementiel apparaît plus
que jamais comme un vecteur de transformation et de
développement. Pour GL events, l’enjeu des prochaines
années consiste ainsi à poursuivre cette trajectoire en
consolidant les relations institutionnelles qui ont été bâties
au fil des projets, tout en continuant à démontrer la capacité
du Groupe à accompagner des initiatives ambitieuses et
structurantes.
GL EVENTS RAPPORT D'ACTIVITÉ 2025 / GL EVENTS, LE GROUPE / 166
SÉCURITÉ & SÛRETÉ
PASCAL ESTÈVE
DIRECTEUR DE LA SÛRETÉ GLOBALE GROUPE
Dans un environnement international caractérisé par une
évolution constante des risques et des menaces, la sécurité
et la sûreté constituent un enjeu stratégique pour GL events.
La diversité de nos événements organisés, la variété de nos
infrastructures et l'implantation du Groupe dans de nombreux
pays nécessitent une approche désormais structurée et
anticipative de la sûreté. Le Groupe GL events a ainsi décidé
de renforcer sa capacité à faire face aux défis de sécurité
croissants, tant au niveau national qu'international, en
créant en 2023 une direction de la sûreté globale. Son rôle
principal est de contribuer activement à la protection de
nos salariés, de nos actifs, de nos activités, et de veiller à la
préservation de notre réputation dans un environnement
devenu complexe.
Placée au cœur de la gouvernance des risques, cette direction
définit et pilote la politique de sûreté du Groupe à l’échelle
internationale. Elle agit naturellement de manière transverse
au profit des trois pôles de GL events. Ses missions couvrent
l’identification et l’analyse des menaces, la prévention des
actes malveillants, la protection des personnes et des actifs,
la sécurisation des événements et des sites, ainsi que la
préparation et la gestion des situations de crise.
À travers ces actions, cette direction contribue à renforcer
la résilience du groupe et la conf iance de l'ensemble
des parties prenantes. Elle participe ainsi pleinement à
l’ambition du groupe de garantir des événements et des
infrastructures répondant aux plus hauts standards de
sûreté et de sécurité, et propose des événements et des
sites toujours plus sûrs, responsables et exemplaires. La
poursuite du déploiement de cette stratégie constitue
un axe structurant pour les années à venir, au service de
la performance durable et de la réputation du groupe.
L’année 2025 marque une étape importante dans le
déploiement et la consolidation de cette nouvelle politique
de sûreté par la multiplication des audits de sûreté des sites
exploités en France et à l'international et la structuration
d’un réseau de correspondants sûreté au sein des principales
entités du Groupe, facilitant ainsi la remontée d’informations
et la mise en œuvre des dispositifs opérationnels. La
coopération avec les autorités publiques et les services
intérieurs de sécurité a également été renforcée, favorisant
une préparation concertée des événements et une gestion
efficace des situations sensibles. Citons les partenariats
conclus avec le GIGN et la Garde nationale.
En 2025, cette direction a également accompagné plusieurs
événements d’envergure nationale et internationale, en
apportant son expertise dans l'ingénierie et la coordination
des dispositifs de sécurité, notamment au profit des plus
importants salons organisés par le groupe ou la préparation
des Jeux olympiques de Milan-Cortina.
GL EVENTS RAPPORT D'ACTIVITÉ 2025 / GL EVENTS, LE GROUPE / 167
JURIDIQUE & COMPLIANCE
« La direction juridique et
compliance, levier de sécurisation
et de performance pour les équipes,
les biens et les projets du Groupe. »
PATRICIA SADOINE
DIRECTRICE JURIDIQUE ET COMPLIANCE GROUPE
La Direction Juridique & Compliance de GL events accompagne
le développement du Groupe dans un environnement
réglementaire de plus en plus exigeant, en France comme
à l’international. Organisée autour d’expertises spécialisées
et de relais opérationnels de proximité, elle intervient sur un
périmètre large couvrant le droit des affaires, le droit public,
le droit de la construction, les assurances, la conformité, la
protection des données et la propriété intellectuelle. Son
rôle est d’anticiper les risques, de sécuriser les projets et de
permettre aux équipes opérationnelles de se concentrer sur
l’exécution et la performance.
Une expertise proche du terrain pour répondre à
la complexité des projets
En 2025, les enjeux du service se sont inscrits dans un contexte
de complexification accrue des cadres réglementaires et
contractuels. Pour y répondre, la Direction Juridique a poursuivi
l’adaptation de son organisation. De nouvelles expertises ont
été intégrées, notamment en droit public et en droit de la
construction, afin d’apporter un accompagnement plus fin
et plus réactif aux métiers. Les sujets de conformité, incluant
la loi Sapin 2 et le RGPD, ont été regroupés sous un pilotage
unique, permettant une approche globale et cohérente des
obligations du Groupe, en France comme à l’international.
Cette structuration a renforcé la capacité du service à
intervenir en amont des projets. Les équipes juridiques
sont désormais pleinement intégrées dès les phases de
conception de grands dossiers internationaux, notamment
sur les projets liés aux Jeux olympiques et paralympiques
de Milan-Cortina, aux Jeux asiatiques et para-asiatiques
d’Aichi Nagoya et à l’Exposition universelle d’Osaka. Sur
ces opérations à forts enjeux, des contract managers ont
été mobilisés sur site, en lien permanent avec le siège, afin
d’assurer la protection des intérêts du Groupe tout au long du
cycle contractuel, de la négociation à l’exécution. Alors que
les échanges contractuels sont de plus en plus formalisés,
le rôle des juristes en charge des contrats, directement
intégrés aux équipes est devenu essentiel pour sécuriser les
projets, soulager les opérationnels et garantir une exécution
conforme des engagements.
Un accompagnement sur mesure des équipes métiers
L’accompagnement des pôles s’est également renforcé sur
des projets structurants. Les équipes de gestion des sites
événementiels ont été secondées sur des appels d’offres
majeurs, notamment autour du Stade de France ; le pôle
Exhibitions a bénéficié d’un appui juridique sur des opérations
d’acquisition et de restructuration, en particulier en Chine
et en Europe, tandis que le pôle Live a été accompagné
dans sa réorganisation interne, sur un modèle aligné avec
les autres pôles, ainsi que dans la gestion de contentieux.
Sur l’ensemble des activités, le juridique est de plus en plus
sollicité comme un partenaire de confiance, intégré aux
équipes projets.
GL EVENTS RAPPORT D'ACTIVITÉ 2025 / GL EVENTS, LE GROUPE / 168
JURIDIQUE & COMPLIANCE
HSIE - HARBIN, CHINE
Protection des marques et des biens
La gestion des risques assurantiels est une autre compétence
clé du service juridique en qualité de partenaire stratégique
des équipes opérationnelles. Un nouveau programme
d’assurance a été conçu sur mesure pour le Groupe,
permettant une couverture uniforme des actifs, depuis
leur sortie des entrepôts jusqu’à leur retour. Ce dispositif
global remplace une multiplicité de programmes locaux
et contribue à mieux protéger les intérêts de GL events sur
des projets de grande envergure, tout en apportant une
meilleure lisibilité aux opérationnels.
La protection du portefeuille de marques s’inscrit également
au cœur des missions du service. Dans un contexte de
visibilité croissante du Groupe et de ses dirigeants, des
actions renforcées ont été mises en place en lien avec
des cabinets spécialisés afin de sécuriser les marques,
les signes distinctifs et le positionnement du Groupe sur
ses marchés. Cette vigilance participe pleinement à la
protection globale de l’entreprise.
Déploiement de la culture de conformité et
anticipation des sujets émergents
Sur le plan de la compliance, 2025 a marqué une nouvelle
étape dans la diffusion de la culture de conformité. Les
obligations issues de la loi Sapin 2 sont désormais bien
identifiées par les opérationnels, grâce à des actions de
formation régulières et à une information partagée au sein
des comités d’audit. Le dispositif s’est également renforcé
à l’international, avec l’arrivée d’un responsable compliance
en Asie et un relais assuré par les équipes juridiques locales
en Amérique latine. Les processus d’évaluation des tiers
ont été intégrés en amont des grands projets, en lien étroit
avec les achats, afin d’adapter les pratiques aux risques
spécifiques de chaque opération.
Les sujets émergents font également l’objet d’une attention
particulière. L’intelligence artificielle constitue un nouveau
champ d’intervention pour la Direction Juridique, tant du
point de vue des outils que des usages. L’enjeu est de tirer
parti de ces technologies tout en conservant un esprit
critique et une capacité d’analyse.
À l’issue de l’exercice 2025, la Direction Juridique & Compliance
apparaît comme un pilier structurant. Par la spécialisation
de ses équipes, son intégration en amont des projets et
sa capacité à répondre à des besoins sur mesure, elle
contribue à sécuriser la croissance du Groupe et à préparer
les évolutions à venir dans un environnement réglementaire
et contractuel en constante mutation.
GL EVENTS RAPPORT D'ACTIVITÉ 2025 / GL EVENTS, LE GROUPE / 169
JURIDIQUE & COMPLIANCE
des attestations et des niveaux de
couverture. Pendant les phases de
montage et d’exploitation, elle gère
les sinistres éventuels, coordonne
les expertises, met en place les
mesures conservatoires et sécurise
les responsabilités. Son intervention
se prolonge en phase de démontage
et parfois bien au-delà.
ANNE-CLAUDE PINGET
DIRECTRICE ASSURANCE GROUPE
« En 2025, la fonction
assurance a poursuivi
sa structuration
comme véritable
partenaire transverse
au service des trois
pôles et des opérations
internationales du
Groupe. »
Son rôle ne se limite pas à la
souscription de polices : elle intervient
tout au long du cycle de vie des projets,
de la réponse aux appels d’offres
jusqu’aux phases post-événement.
Ainsi l’équipe assurance est mobilisée
dès les premières démarches
contractuelles, qu’il s’agisse d’appels
à candidatures, de concessions ou de
négociations avec des collectivités
ou des États. Elle accompagne
ensuite la prise en jouissance des
sites, en garantissant la conformité
L’année 2025 a été marquée par
plusieurs projets internationaux
structurants. À Osaka, des solutions
assurantielles spécifiques ont été
conçues pour répondre aux exigences
légales japonaises et aux attentes
du client, notamment en matière
de responsabilité civile construction
et d’assurances de personnes. La
préparation des Jeux Asiatiques et
Para-Asiatiques d’Aichi Nagoya 2026
a également mobilisé l’équipe dès
2025, avec l’anticipation des besoins
liés au recrutement de près de 1 600
collaborateurs et à la conformité
aux régulations locales. Dans ces
contextes, des assureurs locaux
sont intégrés comme véritables
partenaires : les projets leur sont
présentés en détail afin de sécuriser
leur engagement et d’adapter les
couvertures au profil de risque réel.
Un fait marquant de 2025 réside dans
la mise en place d’un programme
d’assurance matériels uniforme à
l’échelle mondiale pour le pôle Live.
Ce dispositif inclut les garanties
dommages matériels et pertes
d’exploitation. Il s’active dès la
sortie des entrepôts et se poursuit
pendant les étapes de transport, de
stockage intermédiaire, de montage,
d’exploitation et de démontage,
jusqu'au retour des matériels. Cette
couverture homogène simplif ie
considérablement le travail des
équipes opérationnelles, et permet
une meilleure prévisibilité des
coûts, élément déterminant sur des
événements d’envergure tels que
les COP ou les événements sportifs
internationaux.
Au-delà des dispositifs techniques,
la fonction assurance joue un
rôle clé dans la relation client. Elle
intervient principalement en phase
de négociation contractuelle et lors
des expertises, afin de rassurer les
partenaires sur la capacité du Groupe
à gérer les risques et à traiter les
sinistres. Elle agit également comme
point d’appui permanent pour les
opérationnels, les aidant à évaluer les
niveaux de sécurisation nécessaires,
à arbitrer les responsabilités et à
anticiper les impacts financiers.
Composée de trois juristes, l’équipe
fonde son efficacité sur une solide
capacité d’analyse contractuelle, une
grande agilité et une proximité forte
avec les métiers. Comprendre les
enjeux opérationnels, parler le même
langage que les équipes terrain et
adapter en permanence les priorités
sont des compétences essentielles.
Cette approche intégrée permet
de dépasser une vision strictement
technique de l’assurance pour en
faire une fonction opérationnelle,
pleinement alignée avec la complexité
et l’internationalisation croissante des
projets du Groupe.
GL EVENTS RAPPORT D'ACTIVITÉ 2025 / GL EVENTS, LE GROUPE / 170
JURIDIQUE & COMPLIANCE
droit de la concurrence et à
terme devoir de vigilance) et la
réglementation du numérique
(données personnelles, intelligence
artif icielle, cybersécurité). Ces
expertises sont portées par quatre
collaborateurs structurés en binômes
par grands périmètres métiers :
Corporate, GL events Live et GL events
Sports d’une part, GL events Venues
et GL events Exhibitions d’autre part.
Ce dispositif est complété par un
ancrage international renforcé. Une
collaboratrice basée à Shanghai nous
a rejoint pour couvrir la zone Asie et
nous poursuivons notre collaboration
étroite avec l’équipe compliance
basée au Brésil.
MATTHIEU DULLIN
RESPONSABLE COMPLIANCE &
DPO GROUPE
« En 2025, la fonction
Compliance du Groupe
a franchi une étape
structurante avec une
réorganisation complète
destinée à accompagner
l’intégralité du groupe,
en France comme à
l’étranger, et à prendre en
compte l’élargissement
du périmètre d’activité. »
L’enjeu n’était pas de refondre les
principes existants, mais de les
déployer de manière homogène,
opérationnelle et adaptée à
l’ensemble des entités et des zones
géographiques.
L’organisation repose désormais sur
deux piliers clairement identifiés :
l’éthique des affaires (anticorruption,
En parallèle, un réseau de référents
locaux se constitue progressivement
dans plusieurs pays. Ces référents, des
juristes déjà intégrés aux entités,
assurent le déploiement des
programmes Groupe au plus près
du terrain.
Parallèlement, la mise en place
d’un réseau de points de contact
au sein des filiales vise à fluidifier
la circulation de l’information et à
ancrer la culture conformité dans
les équipes opérationnelles.
Pour structurer cette démarche,
deux outils ont été créés en début
d’année 2026 : une carte d’identité
par entité, permettant d’identifier
les activités, les implantations, les
interlocuteurs et outils clés ainsi
que des indicateurs de risques et
une checklist transversale couvrant
les principales actions à mettre en
œuvre. Cette approche permet de
qualifier les risques, prioriser les
actions et adapter le socle Groupe
aux spécificités locales.
Au-delà de l’organisation, 2025 a
confirmé l’intégration croissante de
la Compliance en amont des projets.
Sur des opérations majeures comme
les Jeux d’hiver de Milan Cortina,
les Jeux asiatiques d’Aichi Nagoya
ou l’Exposition universelle d’Osaka,
l’équipe est intervenue dès les phases
préparatoires : évaluations d’intégrité
des par tenaires, a daptation
des processus aux exigences
contractuelles spécifiques, contrôle
des flux de données, formation
ciblée des équipes projet. Chaque
grand projet bénéficie désormais
d’un référent Compliance identifié,
impliqué dès l’appel d’offres et tout
au long de l’exécution.
L’a cco m p a g n e m e n t s ’é te n d
également aux opérations de
croissance externe avec une
implication du service Compliance
dans les démarches de due diligence.
L’objectif est d’identifier les facteurs
de risque le plus en amont possible
et d’entrer dans les opérations avec
des plans d’action clairs.
Dans un environnement marqué
par la multiplication des normes
et l’augmentation des sanctions,
l’approche retenue repose sur la
gestion par les risques et la volonté
d’apporter un accompagnement
pragmatique. La Compliance
ne se positionne pas comme
un f rein, mais comme un cadre
structurant permettant de sécuriser
les projets, protéger la réputation
et accompagner durablement la
croissance du Groupe.
Pour 2026, plusieurs chantiers
structurants sont engagés : poursuite
du déploiement du règlement
européen sur l’intelligence artificielle,
lancement d’un programme
Groupe en droit de la concurrence
et anticipation de la directive
NIS2 en matière de cybersécurité.
Le renforcement du maillage
international et la montée en maturité
des dispositifs locaux constitueront
également des priorités.
GL EVENTS RAPPORT D'ACTIVITÉ 2025 / GL EVENTS, LE GROUPE / 171
OPEN AIR - SALVADOR, BRÉSIL
GL EVENTS RAPPORT D'ACTIVITÉ 2025 / GL EVENTS, LE GROUPE / 173
ABRINT - SÃO PAULO, BRÉSIL
SYSTÈME D'INFORMATION, DATA ET DIGITAL
« La gestion des données
et l’IA sont indéniablement
des leviers structurants pour
les activités du Groupe. »
DENIS TOMASICCHIO
DIRECTEUR DES SYTÈMES D'INFORMATION GROUPE
Le système d’information de GL events poursuit sa trajectoire
de transformation, au service de la performance, de la
sécurité et de l’accompagnement des métiers. Après
une phase de structuration et de digitalisation intense,
l’enjeu est moins la recherche de nouveaux outils, que le
déploiement, l’adoption et l’optimisation des usages des
SI et de la data. La DSI du Groupe couvre un périmètre
élargi, de la Digital Data au SI, avec une équipe riche de
compétences techniques, applicatives et transverses, au
service des trois pôles et d’une présence géographique
étendue.
Une organisation structurée autour des besoins
des métiers
2025 a été marquée par un renforcement de l’organisation
de la DSI afin de répondre à l’innovation, la diversité des
métiers, comme les usages et les obligations. La gouvernance
des systèmes d’information métiers a été consolidée,
notamment avec la nomination d’un directeur SI métier
dédié au pôle Live, pour accompagner les déploiements
et des transformations en cours de son SI. De même les
équipes en charge du système d’information financier
ont également été renforcées, par un rapprochement des
équipes d’assistance à maîtrise d’ouvrage finance et des
équipes techniques. Cette réorganisation nous permet
de déployer plus rapidement à l’international avec une
maîtrise complète de la gestion des flux financiers. Enfin une
équipe data-flux-IA a été créée et enrichie de compétences
techniques dans un secteur à très forte innovation et aux
enjeux majeurs. Une modernisation complète des moyens
de captation et de traitement de la donnée est lancée,
s’appuyant sur des technologies récentes, sécurisées et
dont les usages peuvent être démultipliés, notamment
par l’utilisation de l’IA.
En matière de projets, l’année a été marquée par de
forts enjeux d’intégration et de déploiement du système
d’information dans les différentes entités du Groupe. Des
travaux structurants ont été menés (déploiements de
référentiels, contrôles de qualité des datas, sécurisation de
processus…) pour contribuer à améliorer la performance
globale. Des efforts particuliers ont également été portés sur le
CRM Groupe, l’écosystème digital et le système d’information
financier, avec un objectif clair : enrichir l’expérience client,
fluidifier les parcours commerciaux et renforcer la capacité
du Groupe à mieux connaître, identifier et accompagner
ses clients sur un périmètre géographique étendu.
La maîtrise de la donnée, un levier de création de valeur
La gestion des données constitue aujourd’hui un enjeu
central. L’accélération des usages de l’IA dans les processus
métiers (communication, marketing, commerce, logistique,
fonctions administratives, RH, RSE ou juridique), rend
indispensable une maîtrise renforcée de la qualité, de
GL EVENTS RAPPORT D'ACTIVITÉ 2025 / GL EVENTS, LE GROUPE / 175
SYSTÈME D'INFORMATION, DATA ET DIGITAL
l’accessibilité, de la sécurisation et de la gouvernance des
données. Dans un contexte de multiplicité des métiers,
des pays et des logiciels, la mise en qualité de la donnée
représente un chantier majeur. Elle conditionne la capacité
à prendre des décisions éclairées, à mieux comprendre les
attentes des clients et à optimiser les opérations. La donnée
s’avère un levier direct de création de valeur, indissociable
des enjeux de conformité réglementaire et de protection,
notamment au regard du RGPD.
L'Intelligence Artificielle : une approche maîtrisée
et structurée
Parallèlement, l'intelligence artificielle est un moteur de
transformation structuré, dans le cadre d'une approche
contrôlée et d’une mise en œuvre progressive. À travers
le programme « AI for you », trois axes prioritaires ont
été définis. Le premier concerne la gouvernance et la
sécurité, avec la mise en place d’un comité IA, d’une charte
dédiée et de dispositifs de contrôle visant à protéger le
patrimoine informationnel du Groupe. Le deuxième axe
porte sur l’acculturation, menée en lien étroit avec les
équipes communication et ressources humaines, afin de
sensibiliser managers et collaborateurs aux enjeux de l’IA
et de favoriser une appropriation progressive, quelle que
soit la génération. Enfin, un travail de collecte et d'analyse
des cas d’usage a été engagé pour recenser, partager et
déployer les initiatives métiers de manière sécurisée, tout
en maîtrisant les coûts.
Les perspectives à court et moyen terme s’inscrivent dans
une logique d’industrialisation ciblée. L’IA est appelée à
jouer un rôle croissant dans l’amélioration de la productivité,
en libérant les équipes des tâches chronophages grâce à
des assistants intégrés aux outils du quotidien. Couplée au
Data Hub, elle vise également à renforcer la performance
commerciale par des offres plus personnalisées et une
meilleure anticipation des besoins événementiels. Enfin,
le développement de modèles d’analyse prédictive doit
contribuer à optimiser la logistique, la gestion des actifs
sur site et l’anticipation des flux.
La cybersécurité, une priorité renforcée
Face à l’augmentation des exigences en matière de
cybersécurité, 2025 a marqué une nouvelle étape dans
le déploiement du programme engagé depuis 2022.
Structurée autour des principes de la norme ISO 27001, la
politique cybersécurité du Groupe repose sur cinq axes :
ٱgouvernance et gestion des risques,
ٱgestion des identités et des accès,
ٱprotection des données,
ٱsécurité opérationnelle
ٱréponse aux incidents.
Concrètement, cette démarche se traduit par des actions sur
les processus, des formations utilisateurs, des dispositifs de
surveillance, des audits réguliers et des exercices de gestion
de crise. L’utilisation de l’IA permet désormais d’accroître
les capacités de détection et la rapidité de réaction, en
réponse à des attentes clients de plus en plus élevées en
matière de sécurisation des données.
La réduction de l’empreinte environnementale du système
d’information constitue également un enjeu structurant.
Dans un contexte de montée en puissance de l’IA et de
la digitalisation, des efforts sont poursuivis pour limiter
la consommation énergétique, à travers des choix de
matériels et de prestataires cloud plus responsables. Le
pilotage des ressources s’appuie sur des expertises DevOps
et FinOps, tandis que la sélection de solutions matérielles
et logicielles favorise une durée d’exploitation allongée et
une meilleure réparabilité.
L’année 2025 a illustré la capacité des équipes DSI à
accompagner le Groupe dans des contextes à forts enjeux.
Les intégrations du Parc Chanot de Marseille et du Stade
de France ont été menées dans des délais très contraints,
avec un haut niveau d’exigence en matière de disponibilité,
de performance et de sécurité. Ces projets illustrent
l’engagement collectif des équipes, prêtes à aborder 2026
au plus près des besoins du Groupe et à relever de nouveaux
défis dans un environnement en constante évolution.
GL EVENTS RAPPORT D'ACTIVITÉ 2025 / GL EVENTS, LE GROUPE / 176
SYSTÈME D'INFORMATION, DATA ET DIGITAL
L’année 2025 a été marquée par
un projet majeur, la réforme de la
facturation électronique, notamment
en Belgique. Cette obligation
réglementaire, entrée en vigueur au
1er janvier 2026, a été abordée comme
une opportunité de modernisation
du modèle finance. Le passage d’un
format PDF ou papier à un format
structuré (XML) a impliqué une
revue approfondie des processus
Order-to-Cash (cycle commandepaiement) et Procure-to-Pay (cycle
achats-paiement), ainsi qu’un travail
de fiabilisation des données de base,
notamment les référentiels clients
et fournisseurs.
GÉRALDINE MEHA
DIRECTRICE DES PROJETS
FINANCE, DSI
« En 2025, la fonction IT
Finance a franchi
une étape structurante
dans l’accompagnement
de la transformation
du Groupe. »
L’enjeu était de consolider les
fondations du système d’information
finance afin de soutenir durablement
la performance, la conformité et la
croissance externe.
La création d’une fonction transverse
IT Finance, à l’interface entre les
équipes financières et la DSI, a permis
de renforcer ce lien stratégique
entre métier et technologie. Cette
organisation favorise une approche
de bout en bout des processus
financiers, de l’émission de la facture
au recouvrement, de la commande
fournisseur au paiement, avec un
objectif clair : sécuriser les flux tout
en fluidifiant les opérations.
Au-delà de la mise en conformité
fiscale, le projet a permis de renforcer
la traçabilité des flux f inanciers,
d’améliorer le contrôle interne et
de sécuriser les enjeux de cash,
particulièrement sensibles pour
un groupe en forte dynamique
de développement. Les ERP ont
été adaptés et les interfaces interapplicatives consolidées af in de
garantir la qualité des échanges vers
les plateformes fiscales.
Conduit comme un véritable projet
d’entreprise, et non comme un simple
chantier IT, le déploiement s’est
appuyé sur une équipe transverse
associant DSI, finance et métiers,
ainsi que sur un cabinet externe.
En Belgique, un réseau de référents
locaux a été structuré afin d’assurer
la montée en compétence des
équipes et la pérennité des bonnes
pratiques. Une démarche similaire
sera déployée en France, où plusieurs
entités du Groupe ont été intégrées
par anticipation au calendrier
réglementaire de septembre 2026.
Parallèlement, 2025 a confirmé la
capacité de l’équipe IT Finance à
accompagner la croissance externe
du Groupe. Les intégrations du Parc
Chanot à Marseille et du Stade de
France ont été menées dans des
délais contraints, avec un haut
niveau d’exigence opérationnelle. Les
équipes ont assuré un déploiement
rapide des outils finance, tout en
accompagnant étroitement les
utilisateurs, y compris dans des
périodes sensibles d’activité.
La donnée constitue indéniablement
un actif stratégique. L’ERP SAP, socle
du système d’information financier,
a été renforcé afin d’améliorer la
qualité, la cohérence et l’exploitabilité
des informations. L’objectif est de
simplifier les processus pour les
équipes opérationnelles et de
fournir aux directions des données
fiables pour éclairer les décisions
stratégiques.
Enfin, la cybersécurité et la protection
des flux financiers ont fait l’objet
d’une vigilance accrue. Le choix
des partenaires et des solutions a
intégré des critères stricts de sécurité,
dans un contexte où les échanges
dématérialisés se multiplient.
En 2025, l’IT Finance a posé des
bases solides pour accompagner la
croissance du Groupe et moderniser
durablement ses processus financiers,
ouvrant la voie à de nouvelles
innovations en 2026.
GL EVENTS RAPPORT D'ACTIVITÉ 2025 / GL EVENTS, LE GROUPE / 177
SYSTÈME D'INFORMATION, DATA ET DIGITAL
et mettre en place une infrastructure
capable d’accompagner les besoins
croissants des métiers, en France
comme à l’international. Cette
transformation passe notamment
par la migration progressive vers
une architecture cloud et par la
mise en place d’un véritable Data
Hub, permettant de consolider et
d’exploiter les informations issues
des différents systèmes du Groupe.
JEAN-ARNAUD EYME
CHIEF DIGITAL & DATA OFFICER
« La donnée est devenue
un actif pour le Groupe. »
Dans un environnement où les
métiers, les outils et les volumes
d’informations se multiplient,
l’enjeu n’est plus simplement de
collecter des données, mais de les
structurer, de les sécuriser et de les
rendre réellement exploitables pour
accompagner les décisions et la
performance opérationnelle. L’année
2025 a marqué une étape importante
dans cette transformation, avec
une accélération des projets liés à
la data et aux usages de l’intelligence
artificielle.
Depuis deux ans, la DSI a engagé un
programme de modernisation de la
plateforme data du Groupe. L’objectif
est de centraliser les données, de
fiabiliser les flux entre les applications
En 2025, plusieurs chantiers
structurants ont été menés pour
améliorer la qualité et la sécurité
des flux de données. Les anciennes
technologies sont progressivement
remplacées par des solutions
modernes et robustes, garantissant
une meilleure maintenance, fiabilité
et une capacité accrue à intégrer de
nouvelles sources de données et les
cas d'usage IA de demain.
Pour les métiers, les bénéfices sont
immédiats. La donnée devient plus
accessible, les délais de traitement
sont réduits et les analyses peuvent
être réalisées plus rapidement.
Plusieurs cas d’usage ont ainsi été
déployés autour de la business
intelligence, notamment pour les
équipes marketing, f inance ou
ressources humaines, avec des
outils de reporting modernisés
permettant de mieux piloter
l’activité et d’anticiper les évolutions
des marchés. Cette structuration
renforce également la crédibilité du
Groupe auprès de ses partenaires
et investisseurs, en garantissant
un niveau élevé de fiabilité et de
gouvernance des données.
Dans la continuité de ces travaux
sur la donnée, 2025 a également
été une année fondatrice pour
les initiatives liées à l’intelligence
artificielle. Plutôt que de multiplier
les expérimentations isolées, le
Groupe a choisi de structurer sa
démarche autour d’un cadre clair,
associant gouvernance, acculturation
et déploiement progressif des usages.
Un comité IA a ainsi été mis en
place avec des représentants du
Comex afin de piloter les orientations
stratégiques et de prioriser les projets.
Parallèlement, une communauté IA
réunissant des collaborateurs issus
de différents métiers a été créée
pour partager les bonnes pratiques,
identifier les cas d’usage et diffuser
la culture de l’intelligence artificielle
au sein du Groupe.
Cette dynamique s’accompagne
d’un effort important de formation
et d’accompagnement. Plus de
1 800 collaborateurs ont déjà été
sensibilisés ou formés aux usages
de l’IA, à travers des webinaires, des
programmes d’e-learning et des
sessions dédiées aux managers.
L’objectif est de permettre à chacun
de comprendre les opportunités
offertes par ces technologies, tout
en maîtrisant les enjeux de sécurité
et de gouvernance associés.
Au-delà de l’acculturation, plusieurs
initiatives concrètes ont été lancées
pour intégrer l’IA dans les outils
du quotidien. Un portail interne
dédié à l’intelligence artificielle, le
GL events AI Hub, est actuellement
en phase de déploiement. Il permet
de centraliser les cas d’usage métiers
et de proposer aux collaborateurs
des services d’IA accessibles dans
un environnement sécurisé.
GL EVENTS RAPPORT D'ACTIVITÉ 2025 / GL EVENTS, LE GROUPE / 178
SYSTÈME D'INFORMATION, DATA ET DIGITAL
IMAGE GÉNÉRÉE PAR L’IA
Parmi les premières applications
figurent des outils de génération de
contenus, d’aide à la rédaction ou
encore des modules dédiés à certains
métiers, comme la génération de
visuels de stands ou l’assistance
à la rédaction de propositions
commerciales. L’objectif est double :
améliorer la productivité des équipes
tout en garantissant la maîtrise
des données et des coûts liés à
l’utilisation de ces technologies.
La structuration de la data et le
développement de l’intelligence
artif icielle ne constituent pas
seulement un enjeu technologique.
Ils participent directement à
la transformation du modèle
opérationnel de GL events. Une
donnée mieux maîtrisée permet
d’améliorer la connaissance
client, d’optimiser les opérations
et d’accompagner les décisions
stratégiques à l’échelle du Groupe.
À travers ces initiatives, la DSI
affirme ainsi son rôle de partenaire
des métiers et d’acteur clé de la
transformation numérique de
l’entreprise. Elle ouvre désormais la
voie à de nouveaux usages, au service
de la performance, de l’innovation
et de la compétitivité du Groupe.
GL EVENTS RAPPORT D'ACTIVITÉ 2025 / GL EVENTS, LE GROUPE / 179
ART EXPLORA - DURRES, ALBANIE
GL EVENTS RAPPORT D'ACTIVITÉ 2025 / GL EVENTS, LE GROUPE / 180
ART EXPLORA - PIRÉE, GRÈCE
PARTENARIATS & MÉCÉNATS
Partenariats & mécénats
Reflet de ses valeurs et de ses engagements sociaux et
environnementaux, l’approche de GL events en matière
de partenariat, mécénat et sponsoring privilégie trois
axes majeurs : l’insertion, la culture et l’héritage pour les
territoires des grands événements internationaux. Ainsi, le
groupe et ses entités, tout comme la Fondation GL events
s’inscrivent dans la durée pour soutenir des projets porteurs
de sens et les écosystèmes qui les portent.
Des partenariats au profit des territoires
Les partenariats et actions de mécénat de GL events sont
historiquement liés aux territoires dans lesquels le Groupe
est implanté et intervient. Ils traduisent une volonté d’agir
aux côtés d’acteurs associatifs, sportifs, culturels et sociaux
qui contribuent, chacun à leur échelle, à la dynamique et
à la cohésion locales et régionales.
Cette politique partenariale repose sur la conviction que
l’événement est catalyseur de rencontres fertiles et porteur
d’ouverture et d’engagement collectif. En accompagnant
des projets d’intérêt général, GL events participe à la mise
en relation de publics, de quartiers et de cultures. Il privilégie
des partenariats construits dans la durée, afin de soutenir
des actions concrètes et d’inscrire son engagement de
manière pérenne.
Face à la diversité des initiatives existantes, GL events a fait
le choix de la cohérence et de la continuité. Ce cadre lui
permet de s’engager de manière approfondie, aux côtés
de partenaires sérieux et investis, et de développer des
actions inscrites dans le temps long.
vise à aller à la rencontre des publics là où ils se trouvent.
À bord du premier bateau-musée itinérant au monde, le
festival Art Explora sillonne la Méditerranée et fait escale
dans les ports de quinze pays, proposant gratuitement des
expositions immersives, des performances artistiques et
des temps d’échange.
Aux côtés de la Fondation Art Explora, GL events s’engage
dans le cadre d’un soutien de mécénat, contribuant à la
mise en œuvre du projet et à son déploiement dans les
territoires d’escale. Il s’agit d’une volonté commune de
favoriser l’accès à la culture et de créer des liens durables
entre les territoires et leurs publics.
Cette attention portée à la culture se retrouve également
dans l’accueil, à La Sucrière, de Nuits Sonores, festival
emblématique de la scène culturelle lyonnaise. En mettant
ses espaces à disposition de cet événement, GL events
accompagne un projet artistique ancré dans son territoire
et ouvert à une grande diversité de publics.
Le sport comme levier d’insertion
Porté par un esprit entrepreneurial fort et la conviction
que chacun doit pouvoir saisir sa chance, le Groupe
GL events soutient activement l’insertion professionnelle.
En s’engageant aux côtés d’acteurs de terrain, GL events
contribue à ouvrir des perspectives, en particulier pour des
publics éloignés de l’emploi, notamment à travers le sport.
La culture comme espace de partage
Sur le volet de l’insertion professionnelle, le sport constitue
un terrain d’action privilégié. Il offre un cadre collectif
structurant, propice à l’apprentissage de repères, au
développement de la confiance et à l’engagement.
La culture constitue le second pilier de cet engagement.
GL events accompagne les acteurs de la création et de la
diffusion artistique en mettant à leur disposition ses expertises,
ses savoir-faire et ses lieux, au service de projets culturels
ancrés dans les territoires. La culture participe au dialogue,
à la vitalité des territoires et à leur attractivité. Faciliter l’accès
à ces propositions culturelles s’inscrit naturellement dans la
mission du Groupe : rassembler et créer des espaces de partage.
Le partenariat avec la Fondation Art Explora illustre cette
approche. Ce projet culturel à dimension internationale
Depuis plus de vingt ans, GL events soutient Sport dans
la Ville, association pionnière de l’insertion par le sport en
France. Présente dans de nombreux quartiers prioritaires de
l’Hexagone, elle accompagne des jeunes vers l’emploi et la
formation en s’appuyant sur la pratique sportive. Aux côtés
de Sport dans la Ville, le Groupe mobilise ses collaborateurs,
ouvre ses sites et fait découvrir la diversité de ses métiers,
contribuant ainsi à créer des opportunités concrètes pour
des jeunes qui n’y auraient pas toujours accès.
GL EVENTS RAPPORT D'ACTIVITÉ 2025 / GL EVENTS, LE GROUPE / 181
PARTENARIATS & MÉCÉNATS
Le partenariat entre GL events
et le cavalier Olivier Perreau :
l’accompagnement de l’ascension
d’un athlète de haut niveau
Initiée en juin 2019, le soutien apporté au cavalier a
accompagné le sportif dans son ascension au plus
haut niveau international. Alors que le Groupe était
déjà très impliqué dans les sports équestres à travers
l'organisation de compétitions prestigieuses, ce
sponsoring marque un engagement plus profond dans
le sport de haut niveau. Au-delà du soutien financier,
le Groupe, via sa filiale GL events Equestrian Sport
dirigée par Sylvie Robert, a offert à Olivier Perreau la
participation à des concours 5 étoiles (CSI 5*), comme
le Longines Equita Lyon et le Saut Hermès, qui ont été
décisives pour sa carrière. Le soutien de GL events a
permis à Olivier Perreau de se concentrer sur le sport
de haut niveau et de gravir les échelons. Si le point
d'orgue de cette collaboration est sans conteste la
médaille de bronze remportée par Olivier Perreau et
son cheval GL events Dorai d'Aiguilly dans l'épreuve
de saut d'obstacles par équipes aux Jeux olympiques
de 2024, l’histoire continue de s’écrire.
À Lyon, le partenariat avec le club Lyon – La Duchère s’inscrit
dans cette même logique de proximité. Bien plus qu’un
club de football, Lyon – La Duchère développe un projet
social structuré, utilisant le sport comme support d’actions
éducatives, citoyennes et d’orientation professionnelle.
À travers des dispositifs comme « Dirige ton club », des
collégiens découvrent le fonctionnement d’une organisation,
rencontrent des entreprises partenaires et se projettent
dans des parcours professionnels variés.
Le soutien de GL events accompagne également des
initiatives inclusives, telles que la section de foot adapté
pour des enfants en situation de handicap, ou des actions
de sensibilisation à la transition écologique et à la lutte
contre les discriminations. Ce partenariat contribue à
renforcer les liens entre un quartier et d’autres lieux de la
métropole lyonnaise, tout en valorisant l’engagement et
le potentiel de sa jeunesse.
À travers ses partenariats, GL events affirme une manière
d’agir fondée sur l’ancrage territorial et le temps long. En
soutenant des acteurs de terrain, le Groupe participe à
l’animation des territoires et à la construction de projets
porteurs de sens, pour aujourd’hui et pour demain.
Le sponsoring ou comment œuvrer pour
l’héritage des grands événements
Après avoir été sponsor des Jeux olympiques et
paralympiques de Paris 2024, GL events s’est engagé
en 2025 en qualité de sponsor des Jeux d’Hiver de Milan
Cortina ainsi que sur des Jeux Asiatiques et para-asiatiques
d’Aichi Nagoya.
Au-delà de la performance technique, GL events s’engage
ainsi à contribuer à un héritage positif, en particulier sur
le plan de la responsabilité sociale et environnementale
(RSE). Avec la conception d'infrastructures dans une logique
d'économie circulaire, l'objectif est que les matériaux utilisés
soient réemployés, réutilisés ou recyclés. Le réemploi
massif des équipements est un élément clé de l'héritage
matériel. Parallèlement, le Groupe privilégie des achats
responsables et cherche à innover pour répondre à des
normes environnementales et de construction toujours
plus exigeantes.
GL EVENTS RAPPORT D'ACTIVITÉ 2025 / GL EVENTS, LE GROUPE / 182
PARTENARIATS
CLUB DE FOOTBALL LYON – LA DUCHÈRE - LYON, FRANCE
GL EVENTS RAPPORT D'ACTIVITÉ 2025 / GL EVENTS, LE GROUPE / 183
CLUB DE FOOTBALL LYON – LA DUCHÈRE, ÉCO DUCH - LYON, FRANCE
FONDATION GL EVENTS
La Fondation GL events célèbre en 2025 cinq années
d’engagement au service de projets porteurs de sens. Créée
à l’initiative du Groupe GL events, la fondation d’entreprise,
présidée par Anne-Sophie Ginon, incarne une conviction
forte : celle que la réussite économique doit s’accompagner
d’un impact positif, durable et partagé, sur les territoires
et pour les communautés.
Véritable passerelle entre le Groupe, ses collaborateurs et les
causes qu’elle soutient, la Fondation GL events agit comme
un prolongement naturel des valeurs qui animent le Groupe :
esprit pionnier, ingéniosité, solidarité et passion. Elle constitue
un espace d’engagement non marchand, où l’action prime,
et où les projets accompagnés visent un impact concret,
mesurable et durable, en France comme à l’international.
Trois piliers pour un impact durable
L’action de la Fondation GL events s’articule autour de
trois piliers complémentaires, People, World et Art, qui
traduisent une même ambition : contribuer positivement
aux réalités sociales, environnementales et culturelles des
territoires où le Groupe est présent ou souhaite s’inscrire.
People vise l’amélioration des conditions de vie des femmes,
des hommes et des enfants, en favorisant l’éducation,
l’inclusion et l’autonomie.
World s’attache à la préservation de l’environnement et de
la biodiversité, en soutenant des initiatives liées au vivant et
à la transmission des savoirs environnementaux. Enfin, Art
valorise la culture comme levier d’expression, d’émancipation
et de lien social, en soutenant des projets qui favorisent la
transmission des savoir-faire et des pratiques artistiques.
Derrière ces piliers, une même exigence guide l’action de
la fondation : s’inscrire dans le temps long, construire des
partenariats durables et accompagner des projets capables
de transformer en profondeur les territoires.
Des engagements concrets
en France et à l’international
Depuis 2023 et dans le cadre du pilier People, la Fondation
GL events soutient l’association Arca, active depuis plus de
20 ans dans la favela de Vila Prudente à São Paulo. Arca
accompagne les habitants de l’enfance à l’âge adulte à
travers des programmes d’éducation, de formation, de
sport et de culture, visant à favoriser leur autonomie et leur
insertion sociale et professionnelle. La Fondation finance
notamment plus de 50 000 repas par an (soit deux repas
quotidiens pour les enfants accueillis) et soutient les activités
périscolaires et sportives, considérées comme des leviers
clés pour l’émancipation.
Au Bénin, la Fondation GL events soutient l’association
Yasmine & Mirabelle dans son projet au sein de l’orphelinat
Sainte-Famille de Djeffa (entre Cotonou et Porto-Novo).
En 2025, ce partenariat a permis l’inauguration d’une
infirmerie-clinique de 250 m², répondant à un besoin crucial
dans une région où l’accès aux soins est limité.
Ce dispensaire, ouvert aux enfants de l’orphelinat, aux élèves
de l’école voisine et aux habitants des villages alentours,
comprend : 2 salles d’hospitalisation (14 lits), 1 salle de
consultation, 1 espace de prélèvements, 1 pharmacie et 1 salle
de garde, et permet la prise en charge des pathologies graves
comme le paludisme. Construite en briques de terre crue
locales et grâce à des savoir-faire béninois, cette infirmerie
illustre une approche durable et ancrée dans le territoire.
100 % des fonds ont été investis sur place, garantissant un
impact direct et visible.
En France, la Fondation GL events soutient également des
initiatives engagées en faveur de l’égalité des chances et
de l’inclusion, comme Sport dans la Ville, qui œuvre pour
l’insertion des jeunes par le sport. Elle accompagne aussi
des projets de sensibilisation et de transmission, à l’image de
GL EVENTS RAPPORT D'ACTIVITÉ 2025 / GL EVENTS, LE GROUPE / 184
FONDATION GL EVENTS
ORPHELINAT SAINTE-FAMILLE DE DJEFFA - BÉNIN
Photo Climat, exposition photographique itinérante dédiée
aux enjeux climatiques et sociétaux, ou de l’arboretum Marcel
Kroënlein, espace unique consacré à la préservation de la
biodiversité montagnarde et à la reconstitution d’écosystèmes.
À travers ces engagements, la Fondation GL events affirme
une même ligne d’action : soutenir des projets concrets,
pensés avec les territoires, pour générer un impact durable,
humain et partagé.
Passer du soutien à l’action
L’année 2025 marque une étape structurante pour la
Fondation GL events, avec l’affirmation d’une nouvelle
ambition : passer du soutien à l’action. Ce changement
se traduit notamment par l’arrivée, à partir de 2026, de
nouveaux projets structurants, dont le soutien à l’ONG Vie
et Solidarité au Bénin, première initiative accompagnée
dans le cadre du pilier Art. L’organisation accueille des
personnes en situation de handicap et développe des
activités d’art-thérapie favorisant l’expression, le bien-être
et l’inclusion sociale.
Ancrée dans les territoires, portée par les femmes et les
hommes de GL events, la Fondation GL events s’inscrit
pleinement dans une vision de long terme : agir aujourd’hui
pour construire un impact positif, durable et partagé.
GL EVENTS RAPPORT D'ACTIVITÉ 2025 / GL EVENTS, LE GROUPE / 185
ASSOCIATION ARCA - SÃO PAULO, BRÉSIL
ARBORETUM MARCEL KROENLEIN - ROURE, FRANCE
EXPO PHOTOCLIMAT - PARIS, FRANCE
MA CHANCE MOI AUSSI
MA CHANCE MOI AUSSI
EXPO PHOTOCLIMAT - PARIS, FRANCE
HISTOIRE & ÉTAPES CLÉS
Histoire & étapes clés
1978-1989
Création�par Olivier Ginon et trois associés
(Olivier Roux, Gilles Gouédard-Comte et Jacques
Danger) de la Sarl Polygone Services.
Alliance�du Groupe Polygone, devenu n° 1 français
des installations d’expositions et d’événements,
avec la société Cré-Rossi (location de mobilier,
d’accessoires et de revêtements de salons).
Modification�de la raison sociale en Générale Location.
1990-1997
Huit années�de croissance. Générale Location
renforce sa stratégie d’offre globale par des
acquisitions et créations dans les savoir-faire
suivants : installation générale d’expositions, location
de mobilier, stands de prestige, signalétique,
agencements pour la grande distribution
et la muséographie, hôtes et hôtesses d’accueil.
Internationalisation de Générale Location�
avec une implantation à Dubaï.
1998-2003
Six années�charnières. Après son introduction au
Second Marché de la Bourse de Paris, Générale
Location fait ses premiers pas dans le domaine
des grands événements internationaux (Coupe
du monde de football en France, Sommet
des chefs d’État, Festival du film de Cannes…).
Des chantiers majeurs�pour le Groupe :
Jeux olympiques de Sydney, Sommets des chefs
d’État européens à l’occasion de la présidence
française de l’Union européenne, ainsi que de
nombreux événements liés au passage à l’an 2000.
Un nouveau nom�pour Générale Location : GL events. Le
Groupe enregistre alors une très forte progression dans
la gestion d’espaces et d’événements et, pour poursuivre
sa croissance sur le marché de l’événementiel,
lance une augmentation de capital de 15,4 M€.
2004-2009
Outre l’acquisition�de Market Place (agence
spécialisée dans la communication événementielle),
de Temp-A-Store en Grande-Bretagne (structures
démontables), de Promotor International
et AGOR (sociétés d’organisation), et une prise
de participation dans Première Vision, GL events
enregistre également une très forte progression
dans les salons professionnels avec l’acquisition
de six nouveaux salons dans la filière Industrie.
À l’international�, le Groupe acquiert la société
propriétaire de Hungexpo, parc des Expositions
de Budapest, remporte la concession du Parc
des Expositions de Rio de Janeiro, la gestion
de Pudong Expo de Shanghai, du Palais des Congrès
de Bruxelles, du Parc des Expositions de Turin,
du Centre de Conventions de Curitiba, de l’Aréna
de Rio de Janeiro et celle du World Forum Convention
Center de La Haye. GL events acquiert Traiteur Loriers
pour accélérer sa stratégie Food & Beverage.
En 2005 et 2007�, le Groupe lance deux
augmentations de capital qui lui permettent
de lever 35,7 et 77,6 millions d’euros.
En France�, GL events remporte la gestion du Parc
des Expositions de Metz, du Parc des Expositions
et du Palais des Congrès (Nice, Amiens), de la Halle
multifonctionnelle de Roanne, du Parc d’Expositions
de Troyes et de la Maison de la Mutualité à Paris.
GL EVENTS RAPPORT D'ACTIVITÉ 2025 / GL EVENTS, LE GROUPE / 188
HISTOIRE & ÉTAPES CLÉS
LIV GOLF - ROCESTER, ROYAUME-UNI
2010-2015
La création�de GL events Exhibitions, le 1er janvier
2010, permet au Groupe de renforcer la qualité
des services offerts aux exposants et aux visiteurs,
en lien avec les acteurs des différentes filières
et communautés professionnelles.
En France�, GL events remporte la gestion
du Palais Brongniart de Paris.
GL events�emporte un contrat historique à
l’occasion de la Coupe du monde FIFA 2010TM,
en Afrique du Sud. Le Groupe conforte également
sa position via de nombreux rendez-vous internationaux
tels que l’Exposition Universelle de Shanghai.
GL events confirme son leadership�pour de nombreux
rendez-vous internationaux : Coupe d’Asie des
nations de football au Qatar, Tournoi des six nations,
Sommets de la présidence française des G8 et G20,
Jeux olympiques de Londres, Sommet Rio + 20…
Acquisitions de Brelet�, acteur français de
l’aménagement temporaire pour les salons
et événements, de Slick Seating Systems Ltd,
concepteur fabricant de tribunes sur les marchés
anglais et du Commonwealth, et de Serenas,
leader en Turquie de l’organisation de congrès.
Avec le renouvellement de la gestion du Parc
d’Expositions de Toulouse�, l’exploitation du nouveau
Centre de Congrès et d’Expositions d’Ankara,
en Turquie et la gestion de La Sucrière, à Lyon,
GL events poursuit le développement de son réseau
d’espaces en France et à l’ international.
GL events réalise une augmentation de capital�
pour accélérer son développement sur les marchés
émergents et notamment au Brésil, très porteur
en termes de grands événements à l’horizon
2016. Entrée au capital du Groupe de Sofina.
GL EVENTS RAPPORT D'ACTIVITÉ 2025 / GL EVENTS, LE GROUPE / 189
HISTOIRE & ÉTAPES CLÉS
L’exportation du concept d’événements propriétaires�
sur différentes zones géographiques se confirme
comme une forte valeur ajoutée pour le Groupe
(Première Vision à New York, São Paulo et Moscou,
Bocuse d’Or à New York, Sirha à Shanghai et Genève…).
Au Brésil�, achat de LPR, société spécialisée dans
l’installation générale et le mobilier ; le Groupe
remporte l’appel d’offres pour la concession sur 30 ans
du Parc des expositions Imigrantes de São Paulo.
Réalisation d’un parc d’expositions temporaire�
de 20 000 m2 à Sydney.
Le Groupe remporte la concession du Palais des
Congrès de Metz�pour une durée de dix ans.
Au 1er janvier, les trois agences événementielles
du Groupe�– Alice Événements, Market Place
et Package – deviennent une entité unique,
dédiée au conseil stratégique et opérationnel
de communication événementielle : Live! by GL events.
Le Groupe se voit confier la DSP de Strasbourg
événements�, avec deux équipements majeurs : le
Centre des Congrès et le Palais de la Musique.
Partie prenante du G20�, à Brisbane,
et de la COP20, à Lima, le Groupe confirme ainsi
son positionnement sur les grands sommets
politiques et environnementaux internationaux.
Montée en puissance de l’implantation latinoaméricaine�avec des prises de position au Chili.
L’offre de stades modulables et durables�
innove avec un concept d’infrastructures innove
avec un concept d’infrastructures rapides
et économiques à mettre en œuvre.
Démarrage de l’un des grands chantiers
du programme de São Paulo�Expo
la construction d’un parking de 4 532 places
sur sept niveaux.
Inauguration à Rio de l’Hôtel Grand Mercure�
dont GL events a assuré la maîtrise d’ouvrage.
Réalisé en partenariat avec Accor, cet établissement
5 étoiles propose 306 chambres.
Acquisition du Groupe Jaulin�,
qui permet à GL events de se renforcer en
région parisienne et d’intégrer un nouveau site
dans son réseau : le Paris Event Center.
2016-2021
En avril, inauguration de São Paulo Expo�,
le plus grand parc d’exposition d’Amérique latine
avec une superficie totale de 120 000 m².
Forte présence sur les Jeux olympiques
d’été à Rio�, accueil de compétitions sur les sites
du Groupe (Rio Arena et Riocentro), nombreuses
prestations de restauration et de réception.
Signature d’une joint-venture�, entre GL events et
Yuexiu Group, portant sur le développement conjoint
d’un réseau de sites événementiels en Chine. Première
étape pour 2019 : la gestion du futur Guangzhou
Yuexiu International Congress Center (50 000 m²).
Après la COP20 à Lima et la COP21 à Paris�, GL events
est partie prenante de la COP22 accueillie à Marrakech.
Le Groupe confirme ainsi son statut d’acteur majeur de
ces grands rendez-vous du développement durable.
Création de Global Industrie�
Avec le rachat des salons Tolexpo et Midest, couplés
à Smart Industries, GL events crée un événement
majeur pour l’économie de la filière industrielle.
1ère édition en mars 2018 à Paris-Nord Villepinte.
Le Matmut Stadium de Gerland fait peau
neuve.�Après six mois de travaux, l’enceinte
du LOU Rugby accueillera des rencontres
sportives et de grands événements.
Opérations stratégiques de croissance externe�
avec le rachat de Tarpulin (Chili), de Wicked & Flow
(Dubai), d’Aganto (Royaume Uni) et de l’agence CCC.
Poursuite du développement en Asie �
après la Chine, GL events entre en négociation exclusive
pour la gestion du futur Aichi Parc Expo (Japon).
Reims et caen�viennent renforcer le maillage
de sites événementiels du Groupe.
Avec l’acquisition de Fisa�, leader de l’organisation
de salons, le Groupe conforte ses positions au Chili et,
plus largement, en Amérique latine. Fruit d’une double
dynamique de croissance organique et externe portée
par l’engagement des collaborateurs.
Le cap du milliard du chiffre d’affaires est franchi�
l’année d’un double anniversaire : les 40 ans du
Groupe et ses 20 ans de cotation en Bourse.
GL EVENTS RAPPORT D'ACTIVITÉ 2025 / GL EVENTS, LE GROUPE / 190
HISTOIRE & ÉTAPES CLÉS
VIVING - BREST, FRANCE
Accélération du développement international�
Acquisition de 51 % de la société ZZX (Chine, société
spécialisée dans la fourniture de prestations aux
événements), de 60 % de la société Johannesburg
Expo Centre, qui gère le parc d’exposition de
Johannesburg, de 55 % de la société CIEC Union
(Chine, organisateur de 6 salons majeurs dans les
villes de tiers one) et de 60 % de la société Fashion
Source (Chine), organisateur de salons de Mode.
Renforcement du réseau Venues�
Le pôle Venues continue le renforcement du
réseau ; nouveau palais des congrès de Salvador
(Brésil), renouvellement de la gestion du Parc
d’Exposition et du Polydome de Clermont Ferrand,
extension de la concession des sites de SaintÉtienne (Parc des Expositions, Cité du Design
de St Étienne en complément du Palais des
congrès et de l’espace réceptif de La Verrière).
GL events Live s’illustre dans des événements
majeurs�
GL events Live s’est illustré en 2019 par les prestations
fournies à l’occasion des Panamerican Games (Pérou)
mais également pour la COP25 (Chili & Espagne),
opération pour laquelle le Groupe a démontré
sa capacité de mobilisation et de réactivité des
équipes pour livrer, dans un temps record, les clients.
Grand Palais Éphémère de Paris�
La construction du Grand Palais Éphémère
sur le Champ-de-Mars à Paris est lancée pour
une livraison prévue au printemps 2021.
Acquisition du salon CACLP en Chine
et une première édition réussie�
Leader national dans les domaines du diagnostic
in vitro et des tests cliniques, l’acquisition de cet
événement confirme la volonté du Groupe de s’implanter
durablement sur ce marché prometteur. Tranoï, leader
dans l’organisation d’événements BtoB pour les marques
de mode créatives en marge de la Fashion Week
rejoint le Groupe et renforce ainsi son pôle mode.
Innovations digitales�
Le Salon Global Industrie accélère son offre digitale
et devient Global Connect. Sur 4 jours, 300 intervenants
et 46 webinars vont animer la communauté industrielle
avec plus de 6 100 professionnels.
Le Palais Brongniart accueille son premier évènement
phygital et un défilé Fendi 100% numérique. Le Groupe
lance une offre studio Télé sur plusieurs sites.
GL EVENTS RAPPORT D'ACTIVITÉ 2025 / GL EVENTS, LE GROUPE / 191
HISTOIRE & ÉTAPES CLÉS
La sécurité avant tout�
Avec le 5ème engagement de sa politique RSE « Think
Safe », GL events reçoit le label Safe & Clean d’Apave
qui atteste de la mise en œuvre de mesures et de
dispositifs sanitaires adaptés face au risque Covid-19.
C’est une première étape dans une démarche visant
à labelliser l’ensemble de ses activités dans le monde.
2021, sous le signe du rebond !�
Reprise de nos activités : l’Asie dans un premier
temps, puis l’Europe à compter de juin, et
l’Amérique du Sud en octobre. In fine, une activité
de 741 M€ réalisée sur une période courte.
Renouvellement du label Safe & Clean�
GL events a obtenu le renouvellement de son label
Safe & Clean délivré par l’APAVE, pour l’ensemble de
ses activités en France et à l’international (hors Chine).
De nouveaux contrats importants�
GL events a signé plusieurs contrats déterminants
parmi lesquels les Jeux du Commonwealth, la COP26,
la Coupe du Monde de football 2022, la construction de
la piste de cross à Versailles dans le cadre de Paris 2024.
La RSE au cœur de la stratégie�
L’engagement du Groupe en faveur de la RSE
s’est renforcé avec la signature du Pacte parisien
pour l’emploi et les entreprises, l’association avec
Les Canaux pour les achats issus de l'économie
sociale et solidaire et son programme de formation
Eureka sur le montage de structures.
Augmentation de capital Chine�
GL events Greater China a réalisé une augmentation
de capital qui a permis l’entrée de Nexus Point. Cette
opération, qui valorise pre-money les participations à
259 M€, alloue des moyens financiers complémentaires
au Groupe pour poursuivre son développement par
des acquisitions ciblées. Cette opération valide la
stratégie mise en œuvre depuis 18 mois et renforce
la valeur et la qualité des actifs détenus en Chine.
Augmentation de capital GL events Sports�
GL events Sports a ouvert son capital à Montefiore
Investment, gestionnaire du fonds « Nov Tourisme –
Relance Durable France ». Cette opération est mise
en œuvre afin de poursuivre le développement des
activités du site du Matmut Stadium de Gerland.
Renforcement à São Paulo�
Le Groupe a remporté l’appel d’offre relatif à la gestion
du complexe événementiel d’Anhembi, situé au cœur
de São Paulo (Brésil) : un contrat de concession d’une
durée de 30 ans portant sur l’exploitation du parc
d’expositions et du centre des congrès (93 000 m²) et
des espaces extérieurs (400 000 m²). L’activité attendue
post réalisation des travaux de rénovation devrait
se situer entre 25 à 30 M€ générant une rentabilité
opérationnelle de 28 à 31 %. En outre, le Groupe pourra
valoriser la réserve foncière de 270 000 m² qui permettra
de financer le capex de renouvellement du site.
Dans ce cadre, un 1er accord de négociation exclusive
a été signé avec Live Nation & Oak View Group afin
d’implanter une Arena.
Acquisition de Créatifs�
Avec l’acquisition de Créatifs fin 2021 à Paris, GL events
renforce sa maîtrise des prestations de création.
2022
Nouveau record de chiffre d’affaires�
GL events réalise un record de chiffre d’affaires
(1,315 Md€) grâce à une forte croissance en Europe et
en Amérique du Sud, compensant le recul en Asie.
Le Groupe accompagne de grands événements
internationaux�(Equestrian Saudi Cup, Grand Prix Moto
d’Indonésie, FIFA Qatar, COP 27, Jeux du Commonwealth).
Nouveaux sites�
Le Groupe élargit son réseau avec plusieurs nouveaux sites :
Parc des expositions de Strasbourg, Paris Invalides, Paris
Montreuil Expo, six sites à Orléans dont CO’Met et le Zénith,
ainsi que The Ruck Hotel à Lyon.
GL events acquiert également Field & Lawn, et renforce sa
gouvernance RSE avec l’intégration de la Direction RSE au
Comité exécutif.
GL EVENTS RAPPORT D'ACTIVITÉ 2025 / GL EVENTS, LE GROUPE / 192
HISTOIRE & ÉTAPES CLÉS
2023
Le Groupe acquiert Locabri,�, spécialiste des structures
temporaires, renforçant son offre au-delà de
l’événementiel.
Jeux olympiques et paralympiques de Paris 2024�
GL events s’allie à LOXAM pour un contrat majeur
sur l’énergie temporaire et devient Partenaire
Officiel pour les infrastructures temporaires.
Le Palais Brongniart �est choisi comme Maison
de l’Équipe des États-Unis pour Paris 2024.
La stratégie RSE progresse : �réduction de plus de 30 %
des consommations d’énergie, installation de 581 bornes
de recharge, accélération de l’électrification de la flotte.
2024
Nouveau record de chiffre d’affaires�
Année historique : nouveau record de chiffre d’affaires
(1,635 Md€, +15 %).
GL events fournit 70 % des installations
temporaires des JO 2024,�assure l’énergie
et organise les épreuves équestres.
Le Groupe renforce sa structure actionnariale : �
entrée de Trévise Participations, sortie de Sofina,
montée du Crédit Agricole et du Grand Rey.
Le Groupe remporte la concession du Parc Chanot
à Marseille,�inaugure le site d’Anhembi à São Paulo
(investissement >100 M€) et positionne son pôle
Exhibitions comme intégrateur de contenus.
Il se renforce dans la santé �(offre dédiée en
2025), entre en négociation exclusive pour la
concession du Stade de France, et signe un MOU
pour acquérir ADD Group en Arabie saoudite.
En RSE,�l’empreinte carbone rapportée au
chiffre d’affaires diminue de 5 %, et l’économie
circulaire progresse largement. Les initiatives
incluent des ombrières photovoltaïques à
Eurexpo et le déploiement de Cléo Carbone.
GL EVENTS RAPPORT D'ACTIVITÉ 2025 / GL EVENTS, LE GROUPE / 193
SIRHA 2025 - LYON, FRANCE
HISTOIRE & ÉTAPES CLÉS
2025
Jeux Asiatiques et Para-Asiatiques d’Aichi Nagoya 2026
(Japon)�– GL events a remporté un contrat majeur pour
les Jeux Asiatiques et Para-Asiatiques d’Aichi-Nagoya 2026.
En tant qu’entité chargée de la gestion opérationnelle
(Event Delivery Entity), GL events s’est vu confier un
large périmètre d’intervention, incluant notamment la
mise en place et la coordination des sites temporaires
(overlay), la fourniture d’énergie et de services techniques,
la logistique de la restauration, le nettoyage et la gestion
des déchets. À cela s’ajoutent des services opérationnels
clés tels que la coordination et la gestion des sites, l’appui
aux cérémonies de remise de médailles, le soutien aux
espaces presse ainsi que les services aux spectateurs,
sur l’ensemble des 53 sites des Jeux Asiatiques et des 19
sites des Jeux Para-Asiatiques. GL events est partenaire
officiel des Jeux Asiatiques et Para-Asiatiques de 2026.
Milan Cortina 2026 — Prestataire Principal�
Le Comité d’Organisation des Jeux olympiques et
paralympiques d’hiver Milan Cortina 2026 a confié à
GL events l’aménagement de 19 sites répartis entre
Milan, Cortina et Bormio dont l'Arena Santa Giulia de
Milan (hockey sur glace et de para-hockey sur glace),
Predazzo (ski nordique et de combiné nordique), et
Cortina d'Ampezzo, (ski alpin féminin, etc.). Les équipes
projet dédiées ont été chargées de la conception, la
fourniture, l'installation, la maintenance et le démontage
des infrastructures temporaires (overlay) qui comprennent
des tentes et structures provisoires, des bâtiments
modulaires, des tribunes temporaires, des espaces médias
et des unités sanitaires portables. GL events était par
ailleurs partenaire des Jeux olympiques d’hiver de 2026.
Concession du Stade de France — Attribution
officielle�– L’État français a désigné GL events comme
attributaire de la concession du Stade de France pour
une durée de 30 ans. La prise d’exploitation a débuté le
5 août 2025 avec les premiers concerts programmés dès
le mois d’août. Le projet déployé par le Groupe se veut
ambitieux, durable et centré sur une expérience enrichie
pour tous les publics. Véritable vitrine de Paris et de la
France, le Stade, qui s’inscrit dans l’héritage des Jeux
olympiques de Paris 2024, va connaitre une nouvelle
feuille de route avec une programmation enrichie ouverte
notamment à de nouveaux sports et un rayonnement
international tout en renforçant son ancrage territorial.
Développements dans la santé animale en Chine�
GL events a acquis 69 % de WESAVC, organisateur du
principal salon chinois des équipements vétérinaires
(plus de 1 000 exposants, 50 000 m², forte croissance).
Cette opération s'inscrit dans la stratégie du Groupe de
se développer dans le secteur porteur de la santé animale
tout en renforçant ses synergies technologiques et son
implantation asiatique via GL events Live Shenzhen.
Évolution de l’actionnariat et renforcement de la
gouvernance�– En 2025, GL events a connu une évolution
majeure de son actionnariat. Polygone et Amar Family
Office ont acquis l’intégralité de la participation restante
de Sofina, soit 7 % du capital, acte important dans la
recomposition du tour de table du Groupe. Par ailleurs,
Atream et la CARAC sont entrés au capital de de GL events
et Polygone SA avec la prise d’actions significatives
donnant notamment accès à un siège d’administrateur
dans les deux conseils d’administration. Cette évolution
renforce la stabilité actionnariale autour d’investisseurs
institutionnels impliqués dans des projets à long terme.
GL events Live : u
� ne activité soutenue avec la réalisation
d’événements prestigieux : Exposition Universelle d’Osaka
(pavillons Allemagne / Serbie / UE), Conférence des
Nations Unies sur les océans à Nice, Paris Air Show, Grand
Prix F1 Monaco, Rolex Masters, Saut Hermès, 24h du Mans.
GL events Exhibitions : �pôle en très forte croissance porté
par des salons de référence comme Global Industrie, SIRHA
Lyon, des événements internationaux comme Première
Vision, Estetika Brésil, SIRHA Arabia et le développement
de sa filière Health and Science et Pop culture.
GL events Venues e
� st dynamisée par la bonne santé
de son réseau de sites et son développement sur quatre
continents avec l’arrivée de nouveaux équipements
emblématiques comme le Stade de France, le Parc des
Exposition d’Abidjan ou encore le Parc Chanot à Marseille
mais aussi l’accueil de grands événements comme le G20
en Afrique du Sud ou le Sommet de l’OTAN à la Hague.
Le Groupe continue d’affirmer sa responsabilité
environnementale et sociale à travers une politique
volontariste :�Salon BePOSITIVE 2025 – Valorisation
des secteurs bas carbone. En mars 2025, GL events
a organisé BePOSITIVE à Eurexpo Lyon, seul salon
français dédié à la transition énergétique et au
bâtiment durable. Ce salon contribue concrètement
à la diffusion des innovations responsables auprès des
professionnels de l'énergie, de la construction durable et
des solutions bas carbone. Il constitue un levier important
de la stratégie RSE du Groupe en matière d’impact
territorial et d’accélération de la transition écologique.
GL EVENTS RAPPORT D'ACTIVITÉ 2025 / GL EVENTS, LE GROUPE / 195
CAHIER DE L’ACTIONNAIRE
Cahier de l’actionnaire
COURS DE L'ACTION
35
GL events SA
30
25
20
15
10
5
01/25
02/25
03/25
04/25
05/25
06/25
07/25
RÉPARTITION DE L’ACTIONNARIAT
AU 31 DÉCEMBRE 2025
HOLGESPAR 3,5 %
TRÉVISE PARTICIPATIONS 8 %
CONFLUENCE 1,5 %
AUTO DÉTENTION 2,2 %
08/25
09/25
10/25
11/25
12/25
01/26
02/26
03/26
DIVIDENDES
Le Conseil d'Administration proposera à la prochaine
Assemblée générale des actionnaires qui se tiendra
le 29 avril 2026, la distribution d'un dividende de 1 €, au titre
de l'exercice 2025.
1,0
0.90
0,90
0,8
0,70
0,6
FLOTTANT 26,3 %
0,4
POLYGONE SA 58,5 %
0,35
0,2
0,0
2020
2021
GL EVENTS RAPPORT D'ACTIVITÉ 2025 / GL EVENTS, LE GROUPE / 196
2022
2023
2024
CAHIER DE L’ACTIONNAIRE
Calendrier des communications pour 2026
15 AVRIL 2026
ACTIVITÉ DU 1ER TRIMESTRE 2026
29 AVRIL 2026
ASSEMBLÉE GÉNÉRALE MIXTE À LYON
22 JUILLET 2026
ACTIVITÉ ET RÉSULTATS DU 1ER SEMESTRE (APRÈS BOURSE)
Diffusion des communiqués
Information
Les communiqués de GL events sont disponibles après
18 h le jour de leur publication dans la presse financière
sur le site www.gl-events.com (rubrique « Relation
investisseurs »). Ils sont adressés systématiquement
par email ou courrier à toute personne qui en fait la
demande.
EUROLIST COMPARTIMENT B
CODE ISIN - FR 0000066672
CODE BLOOMBERG - GLOFP
CODE REUTERS - GLTN.PA
CODE FTSE - 581
CODE LEI : 9695002PXZMQNBPY2P44
Rapports annuels
Depuis son introduction en bourse, GL events développe
une communication privilégiée auprès de ses actionnaires.
Sur le site internet www.gl-events.com, rubrique « Relation
investisseurs », un espace dédié aux actionnaires propose :
ٱun historique des communiqués de presse,
ٱun calendrier des communications financières,
� ٱun historique des rapports annuels (disponibles en
téléchargement) et des publications,
ٱles chiffres clés du Groupe,
ٱla retransmission de l'Assemblée générale du Groupe.
Le rapport annuel peut être téléchargé à partir du site internet
sur lequel l’historique des communiqués et des rapports
(depuis l’introduction en bourse de la Société) est accessible
en permanence.
Tous les éléments de communications financières sont
traduits en langue anglaise et sont disponibles sur le site
www.gl-events.com (rubrique « Relation investisseurs ») ou
en version papier.
Couverture de la valeur
GL events par les analystes
financiers
Email : [email protected]
ٱEmmanuel CHEVALIER, CM CIC Market Solutions
ٱGeoffroy MICHALET, ODDO BHF
ٱNicolas DELMAS, Portzamparc
ٱStéphanie LEFEBVRE
ٱFlorian CARIOU, Midcap
ٱRobin LECLERC, IDMidCaps
ٱMaud SERVAGNAT, ALL Invest Securities
GL EVENTS RAPPORT D'ACTIVITÉ 2025 / GL EVENTS, LE GROUPE / 197
GL EVENTS SIÈGE SOCIAL - LYON, FRANCE
2026 - RÉDACTION ET RÉALISATION : DIRECTION DE LA COMMUNICATION
© NICOLAS RODET, © KLEINE MEDIA, © MARCEL UYETA, © ALEXANDRE BAGDASSARIAN, © INGRID MOYA, © SÉBASTIEN CLAVEL PHOTOGRAPHIE,
© BUENA ONDA FILMS, © MAHDI ARIDJ PHOTOGRAPHY, © PSV-JEAN MOREL, © TRISTAN PILAT, © GUILLAUME RUOPPOLO, © ÉRIC ZARAGOZA,
© MORGAN FROMENT, © CHARLY HEL, © JB DELERUE, © BULLITT, © MICHELIN2025, © QUI PLUS EST-NATHALIE DUBOST, © PAUL DFU, © LYON PEOPLE,
© NICOLAS REYNAUD, © ALEX GALLOSI, © HUG TIADJI-STUDIO54, © PIERRICK GIGLIO, © THOMAS GUILLIN, © BIND, © TIAGO BORGESFOTOGRAFO,
© PINELOPI GERASIMOU, © DILLIES PA, © GCIS (SOUTH AFRICAN GOVERNMENT COMMUNICATION AND INFORMATION SYSTEM) AND DIRCO
(DEPARTMENT OF INTERNATIONAL RELATIONS AND COOPERATION), © THE BIG IDEA ! PRODUCTIONS, © PINELOPI GERASIMOU, © ESAD DURAKI,
© MORGAN FROMENT, © TRÉVISE PARTICIPATIONS, © ARBORETUM DE ROURE, © NICOLAS HENRY, © JUSTINE BRUNET, © PIERRE-AYMERIC DILLIES,
© LAURENT JULLIAND, © FAUST FAVART, © PHILIPPE THIBAULT, © SIMON BIANCHETTI, © MARTIN ROLLAND, © BOBY, © WESAVC,
© GL EVENTS GREATER CHINA
CE DOCUMENT EST DISPONIBLE EN TÉLÉCHARGEMENT SUR GL-EVENTS.COM
Les destinations
FRANCE
AMIENS
Les expertises métiers
CONSEIL
CONSTRUCTION
CLERMONT FERRAND
MARSEILLE
SERVICES
ORLÉANS
RÉCEPTIF
REIMS
Sports
ROANNE
SAINT-ÉTIENNE
Les salons BtoB
Les salons BtoC
Les destinations
FRANCE
EUROPE
CAEN
BELGIQUE
HONGRIE
LYON
ITALIE
PAYS-BAS
AFRIQUE / MIDDLE EAST
AFRIQUE DU SUD
CÔTE D’IVOIRE
TÜRKIYE
METZ
Parc des
Expositions
d’Abidjan
AMÉRIQUE DU SUD
PARIS
BRÉSIL
STRASBOURG
CHILI
ASIE
CHINE
JAPON
TOULOUSE
Les congrès
MARS 2026
Découvrez notre portefeuille
de marques.
Rapport annuel 2025
59, quai Rambaud
69002 Lyon | France
Tél : +33 (0)4 78 17 61 76
[email protected]
www.gl-events.com
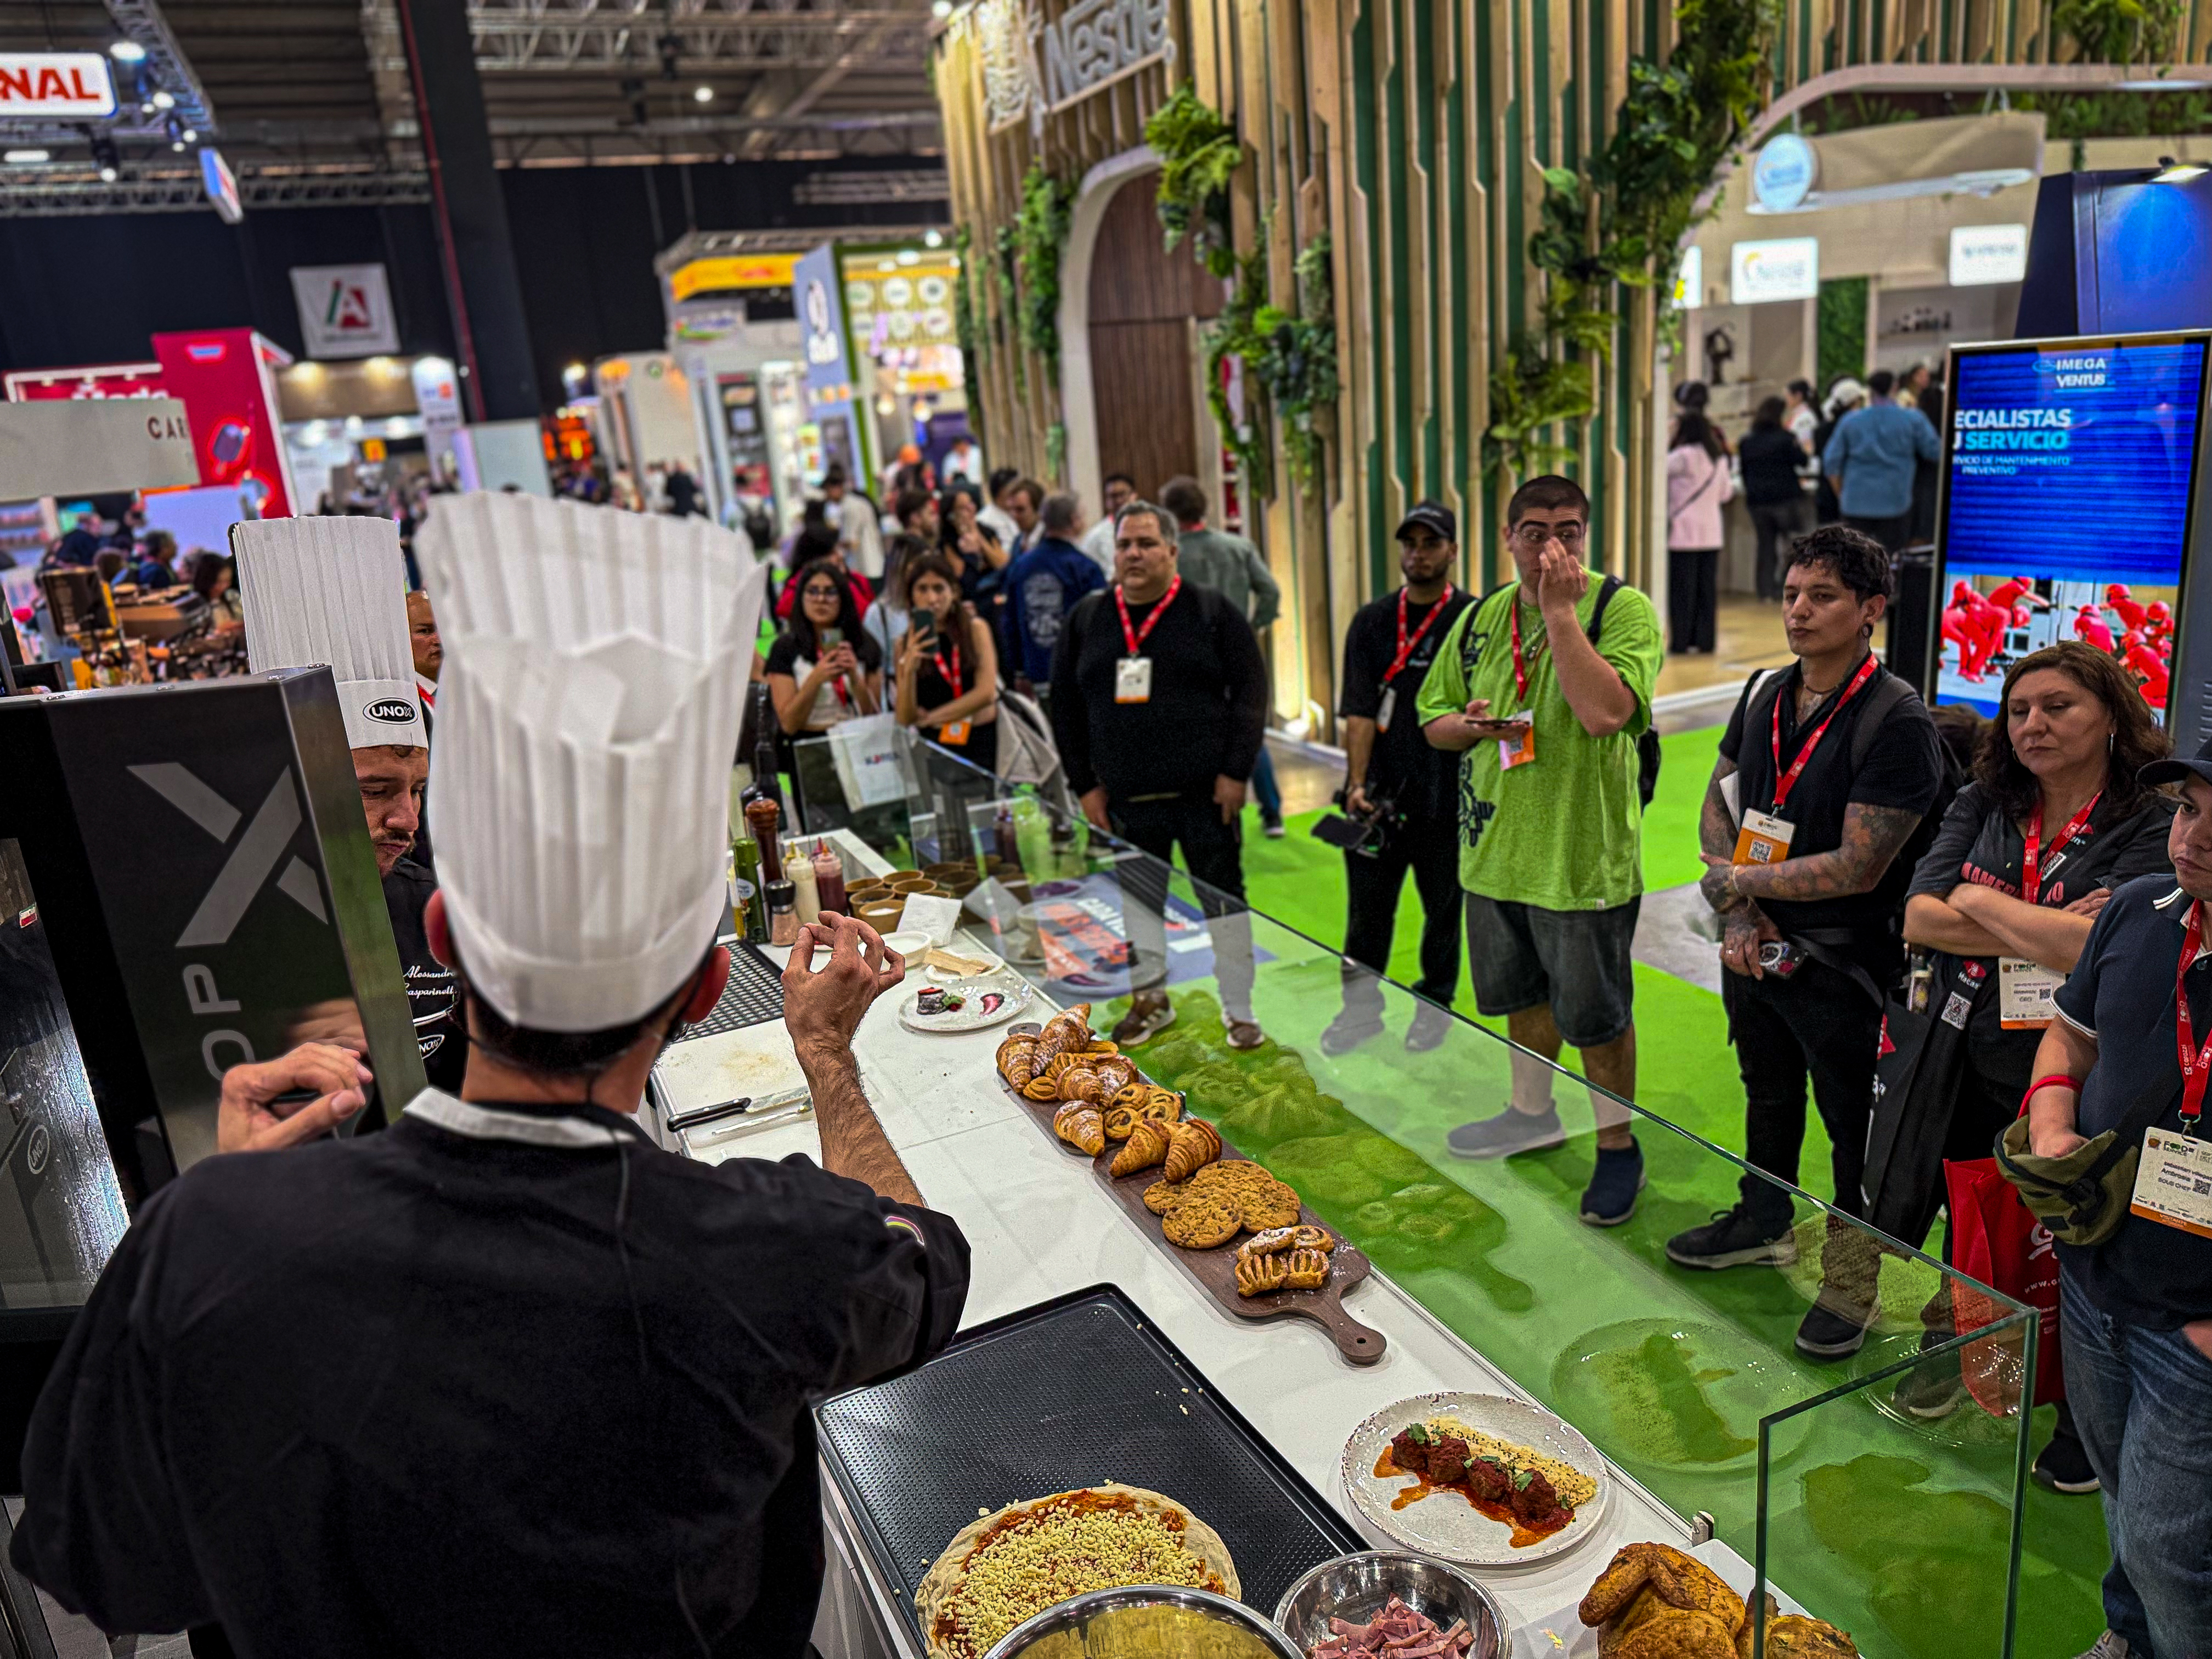
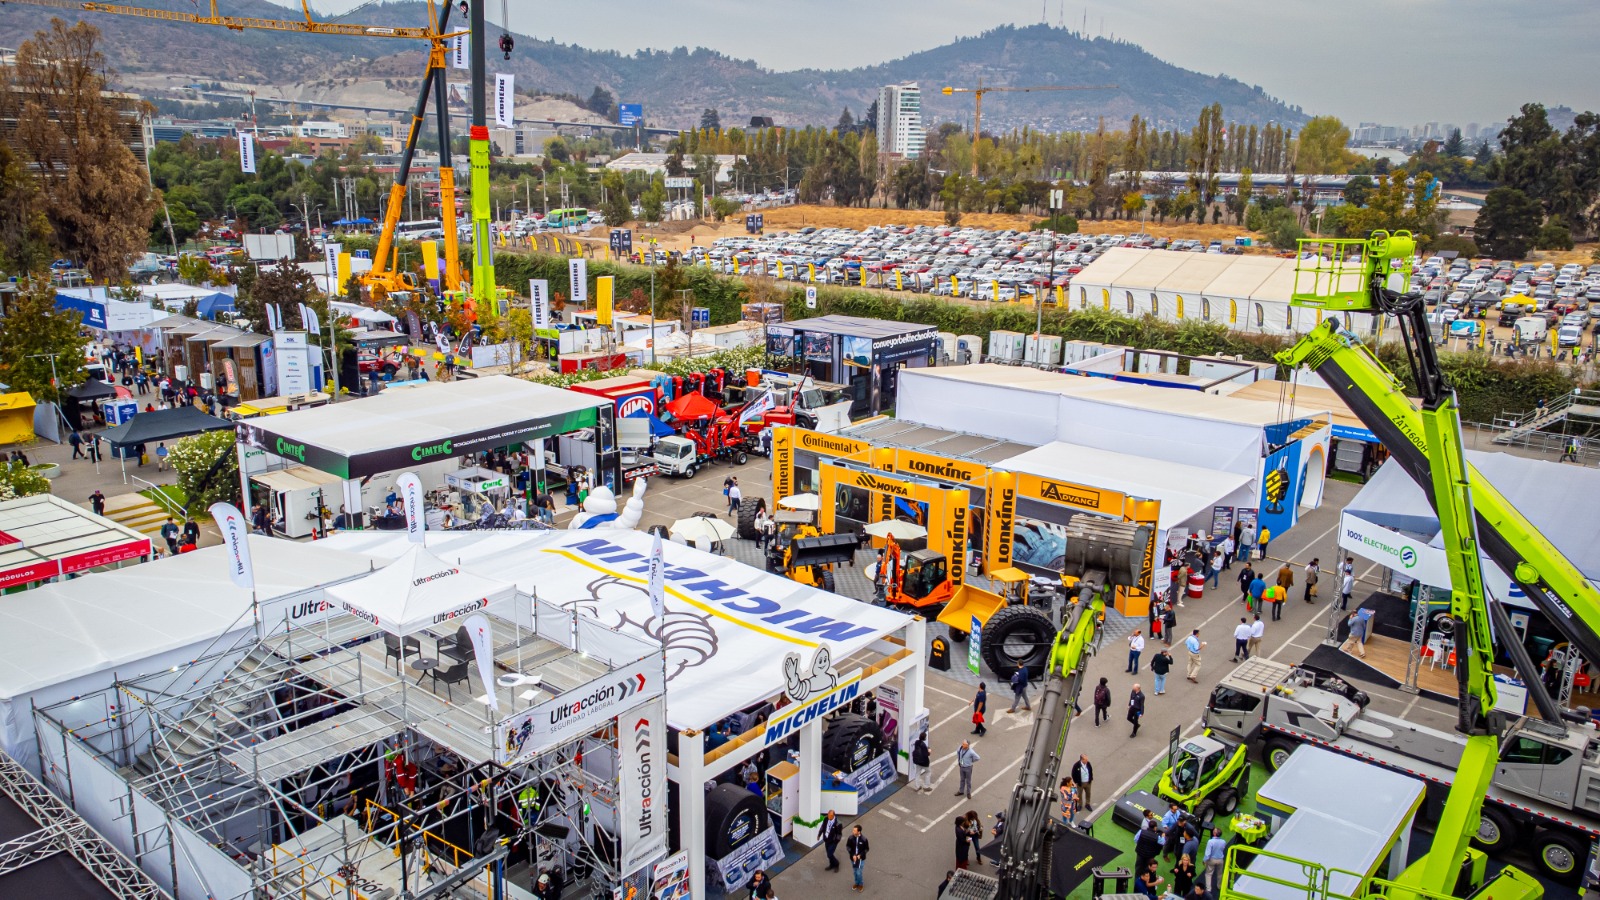
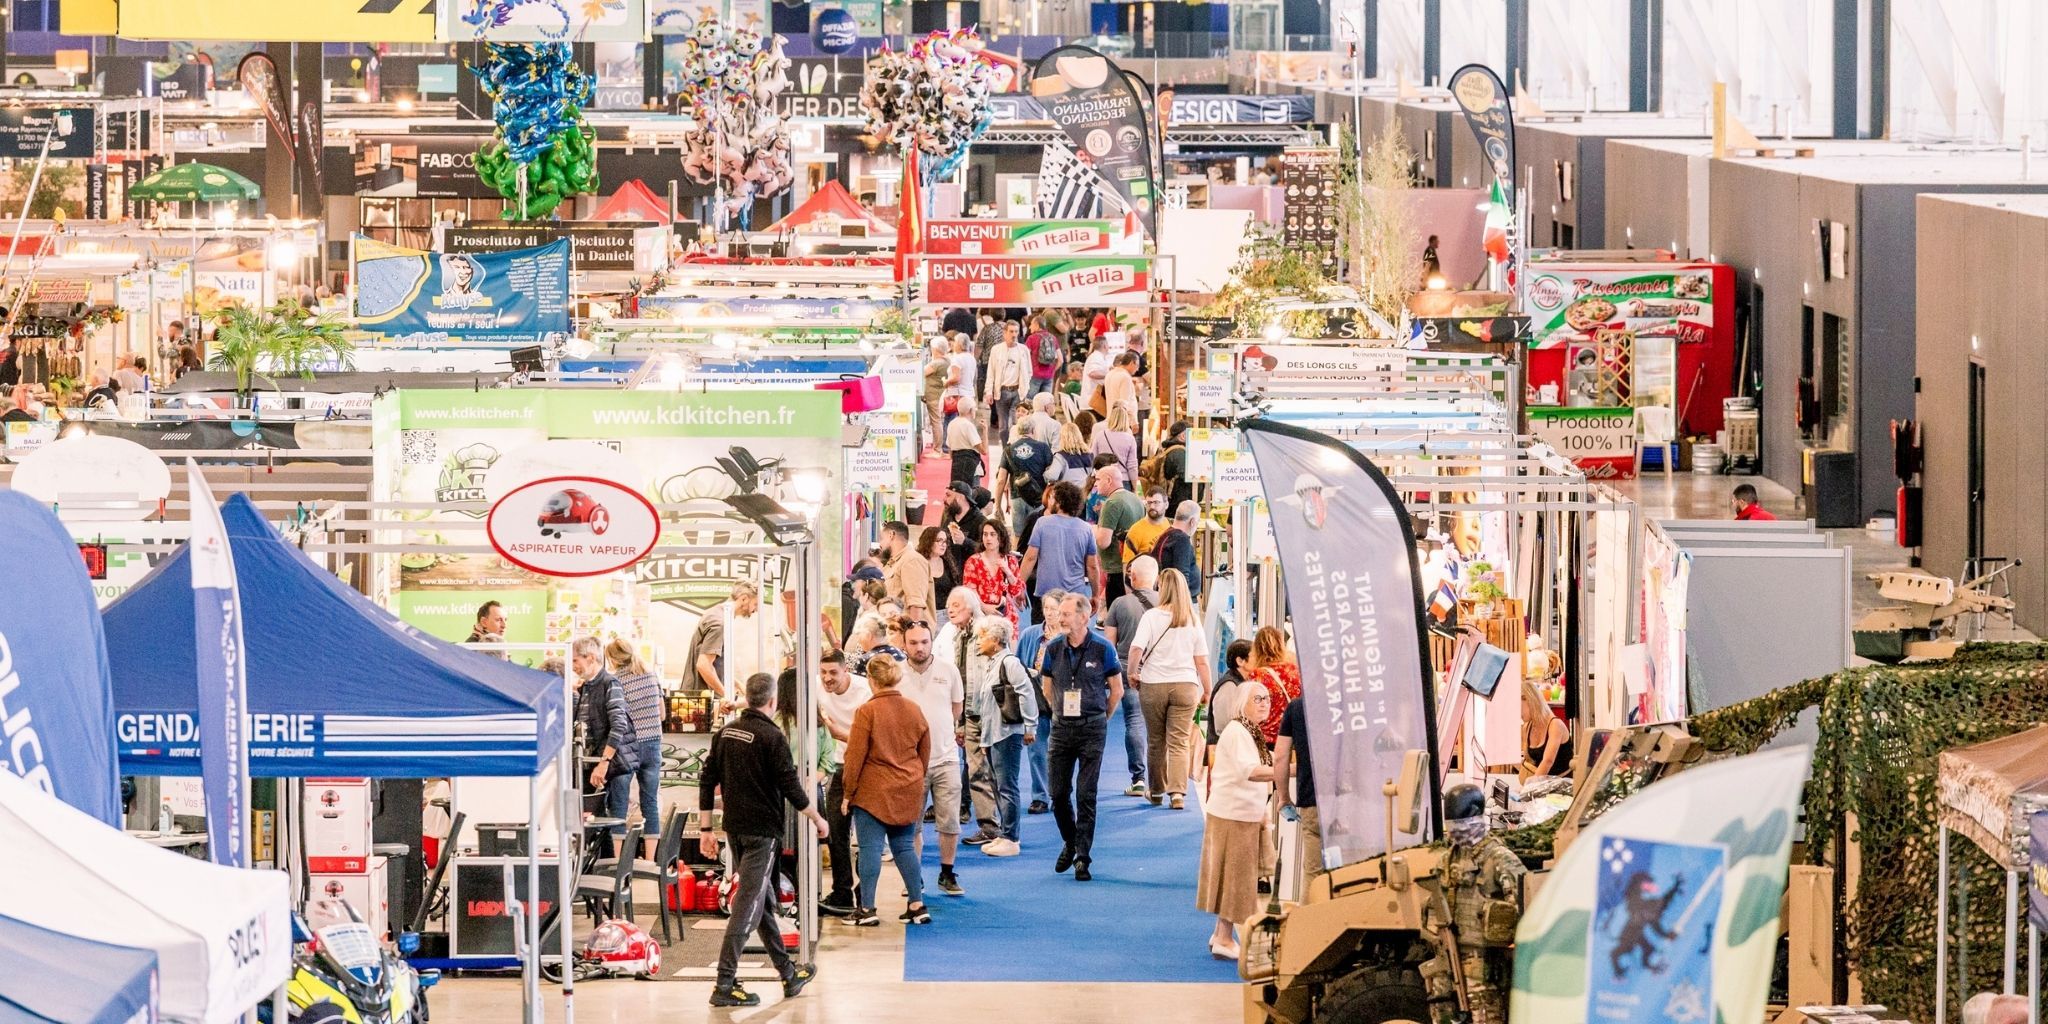
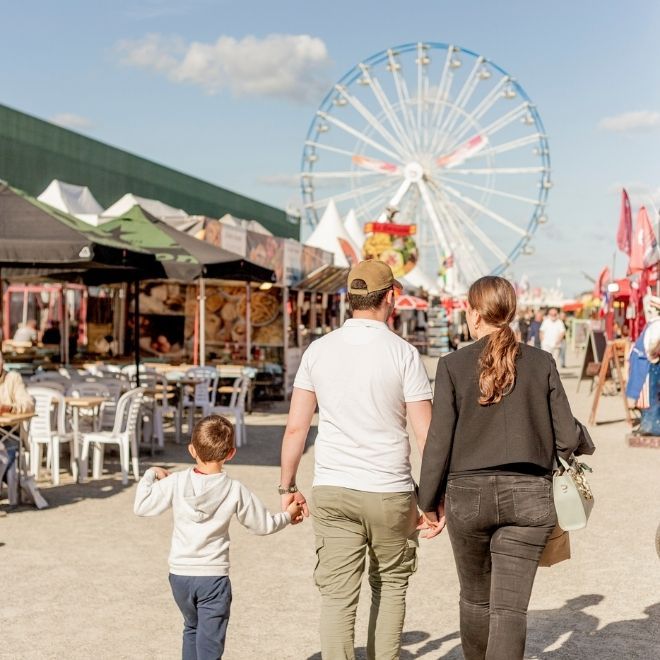


 Précedent


