|
Exosens is a high-technology group specializing in the innovation, development, manufacturing, and sale of electro-optical technologies for amplification, detection, and imaging. The company operates through two main segments: Amplification, which includes image intensifier tubes and portable optronics such as night vision binoculars and thermal sights, and Detection and Imaging, covering digital cameras across the electromagnetic spectrum from ultraviolet to longwave infrared, as well as detectors for ions, electrons, neutrons, and gamma rays. Exosens serves four primary markets: defense and surveillance, life sciences and environment, industrial control, and nuclear applications. The majority of its products are sold to original equipment manufacturers (OEMs) who integrate these components into their own systems, while a smaller portion is sold directly to end-users in sectors such as space and scientific research. The group markets its products under the brands Photonis, Xenics, Telops, and El-Mul, and has acquired companies including NVLS, Noxant, and Phasics. Exosens maintains production and R&D sites in France, the Netherlands, Belgium, the United States, Germany, the United Kingdom, and Canada, serving customers in multiple countries. Summarised from the company's own disclosures, fiscal year ended Mar 2026 |
Industry Electronic Components | Homepage exosens.com |
| Sector Technology | IR page exosens.com/investors | |
|
Tags
electro-optics, image intensifiers, infrared imaging, particle detection, nuclear instrumentation, night vision, defense technology, industrial inspection, scientific research, photonics, Photonis, Xenics, Telops, El-Mul, NVLS, Noxant, Phasics, Emberion
|
Press page — |
Metrics
| Valuation | |
|---|---|
| Market cap | € 3.285B |
| Market cap (USD) | $ 3.61B |
| P/E | 108.97 |
| PEG | 1.29 |
| P/BV | 7.29 |
| P/S | 6.61 |
| P/OCF | 30.60 |
| P/FCF | 127.89 |
| Dividend yield | — |
| Turnover / mcap | — |
| Returns | |
|---|---|
| ROE | 10.0% |
| ROI | 6.1% |
| ROIC | 11.7% |
| Profit margin | 9.1% |
| Growth | |
|---|---|
| Revenue growing | Yes |
| Profits growing | Yes |
| Revenue up 3y | Yes |
| Revenue up 5y | — |
| Earnings growth 3y (net profit CAGR) | 84.3% |
| Quality | |
|---|---|
| Profitable | Yes |
| Margin expanding | Yes |
| Buying back stock | No |
| Diluting (TTM) | No |
| Debt/Equity | 55.8% |
| Podcast bulls (TTM) | Sign up |
| Podcast bears (TTM) | Sign up |
| Podcast sentiment (TTM) | Sign up |
| Podcast sentiment % (TTM) | Sign up |
| News sentiment (TTM) | 44 |
| Quality score | 25.0% |
| Insiders | |
|---|---|
| Buys, 1w | Sign up |
| Buys, 1m | Sign up |
| Buys, 1y | Sign up |
| Sells, 1w | Sign up |
| Sells, 1m | Sign up |
| Sells, 1y | Sign up |
Filed figures
Lines the statements and their notes report beside the headline figures, read from the filings' XBRL as filed (no restatement applied), with figures computed from one filing's own lines. Cash-flow lines carry their cash direction: an outflow is negative. Each period links to its filing; a figure's period, report date and tag are in its tooltip.
| Figure | Dec 2023 | Dec 2024 | Dec 2025 |
|---|---|---|---|
| Balance sheet detail | |||
| Trade receivables (EUR) | 69.2M | 71M | 73.1M |
| ↳ YoY growth | +2.6% | +3.0% | |
| Borrowings, current (EUR) | 7.03M | 2.45M | 493,000 |
| Borrowings, non-current (EUR) | 301M | 248M | 249M |
| Lease liabilities (EUR) | 10.1M | 10.9M | 16.6M |
| Cash and deposits (EUR) | 15.5M | 117M | 68.6M |
| Intangible assets (EUR) | 202M | 205M | 226M |
| Right-of-use assets (EUR) | 10.8M | 10.6M | 15M |
| Net debt (borrowings + leases - cash) (EUR) | 302M | 144M | 198M |
| Cash flow detail | |||
| Operating cash flow (EUR) | 50.5M | 96.3M | 107M |
| Dividends paid (cash effect) (EUR) | — | 0.00 | -5.08M |
| Income taxes paid (cash effect) (EUR) | -6.87M | -6.67M | -18.6M |
| Share-based compensation (EUR) | 1.6M | 2.9M | 5.7M |
| Income detail | |||
| Total comprehensive income (EUR) | 19M | 31.9M | 36.5M |
| Comprehensive income to owners (EUR) | 19M | 31.9M | 36.5M |
| Reported | Apr 29, 2025 | Mar 9, 2026 | Mar 9, 2026 |
Podcast Mentions
Regulated information filed with the AMF (info-financiere.gouv.fr), newest first, titles as filed. Voting-rights totals, own-share transactions, threshold crossings and availability notices are left out. The link opens the filed document. Press releases from the company's own website, newest first.
Exosens delivers +23.5% revenue growth in Q3 2026


Oct 27th 2026
Exosens delivers +23.5% revenue growth in Q3 2026, driven by stronger demand and faster-than-expected capacity ramp-up
Fully on track to meet upgraded 2026 outlook
PRESS RELEASE
MÉRIGNAC, FRANCE – 27 OCTOBER 2026
HIGHLIGHTS
- Group revenue up +18.0% to €386.9 million in 9M 2026, including +14.4% LFL ; clear acceleration in Q3 to +23.5%, including +20.5% LFL (vs. +11.4% LFL in H1), driven by strong commercial momentum and faster-than-expected capacity ramp-up
- Amplification revenue up +15.5% in 9M 2026, with growth accelerating to +23.9% in Q3, driven by increasing global demand for high-performance image intensifier tubes in mission-critical night vision applications and faster-than-expected ramp-up of additional European production capacity
- D&I revenue up +23.7% in 9M 2026, including +14.1% LFL, reflecting the increasing adoption of Exosens' advanced imaging solutions across defense and surveillance markets, particularly in drone and counter-drone applications, alongside strong momentum in nuclear instrumentation, notably for next-generation SMRs
- Adjusted gross margin up +16.1% to €194.9 million in 9M 2026 (margin of 50.4%), with double-digit growth across Amplification (+14.1%) and D&I (+21.1%) segments
- Key milestone in the U.S.: first delivery order for 1,600 BiNOD systems, establishing Exosens as a supplier of complete night vision systems to the U.S. Army
- Strong operational execution: image intensifier tube production capacity on track to increase by 40% across Europe and the U.S. by 2027, with the first phase in Europe implemented and production ramping up faster than expected
- Scaling production of advanced imaging solutions: capacity set to triple for thermal cameras and double for cooled infrared cameras in 2026, to meet growing demand across drone, counter-drone and long-range surveillance applications
OUTLOOK
- Upgraded 2026 outlook confirmed: c.20% revenue growth and c.25% adjusted EBITDA growth at midpoint vs. 2025, implying further profitability improvement
- Revenue in the range of €558 million to €570 million
- Adjusted EBITDA in the range of €186 million to €192 million
- Capital expenditure at around 9% of revenue (excluding capitalized R&D), driven by production capacity expansion in Europe and the United States
Exosens (EXENS; FR001400Q9V2), a high-tech company focused on providing mission- and performance-critical amplification, detection and imaging technologies, today publishes its revenue and adjusted gross margin for the nine-month period ended 30 September 2026.
“Our nine-month performance demonstrates both strong commercial momentum and disciplined execution, with revenue growth reaching +18.0% over the period and accelerating to +23.5% in the third quarter. In Amplification, our additional European capacity for image intensifier tubes is ramping up ahead of plan, enabling us to serve strong demand for night vision solutions sooner than anticipated, while our first BiNOD delivery order marks a key step in building our presence in the U.S. market. In D&I, our advanced imaging technologies continue to gain traction in drone, counter-drone and long-range surveillance applications, as we scale production capacity to meet growing demand. Further progress in next-generation nuclear projects, particularly in SMRs, also reinforces our long-term growth prospects. Building on this sustained momentum, we are fully on track to meet our upgraded 2026 guidance,” said Jérôme Cerisier, CEO of Exosens.
Revenue up +18.0% in 9M 2026, with growth accelerating to +23.5% in Q3 2026, driven by strong commercial momentum and faster-than-expected capacity ramp-up
| In € millions | 9M 2025 | 9M 2026 | Change (€m) | Change (%) | LFL (%) |
| Amplification | 231.8 | 267.8 | +36.0 | +15.5% | +14.5% |
| Detection & Imaging | 97.0 | 120.0 | +23.0 | +23.7% | +14.1% |
| Eliminations & Other | (0.9) | (0.9) | 0.0 | nm | nm |
| Total revenue | 327.8 | 386.9 | +59.1 | +18.0% | +14.4% |
Consolidated revenue amounted to €386.9 million in 9M 2026, up +18.0% (+€59.1 million) compared with €327.8 million in 9M 2025. This performance reflects the contributions from 2025 and 2026 acquisitions and strong like-for-like growth of +14.4%, driven by growing demand for mission-critical night vision and imaging solutions in defense and surveillance applications, alongside strong momentum in nuclear instrumentation. Growth accelerated markedly in Q3 2026 to +23.5%, including +20.5% like-for-like.
AMPLIFICATION
Amplification revenue amounted to €267.8 million (c.69% of Group sales) in 9M 2026, up +15.5% (+€36.0 million) compared with 9M 2025, including strong like-for-like growth of +14.5%. This sustained performance reflects increased image intensifier tube sales volumes and improved yields, together with the expected increase in NVLS' contribution as the year progressed. Revenue growth accelerated to +23.9% in Q3 2026, from +11.6% in H1 2026, as additional European production capacity ramped up faster than expected.
Growing global defense spending and multi-year programs to modernize armed forces are accelerating the procurement of advanced night vision systems. Against this backdrop, Exosens builds on its position as the world's leading supplier of high-performance, ITAR-free image intensifier tubes. The Group's technological leadership and scalable industrial capabilities enable it to meet growing demand from NATO and allied armed forces.
Demand continued to exceed available production capacity in 9M 2026. In this context, Exosens' ability to deliver higher volumes drove revenue growth, notably under major night vision procurement programs such as the OCCAR framework for the German and Belgian armed forces. Demand also continued to grow in other markets, particularly in Northern and Eastern Europe, as well as across several international markets. Adoption of 5G image intensifier technology also continued to expand among special forces in NATO countries.
Against this backdrop of accelerating global demand, Exosens continues to implement its investment plan to expand production capacity across Europe and the United States by 40% by 2027. The first phase in Europe was successfully implemented, with an extended operating schedule enabling production to run throughout August for the first time, while newly installed production equipment was commissioned. As a result, additional European production capacity ramped up faster than expected, enabling the Group to meet growing demand sooner than anticipated.
In the U.S., the rollout of the new manufacturing facility is underway, establishing scalable in-country production capacity to support future growth in the world's largest single night vision market. Underscoring the effectiveness of its industrial strategy, Exosens reached a key milestone in August 2026 when its U.S. subsidiary, Photonis Defense, was awarded a first delivery order for 1,600 complete systems under the U.S. Army’s Binocular Night Observation Device (BiNOD) program, as part of the broader US$352.6 million Indefinite-Delivery/Indefinite-Quantity (IDIQ) contract announced in March 2026.
The order marks the transition from key testing and qualification to the Low-Rate Initial Production (LRIP) phase, laying the foundation for regular production of BiNOD systems in the United States. First product deliveries are expected by the end of 2026, with the bulk of deliveries scheduled throughout 2027. Photonis Defense will manufacture and test the complete BiNOD systems in the U.S., integrating Exosens’ high-performance image intensifier tubes.
DETECTION & IMAGING
D&I revenue reached €120.0 million (c.31% of Group sales) in 9M 2026, up +23.7% (+€23.0 million) compared with 9M 2025. This performance reflects the contributions from 2025 and 2026 acquisitions (Noxant, Phasics, Emberion) and strong like-for-like growth of +14.1%, driven by accelerating demand for advanced imaging solutions in defense and surveillance markets, particularly in drone and counter-drone applications, alongside strong momentum in nuclear instrumentation, notably for next-generation Small Modular Reactors (SMRs).
Defense & Surveillance
Imaging technologies are becoming central to modern defense operations, driven by two structural trends: (i) the growing integration of advanced optronic technologies into defense platforms, and (ii) the proliferation of drones and counter-drone systems that are becoming a core pillar of modern warfare and reshaping conventional defense operations. Against this favorable backdrop, Exosens is well positioned to capitalize on accelerating demand for advanced imaging solutions through its comprehensive portfolio of technologies enabling situational awareness, threat detection, identification and tracking, targeting, and long-range observation across a wide range of defense and surveillance applications.
Commercial momentum continued to build in 9M 2026, particularly in the fast-growing drone and counter-drone space, with Exosens' advanced imaging solutions gaining further adoption among leading OEMs and autonomous defense systems developers. The Group's understanding of UxV technological requirements and its support throughout the design-in phase help customers bring new systems to market faster. In addition, its agile supply chain and scalable industrial capabilities allow it to respond swiftly to accelerating market demand.
Surveillance markets also gained further momentum, driven by increasing investment in homeland security and counter-drone capabilities amid growing concerns over ground and airborne incursions. Demand was particularly strong for advanced imaging solutions used in long-range observation and counter-drone systems, with Exosens' technologies increasingly adopted by leading OEMs and system integrators.
To meet growing demand, Exosens is implementing plans to triple production capacity for thermal cameras and double capacity for cooled infrared cameras in 2026. Together, these increases highlight the Group's ability to anticipate evolving market requirements and scale production accordingly.
Commercial Markets
In Nuclear, demand for advanced detectors and instrumentation remained strong in 9M 2026, driven by growing investment in next-generation nuclear technologies, particularly SMRs. The nuclear market continues to benefit from rising demand for reliable, carbon-free power, driven by the rapid expansion of AI data centers and their substantial energy needs, reinforcing the long-term prospects for SMRs.
In the U.S., progress under the Department of Energy’s (DOE) Reactor Pilot Program highlights the accelerating deployment of next-generation reactors. Exosens supplied advanced neutron flux monitoring detectors and related technical expertise to Antares Nuclear and Valar Atomics, the developers behind the first two reactor designs to reach criticality under the program. These milestones are expected to lead to pre-series production orders in the near term and support long-term demand for Exosens’ nuclear instrumentation solutions across the U.S. market.
In Industrial Control, market conditions continued to show signs of recovery in 9M 2026. The expansion of AI infrastructure is expected to drive investment in semiconductor manufacturing and industrial automation, supporting long-term structural demand for Exosens' advanced imaging technologies in semiconductor inspection, machine vision and real-time process monitoring. The Group is well positioned to benefit from these trends through its cutting-edge portfolio of infrared, UV and wavefront sensing technologies.
In Life Sciences, market conditions were mixed in 9M 2026. Global uncertainty weighed on scientific research and demand for microscopy components, while inventory drawdowns in mass spectrometry, now complete, softened demand for advanced detectors. Despite these temporary headwinds, market fundamentals remain favorable, driven by the shift towards higher-performance mass spectrometry systems. Rising private-sector R&D, notably in low-carbon materials and semiconductor testing, also drives long-term demand for the Group's electron microscopy detectors. In this context, Exosens has secured design-ins for its technologies in several major projects, supporting growth in the coming years.
M&A
On 24 April 2026, Exosens completed the acquisition of Emberion, a Finland- and UK-based company specializing in the design and manufacturing of innovative infrared sensors leveraging patented quantum dot imaging technology. This acquisition strengthens Exosens’ advanced imaging portfolio with emerging quantum dot-based short-wave infrared sensors, supporting new opportunities in surveillance imaging, notably for drone-based systems, and in industrial applications such as semiconductor inspection.
Adjusted gross margin up +16.1% in 9M 2026
| 9M 2025 | 9M 2026 | Change | ||||
| In €m | % of sales | In €m | % of sales | In €m | In % | |
| Amplification | 121.8 | 52.5% | 138.9 | 51.9% | +17.1 | +14.1% |
| Detection & Imaging | 46.1 | 47.6% | 55.9 | 46.6% | +9.7 | +21.1% |
| Eliminations & Other | 0.1 | nm | 0.2 | nm | +0.1 | nm |
| Adjusted gross margin | 168.0 | 51.2% | 194.9 | 50.4% | +27.0 | +16.1% |
The Group's adjusted gross margin reached €194.9 million in 9M 2026, up +16.1% (+€27.0 million) compared with €168.0 million in 9M 2025. The margin rate decreased by (85) basis points to 50.4% in 9M 2026 (versus 51.2% in 9M 2025). This reflects product mix effects in both segments, driven by the ramp-up of NVLS' deliveries of complete night vision systems and strong revenue growth in defense imaging. Staffing costs at the U.S. facility also weighed on the margin rate. These effects were partly offset by higher image intensifier tube sales volumes and improved yields. In addition, the comparison base was particularly high in Q3 2025. The Group's upgraded full-year guidance already factors in these operating effects.
The Amplification segment's adjusted gross margin totaled €138.9 million in 9M 2026, up +14.1% (+€17.1 million) compared with 9M 2025. The margin rate decreased by (68) basis points to 51.9% in 9M 2026 (versus 52.5% in 9M 2025). As expected, the ramp-up of NVLS' deliveries of complete night vision systems in Q3 2026, following a limited contribution in H1 2026, resulted in a less favorable product mix year on year, as NVLS, acquired in July 2025, contributed negligible revenue in 9M 2025. Staffing costs at the U.S. facility also weighed on the segment's margin rate. These effects were partly offset by higher image intensifier tube sales volumes and improved yields. In addition, the comparison base was particularly high in Q3 2025, when the segment's margin rate reached 54.9%, versus 50.5% for full-year 2025.
The Detection & Imaging segment's adjusted gross margin amounted to €55.9 million in 9M 2026, up +21.1% (+€9.7 million) compared with 9M 2025. The margin rate declined by (103) basis points to 46.6% in 9M 2026 (versus 47.6% in 9M 2025). This margin contraction reflects a less favorable product mix, driven by the increased weight of fast-growing defense imaging products relative to higher-margin detectors, particularly those used in life sciences.
Upgraded 2026 outlook confirmed: c.20% revenue growth and c.25% adjusted EBITDA growth at midpoint vs. 2025, implying further profitability improvement
Building on sustained commercial momentum, reflected in the clear acceleration in like-for-like revenue growth in the third quarter, as well as continued disciplined execution, Exosens confirms its upgraded full-year 2026 guidance announced on 17 September 2026.
The Group expects:
- Revenue in the range of €558 million to €570 million;
- Adjusted EBITDA in the range of €186 million to €192 million;
- Capital expenditure at around 9% of revenue (excluding capitalized R&D expenses of around 3% of revenue), driven by production capacity expansion in Europe and the U.S.
Exosens will communicate its full-year 2027 guidance upon publication of the Group’s full-year 2026 results on 22 February 2027.
Download the full press release - EN
Financial calendar
- 22/02/2027: FY 2026 results (before market opening).
Investor Relations
Laurent Sfaxi, [email protected]
Media Relations
Brunswick Group, [email protected]
Related content

Event

Hannover.

FROM Mar 09th 2027 TO Mar 12th 2027
DSEI Germany 2027

Financial press release
Oct 27th 2026
9M 2026 Results
Exosens delivers +23.5% revenue growth in Q3 2026

Event
Shanghai.

FROM Mar 08th 2027 TO Mar 10th 2027
Laser world of photonics 2027
Join Exosens at LASER WORLD OF PHOTONICS SHANGHAI from 8 March 2027 to 10 March 2027 in Shanghai, China

Event
Nuremberg.
FROM Mar 01st 2027 TO Mar 03rd 2027
ENFORCE TAC 2027
Join Exosens at SPIE BIOS from 30 January 2027 to 31 January 2027 in San Francisco, USA

Event
Orlando.

FROM Jan 11th 2027 TO Jan 15th 2027
AIAA SciTech 2027
Join Exosens at AIAA SciTech from 11 January 2027 to 15 January 2027 in Orlando, USA
Stay connected
Stay informed and connected to the latest news from Exosens by signing up.
Subscribe


-
Product Types Cameras Detectors & Sensors Image Intensifier Tubes Measurement Systems
-
Applications Analytical Environment Imaging defense Industrial & NDT Laser & Optical Metrology Night vision Nuclear & Radiation Scientific Surveillance
-
Company
Unlocking the Full Potential of SWIR
Oct 20th 2026
Markets
Technologies
Quantum Dot SWIR Imaging: Unlocking the Full Potential of SWIR
The Promise and Challenge of SWIR Imaging
Short-wave infrared (SWIR) imaging reveals information that conventional visible-light cameras cannot. SWIR wavelengths can penetrate haze, smoke, plastics, paint layers, and even biological tissues while providing valuable insights into material composition. These capabilities make SWIR an attractive technology for industrial inspection, security, healthcare, scientific imaging, and environmental monitoring.

Despite its advantages, SWIR remains a niche technology, not because of limited performance, but because its cost has outweighed the benefits for many applications.
That equation is now beginning to change. Colloidal quantum dot (CQD) technology is introducing a more scalable and cost-effective approach to SWIR sensor manufacturing, opening the door to wider deployment across industries that previously viewed SWIR as out of reach.
Why Traditional SWIR Technologies Remain Expensive
Today's dominant SWIR detector technologies , including InGaAs, MCT, and T2SL, rely on complex epitaxial growth processes and specialized substrate materials. While these technologies deliver excellent performance, they are expensive to manufacture and challenging to scale for high-volume production.
As a result, SWIR imaging has traditionally been limited to applications where performance outweighs cost considerations. Many industries have continued to rely on visible or near-infrared imaging systems, even when SWIR could deliver significantly more information.
This manufacturing challenge created the opportunity for a different approach.
Quantum Dot SWIR Imaging: Breaking the Cost Barrier
Colloidal quantum dot photodetectors offer a fundamentally different route to SWIR imaging. Rather than relying on costly semiconductor growth processes, quantum dots are nanoscale crystals synthesized in solution and deposited directly onto silicon readout circuits.
By leveraging mature silicon manufacturing infrastructure, this approach has the potential to reduce production complexity, lower sensor costs, and enable larger-scale manufacturing. The result is a technology platform that can make SWIR imaging accessible to a much broader range of markets.
The commercial impact of this transition is already becoming visible. The first commercially available CQD SWIR cameras entered the market approximately five years ago, with Exosens Imaging UK (formerly Emberion), now part of Exosens, pioneering the technology. Since then, SWIR camera prices have steadily decreased while adoption has continued to expand.
As the cost of implementation falls, more organizations are evaluating SWIR not as a specialized capability, but as a practical and economically viable imaging solution.
Spectral Flexibility Built into the Material
Beyond lower cost, quantum dots offer exceptional spectral flexibility. By adjusting the size and composition of the nanocrystals during synthesis, detector response can be tailored to specific wavelength ranges, including extended SWIR regions beyond the reach of standard InGaAs sensors.
This tunability also enables multiband imaging on a single sensor. Different quantum dot materials can be integrated onto the same focal plane array, allowing simultaneous capture of multiple SWIR bands without the need for separate detector stacks.
The result is a compact imaging solution capable of supporting applications such as material identification, gas detection, de-camouflaging, adverse-weather imaging, and advanced spectral analysis. By combining multiple spectral channels into a single device, quantum dot technology can simplify system design while expanding imaging capabilities.
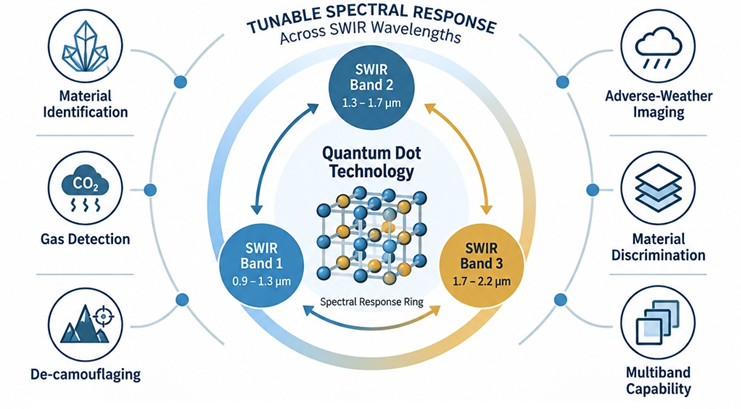
Figure 1: Quantum dot technology enables tunable multiband SWIR imaging for advanced sensing and material analysis.
Looking Beyond SWIR
The same materials science that enables tunable SWIR detection may eventually extend into the mid-wave infrared (MWIR) region.
At operating temperatures around -60°C, CQD detectors have demonstrated performance comparable to MCT technologies while offering the possibility of substantially lower system costs. Although still an emerging opportunity, it highlights the longer-term potential of quantum dot platforms beyond SWIR imaging alone.
Public Safety and Security
SWIR imaging delivers reliable performance in smoke, haze, dust, and other challenging visibility conditions. From firefighting and hotspot detection to border security and surveillance, more affordable SWIR sensors could enable wider deployment across fixed, mobile, and airborne platforms.
Industrial Inspection and Automation
SWIR reveals features and defects that are difficult to detect with visible-light imaging alone. Applications range from plastic part inspection and quality control to plastics recycling and mineral sorting, where lower sensor costs can make large-scale deployment more practical.
Healthcare and Diagnostics
By penetrating biological tissue more effectively than visible and near-infrared light, SWIR can support applications such as ophthalmology, melanoma detection, and tissue assessment. Cost-effective CQD sensors could also accelerate the adoption of portable diagnostic devices, wearable biosensors, and point-of-care healthcare solutions.
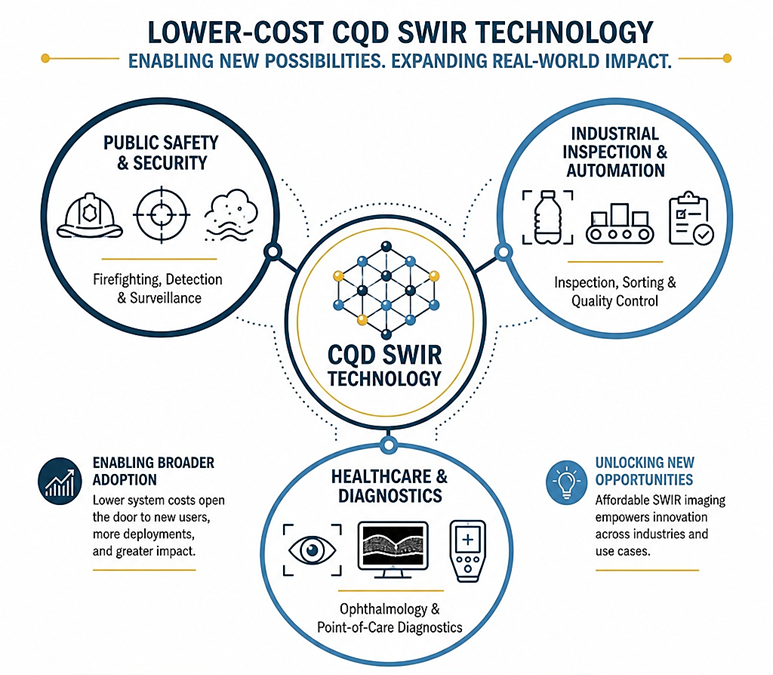
Figure 2: Affordable CQD SWIR sensors are enabling broader adoption and unlocking new application opportunities.
From Innovation to Industrialisation: Exosens and Exosens Imaging UK (formerly Emberion)
The acquisition of Exosens Imaging UK (formerly Emberion) by Exosens represents an important milestone in the commercialization of quantum dot SWIR technology.
Exosens Imaging UK's (formerly Emberion) pioneering work helped establish some of the first commercial CQD SWIR imaging solutions. Combined with Exosens' expertise across imaging technologies from UV to LWIR, the technology now benefits from stronger manufacturing capabilities, broader application knowledge, and global market reach.
Together, these strengths position quantum dot imaging for wider adoption across industrial, security, scientific, and healthcare markets.
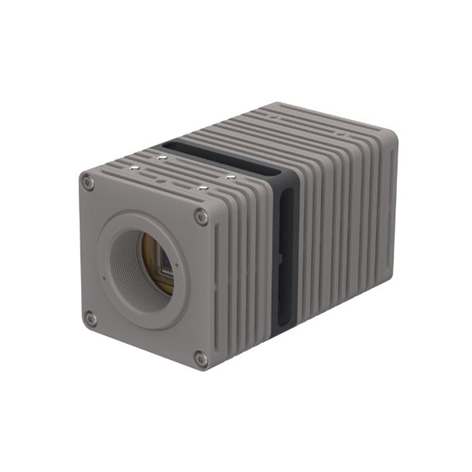
Figure 3: Exosens SWIR VS20 camera based on CQD technology
From Niche Technology to Mainstream Imaging
SWIR imaging has long been limited by high detector costs. Quantum dot technology is changing that through more scalable manufacturing, lower costs, and greater spectral flexibility. As the technology matures, it has the potential to move SWIR from a niche sensing capability to a mainstream imaging technology, enabling new applications and expanding access to advanced spectral imaging.
Related content
Event
Hannover.
FROM Mar 09th 2027 TO Mar 12th 2027
DSEI Germany 2027
Financial press release
Oct 27th 2026
9M 2026 Results
Exosens delivers +23.5% revenue growth in Q3 2026
Event
Shanghai.
FROM Mar 08th 2027 TO Mar 10th 2027
Laser world of photonics 2027
Join Exosens at LASER WORLD OF PHOTONICS SHANGHAI from 8 March 2027 to 10 March 2027 in Shanghai, China
Event
Nuremberg.
FROM Mar 01st 2027 TO Mar 03rd 2027
ENFORCE TAC 2027
Join Exosens at SPIE BIOS from 30 January 2027 to 31 January 2027 in San Francisco, USA
Event
Orlando.
FROM Jan 11th 2027 TO Jan 15th 2027
AIAA SciTech 2027
Join Exosens at AIAA SciTech from 11 January 2027 to 15 January 2027 in Orlando, USA
Stay connected
Stay informed and connected to the latest news from Exosens by signing up.
Subscribe
-
Product Types Cameras Detectors & Sensors Image Intensifier Tubes Measurement Systems
-
Applications Analytical Environment Imaging defense Industrial & NDT Laser & Optical Metrology Night vision Nuclear & Radiation Scientific Surveillance
-
Company
Exosens supports the accelerating deployment of next-generation nuclear technologies in the U.S.
Oct 08th 2026
Markets
Technologies
Exosens supports the accelerating deployment of next-generation nuclear technologies in the U.S.
PRESS RELEASE
MÉRIGNAC, FRANCE – OCTOBER, 8TH 2026
- Key milestones achieved under the U.S. Department of Energy’s Reactor Pilot Program highlight the accelerating deployment of next-generation nuclear technologies
- Exosens’ advanced neutron flux monitoring detectors supported successful criticality demonstrations by Antares Nuclear and Valar Atomics, underscoring the relevance of its technologies across Small Modular Reactor (SMR) applications
- These achievements are expected to translate into near-term pre-series production orders and support long-term demand for Exosens’ nuclear instrumentation solutions
Exosens (EXENS; FR001400Q9V2), a high-tech company focused on providing mission- and performance-critical amplification, detection and imaging technologies, today announces its contribution to two successful criticality demonstrations for next-generation nuclear reactors under the U.S. Department of Energy’s Reactor Pilot Program.
In August 2025, the program initially selected 11 advanced reactor projects with the goal of bringing at least three reactor designs to criticality by 4 July 2026. The program exceeded that objective, with four projects reaching this milestone by the deadline. These achievements mark a decisive step towards the commercial deployment of next-generation nuclear technologies on an accelerated timeline in the United States, particularly across SMR applications.
Against this backdrop, Exosens supplied high-performance neutron detectors and related technical expertise to Antares Nuclear and Valar Atomics, the developers behind the first two reactor designs to reach criticality as part of the DOE’s Reactor Pilot Program. Integrated into safety-related neutron flux monitoring systems, these advanced detectors provide the measurements required to monitor reactor power and track the approach to criticality during start-up and testing.
These achievements are expected to translate into pre-series production orders in the near term and support long-term demand for Exosens’ nuclear instrumentation solutions across the U.S. market.
“The move towards commercial deployment of next-generation nuclear technologies is accelerating in the United States, supported by increasing demand for reliable, carbon-free power, notably to meet the unprecedented energy requirements of AI-enabled data centers. This momentum is reinforcing investment in SMR technologies and driving demand for high-performance instrumentation designed for demanding nuclear environments, creating significant long-term growth opportunities for Exosens. Already providing advanced nuclear detection solutions for seven SMR-related projects across the United States and Europe, Exosens leverages its differentiated technologies, deep nuclear expertise and industrial capabilities to address these needs and support the long-term development of the SMR market,” said Jérôme Cerisier, CEO of Exosens.
“Achieving criticality is a defining milestone in next-generation reactor development. The progress made by Antares Nuclear and Valar Atomics demonstrates the pace of innovation across the U.S. nuclear industry. We are proud to have supported these successful demonstrations through Exosens’ advanced neutron flux monitoring technologies, and look forward to helping reactor developers as they move from first-of-a-kind testing towards safe, reliable commercial deployment,” said Cyril Barre, Nuclear Instrumentation Director at Exosens.
Download the press release - EN
Financial calendar
- 27/10/2026: 9M 2026 revenue and adjusted gross margin (before market opening).
- 22/02/2027: FY 2026 results (before market opening).
Investor Relations
Laurent Sfaxi, [email protected]
Media Relations
Brunswick Group, [email protected]
Related content
Event
Hannover.
FROM Mar 09th 2027 TO Mar 12th 2027
DSEI Germany 2027
Financial press release
Oct 27th 2026
9M 2026 Results
Exosens delivers +23.5% revenue growth in Q3 2026
Event
Shanghai.
FROM Mar 08th 2027 TO Mar 10th 2027
Laser world of photonics 2027
Join Exosens at LASER WORLD OF PHOTONICS SHANGHAI from 8 March 2027 to 10 March 2027 in Shanghai, China
Event
Nuremberg.
FROM Mar 01st 2027 TO Mar 03rd 2027
ENFORCE TAC 2027
Join Exosens at SPIE BIOS from 30 January 2027 to 31 January 2027 in San Francisco, USA
Event
Orlando.
FROM Jan 11th 2027 TO Jan 15th 2027
AIAA SciTech 2027
Join Exosens at AIAA SciTech from 11 January 2027 to 15 January 2027 in Orlando, USA
Stay connected
Stay informed and connected to the latest news from Exosens by signing up.
Subscribe
-
Product Types Cameras Detectors & Sensors Image Intensifier Tubes Measurement Systems
-
Applications Analytical Environment Imaging defense Industrial & NDT Laser & Optical Metrology Night vision Nuclear & Radiation Scientific Surveillance
-
Company
PRESS RELEASE MÉRIGNAC, FRANCE – 1 OCTOBER 2026
MONTHLY INFORMATION ON THE TOTAL NUMBER OF SHARES AND VOTING RIGHTS IN THE SHARE CAPITAL In accordance with articles L. 233-8 II of the French Commercial Code and 223-16 of the General Regulations of the French Autorité des Marchés Financiers ISIN code: FR001400Q9V2
Date
Total number of shares
Total number of voting rights
30/09/2026
50,936,749
Number of theoretical voting rights: 59,426,420 Number of exercisable voting rights*: 59,173,206
- After deduction of treasury shares without voting rights.
Sep 28th 2026
Markets
Technologies
Quantum Computing and the Role of Intensified Cameras in Ion-Trap Detection
Understanding how sensitive imaging supports fluorescence-based quantum state readout
Quantum computing represents a fundamentally different approach to information processing. Unlike classical computers that use bits, quantum computers use quantum bits (qubits), which can exist in multiple states simultaneously through the principles of quantum mechanics. This capability enables quantum systems to tackle highly complex calculations that would be impractical for conventional computers.
Over the years, researchers have explored multiple approaches to realizing practical quantum computers. Today, three leading architectures dominate the field: superconducting circuits, semiconductor quantum chips, and ion-trap quantum computing. Among these technologies, ion-trap systems have attracted significant attention due to their high-fidelity operations, long coherence times, reliable state preparation, and reproducible qubit performance.
As quantum computing systems scale toward larger numbers of qubits, the ability to accurately observe and measure individual ion states becomes increasingly important. This creates new challenges for imaging and detection technologies.
Among these approaches, ion-trap quantum computing is particularly relevant to optical detection because the state of each ion is commonly determined by observing emitted fluorescence.
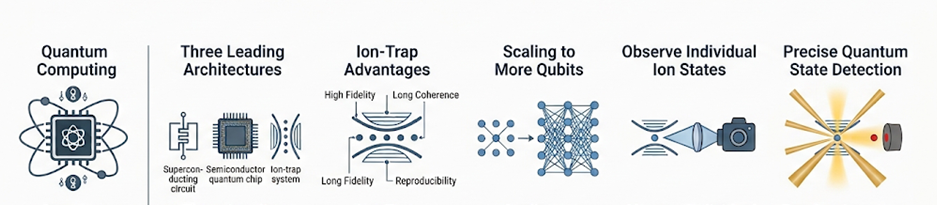
Figure 1: From quantum computing architectures to precision ion-state detection.
Ion-Trap Quantum Computing: Controlling Ions and Reading Their States
In an ion-trap quantum computer, qubits are represented by charged atoms (ions) that are confined and manipulated using precisely controlled electric and magnetic fields. Lasers are used to cool, control, and interrogate these ions, enabling quantum operations and state measurements.
One of the critical steps in ion-trap quantum computing is quantum state readout. During this process, ions emit extremely weak fluorescence signals that must be detected with high sensitivity and precision. Since ions are microscopic targets producing very low light levels, the imaging system needs to be capable of distinguishing these faint signals quickly and accurately.
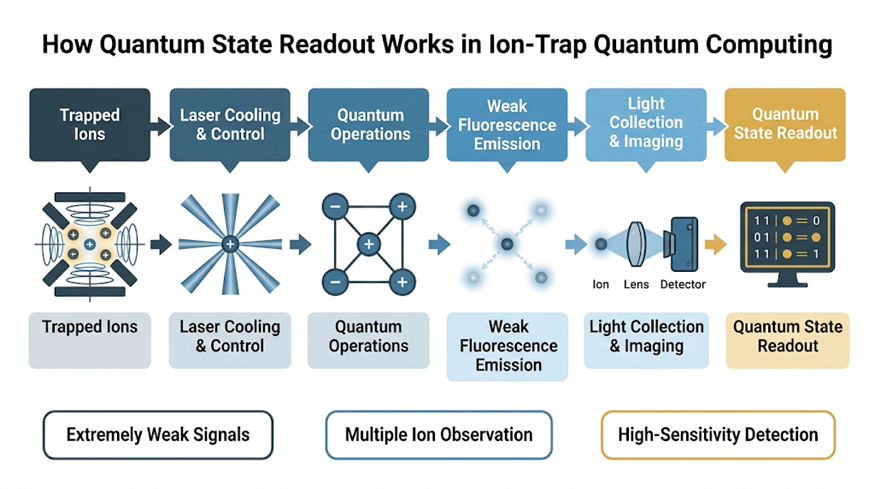
Figure 2: Simplified quantum state readout process in an ion-trap quantum computing system.
As quantum processors evolve toward larger and more complex architectures, detection systems must also support the observation of multiple ions simultaneously while maintaining measurement accuracy and reliability.
Imaging Challenges in Quantum State Detection
Traditionally, many ion-trap systems rely on Electron Multiplying Charge-Coupled Device (EMCCD) cameras for fluorescence detection. EMCCDs provide high sensitivity and have long been used for low-light scientific imaging applications.
Depending on system requirements and sourcing conditions, developers may encounter several practical considerations when integrating EMCCD-based solutions, including:
-
High acquisition costs
-
Long and sometimes unpredictable delivery times
-
System integration constraints due to size and weight
-
Limitations when designing compact quantum computing platforms
As quantum computing research accelerates, there is growing demand for alternative imaging technologies that can deliver comparable low-light performance while offering greater flexibility and easier system integration.
Intensified Cameras: An Alternative Approach for Ion Detection
Exosens' iNocturn series
intensified cameras provide an alternative solution for low-light quantum detection applications. Leveraging image intensifier technology, these cameras are designed to support the detection of extremely weak optical signals, including fluorescence-based measurements in ion-trap research.
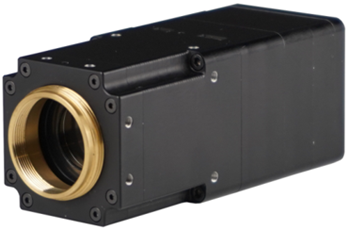
Figure 3: iNocturn intensified camera for low-light scientific imaging and detection applications
The compact design, low weight, and integration-friendly architecture make intensified cameras particularly attractive for research and development environments where system flexibility is essential.
Key advantages include:
-
High sensitivity for detecting low-light ion emissions
-
Compact and lightweight design
-
Simplified system integration
-
Reduced dependence on EMCCD availability
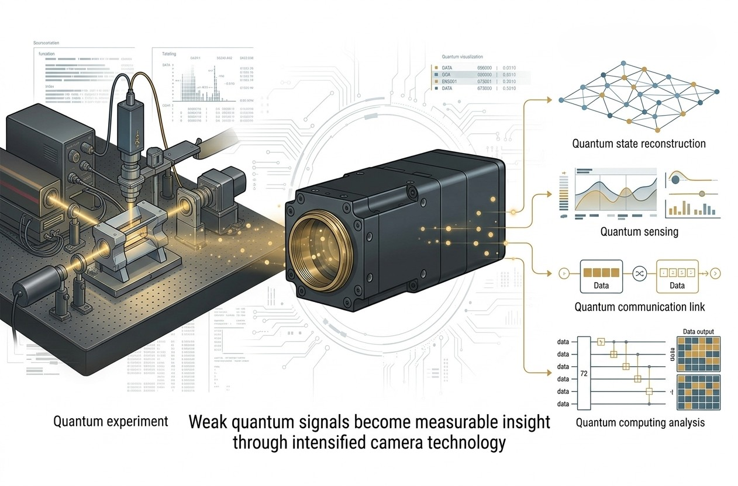
Figure 4: Intensified imaging converts weak optical signals from an ion-trap experiment into measurable data for quantum state analysis.
Enabling the Next Generation of Quantum Computing Systems
As ion-trap quantum computers continue to evolve, high-performance imaging systems will remain a critical component of accurate quantum state measurement. Intensified cameras provide a compelling alternative for researchers seeking sensitive, compact, and integration-ready detection solutions. By combining low-light imaging performance with operational flexibility, Exosens' iNocturn series helps support the demanding requirements of modern ion-trap quantum computing platforms and offers a new approach to fluorescence-based ion detection.
Key Takeaway
Accurate quantum state detection is critical for ion-trap quantum computing. Intensified cameras provide the sensitivity needed to capture extremely weak ion fluorescence, enabling reliable qubit measurement and system performance.
Quantum computing depends not only on advanced qubit architectures but also on the ability to accurately observe and measure quantum states. For ion-trap systems, where detection of extremely weak fluorescence signals is essential, intensified cameras offer a practical and high-performance imaging solution. Exosens' iNocturn series delivers the sensitivity, compactness, and ease of integration needed to support next-generation quantum computing research and development.
Related content
Event
Hannover.
FROM Mar 09th 2027 TO Mar 12th 2027
DSEI Germany 2027
Financial press release
Oct 27th 2026
9M 2026 Results
Exosens delivers +23.5% revenue growth in Q3 2026
Event
Shanghai.
FROM Mar 08th 2027 TO Mar 10th 2027
Laser world of photonics 2027
Join Exosens at LASER WORLD OF PHOTONICS SHANGHAI from 8 March 2027 to 10 March 2027 in Shanghai, China
Event
Nuremberg.
FROM Mar 01st 2027 TO Mar 03rd 2027
ENFORCE TAC 2027
Join Exosens at SPIE BIOS from 30 January 2027 to 31 January 2027 in San Francisco, USA
Event
Orlando.
FROM Jan 11th 2027 TO Jan 15th 2027
AIAA SciTech 2027
Join Exosens at AIAA SciTech from 11 January 2027 to 15 January 2027 in Orlando, USA
Stay connected
Stay informed and connected to the latest news from Exosens by signing up.
Subscribe
-
Product Types Cameras Detectors & Sensors Image Intensifier Tubes Measurement Systems
-
Applications Analytical Environment Imaging defense Industrial & NDT Laser & Optical Metrology Night vision Nuclear & Radiation Scientific Surveillance
-
Company
Exosens raises full-year 2026 guidance, driven by faster-than-expected capacity ramp-up and strong commercial momentum
Sep 17th 2026
Exosens raises full-year 2026 guidance, driven by faster-than-expected capacity ramp-up and strong commercial momentum
PRESS RELEASE
MÉRIGNAC, FRANCE – SEPTEMBER, 17TH 2026
- Faster-than-expected ramp-up of additional European production capacity for high-performance image intensifier tubes, meeting growing global demand for advanced night vision solutions sooner than anticipated
- Accelerating adoption of mission-critical imaging technologies across drone, counter-drone and long-range surveillance applications
- Strong momentum in nuclear instrumentation, driven by increasing demand for next-generation SMR technologies
- 2026 guidance raised: c.20% revenue growth and c.25% adjusted EBITDA growth at midpoint vs. 2025, implying further profitability improvement
- Revenue in the range of €558-570 million (vs. €520-540 million previously)
- Adjusted EBITDA in the range of €186-192 million (vs. €168-178 million previously)
Exosens (EXENS; FR001400Q9V2), a high-tech company focused on providing mission- and performance-critical amplification, detection and imaging technologies, today announces an upward revision to its full-year 2026 guidance.
This guidance upgrade builds on Exosens’ strong first-half 2026 performance and reflects sustained commercial momentum and continued disciplined execution driving industry-leading profitability.
In Amplification, Exosens maintained production throughout August at its European facilities for the first time, with the extended operating schedule implemented as planned. Newly installed production equipment was also successfully commissioned. These operational milestones have confirmed the faster-than-expected ramp-up of additional capacity for high-performance image intensifier tubes in Europe, enabling the Group to meet growing global demand for advanced night vision solutions sooner than anticipated.
In Detection & Imaging, Exosens continues to benefit from the accelerating adoption of its mission-critical imaging technologies across drone, counter-drone and long-range surveillance applications. To meet this growing customer demand, the Group is scaling its industrial capabilities, with plans to triple production capacity for thermal cameras and double capacity for cooled infrared cameras in 2026. Commercial momentum in nuclear instrumentation also remains strong, particularly in next-generation SMR applications.
Against this backdrop, Exosens is raising its full-year 2026 guidance and now expects:
- Revenue in the range of €558 million to €570 million (compared with €520 million to €540 million previously);
- Adjusted EBITDA in the range of €186 million to €192 million (compared with €168 million to €178 million previously);
- Capital expenditure at around 9% of revenue (excluding capitalized R&D expenses of around 3% of revenue), driven by production capacity expansion in Europe and the U.S. (unchanged).
“Building on our strong first-half performance, we continue to see sustained commercial momentum across our markets. The faster-than-expected ramp-up of additional European production capacity for high-performance image intensifier tubes enables us to meet growing global demand for advanced night vision solutions sooner than anticipated. At the same time, our imaging technologies continue to gain traction, particularly across drone and surveillance applications, while demand in the nuclear market remains strong. This sustained momentum, combined with continued operational discipline, gives us confidence to raise our full-year 2026 guidance and supports our industry-leading profitability. Firmly focused on executing our strategy, we are well positioned to leverage our expanding industrial capabilities and recognized technology leadership to capture additional commercial opportunities and deliver sustained profitable growth over the long term,” said Jérôme Cerisier, CEO of Exosens.
Exosens will communicate its full-year 2027 guidance upon publication of the Group’s full-year 2026 results on 22 February 2027.
Financial calendar
- 27/10/2026: 9M 2026 revenue and adjusted gross margin (before market opening).
- 22/02/2027: FY 2026 results (before market opening).
Download the full press release
Investor Relations
Laurent Sfaxi, [email protected]
Media Relations
Brunswick Group, [email protected]
Related content
Event
Hannover.
FROM Mar 09th 2027 TO Mar 12th 2027
DSEI Germany 2027
Financial press release
Oct 27th 2026
9M 2026 Results
Exosens delivers +23.5% revenue growth in Q3 2026
Event
Shanghai.
FROM Mar 08th 2027 TO Mar 10th 2027
Laser world of photonics 2027
Join Exosens at LASER WORLD OF PHOTONICS SHANGHAI from 8 March 2027 to 10 March 2027 in Shanghai, China
Event
Nuremberg.
FROM Mar 01st 2027 TO Mar 03rd 2027
ENFORCE TAC 2027
Join Exosens at SPIE BIOS from 30 January 2027 to 31 January 2027 in San Francisco, USA
Event
Orlando.
FROM Jan 11th 2027 TO Jan 15th 2027
AIAA SciTech 2027
Join Exosens at AIAA SciTech from 11 January 2027 to 15 January 2027 in Orlando, USA
Stay connected
Stay informed and connected to the latest news from Exosens by signing up.
Subscribe
-
Product Types Cameras Detectors & Sensors Image Intensifier Tubes Measurement Systems
-
Applications Analytical Environment Imaging defense Industrial & NDT Laser & Optical Metrology Night vision Nuclear & Radiation Scientific Surveillance
-
Company
PRESS RELEASE MÉRIGNAC, FRANCE – 1 SEPTEMBER 2026
MONTHLY INFORMATION ON THE TOTAL NUMBER OF SHARES AND VOTING RIGHTS IN THE SHARE CAPITAL In accordance with articles L. 233-8 II of the French Commercial Code and 223-16 of the General Regulations of the French Autorité des Marchés Financiers ISIN code: FR001400Q9V2
Date
Total number of shares
Total number of voting rights
31/08/2026
50,936,749
Number of theoretical voting rights: 59,438,447 Number of exercisable voting rights*: 59,181,538
- After deduction of treasury shares without voting rights.
The Lens Was Assembled Correctly, So Why Does the MTF Test Fail?
Aug 31st 2026
Markets
Technologies
Optical System Alignment: The Lens Was Assembled Correctly, So Why Does the MTF Test Fail?
In optical manufacturing and lens assembly, engineers frequently face a frustrating scenario: every mechanical dimension measures within tolerance, lens element spacers match design values, threaded rings are torqued, and visual inspection is flawless. Yet, when placed on the testing bench, Modulation Transfer Function (MTF) testing shows a pass/fail rejection, dropping 10%–20% below design specifications at critical spatial frequencies.
While traditional MTF testing tells you that an optical system failed, it cannot tell you why. Finding the root cause using trial-and-error alignment often takes longer than building the assembly itself.
To overcome this, leading manufacturers are shifting from standalone MTF pass/fail criteria to combining MTF with wavefront measurement and Zernike aberration analysis. By inspecting wavefront errors, optical engineers can map MTF shortfalls directly to specific physical manufacturing defects, and correct them live.
1. The Physics of MTF Shortfall: Wavefront Degradation
MTF measures an optical system's ability to transfer contrast as a function of spatial frequency. At its core, MTF is a composite mathematical expression of wavefront aberration. Any optical performance loss during lens assembly is fundamentally an increase in wavefront error (WFE).
During lens assembly manufacturing, wavefront errors stem from three key areas:
- Component-Level Errors: Individual surface form departures, element thickness variations, or glass refractive index inhomogeneities.
- Positional Errors: Element decenter, tilt relative to the mechanical axis, and axial spacing deviations.
- Assembly Stress Errors: Surface deformation caused by overtightened retaining rings or residual thermal stresses from bonding.
2. Linking Zernike Aberrations to Real-World Production Defects
When MTF testing fails, breaking down the wavefront into Zernike polynomial aberrations allows you to pinpoint the exact manufacturing fault:
| Zernike Aberration Signature | Physical Production / Alignment Issue | Impact on Optical Performance |
|---|---|---|
| Coma | Element Decenter & Asymmetry: Barrel bore coaxiality errors, lens element centering errors, or uneven retaining-ring torque. | Asymmetric MTF between meridional and sagittal directions; severe off-axis degradation. |
| Astigmatism | Element Tilt & Mechanical Wedge: Non-perpendicular lens seats, unparallel spacer rings, or mechanical wedge. | Separation between meridional and sagittal MTF curves; elliptical Point Spread Function (PSF). |
| Spherical Aberration | Axial Spacing & Form Errors: Incorrect spacer thickness, stacked spacer tolerances, or wrong radius of curvature. | Uniform MTF drop across the entire field; aberration balance destruction between groups. |
| High Order / Trefoil / Trefoil-like | Assembly Stress Deformation: Bending deformation from overtightened retaining rings or epoxy shrinkage. | Mid-to-high spatial frequency MTF drop. |
3. Increasing Yield in Optical Manufacturing: Validating Sub-Assemblies Before Integration
A major bottleneck in optical manufacturing is validating complex sub-assemblies prior to final integration. Modern optical systems rely on multiple stacked sub-assemblies; while the fully completed lens must meet strict performance targets, individual sub-assemblies are often highly aberrated by design. Validating these inherently aberrated groups against their optical design is complex, yet essential. If a defective sub-assembly is integrated into a complete lens stack, identifying which specific optic caused an end-stage MTF failure requires costly, time-consuming disassembly.
To solve this challenge, Phasics customers implement single-pass, wavefront-based comparisons to nominal design at the sub-assembly stage. Catching manufacturing defects early drastically increases overall production yield and reduces final alignment time.
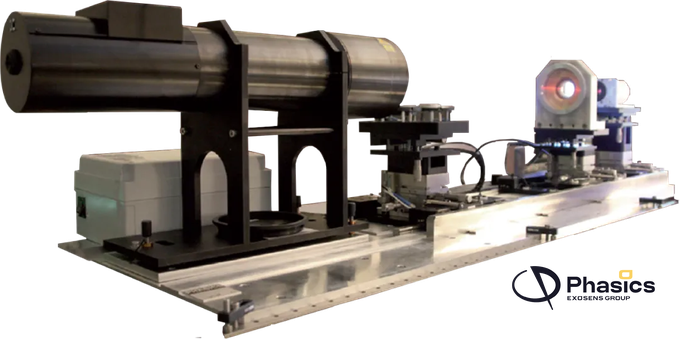
Figure 1: PHASICS test bench used for the characterization of cinema zoom-lens sub-assemblies.
While applicable to any complex optical stack, this approach is particularly critical for high-performance optics like cinema lens zoom groups, which exhibit large nominal design spherical aberration (>30 µm PV at fast apertures like F/2). Standard double-pass interferometers fail on these sub-assemblies due to ray clipping at the pupil and dynamic range constraints. Using Quadriwave Lateral Shearing Interferometry (QWLSI) via a Phasics SID4-HR wavefront sensor integrated into a single-pass test configuration, the total measured wavefront WFmeasured is expressed as:
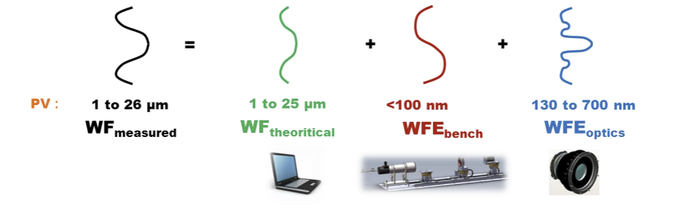
Figure 2: Decomposition of the measured wavefront into theoretical, test-bench and optical contributions.
By subtracting the theoretical design wavefront WFtheoretical and bench contributions WFbench < 100 nm PV, the setup isolates the true manufacturing residual error of the assembly under test WFoptics with sub-100 nm PV uncertainty.
Identifying Root Causes in Production Batches
Evaluating WFoptics across a manufacturing run of rear zoom sub-assemblies demonstrates the diagnostic power of tracking specific Zernike terms, such as 3rd-order spherical aberration (SA3 / Z8)—against the nominal design:
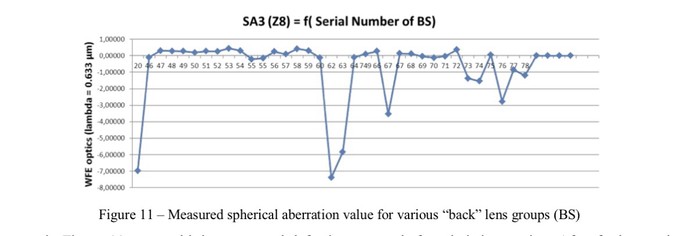
Figure 3: SA3 (Z8) Residual Aberration across Sub-Assembly Serial Numbers
By mapping the deviation in wavefront error, testing reveals the underlying physical failure mechanism rather than a simple pass/fail metric:
- Severe Deviations (e.g., SN 20, 62, 63 dropping to -4λ to -7λ): Root-cause analysis isolated the spike in spherical aberration to defective doublet bonding.
- Moderate Offsets (e.g., SN 67, 73, 74, 76 drifting to -1.5λ to -3.5λ): These departures were traced to out-of-spec air-gap spacing between singlet lenses.
By quantifying these exact manufacturing variations before final integration, manufacturers prevent non-conforming sub-assemblies from entering the final build, thereby protecting production flow, increasing final yield, and streamlining the final optical alignment process.
4. Real-Time 20 Hz Feedback: From Post-Mortem Testing to Live Alignment
Traditional MTF testing acts as an offline inspection gate: assemble the lens, mount it on a bench, measure MTF, and disassemble if it fails.
Phasics wavefront sensing technology transforms optical assembly into an active, live alignment process:
- Live 20 Hz Feedback: Phasics QWLSI sensors calculate complete Zernike aberration profiles in real time. As an operator adjusts alignment screws, positioning stages, or air-gap shims, the Zernike values update live, with MTF measured live simultaneously to track performance dynamically alongside aberration corrections.
- Direct Guidance: Instead of guessing adjustments based on trial-and-error MTF curves, engineers monitor specific Zernike terms, adjusting decenter until Coma reaches zero, or adjusting tilt until Astigmatism is minimized.
- Vibration-Insensitive & Production-Floor compatible: Unlike traditional phase-shifting interferometers, QWLSI is self-referenced and vibration-insensitive, enabling high-precision metrology directly on the production floor without expensive isolation tables.
- Automation-ready Integration: Functionally as easy to integrate as a standard industrial camera, the system includes a fully deployable SDK for rapid integration into next-generation automated manufacturing and robotic assembly lines.
Upgrade Your Optical Alignment and Testing Process
Stop guessing why your lens assemblies are failing MTF tests. By integrating wavefront measurement and Zernike aberration diagnostics into your optical manufacturing line, you can catch sub-assembly errors early, streamline live alignment, and boost production yield.
- SID4 Wavefront Sensors : Single-shot, high-resolution wavefront measurement providing live aberration feedback (coma, astigmatism, spherical) and MTF at high speed.
- Kaleo Kit: A modular metrology workstation designed for flexible optical testing across various lens formats and F-numbers.
- Kaleo MTF station : Combines direct QWLSI wavefront measurement with automated on-axis and off-axis MTF testing across multiple wavelengths, seamlessly bridging real-time aberration diagnostics with pass/fail quality criteria.
Photonis Defense awarded first delivery order for U.S. Army’s BINOD program, marking a key milestone in Exosens’ U.S. expansion
Aug 25th 2026
Markets
Technologies
Photonis Defense awarded first delivery order for U.S. Army’s BINOD program, marking a key milestone in Exosens’ U.S. expansion
PRESS RELEASE
MÉRIGNAC, FRANCE – AUGUST, 25TH 2026
- Photonis Defense, Exosens’ U.S. subsidiary, has been awarded a first delivery order for 1,600 complete systems under the U.S. Army’s Binocular Night Observation Device (BiNOD) program, with first deliveries expected by the end of 2026 and the bulk of deliveries scheduled throughout 2027
- The order represents the Low-Rate Initial Production (LRIP) phase of the BiNOD program, marking the transition from development and testing to initial production
- Photonis Defense will manufacture and test the complete BiNOD systems in the U.S., integrating Exosens’ high-performance image intensifier tubes
- This first delivery order under the US$352.6 million Indefinite-Delivery/Indefinite-Quantity (IDIQ) contract announced in March 2026 marks the next phase in Exosens’ U.S. expansion and supports its long-term growth in the U.S. defense market, the world’s most demanding single market for night vision devices
Exosens (EXENS; FR001400Q9V2), a high-tech company focused on providing mission- and performance-critical amplification, detection and imaging technologies, today announces that its U.S. subsidiary, Photonis Defense, has been awarded a first delivery order for 1,600 complete systems under the U.S. Army’s Binocular Night Observation Device (BiNOD) program, as part of the broader Indefinite-Delivery/Indefinite-Quantity (IDIQ) contract announced in March 2026.
This represents an important step in the BiNOD program, initiating the Low-Rate Initial Production (LRIP) phase after key testing and the qualification phase. First product deliveries are expected by the end of 2026, with the bulk of deliveries scheduled throughout 2027. Financial terms associated with this order are not disclosed. The order lays the foundation for regular production of BiNOD systems at Photonis Defense’s U.S. factory.
Program execution leverages Photonis Defense’s U.S.-based BiNOD development, production, and testing capabilities, together with Exosens’ global technology leadership in high-performance image intensifier tubes. This combination enables Photonis Defense to deliver lightweight, mission-ready and cost-effective night vision systems designed to provide soldiers with a decisive operational advantage in the most demanding environments while meeting the U.S. Army’s highest standards for performance, quality and on-time delivery.
“This new phase of the BiNOD program marks a key milestone in Exosens’ expansion in the U.S. and confirms the relevance of our in-country industrial strategy. By combining our technology leadership in night vision with scalable U.S. industrial capabilities, we reaffirm our commitment to serving as a trusted partner to the U.S. Army. This milestone further strengthens our long-term growth prospects in the U.S. defense market,” said Jérôme Cerisier, CEO of Exosens.
"Photonis Defense is honored to support the U.S. Army's BiNOD program. Our commitment to the American warfighter is unwavering, and we remain focused on delivering advanced night vision capabilities that provide a decisive operational advantage in the most demanding environments,” said Shanna Owens, CEO of Photonis Defense. “As part of Exosens, we combine decades of innovation with a dedicated U.S. team committed to meeting the Army’s highest standards for performance, quality and on-time delivery. Together, we are proud to support the modernization of soldier night vision capabilities and help ensure mission success.”
Exosens will provide updates on developments in line with its regular communications.
Download the press release - EN
Investor Relations
Laurent Sfaxi, [email protected]
Media Relations
Brunswick Group, [email protected]
Related content
Event
Hannover.
FROM Mar 09th 2027 TO Mar 12th 2027
DSEI Germany 2027
Financial press release
Oct 27th 2026
9M 2026 Results
Exosens delivers +23.5% revenue growth in Q3 2026
Event
Shanghai.
FROM Mar 08th 2027 TO Mar 10th 2027
Laser world of photonics 2027
Join Exosens at LASER WORLD OF PHOTONICS SHANGHAI from 8 March 2027 to 10 March 2027 in Shanghai, China
Event
Nuremberg.
FROM Mar 01st 2027 TO Mar 03rd 2027
ENFORCE TAC 2027
Join Exosens at SPIE BIOS from 30 January 2027 to 31 January 2027 in San Francisco, USA
Event
Orlando.
FROM Jan 11th 2027 TO Jan 15th 2027
AIAA SciTech 2027
Join Exosens at AIAA SciTech from 11 January 2027 to 15 January 2027 in Orlando, USA
Stay connected
Stay informed and connected to the latest news from Exosens by signing up.
Subscribe
-
Product Types Cameras Detectors & Sensors Image Intensifier Tubes Measurement Systems
-
Applications Analytical Environment Imaging defense Industrial & NDT Laser & Optical Metrology Night vision Nuclear & Radiation Scientific Surveillance
-
Company
Identifying and Quantifying Optical Vortex Structures
Aug 05th 2026
Markets
Technologies
PhaseStudio Introduces Vortex Analysis: Identifying and Quantifying Optical Vortex Structures
Optical vortex beams are distinguished by their helical phase structure and, in many cases, their characteristic donut-shaped intensity profile. They have become indispensable tools in modern photonics. Their unique phase structure enables a wide range of applications, including optical tweezers, quantum communications, advanced microscopy, laser beam shaping, and structured light research.
At the heart of these beams are phase singularities, locations where the optical phase is undefined and around which the phase winds in a spiral. These singularities determine the beam's topological charge, a fundamental property directly related to the orbital angular momentum (OAM) carried by the light. Accurately locating and quantifying these features is essential for verifying beam generation, assessing optical system alignment, evaluating beam quality, and supporting research involving structured light.
While wavefront sensors (e.g. SID4 HR ) provide accurate phase measurements, extracting information such as phase singularity locations and topological charge has often required dedicated post-processing, custom algorithms, or manual parameter adjustments. Integrating these additional analysis steps into a routine measurement workflow has remained a challenge.
Streamlining Complex Wavefront Characterization
To simplify this process, PhaseStudio software now includes a dedicated Vortex Analysis feature that integrates phase singularity detection directly into the standard wavefront analysis workflow. Once a measurement is completed, the software automatically identifies phase singularities within the measured wavefront and reports their spatial coordinates together with the corresponding measured topological charge.
Beyond singularity detection, the feature separates the wavefront into complementary mathematical components that help distinguish rotational and non-rotational phase contributions. This enables users to isolate and analyze localized vortex structures that may otherwise remain embedded within the overall phase distribution. Rather than relying solely on visual inspection of the phase map, users gain quantitative information that supports localization, classification, and further analysis of complex optical fields.

Figure 1. Example of a rotational phase distribution with a measured topological charge of approximately 9.85, corresponding closely to the expected integer value of 10. The phase varies continuously in a spiral around the singularity, producing the characteristic optical vortex structure. (Image from Phasics internal test data, PhaseStudio analysis results.)
As optical fields become increasingly sophisticated, visualizing the phase alone is often insufficient to fully characterize localized features. By automatically identifying and quantifying optical vortices, PhaseStudio provides direct insight into the topology of the measured wavefront, helping researchers and engineers analyze structured light more efficiently and with greater confidence.

Figure 2. Rotational phase distribution with a measured topological charge of approximately 29.93, corresponding to an expected value of 30. As the topological charge increases, the helical phase structure becomes increasingly dense around the singularity. (Image from Phasics internal test data, PhaseStudio analysis results.)
Supporting the Next Generation of Structured Light Applications
As optical field engineering continues to advance, analysis software is playing an increasingly important role beyond data acquisition and visualization. Modern wavefront metrology must not only measure optical phase accurately but also provide the analytical tools needed to interpret increasingly complex optical fields.
With the introduction of Vortex Analysis, PhaseStudio extends its capabilities beyond conventional wavefront visualization by enabling automated identification and quantitative characterization of optical vortices. Whether supporting research in structured light, orbital angular momentum, advanced microscopy, or beam shaping, this new feature helps transform wavefront measurements into actionable insights.
To learn more about PhaseStudio and how its Vortex Analysis capabilities can support your beam metrology applications, contact the Phasics team :
Related content
Event
Hannover.
FROM Mar 09th 2027 TO Mar 12th 2027
DSEI Germany 2027
Financial press release
Oct 27th 2026
9M 2026 Results
Exosens delivers +23.5% revenue growth in Q3 2026
Event
Shanghai.
FROM Mar 08th 2027 TO Mar 10th 2027
Laser world of photonics 2027
Join Exosens at LASER WORLD OF PHOTONICS SHANGHAI from 8 March 2027 to 10 March 2027 in Shanghai, China
Event
Nuremberg.
FROM Mar 01st 2027 TO Mar 03rd 2027
ENFORCE TAC 2027
Join Exosens at SPIE BIOS from 30 January 2027 to 31 January 2027 in San Francisco, USA
Event
Orlando.
FROM Jan 11th 2027 TO Jan 15th 2027
AIAA SciTech 2027
Join Exosens at AIAA SciTech from 11 January 2027 to 15 January 2027 in Orlando, USA
Stay connected
Stay informed and connected to the latest news from Exosens by signing up.
Subscribe
-
Product Types Cameras Detectors & Sensors Image Intensifier Tubes Measurement Systems
-
Applications Analytical Environment Imaging defense Industrial & NDT Laser & Optical Metrology Night vision Nuclear & Radiation Scientific Surveillance
-
Company
HALF-YEAR FINANCIAL REPORT 2026 INCLUDING:
2026 half-year activity report Condensed Consolidated Interim Financial Statements as at 30 June 2026 Statutory Auditors’ review report on the 2026 half-yearly financial information Statement by the persons responsible for the 2026 half-year financial report
Contents 01 HALF-YEAR ACTIVITY REPORT 2026
1
1.1
Highlights
3
1.2
Analysis of the Group’s results
5
1.3
Analysis of the Group’s balance sheet
9
1.4
Financial resources and liabilities
10
1.5
Related-party transactions
14
1.6
Main risks and uncertainties
14
1.7
2026 Outlook
14
CONSOLIDATED INTERIM 02 CONDENSED FINANCIAL STATEMENTS
15
AS AT 30 JUNE 2026 2.1
Group consolidated financial statements
16
2.2
Statutory Auditors’ review report on the half-yearly financial information
47
03 ADDITIONAL INFORMATION 3.1
Statement by the person responsible
49 50
01
HALF-YEAR ACTIVITY REPORT 2026
1.1
1.2
Introduction
2
Highlights
3
Seasonality
3
Highlights
3
Acquisitions
4
Analysis of the Group’s results
5
Key performance indicators
5
Revenue
6
Adjusted gross margin
6
Current operating profit/(loss)
7
Operating profit/(loss)
7
Adjusted EBITDA and Adjusted EBIT
7
Net finance income/(expense)
7
Profit/(loss)
8
1.3
Analysis of the Group’s balance sheet
9
1.4
Financial resources and liabilities
10
1.5
Related-party transactions
14
1.6
Main risks and uncertainties
14
1.7
2026 Outlook
14
Half-year financial report 2026
EXOSENS
1
01
HALF-YEAR ACTIVITY REPORT 2026 Introduction
Introduction EXOSENS is an international high-tech group with over 85 years of experience in the innovation, development, manufacture and sale of high-end electro-optical technologies in the field of Amplification, Detection and Imaging. The Group’s broad portfolio of detectors and imaging solutions encompasses image intensifier tubes, digital cameras that use various wavelengths, as well as ion, electron, neutron and gamma-ray detectors. EXOSENS provides tailor-made solutions to meet the needs of end users facing complex issues in challenging environments in the areas of defence and surveillance, life sciences, nuclear and industrial control. The Group is the leader in the Light Amplification market (excluding the United States) and one of the leaders in the Detection & Imaging markets that it targets, which present attractive growth prospects. The Group’s activities are organised into two segments (which also correspond to the segmentation used by the Group for reporting purposes): • Amplification, which accounted for 70% of the Group’s revenue in the first half of 2026, consisting of systems using the amplification of electrons to produce an image. The majority of Amplification
2
EXOSENS
Half-year financial report 2026
sales come from selling components and modules for integration into equipment used in the defence sector (primarily by armed forces and homeland security services). Following the Group’s acquisition of NVLS in July 2025, this segment now also includes sales of man-portable optronic equipment, such as night vision goggles and thermal weapon sights; • Detection & Imaging, which accounted for 31% of the Group’s revenue in the first half of 2026, consisting of systems for detecting optical or electronic signals or generating an image from radiation in different wavelength bands of the electromagnetic spectrum. The majority of sales in this segment come from the sale of components and modules for integration into instruments and systems in commercial markets. These markets encompass sectors such as nuclear power generation, research laboratories, the oil and gas industry, the agrifood industry, life sciences, semiconductor inspection, electronics and recycling. The segment also includes sales of imaging systems for defence and surveillance applications, in particular drones and counter-drone systems.
HALF-YEAR ACTIVITY REPORT 2026 Highlights
1.1 HIGHLIGHTS Seasonality The Group’s revenue is affected by the seasonal nature of the products sold to its customers. Orders and revenue are typically higher at year-end, particularly for Amplification products, which are mainly associated with the defence sector and affected in particular by year-end budget cycles. By contrast, order intake and revenue are generally lowest in the first quarter. The Group therefore records significantly higher revenue in the final quarter of the year, while firstquarter revenue is generally lower than in the other quarters and cannot be extrapolated to the full financial year.
Income and expenses arising from ordinary activities that the Group receives or incurs on a seasonal, cyclical or occasional basis are recognised in accordance with the same rules as those used for the annual financial statements. They are neither accrued nor deferred in quarterly reporting. Expenses and income invoiced on an annual basis are included in interim information on a pro rata basis. Lastly, provisions for risks arising during the first half of the year are recorded in the accounts of the period.
Highlights Contract with ACTinBlack for the supply of 5G image intensifier tubes On 12 January 2026, EXOSENS announced that ACTinBlack Group, one of Europe’s leading manufacturers of advanced night vision systems, had ordered more than 7,000 5G image intensifier tubes for use by European special forces. This contract was secured only a few months after the official unveiling of 5G, EXOSENS’ new technology, underscoring its rapid market adoption. The tubes are scheduled for delivery in 2027 and 2028. They will be integrated into night vision goggles intended for European special forces end users.
US Army BiNOD contract for the supply of advanced night vision solutions On 2 March 2026, the Group was awarded a US Army BiNOD contract with a maximum value of 352.6 million US dollars. This Indefinite Delivery/Indefinite Quantity (IDIQ) contract covers the development, production and testing of the US Army’s BiNOD (Binocular Night Observation Device) binocular night vision devices until 27 February 2033. The award marks a major milestone in EXOSENS’ expansion in the United States, where the Group’s scalable industrial footprint supports its development in the world’s most demanding single market for night vision devices.
Doubling of cooled infrared camera production capacity The Group plans to double its production capacity for cooled infrared cameras during 2026 in response to accelerating global demand for advanced digital imaging solutions, particularly in long-range surveillance and counter-drone applications.
Manufactured in France, EXOSENS’ high-performance cooled infrared imaging solutions are designed for seamless integration into a wide range of platforms, such as gimbals, turrets, surveillance payloads and protection systems deployed on drones, robots and vehicles. They are increasingly being adopted by a broad range of industry players, from major defence contractors to leading OEMs and autonomous systems developers.
Unification of the Group’s brands under the single EXOSENS brand During the first half of 2026, the Group began gradually consolidating its entire product portfolio under the single EXOSENS brand. This strategic initiative builds on the Group’s growth and the integration of the companies acquired in recent years. Against this backdrop, the Photonis, Telops and Xenics brands were fully impaired (see Notes 10 and 16 to the condensed consolidated interim financial statements). This change is intended to strengthen the consistency, visibility and recognition of the EXOSENS brand among its customers and partners.
New financing from the European Investment Bank (EIB) On 24 June 2026, the Group entered into a 140 million euro financing agreement with the European Investment Bank (EIB), backed by the InvestEU programme. This financing facility is intended to support the Group’s research, development and innovation activities, as well as selected industrial investments serving the European defence, surveillance and industrial end markets. This transaction enables the Group to diversify its sources of financing and support the implementation of its growth and innovation strategy.
Half-year financial report 2026
EXOSENS
3
01
HALF-YEAR ACTIVITY REPORT 2026 Highlights
Contract to supply 17,000 image intensifier tubes to the Czech Armed Forces On 29 June 2026, EXOSENS announced that BROLIS had ordered 17,000 image intensifier tubes for the Czech Armed Forces, to be delivered by 2032. Under the agreement, EXOSENS will deliver its highperformance image intensifier tubes to BROLIS through 2032, supporting the modernisation of the Czech Armed Forces’ night vision capabilities while providing the Group with long-term revenue visibility.
This programme represents the largest procurement of image intensifier tubes ever undertaken by the Czech Republic, demonstrating the field-proven operational performance, reliability and quality of EXOSENS’ advanced night vision technologies. It further strengthens the Group’s position as a trusted, ITAR-free supplier of mission-critical night vision components to NATO armed forces and leading defence system integrators.
Acquisitions
4
Acquisition of Emberion
Investment in Adelphi Technology
On 24 April 2026, the EXOSENS Group acquired 100% of the shares in Emberion, a company incorporated under Finnish law and located at Metsänneidonkuja 8, 02130 Espoo. Emberion specialises in the manufacture of next-generation infrared sensors based on quantum dot technology. This acquisition enables EXOSENS to strengthen its position in the infrared imaging market, particularly for Defence & Surveillance and Industrial Control applications.
On 13 May 2026, the EXOSENS Group acquired a 29.99% interest in Adelphi Technology Inc., a US company specialising in the design and manufacture of compact neutron generators. This investment supports the development of the Group’s neutron imaging business.
EXOSENS
Half-year financial report 2026
HALF-YEAR ACTIVITY REPORT 2026 Analysis of the Group’s results
1.2 ANALYSIS OF THE GROUP’S RESULTS CONDENSED INCOME STATEMENT (in € millions) Revenue
Note
1st half 2026
1st half 2025 restated
6
253.1
219.5
-57.7
-48.9
-39.5
-35.0
Cost of sales Other purchases and external expenses
7
Taxes Employee benefit expense
8
-1.7
-1.1
-77.0
-67.6
Other operating income/(expense)
9
0.4
0.7
Depreciation, amortisation, impairment and provision charges
10
-46.2
-18.5
Including PPA amortisation and brand impairment
10
CURRENT OPERATING PROFIT/(LOSS)
36.1
6.5
31.2
49.1 55.6
Current operating profit/(loss) excluding PPA amortisation and brand impairment
11
67.3
Other income/(expenses)
11
0.0
0.0
31.2
49.0
67.3
55.6
OPERATING PROFIT/(LOSS) Operating profit/(loss) excluding PPA amortisation and brand impairment Net finance income/(expense)
12
Profit/(loss) before tax Profit/(loss) before tax excluding PPA amortisation and brand impairment Income tax
13
-6.0
-8.3
25.2
40.7
61.3
47.2
-9.9
-11.1
Profit/(loss) from discontinued operations attributable to owners of the parent
0.0
-1.7
PROFIT/(LOSS)
15.3
27.9
Profit/(loss) excluding PPA amortisation and brand impairment
43.9
34.5
The figures for the six months ended 30 June 2025 are restated following the application of IFRS 5.
Key performance indicators The Group uses key financial and non-financial measures to analyse the performance of its business. The key performance indicators used include revenue, adjusted gross margin, adjusted EBITDA and adjusted EBIT. Adjusted gross margin is the difference between the selling price and the cost of products and services sold (including employee costs). Adjusted EBITDA is defined as operating profit adjusted to exclude (i) depreciation, amortisation and impairment of non-current assets, net of reversals; (ii) non-recurring income and expenses presented in the consolidated income statement under “Other income” and “Other expenses”; and (iii) the effects of items that do not reflect the Group’s core operating performance, such as business restructuring and adaptation costs and expenses associated with share-based payments (IFRS 2).
Adjusted EBIT is defined as operating profit adjusted to exclude (i) nonrecurring income and expenses presented in the consolidated income statement under “Other income” and “Other expenses” and (ii) the effects of items that do not reflect the Group’s core operating performance, such as business restructuring and adaptation costs and expenses associated with share-based payments (IFRS 2). Adjusted EBIT excludes depreciation and amortisation of the portion of non-current assets corresponding to purchase price allocations. All other depreciation, amortisation and impairment, net of reversals, are included. Adjusted gross margin, adjusted EBITDA and adjusted EBIT are not standard accounting measures with a generally accepted definition. They should not be considered substitutes for operating profit, net profit or cash flow from operating activities or an indicator of liquidity. Other companies may calculate adjusted gross margin, adjusted EBITDA or adjusted EBIT using definitions different from those used by the Group.
Half-year financial report 2026
EXOSENS
5
01
HALF-YEAR ACTIVITY REPORT 2026 Analysis of the Group’s results
Revenue (in € millions)
Change (%)
Like-for-like (%)
Amplification
1st half 2026 1st half 2025 restated 176.3
157.9
+11.6 %
+10.0 %
Detection & Imaging
77.4
62.3
+24.3 %
14.6 %
Eliminations and other
-0.6
-0.7
253.1
219.5
+15.3%
+11.4%
TOTAL REVENUE
In the first half of 2026, consolidated revenue reached 253.1 million euros, representing significant growth of +15.3% (+33.6 million euros) compared with the first half of 2025, including like-for-like growth of +11.4%, driven by strong demand in the Defence & Surveillance markets.
Revenue – Amplification
Revenue – Detection & Imaging
In the first half of 2026, revenue in the Amplification segment amounted to 176.3 million euros, representing significant growth of +11.6% compared with the first half of 2025, driven by higher sales volumes, improved yields and a more favourable product mix. Likefor-like growth was solid, reaching +10.0% in the first half of 2026.
In the first half of 2026, revenue in the Detection & Imaging segment reached 77.4 million euros, representing growth of +24.3% compared with the first half of 2025. This performance reflects the scope effect arising from the contribution of acquisitions completed in 2025 (Noxant and Phasics), as well as strong like-for-like growth of +14.6%, driven by sustained demand in the Defence & Surveillance markets, particularly in drone and counter-drone applications, and solid momentum in Nuclear.
Adjusted gross margin In the first half of 2026, EXOSENS recorded a strong increase in adjusted gross margin at Group level and across both segments, mainly due to higher sales volumes, improved yields and a favourable product mix. The Group’s adjusted gross margin reached 129.9 million euros in the first half of 2026, representing an increase of +16.5% compared with the first half of 2025. The Group’s adjusted
gross margin rate reached +51.3%, representing a significant improvement of +53 basis points compared with the first half of 2025. The table below provides a breakdown of the Group’s adjusted gross margin by segment for the six months ended 30 June 2026 and 30 June 2025 restated:
1st half 2026
1st half 2025 restated
(in € millions)
% of sales
(in € millions)
% of sales
Change (in %)
Amplification
92.6
52.5 %
81.2
51.5 %
14.0 %
Detection & Imaging
37.2
48.1 %
30.3
48.7 %
22.8 %
Eliminations and other
0.1
-0.1
129.9
51.3%
111.5
50.8%
16.5%
ADJUSTED GROSS MARGIN
Adjusted gross margin – Amplification In the first half of 2026, the Amplification segment’s adjusted gross margin reached 92.6 million euros (+14.0% compared with the first half of 2025), representing a margin of 52.5% (compared with 51.5% in the first half of 2025). This strong increase in the margin rate was mainly driven by higher sales volumes, improved yields and a more favourable product mix.
6
EXOSENS
Half-year financial report 2026
Adjusted gross margin – Detection & Imaging In the first half of 2026, the Detection & Imaging segment’s adjusted gross margin reached 37.2 million euros (+22.8% compared with the first half of 2025), representing a margin of 48.1% (compared with 48.7% in the first half of 2025). This decrease in the margin rate was mainly attributable to a less favourable product mix, reflecting lower sales of higher-margin products such as advanced detectors for Life Sciences.
HALF-YEAR ACTIVITY REPORT 2026 Analysis of the Group’s results
Current operating profit/(loss) Current operating profit fell from 49.1 million euros in the first half of 2025 to 31.2 million euros in the first half of 2026, representing a change of -17.8 million euros (-36.4%).
The decrease in current operating profit was mainly attributable to a brand impairment charge of 28.2 millions euros.
Operating profit/(loss) The Group recorded operating profit of 31.2 million euros in the first half of 2026, compared with 49.0 million euros in the first half of 2025, representing a change of -36.3% (-17.8 million euros).
This change was attributable to a brand impairment charge of 28.2 millions euros.
Adjusted EBITDA and Adjusted EBIT Adjusted EBITDA rose from 70.6 million euros in the first half of 2025 to 83.6 million euros in the first half of 2026, representing strong growth of +18.3% (+12.9 million euros). Consequently, the Group’s adjusted EBITDA margin improved to 33.0% in the first half of 2026, from 32.2% in the first half of 2025, a change of +84 basis points.
Adjusted EBIT rose from 60.2 million euros in the first half of 2025 to 71.8 million euros in the first half of 2026, representing growth of +19.2% (+11.6 million euros). Consequently, the adjusted EBIT margin increased to 28.4% in the first half of 2026, from 27.4% in the first half of 2025, a change of +92 basis points.
RECONCILIATION OF OPERATING PROFIT TO ADJUSTED EBITDA AND ADJUSTED EBIT 1st half 2026
1st half 2025 restated
Operating profit/(loss)
31.2
49.0
Depreciation, amortisation and impairment – net*
47.9
17.1
Other income and expenses
0.0
0.0
EBITDA
79.0
66.1
Share-based payments
3.0
0.9
Non-recurring costs
1.6
3.5
Adjusted EBITDA
83.6
70.6
Depreciation, amortisation and impairment excluding PPA amortisation and brand impairment
-11.8
-10.4
Adjusted EBIT
71.7
60.2
(in € millions)
This amount corresponds to the first two lines of the table in Note 10 to the condensed consolidated interim financial statements.
Net finance income/(expense) Net finance expense decreased from 8.3 million euros in the first half of 2025 to 6.0 million euros in the first half of 2026, an improvement of +2.3 million euros. The improvement in net finance expense in the first half of 2026 was mainly attributable to lower interest expense on the Group’s debt,
driven by the decline in Euribor and the reduction in the margin applicable to certain financing facilities. Net finance expense was also reduced by a favourable foreign exchange effect and a lower net expense on derivative instruments. These factors were partly offset by the remeasurement of a put option.
Half-year financial report 2026
EXOSENS
7
01
HALF-YEAR ACTIVITY REPORT 2026 Analysis of the Group’s results
Profit/(loss) Net profit fell from 27.9 million euros in the first half of 2025 to 15.3 million euros in the first half of 2026, representing a change of -12.6 million euros, for the reasons described above.
PROFIT/(LOSS) (IN EUROS) Profit/(loss) from continuing operations Profit/(loss) from discontinued operations Weighted average number of shares BASIC EARNINGS PER SHARE (IN EUROS)
30 June 2026
30 June 2025
15,339,685
27,909,421
15,339,685
29,611,974
0
-1,702,553
50,441,791
50,782,552
0.30
0.55
Basic earnings per share from continuing operations (in euros)
0.30
0.58
Basic earnings per share from discontinued operations (in euros)
0.00
-0.03
PROFIT/(LOSS) (EXCLUDING BRAND IMPAIRMENT) (IN EUROS) Basic earnings per share (excluding brand impairment) (in euros)
8
Excluding PPA amortisation and brand impairment, net profit reached 43.9 millions euros in the first half of 2026, compared with 34.5 millions euros in the first half of 2025, representing a change of +16.9 millions euros.
EXOSENS
Half-year financial report 2026
35,936,069 0.71
HALF-YEAR ACTIVITY REPORT 2026 Analysis of the Group’s balance sheet
1.3 ANALYSIS OF THE GROUP’S BALANCE SHEET CONSOLIDATED BALANCE SHEET (in € millions)
30 June 2026
31 December 2025
Non-current assets
589.2
598.6
Current assets (excluding cash)
236.9
211.6
Cash and cash equivalents
68.8
68.6
TOTAL ASSETS
895.0
878.9
(in € millions)
30 June 2026
31 December 2025
Equity
450.9
445.7
Non-current liabilities
314.1
319.5
Current liabilities
130.0
113.7
TOTAL EQUITY AND LIABILITIES
895.0
878.9
1.3.1
Non-current assets
Non-current assets mainly comprise property, plant and equipment, intangible assets (including goodwill), non-current financial assets and tax receivables due after more than one year (mainly deferred tax assets).
• depreciation and amortisation for the period, with an impact of -19.1 million euros;
Compared with the figures as at 31 December 2025, total non-current assets changed by -9.4 million euros. This change was mainly attributable to:
• the acquisition of equity interests in Emberion and Adelphi for 4.5 million euros.
• impairment of the Photonis, Telops and Xenics brands, with an impact of -28.2 million euros; and
• additions to property, plant and equipment and intangible assets totalling 34.6 million euros, including right-of-use assets;
1.3.2
Current assets
Current assets, excluding cash, amounted to 236.9 million euros, an increase of 25.3 million euros compared with 31 December 2025. This change was mainly attributable to an increase of 18.2 million euros in inventories in preparation for deliveries scheduled for the second half
1.3.3
of the year and an increase of 2.9 million euros in trade receivables resulting from strong revenue growth, partially offset by improved customer payment times.
Equity
The Group’s equity increased by 5.2 million euros compared with 31 December 2025 to 450.9 million euros as at 30 June 2026.
• a dividend distribution with an impact on equity of -15.2 million euros, equivalent to €0.30 per share in respect of the 2025 financial year.
The change in equity was mainly attributable to:
The company’s issued share capital as at 30 June 2026 amounted to 21.6 million euros and consisted of ordinary shares with a nominal value of 0.425 euros each, fully subscribed and paid up. These share issues included total share premiums of 346.8 million euros.
• total comprehensive income for the period, reflecting a profit of 15.3 million euros; and
1.3.4
Current and non-current liabilities
Current and non-current liabilities amounted to 444.1 million euros, representing a change of +10.9 million euros compared with 31 December 2025. This increase was mainly attributable to: • higher amounts payable to the State, with an impact of +7.9 million euros;
As at 30 June 2026, the Group’s total net debt/adjusted EBITDA ratio stood at 1.2x (unaudited). The Group regularly monitors compliance with its financial covenants. During the 2025 financial year and the first half of the 2026 financial year, the Group did not breach its financial covenant based on the leverage ratio.
• higher trade payables, with an impact of +4.4 million euros; • higher borrowings, with an impact of +3.1 million euros, mainly due to a new loan taken out by a French entity; and • lower deferred tax liabilities, with an impact of -4.4 million euros.
Half-year financial report 2026
EXOSENS
9
01
HALF-YEAR ACTIVITY REPORT 2026 Financial resources and liabilities
1.4 FINANCIAL RESOURCES AND LIABILITIES 1.4.1
The Group’s financial resources
The Group’s main financing requirements include its working capital requirements, capital expenditure (particularly expenditure relating to research and development), interest payments and acquisitionrelated expenditure. The Group’s main sources of liquidity during the first half of 2026 were: • cash flows from operating activities, which amounted to 63.9 million euros in the first half of 2026 and 50.8 million euros in the first half of 2025 (see the section entitled “Cash flows from operating activities” in this report); • the Senior Credit Agreement, comprising two credit facilities totalling up to 450 million euros, of which 250 million euros had been drawn and 200 million euros remained undrawn; and • the Credit Agreement entered into with the European Investment Bank (EIB), providing for a facility of up to 140 million euros, which remained undrawn as at 30 June 2026.
Credit facilities The Senior Credit Agreement comprises the following two credit facilities, totalling up to 450 million euros: • a euro-denominated term loan of up to 250 million euros, with a fiveyear term from the initial drawdown and repayable at maturity; and • a revolving credit facility (RCF) of up to 200 million euros, with a five-year term from the initial drawdown of the term loan, any amounts drawn being repayable at the end of the applicable interest period. The facility remained undrawn as at 30 June 2026.
Leverage ratio (total net debt/pro forma adjusted EBITDA)
Interest and fees Loans drawn under the Senior Credit Agreement bear interest at a floating rate based, depending on the currency of the drawdown, on either the term reference rate or the compounded reference rate, plus a margin determined by the total net debt/adjusted EBITDA ratio. The table below presents the margin schedule applicable to each credit facility based on the debt ratio, as defined in the waiver dated 3 June 2026. The margins are reviewed every six months by testing the ratio on the last day of each half-year period, with the first test taking place six months after the Company’s IPO. The following fees apply to the revolving credit facility: • a non-utilisation fee equal to 35% of the then-applicable margin is payable per annum; and • a utilisation fee is payable based on the percentage utilisation:
• > 0% and ≤ 33.33%, 0.10% per annum, • > 33.33% and ≤ 66.66%, 0.20% per annum, • > 66.66%, 0.40% per annum.
Term loan margin
Revolving credit facility margin
Greater than 2.5x
1.75%
1.35%
Greater than or equal to 2.0x and less than 2.5x
1.50%
1.10%
Greater than or equal to 1.5x and less than 2.0x
1.30%
0.90%
Greater than or equal to 1.0x and less than 1.5x
1.15%
0.75%
Greater than or equal to 0.5x and less than 1.0x
1.05%
0.65%
Less than 0.50x
0.95%
0.55%
The EIB facility has a 36-month drawdown availability period and a 12-month grace period. At the end of the grace period, a nonutilisation fee of between 0.126% and 0.315% per annum is payable, depending on the leverage ratio. The agreement allows the borrower Leverage ratio (total net debt/pro forma adjusted EBITDA)
10
The Credit Agreement entered into with the European Investment Bank (EIB) provides for a facility of up to 140 million euros, with a term of up to seven years, repayable at maturity and undrawn as at 30 June 2026.
to elect a fixed or floating interest rate. For illustrative purposes, the table below shows the interest rates that would have applied had the facility been drawn down on 15 June 2026:
Floating rate
Fixed rate
Greater than or equal to 2.0x
EUR3M + 1.52%
4.40%
Greater than or equal to 1.0x and less than 2.0x
EUR3M + 1.20%
4.08%
Less than 1.0x
EUR3M + 0.98%
3.86%
EXOSENS
Half-year financial report 2026
HALF-YEAR ACTIVITY REPORT 2026 Financial resources and liabilities
Guarantees and security interests Under the Senior Credit Agreement, the Company is the borrower and guarantees the obligations of subsidiaries that accede to the agreement as borrowers. The Senior Credit Agreement does not require the Group to grant security interests in favour of the Lenders.
Undertakings and restrictive clauses The Senior Credit Agreement contains certain positive and negative undertakings, in particular undertakings not to: • grant security interests (negative pledge); • dispose of assets, except for assets representing no more than 10% of the Group’s adjusted EBITDA per financial year and a total of 50,000,000 euros of adjusted EBITDA transferred until full repayment of the credits granted under the Senior Credit Agreement (calculated in accordance with the provisions of the Senior Credit Agreement on the basis of the Company’s consolidated accounts); • carry out certain mergers, demergers, partial transfers of assets and similar transactions; • acquire shares, financial instruments and businesses; and • change the nature of the Group’s activities.
In each case, subject to the stipulated de minimis amounts and customary exceptions for financing of this type. The Senior Credit Agreement also contains positive undertakings, including maintaining insurance policies, complying with applicable laws and ensuring that the borrowings under the Senior Credit Agreement rank at least pari passu with the Company’s other unsecured and unsubordinated obligations. The Senior Credit Agreement also requires compliance with a financial ratio that limits the amount of financial indebtedness that may be incurred by members of the Group. Specifically, the Group must maintain a leverage ratio (total net debt/adjusted EBITDA, calculated in accordance with the terms of the Senior Credit Agreement on the basis of the Company’s consolidated financial statements) of no more than 3.0:1 until the maturity of the Senior Credit Agreement. This ratio is tested at the end of each half-year, beginning with the first half-year following the Company’s initial public offering. In addition, the financial indebtedness that may be incurred by the Company’s principal
1.4.2
subsidiaries is limited to (i) financial indebtedness incurred with another member of the Group, (ii) short-term financial indebtedness incurred in the ordinary course of business and (iii) any other financial indebtedness whose outstanding principal amount does not at any time exceed the greater of 15 million euros and an amount equal to 15% of adjusted EBITDA.
Voluntary early repayment The Senior Credit Agreement allows for voluntary early repayments subject to notice and a minimum amount.
Mandatory early repayment The Senior Credit Agreement provides for early repayment and/or cancellation in the event of a change of control. Each Lender has the right to request the cancellation of its available commitments and the repayment of the advances it has made available under the Senior Credit Agreement within 30 calendar days from the date on which the Company notifies the credit agent of the change of control. Its available commitments will then be cancelled at the end of a period of five working days after the request for cancellation, and its advances will be repaid 60 calendar days after the Company notifies the change of control to the credit agent. A change of control would occur in the event that (i) the Company ceases to hold, directly or indirectly, 100% of the capital or voting rights of EXOSENS International or (ii) a person or group of persons (other than (a) HLD Europe and other funds and/or vehicles and/or companies advised by and/or managed by (A) HLD Associés Europe and/or (B) an affiliate of HLD Associés Europe and (b) the management of the Group, acting in concert (within the meaning of Article L. 233-10 of the French Commercial Code), acquires control (within the meaning of Article L. 233-3 of the French Commercial Code) of the Company.
Events of default The Senior Credit Agreement provides for a number of events of default customary for financing of this type, including payment defaults, non-compliance with the financial covenant or any other undertaking, cross-defaults, insolvency proceedings and disputes having a material adverse effect.
The Group’s consolidated cash flows
Net cash from/(used in) operating activities The table below shows the Group’s cash flows from operating activities for the first half of 2026 and the first half of 2025. (in € millions)
1st half 2026
1st half 2025 restated
Profit/(loss)
15.3
29.6
Adjustments: • Net finance income/(expense)
6.0
8.3
• Income tax
9.9
11.1
• Depreciation/amortisation of intangible assets and property, plant and equipment
46.1
19.1
• Other income and expenses
3.9
2.0
Income tax received (paid)
-6.2
-3.5
Change in working capital, net of impairment
-11.2
-16.0
NET CASH FROM/(USED IN) OPERATING ACTIVITIES
63.9
50.8
Half-year financial report 2026
EXOSENS
11
01
HALF-YEAR ACTIVITY REPORT 2026 Financial resources and liabilities
The Group’s cash flows from operating activities amounted to 63.9 million euros in the first half of 2026 compared with 50.8 million euros in the first half of 2025. This change was mainly attributable to strong growth in the Group’s activities, which notably generated an increase of +12.9 million euros in adjusted EBITDA.
The change in working capital requirements was notably affected by higher inventories associated with business growth and preparation for second-half deliveries, together with a high level of trade receivables reflecting growth in the first half of the year.
Net cash from/(used in) investing activities The table below shows the Group’s cash flows from investing activities for the first half of 2026 and the first half of 2025. 1st half 2026
1st half 2025 restated
Net capital expenditure
-35.4
-21.2
Acquisitions of equity interests, net of cash acquired
-3.9
-35.8
Investment grants received
0.0
0.0
-39.3
-57.0
(in € millions)
NET CASH FROM/(USED IN) INVESTING ACTIVITIES Net cash flows from the Group’s investments mainly correspond to intangible and tangible investments, as well as acquisitions. The Group’s cash flows from investing activities amounted to -39.3 million euros in the first half of 2026 compared with -57.0 million euros in the first half of 2025.
• an increase in the Group’s capital expenditure and capitalised research and development costs to support strong business growth, with net investment in property, plant and equipment and intangible assets increasing from 21.2 million euros in the first half of 2025 to 35.4 million euros in the first half of 2026.
The change of -17.7 million euros in net cash used in investing activities mainly reflected: • the absence of any significant acquisitions during the first half of 2026 (acquisition of Noxant for 36.1 million euros net of cash acquired as at 30 June 2025);
Net cash from/(used in) financing activities The following table shows the Group’s cash flows from financing activities for the first half of 2026 and the first half of 2025. (in € millions)
1st half 2026
1st half 2025 restated
Increases and decreases in share capital
0.0
0.0
Treasury share purchases and sales
-1.0
-0.2
Dividends paid
-15.2
-5.1
Changes in financial liabilities and IFRS 16 lease liabilities
0.0
-2.8
Interest paid (including on leases pursuant to IFRS 16)
-5.8
-6.4
Other
-2.8
1.3
NET CASH FROM/(USED IN) FINANCING ACTIVITIES
-24.8
-13.1
The Group’s cash flows from financing activities amounted to -24.8 million euros in the first half of 2026 compared with -13.1 million euros in the first half of 2025.
The main cash flows from financing activities in the first half of 2026 mainly comprised: • The payment of dividends amounting to 15.2 million euros; and • interest payments totalling 5.8 million euros (including IFRS 16 leases).
12
EXOSENS
Half-year financial report 2026
HALF-YEAR ACTIVITY REPORT 2026 Financial resources and liabilities
1.4.3
Free cash flow
The following table presents the Group’s free cash flow for the first half of 2026 and the first half of 2025. In € millions
1st half 2026
1st half 2025 restated
ADJUSTED EBITDA
83.6
70.6
Capitalised R&D costs
(9.2)
(6.1)
ADJUSTED EBITDA AFTER CAPITALISED R&D COSTS
74.5
64.5
Change in working capital
(11.2)
(16.0)
Income tax paid
(6.2)
(3.5)
Maintenance capital expenditure
(4.7)
(5.3)
Other
(2.3)
(0.4)
FREE CASH FLOW BEFORE GROWTH CAPITAL EXPENDITURE
50.1
39.4
Growth capital expenditure
(18.7)
(9.4)
FREE CASH FLOW AFTER GROWTH CAPITAL EXPENDITURE
31.4
30.0
Exosens generated free cash flow of 31.4 million euros in the first half of 2026, compared with 30.0 million euros in the first half of 2025. The strong increase in the Group’s adjusted EBITDA was partly offset by higher growth capital expenditure related to the continued
1.4.4
implementation of its production capacity expansion plan. The Group also maintained disciplined working capital management despite strong revenue growth, resulting in an improvement in its working capital requirement measured in days of sales.
Financial debt
The table below shows the gross debt/cash/net debt/leverage ratio indicators: (in € millions)
30 June 2026
31 December 2025
Gross debt
269.5
266.4
Cash and cash equivalents
68.8
68.6
Net debt
199.8
197.7
Pro forma adjusted EBITDA
166.7
156.1
1.2
1.3
Leverage ratio* *
The leverage ratio is calculated as net debt/pro forma adjusted EBITDA, as defined in the Group’s senior credit agreements. Pro forma adjusted EBITDA includes the contribution from acquisitions completed during the previous 12 months as if the acquired businesses had been owned throughout that period (unaudited).
As at 30 June 2026 and 31 December 2025, the Group had total gross financial debt of 269.5 million euros and 266.4 million euros respectively, and net debt of 199.8 million euros and 197.7 million euros respectively.
For the six months ended 30 June 2026, the cost of net debt amounted to 6.3 million euros, compared with 6.6 million euros for the six months ended 30 June 2025 restated.
Half-year financial report 2026
EXOSENS
13
01
HALF-YEAR ACTIVITY REPORT 2026 Related-party transactions
1.5 RELATED-PARTY TRANSACTIONS Group transactions with related parties mainly comprise:
Related-party transactions are conducted on an arm’s-length basis.
• compensation and benefits allocated to management bodies;
There were no significant changes in the nature of transactions between the Group and related parties during the first half of 2026 compared with 31 December 2025.
• commercial and financial transactions with the Group’s unconsolidated subsidiaries and associates: the Group has no material relationships with its unconsolidated subsidiaries and no associates within its consolidation scope.
1.6 MAIN RISKS AND UNCERTAINTIES The main risks and uncertainties that the Group could face in the remaining six months of the 2026 financial year are identical to those presented in Chapter 4 “Risk factors and risk management systems”
of the 2025 Universal Registration Document filed with the Autorité des marchés financiers on 9 March 2026.
1.7 2026 OUTLOOK Building on sustained commercial momentum, particularly in the Defense and Surveillance markets, and strong operational execution, Exosens remains fully on track to deliver on its 2026 guidance and now expects revenue and adjusted EBITDA to be towards the upper end of their respective ranges: • Revenue in the range of €520 million to €540 million; • Adjusted EBITDA in the range of €168 million to €178 million.
14
EXOSENS
Half-year financial report 2026
In addition, the Group intends to continue implementing its investment plan aimed at expanding production capacity by 40% by 2027, both in Europe and the United States, to meet strong demand, while continuing its efforts to improve productivity. In this context, the Group expects capital expenditure to represent around 9% of 2026 revenue (excluding capitalized R&D expenses, expected at around 3% of revenue).
02
CONDENSED CONSOLIDATED INTERIM FINANCIAL STATEMENTS AS AT 30 JUNE 2026
2.1
Group consolidated financial statements
16
2.1.1
Consolidated financial statements as at 30 June 2026
16
2.1.2
Notes to the consolidated financial statements
20
2.2
Statutory Auditors’ review report on the half-yearly financial information
47
Half-year financial report 2026
EXOSENS
15
02
CONDENSED CONSOLIDATED INTERIM FINANCIAL STATEMENTS AS AT 30 JUNE 2026 Group consolidated financial statements
2.1 GROUP CONSOLIDATED FINANCIAL STATEMENTS 2.1.1
Consolidated financial statements as at 30 June 2026
Consolidated balance sheet (in € thousands)
Note
30 June 2026
31 December 2025
Goodwill
15
233,441
233,332
Intangible assets
16
197,337
225,799
Property, plant and equipment
17
128,600
113,073
Right-of-use assets
18
15,741
15,032
Investments in equity-accounted companies and other investments
19
8,459
3,840
Non-current financial assets and other non-current assets Deferred tax assets
13
NON-CURRENT ASSETS
625
5,012
6,948
589,242
598,650
Inventories
20
123,257
105,088
Trade receivables
21
76,011
73,125
Derivative financial instruments
25
848
146
Current financial assets and other current assets
22
36,821
33,252
Cash and cash equivalents
23
CURRENT ASSETS TOTAL ASSETS
68,808
68,618
305,745
280,229
894,987
878,878
Share capital
24
21,648
21,648
Share premiums
24
346,763
346,763
Reserves
82,472
77,242
EQUITY
450,884
445,654
Non-current loans and borrowings
25
251,440
249,281
Non-current lease liabilities
25
12,781
13,645
Provisions for post-employment benefit obligations
27
7,750
7,864
Non-current provisions and other non-current liabilities
26
11,969
14,175
Deferred tax liabilities
13
NON-CURRENT LIABILITIES
30,204
34,559
314,144
319,524
Current loans and borrowings
25
281
493
Current lease liabilities
25
4,970
2,971
Derivative financial instruments
25
0
76
Trade payables
28
35,633
31,196
Current provisions and other current liabilities
26
89,075
78,966
CURRENT LIABILITIES
129,959
113,701
TOTAL EQUITY AND LIABILITIES
894,987
878,878
Notes 1 to 33 are an integral part of the condensed consolidated interim financial statements.
16
653
EXOSENS
Half-year financial report 2026
CONDENSED CONSOLIDATED INTERIM FINANCIAL STATEMENTS AS AT 30 JUNE 2026 Group consolidated financial statements
Consolidated income statement (in € thousands)
Note
30 June 2026
30 June 2025 restated
6
253,067
219,478
-57,706
-48,919
-39,547
-35,003
Revenue Cost of sales Other purchases and external expenses
7
Taxes
-1,742
-1,056
-77,014
-67,629 1,567
Employee benefit expense
8
Other operating income
9
2,328
Other operating expenses
9
-1,916
-871
Depreciation, amortisation, impairment and provision charges, net of reversals
10
-46,244
-18,505
31,226
49,061
CURRENT OPERATING PROFIT/(LOSS) Other income
11
21
8
Other expenses
11
0
-48
OPERATING PROFIT/(LOSS)
31,246
49,021
Cost of net debt
-6,330
-6,644
Net gains/(losses) on derivative instruments
483
-2,945
Other
-191
1,267
-6,038
-8,322
Net finance income/(expense)
12
PROFIT/(LOSS) BEFORE TAX Income tax
13
PROFIT/(LOSS) FROM CONTINUING OPERATIONS ATTRIBUTABLE TO OWNERS OF THE PARENT Profit/(loss) from discontinued operations attributable to owners of the parent
4
PROFIT/(LOSS) ATTRIBUTABLE TO OWNERS OF THE PARENT
25,208
40,699
-9,869
-11,087
15,340
29,612
0
-1,703
15,340
27,909
EARNINGS PER SHARE Basic
14
0.30
0.55
Diluted
14
0.30
0.55
The 2025 figures have been restated in accordance with IFRS 5. Discontinued operations have been reclassified and presented separately in the specific line items for discontinued operations in the consolidated income statement and statement of cash flows (see Note 4, “Discontinued operations”). Notes 1 to 33 are an integral part of the condensed consolidated interim financial statements.
Consolidated statement of comprehensive income (in € thousands)
30 June 2026
30 June 2025 restated
PROFIT/(LOSS)
15,340
27,909
Actuarial gains/(losses) on post-employment benefit obligations and similar obligations, before tax
0
20
Deferred tax on post-employment benefit obligations and similar obligations
0
-5
Items of other comprehensive income that will not be reclassified subsequently to profit or loss Fair value gains/(losses) on hedging instruments, before tax
0
15
878
-479
Deferred tax on fair value gains/(losses) on hedging instruments
-219
120
Translation adjustments(1)
2,173
-6,336
Items of other comprehensive income that may be reclassified subsequently to profit or loss
2,832
-6,696
OTHER COMPREHENSIVE INCOME
2,832
-6,681
TOTAL COMPREHENSIVE INCOME
18,171
21,228
Attributable to owners of the parent
18,171
21,228
(1) The line “translation adjustments” corresponds to exchange differences relating to loans granted to subsidiaries denominated in foreign currency and forming part of the net investment in these subsidiaries. In accordance with IAS 21, these exchange differences are recognised in other comprehensive income and subsequently reclassified to profit or loss on disposal of the net investment.
Notes 1 to 33 are an integral part of the condensed consolidated interim financial statements.
Half-year financial report 2026
EXOSENS
17
02
CONDENSED CONSOLIDATED INTERIM FINANCIAL STATEMENTS AS AT 30 JUNE 2026 Group consolidated financial statements
Consolidated statement of cash flows (in € thousands)
Note
Profit/(loss)
30 June 2026
30 June 2025 restated
15,340
29,612 5,289
Adjustments: • Finance income and expenses with an impact on cash
12
5,433
• Finance income and expenses with no impact on cash
12
606
3,084
• Income tax
13
9,869
11,087
10
46,143
19,138
• Depreciation, amortisation, impairment and provision charges, net of reversals • Other income and expenses
3,911
2,033
Income tax received (paid)
-6,170
-3,496
Change in working capital, net of impairment
-11,205
-15,982
NET CASH FROM/(USED IN) OPERATING ACTIVITIES
63,926
50,764
-32,502
-20,751
(1)
Purchases of intangible assets and property, plant and equipment
16/17
Proceeds on disposal of intangible assets and PP&E
0
0
-3,899
-35,766
Proceeds on disposal of equity investments, net of cash divested
0
0
Investment grants received
0
0
-2,866
-475
Acquisitions of equity investments, net of cash acquired(2)
Cash flows relating to other financial assets
3
NET CASH FROM/(USED IN) INVESTING ACTIVITIES
-39,267
-56,992
Increases and decreases in share capital
0
0
Cost of share capital increases
0
0
-979
-177
Treasury share purchases and sales Dividends paid
-15,204
-5,078
Refinancing non-current borrowings
25
0
0
Repayments of non-current borrowings
25
-73
0
Refinancing of current borrowings
25
2,200
0
Repayment of current borrowings
25
-473
-1,494
Finance expenses paid in relation to borrowings
12
-5,172
-6,013
Repayment of IFRS 16 lease liabilities
25
-1,616
-1,290
Finance expenses paid in relation to IFRS 16 lease liabilities
-655
-404
Finance income received in relation to derivatives
-93
-162
Finance income received on investments
111
1,379
-350
0
Debt issuance costs
25
Early repayment fees on borrowings
0
0
Other(3)
-2,503
99
NET CASH FROM/(USED IN) FINANCING ACTIVITIES
-24,808
-13,140
EFFECT OF EXCHANGE RATE CHANGES
441
-735
Increase/(Decrease) in cash and cash equivalents
292
-20,103
Net cash from/(used in) discontinued operations
0
-6,701
Opening cash and cash equivalents
23
68,515
115,629
Closing cash and cash equivalents
23
68,807
88,825
(1) For the six months ended 30 June 2026, “Other income and expenses” mainly comprised 3.2 million euros relating to the impact of IFRS 2. For the six months ended 30 June 2025, “Other income and expenses” mainly comprised 0.9 million euros relating to the impact of IFRS 2 and 0.4 million euros of income from the release of grants (non-cash). (2) 2026 financial year: consisting mainly of the acquisition of Emberion shares for 2.5 million euros and the exercise of a call option on NVLS for 1.4 million euros. 2025 financial year: consisting mainly of the acquisition of Noxant shares, net of cash acquired. (3) As at 30 June 2026, the “Other” line item mainly comprised cash advances made to Emberion following its acquisition to finance its operations.
Notes 1 to 33 are an integral part of the condensed consolidated interim financial statements.
18
EXOSENS
Half-year financial report 2026
CONDENSED CONSOLIDATED INTERIM FINANCIAL STATEMENTS AS AT 30 JUNE 2026 Group consolidated financial statements
Consolidated statement of changes in equity Reserves
Share capital (Note 24)
Share premiums (Note 24)
Treasury shares
Translation adjustments
Other reserves
Retained earnings
Total
21,583
342,537
1,965
-10,379
56,895
412,601
Changes in cash flow hedges
52
52
Actuarial gain/(loss) on post-employment benefits
-399
-399
Translation adjustments
-5,824
-5,824
Other comprehensive income
-5,824
-346
-6,170
Profit/(loss) for the period
42,715
42,715
(in € thousands) AS AT 1 JANUARY 2025
Total comprehensive income for the period
-5,824
-346
42,715
36,545
Capital increase
66
4,227
4,292
Capital reduction
-5,078
-5,078
6,081
6,081
Adjustment to the number and the value of treasury shares (2)
-8,786
Dividend distribution
Other (3)
AS AT 31 DECEMBER 2025
21,648
346,763
-8,786
-3,859
-4,644
94,532
445,654
AS AT 1 JANUARY 2026
-8,786
-3,859
-4,644
94,532
445,654
656
656
21,648
346,763
Changes in cash flow hedges
Actuarial gain/(loss) on post-employment benefits
Translation adjustments
2,173
2,173
Other comprehensive income(1)
2,173
656
2,829
Profit/(loss) for the period
15,340
15,340
Total comprehensive income for the period
2,173
656
15,340
18,169
Capital increase
Capital reduction
Distribution of dividends(2)
-15,204
-15,204
Other(3) AS AT 30 JUNE 2026
21,648
346,763
-8,786
2,265
2,265
-1,686
-1,723
94,667
450,884
(1) The “translation adjustments” line corresponds to exchange differences relating to loans granted to subsidiaries denominated in foreign currency and forming part of the net investment in these subsidiaries. In accordance with IAS 21, these exchange differences are recognised in other comprehensive income (recyclable OCI) and then reclassified to profit or loss when the net investment is disposed of. (2) See Note 1.3.3. (3) This item mainly comprises the corresponding entry for the IFRS 2 impact, amounting to 3,243 thousand euros, and the elimination of treasury shares, with an impact of -979 thousand euros.
Half-year financial report 2026
EXOSENS
19
02
CONDENSED CONSOLIDATED INTERIM FINANCIAL STATEMENTS AS AT 30 JUNE 2026 Group consolidated financial statements
2.1.2
Notes to the consolidated financial statements
Detailed contents of the notes
20
Note 1.
General information
21
Note 17.
Property, plant and equipment
33
Note 2.
Preparation procedures
21
Note 18.
Right-of-use assets
34
Note 3.
Changes in consolidation scope and major events
22
Note 19.
35
Note 4.
Discontinued operations
24
Investments in equity-accounted companies and other investments
Note 5.
Segment reporting
25
Note 20.
Inventories
35
Note 6.
Revenue
27
Note 21.
Trade receivables
35
Note 7.
Other purchases and external expenses
27
Note 22.
Current financial assets and other current assets
36
Note 23.
Cash and cash equivalents
36
Note 24.
Share capital and share premiums
37
Note 25.
Financial liabilities
38
Note 26.
Provisions and other liabilities
40
Note 8.
Employee benefit expense
28
Note 9.
Other operating income and expenses
28
Note 10.
Depreciation, amortisation, impairment and provision charges, net of reversals
29
Note 11.
Other income and expenses
29
Note 27.
Post-employment benefit obligations
41
Note 12.
Net finance income/(expense)
29
Note 28.
Trade payables
41
Note 13.
Income tax
30
Note 29.
Off-balance sheet commitments
42
Note 14.
Earnings per share
30
Note 30.
Financial risk management
43
Note 15.
Goodwill
31
Note 31.
Consolidated companies
46
Note 16.
Intangible assets
32
Note 32.
Post-balance sheet events
46
EXOSENS
Half-year financial report 2026
CONDENSED CONSOLIDATED INTERIM FINANCIAL STATEMENTS AS AT 30 JUNE 2026 Group consolidated financial statements
NOTE 1.
General information
EXOSENS (“the Company”) and its subsidiaries (together, “the Group” or “the EXOSENS Group”) form a high-tech group specialising in the innovation, development, manufacture and sale of amplification, detection and imaging technologies. EXOSENS offers its customers detectors and imaging solutions such as image intensifier tubes, digital cameras and ion, electron, neutron and gamma-ray detectors. EXOSENS responds to complex issues in extremely demanding environments by offering tailor-made solutions to its customers in the defence and surveillance, life sciences, nuclear and industrial control sectors. Through sustained, ongoing investment in R&D, the Group is internationally recognised as a major innovator in optoelectronics. It has 13 production sites in Europe and North America and more than 2,000 employees. The EXOSENS Group also manufactures components for high-tech digital cameras and scientific detectors
NOTE 2.
used, for example, in space exploration or the nuclear industry. The Group is present in more than 70 countries. EXOSENS is a public limited company (société anonyme, SA) governed by French law. Its registered office is located at Domaine de Pelus, Axis Business Park, Bloc E, 18 avenue de Pythagore, Mérignac, France. The Company is listed on the Paris Stock Exchange (Euronext) and is part of the SBF 120 stock index. On 27 July 2026, the Board of Directors authorised for issue the condensed consolidated interim financial statements for the sixmonth period from 1 January 2026 to 30 June 2026. All amounts are presented in thousands of euros, and all values are rounded to the nearest thousand unless otherwise stated. Numbers may not sum precisely due to rounding.
Preparation procedures
2.1 Statement of compliance The Group’s condensed consolidated interim financial statements have been prepared in accordance with IAS 34, Interim Financial Reporting. They do not include all the disclosures required in annual financial statements and should be read in conjunction with the
Group’s consolidated financial statements for the year ended 31 December 2025, which were prepared in accordance with IFRS as adopted by the European Union and mandatory at the reporting date.
2.2 Accounting principles The accounting principles used to prepare these condensed consolidated interim financial statements are consistent with those used by the Group to prepare its consolidated financial statements for the year ended 31 December 2025.
2.3 New standards, amendments and interpretations adopted by the European Union and mandatory for financial years beginning on or after 1 January 2026 The standards, amendments and interpretations that are mandatory and applicable from 1 January 2026 have no significant impact on the Group’s consolidated financial statements. They mainly concern:
• Annual Improvements to IFRS Accounting Standards – Volume 11 (including amendments to IFRS 1, IFRS 7, IFRS 9, IFRS 10 and IAS 7).
2.4 New standards, amendments and interpretations issued but not mandatory as at 1 January 2026 The Group has not early-adopted any of the following new standards and interpretations that could concern it but which were not mandatory as at 1 January 2026: • IFRS 19, Subsidiaries without Public Accountability: Disclosures; • IFRS 18, Presentation and Disclosure in Financial Statements.
A study of the impacts and practical consequences of the application of these amendments to standards, excluding IFRS 18, is underway. The expected impact of these amendments is not material.
IFRS 18, subject to its adoption by the European Union, will be applicable to all financial years beginning on or after 1 January 2027 with retrospective application. The Group is currently assessing the impact of this new standard on its performance indicators, the presentation of its consolidated financial statements and its accounting information systems.
2.5 Climate risk To the best of its knowledge, the Group takes climate risks into account in its reporting-date assumptions and reflects their potential effects in its financial statements.
The process implemented and described in the consolidated financial statements for the year ended 31 December 2025 in Note 2.4 remains unchanged.
Half-year financial report 2026
EXOSENS
21
02
CONDENSED CONSOLIDATED INTERIM FINANCIAL STATEMENTS AS AT 30 JUNE 2026 Group consolidated financial statements
2.6 Key assumptions and main sources of estimates The preparation of these condensed consolidated interim financial statements requires management to make assumptions and estimates in determining the carrying amounts of assets and liabilities at the reporting date and income and expenses for the period. Actual results may differ from those estimates.
impairment of non-financial assets, employee benefits, recognition and measurement of deferred taxes, goodwill, intangible assets acquired in business combinations and their estimated useful lives, determination of the enforceable period of leases, provisions, litigation and recognition of revenue over time.
The main sources of estimation uncertainty and management judgement relate to the capitalisation of development costs,
2.7 Specific recognition and measurement principles applied by the Group in interim financial reporting Seasonality of activity The Group’s revenue is affected by the seasonal nature of the products sold to its customers. Order levels are typically higher at the end of the year, particularly for Amplification products, which are primarily related to the defence sector, which responds, in particular, to budgetary constraints. The Group’s revenue in the first half of the financial year is generally lower than in the second half; therefore, it cannot be extrapolated to the entire financial year. No adjustment has been made for seasonal factors in the Group’s condensed consolidated interim financial statements. Income and expenses from ordinary activities that are received or incurred seasonally, cyclically or occasionally are recognised using the same principles as at the annual reporting date. They are neither anticipated nor deferred at the half-year reporting date. Expenses and income invoiced annually, such as patent and licence royalties, are recognised on the basis of an annual estimate prorated for the period elapsed.
NOTE 3.
Risks arising during the period are provided for in the period’s accounts. A provision is recognised in full for identified losses on completion of onerous contracts.
Assessment of the tax burden The corporate income tax expense for the first half of the year is based on the best estimate of the average annual tax rate expected for the full year. This rate may be adjusted for the tax implications of unusual items during the period.
Retirement commitments The commitment for post-employment employee benefits and the associated provision are valued on the basis of the latest actuarial valuations available at the closing date of the previous financial year. A review of actuarial assumptions is carried out for the main employee benefit plans. The main assumptions are adjusted if developments during the period are considered material.
Changes in consolidation scope and major events
3.1 Change in consolidation scope In accordance with IFRS 10, the Group’s financial statements include all entities over which the Group exercises exclusive control, meaning, when the Group has the power to direct an entity’s financial and operating policies in order to derive benefits from it. Control is presumed to exist when the Group holds more than half of the voting rights, directly or indirectly, unless proven otherwise. Newly acquired or created entities are included in the scope of consolidation from the date on which control is effectively transferred to the Group. Similarly, entities that are sold are excluded from the scope from the date of loss of control.
Transactions during the year 2026 Acquisition of Emberion On 24 April 2026, the EXOSENS Group acquired 100% of the shares in Emberion, a company incorporated under Finnish law and located at Metsänneidonkuja 8, 02130 Espoo. Emberion specialises in the manufacture of next-generation infrared sensors based on quantum dot technology. This acquisition strengthens EXOSENS’ position in the infrared imaging market.
22
EXOSENS
Half-year financial report 2026
Emberion was not consolidated as at 30 June 2026. Accordingly, the acquisition cost of the shares is recognised as an asset in the statement of financial position under “Investments in equityaccounted companies and other investments”. The company will enter the consolidation scope in the second half of 2026. Its contribution would not have had a material impact on the Group’s consolidated financial statements.
Adelphi Technology On 13 May 2026, the EXOSENS Group acquired 29.99% of the capital of Adelphi Technology Inc., for a total investment of 2,303 thousand euros. Adelphi Technology is a US company specialising in the design and manufacture of compact neutron generators. This investment supports the development of the Group’s Neutronis programme. Based on the rights attached to its interest, the Group has significant influence over Adelphi Technology but does not control it as defined in IFRS 10. Accordingly, the investment has been accounted for using the equity method in accordance with IAS 28 since the acquisition date. As at 30 June 2026, the carrying amount of the investment was 2,303 thousand euros, corresponding to its acquisition price.
CONDENSED CONSOLIDATED INTERIM FINANCIAL STATEMENTS AS AT 30 JUNE 2026 Group consolidated financial statements
3.2 Major Events Contract with ACTinBlack for the supply of 5G image intensifier tubes
Unification of the Group’s brands under the single EXOSENS brand
On 12 January 2026, EXOSENS announced that ACTinBlack Group, one of Europe’s leading manufacturers of advanced night vision systems, had ordered more than 7,000 5G image intensifier tubes for use by European special forces. This contract was secured only a few months after the official unveiling of 5G, EXOSENS’ new technology, underscoring its rapid market adoption. The tubes are scheduled for delivery in 2027 and 2028. They will be integrated into night vision goggles intended for European special forces end users.
During the first half of 2026, the Group began gradually consolidating its entire product portfolio under the single EXOSENS brand. This strategic initiative builds on the Group’s growth and the integration of the companies acquired in recent years. In this context, the Photonis, Telops and Xenics brands were fully impaired (Note 16, “Intangible assets”, and Note 10, “Depreciation, amortisation, impairment and provision charges”). This change is intended to strengthen the consistency, visibility and recognition of the EXOSENS brand among its customers and partners.
US Army BiNOD contract for the supply of advanced night vision solutions On 2 March 2026, the Group was awarded a US Army BiNOD contract with a maximum value of 352.6 million US dollars. This Indefinite Delivery/Indefinite Quantity (IDIQ) contract covers the development, production and testing of the US Army’s BiNOD (Binocular Night Observation Device) binocular night vision devices until 27 February 2033. The award marks a major milestone in EXOSENS’ expansion in the United States, where the Group’s scalable industrial footprint supports its development in the world’s most demanding market for night vision devices.
Doubling of cooled infrared camera production capacity The Group plans to double its production capacity for cooled infrared cameras during 2026 in response to accelerating global demand for advanced digital imaging solutions, particularly in long-range surveillance and counter-drone applications. Manufactured in France, EXOSENS’ high-performance cooled infrared imaging solutions are designed for seamless integration into a wide range of platforms, such as gimbals, turrets, surveillance payloads and protection systems deployed on drones, robots and vehicles. They are increasingly being adopted by a broad range of industry players, from major defence contractors to leading OEMs and autonomous systems developers.
New financing from the European Investment Bank (EIB) On 24 June 2026, the Group entered into a 140 million euro financing agreement with the European Investment Bank (EIB), backed by the InvestEU programme. This financing facility is intended to support the Group’s research, development and innovation activities, as well as selected industrial investments serving the European defence, surveillance and industrial markets. This transaction enables the Group to diversify its sources of financing and support the implementation of its growth and innovation strategy.
Contract to supply 17,000 image intensifier tubes to the Czech Armed Forces On 29 June 2026, EXOSENS announced that BROLIS had ordered 17,000 image intensifier tubes for the Czech Armed Forces, to be delivered by 2032. Under the agreement, EXOSENS will deliver its highperformance image intensifier tubes to BROLIS through 2032, supporting the modernisation of the Czech Armed Forces’ night vision capabilities while providing the Group with long-term revenue visibility. This programme represents the largest procurement of image intensifier tubes ever undertaken by the Czech Republic, demonstrating the field-proven operational performance, reliability and quality of EXOSENS’ advanced night vision technologies. It further strengthens the Group’s position as a trusted, ITAR-free supplier of mission-critical night vision components to NATO armed forces and leading defence system integrators.
Half-year financial report 2026
EXOSENS
23
02
CONDENSED CONSOLIDATED INTERIM FINANCIAL STATEMENTS AS AT 30 JUNE 2026 Group consolidated financial statements
NOTE 4.
Discontinued operations
On 10 October 2025, the Group signed an asset purchase agreement for the sale of its entire Microwave Amplification (MA) business unit, which specialises in microwave amplifiers for the US defence market. The transaction was completed on 31 December 2025. This sale forms part of the Group’s strategy of focusing its resources on higher value-added activities with superior growth and profitability prospects. The MA business, which is subject to a Special Security Agreement and governed by a specific structure, constitutes a separate business line with no significant synergies with the rest of the Group. It experienced a continuous decline in revenue until 2024, and its
operations resulted in significant cash burn in recent years, justifying the decision to sell. In accordance with IFRS 5, this business was reclassified as a discontinued operation. Its contribution to the Group’s income statement and the related cash flows are now presented separately under the specific line items for discontinued operations in the consolidated income statement and statement of cash flows for 2025. To ensure comparability, the figures for the first half of 2025 have been restated on the same basis.
In accordance with IFRS 5, the profit or loss for the period is presented under profit/(loss) from discontinued operations:
INCOME STATEMENT OF DISCONTINUED OPERATIONS
30 June 2026
30 June 2025 restated
Revenue
0
5,038
OPERATING PROFIT/(LOSS)
0
-2,304
Net finance income/(expense)
0
-5
Income tax
0
606
PROFIT/(LOSS) FROM DISCONTINUED OPERATIONS
0
-1,703
Gain/(loss) on disposal of the MA business, net of tax
0
PROFIT/(LOSS) FROM DISCONTINUED OPERATIONS
0
-1,703
30 June 2026
30 June 2025 restated
Net operating cash flow from discontinued operations
0
-6,105
Net cash flow from investing activities related to discontinued operations
0
-307
Net cash flow from financing activities related to discontinued operations
0
-289
Exchange rate fluctuations related to discontinued operations
0
0
CHANGE IN CASH AND CASH EQUIVALENTS FROM DISCONTINUED OPERATIONS
0
-6,701
The MA business’s contribution to cash flows is presented as follows: Contribution to cash flows from discontinued operations (in € thousands)
24
EXOSENS
Half-year financial report 2026
CONDENSED CONSOLIDATED INTERIM FINANCIAL STATEMENTS AS AT 30 JUNE 2026 Group consolidated financial statements
NOTE 5.
Segment reporting
Accounting policy The operating segments are reported in a manner consistent with the internal reporting provided to Group Management. The Chief Executive Officer regularly reviews the adjusted gross margin of each segment to assess its performance. He has therefore been identified as the Group’s chief operating decision-maker. Segment information is presented for the following two operating segments: • Amplification, comprising systems that use electron or electromagnetic-wave amplification to produce an image or a power source; • Detection & Imaging, comprising systems that detect signals (optical or electronic) or generate images across different wavelength bands of the optical spectrum (from ultraviolet to infrared).
The Group uses key financial and non-financial measures to analyse the performance of its business. The key performance indicators used include revenue, adjusted gross margin and adjusted EBITDA.
(including employee costs). The detailed definition of this measure and its reconciliation to operating profit are presented in a table later in this note. The Group defines adjusted EBITDA as operating profit adjusted to exclude (i) depreciation, amortisation and impairment of non-current assets, net of reversals; (ii) non-recurring income and expenses presented in the consolidated income statement under “Other income” and “Other expenses”; and (iii) the effects of items that do not reflect core operating performance, particularly business restructuring and adaptation costs, acquisition and external growth costs and expenses associated with share-based payments (IFRS 2). Adjusted gross margin and adjusted EBITDA are not standard accounting measures with generally accepted definitions. They should not be considered substitutes for operating profit, net profit or cash flow from operating activities or indicators of liquidity. Other companies may calculate adjusted gross margin and adjusted EBITDA using definitions different from those used by the Group.
Adjusted gross margin, presented below by segment, is the difference between the selling price and the cost of products and services
30 June 2026
(in € millions)
Amplification
Other, Detection eliminations & Imaging and unallocated
Total
Sales
176.3
77.4
-0.6
Contribution (% of total sales)
69.7%
30.6%
-0.3%
Adjusted gross margin
92.6
37.2
0.1
129.9
As a percentage of sales
52.5%
48.1%
-9.7%
51.3%
Adjusted EBITDA As a percentage of sales
253.1
83.6 33.0%
30 June 2025 restated
(in € millions)
Amplification
Other, Detection eliminations & Imaging and unallocated
Total
Sales
157.9
62.3
-0.7
Contribution (% of total sales)
71.9%
28.4%
-0.3%
Adjusted gross margin
81.2
30.3
-0.1
111.5
As a percentage of sales
51.5%
48.7%
-%
50.8%
Adjusted EBITDA As a percentage of sales
219.5
70.6 32.2%
Revenue reported under “Other, eliminations and unallocated items” mainly represents the elimination of inter-segment sales. Unallocated adjusted gross margin includes the profit/(loss) from Corporate activities not allocated to the segments and the elimination of intersegment flows.
Half-year financial report 2026
EXOSENS
25
02
CONDENSED CONSOLIDATED INTERIM FINANCIAL STATEMENTS AS AT 30 JUNE 2026 Group consolidated financial statements
Reconciliation with the consolidated financial statements – Adjusted EBITDA 30 June 2026
30 June 2025 restated
ADJUSTED EBITDA
83.6
70.6
Depreciation, amortisation and impairment of non-current assets (including IFRS 16) (Note 10)
-47.9
-17.1
Other income and expenses (Note 11)
0.0
0.0
Other*
-4.6
-4.5
OPERATING PROFIT/(LOSS)
31.2
49.0
The “Other” line mainly includes expenses associated with share-based payments (IFRS 2) amounting to -3.0 million euros and non-recurring costs of -1.6 million euros relating mainly to external acquisition activities.
Reconciliation with the consolidated financial statements – Adjusted Gross Margin Operating profit is obtained after deduction of the following operating expenses:
• selling, general and administrative expenses: costs of support functions and day-to-day management;
• cost of sales: production cost of products and services (including employee costs);
• other operating income and expenses: specific, non-recurring items.
• research and development costs: expenditure on innovation, research and development;
These elements reflect the Group’s cost structure and reconcile the gross margin to the operating profit.
(in € millions)
30 June 2026
30 June 2025 restated
REVENUE
253.1
219.5
Cost of sales*
-123.2
-108.0
ADJUSTED GROSS MARGIN
129.9
111.5
Research and development costs*
-10.4
-13.3
Sales, general and administrative costs*
-88.3
-48.3
Other operating income and expenses
0.0
-0.8
CURRENT OPERATING PROFIT/(LOSS)
31.2
49.1
The figures presented in the R&D and selling expenses lines are derived from internal management reporting and do not constitute audited IFRS measures. They are therefore not directly comparable with similar indicators shown in the financial statements.
Non-current assets break down by geographic area as follows: 30 June 2026
26
(in € millions)
France
Europe excluding France
Goodwill, intangible assets, property, plant and equipment and right-of-use assets
389.1
121.9
EXOSENS
Half-year financial report 2026
31 December 2025
North America
Other
50.8
13.3
France
Europe excluding France
North America
Other
400.7
121.1
52.4
13.0
CONDENSED CONSOLIDATED INTERIM FINANCIAL STATEMENTS AS AT 30 JUNE 2026 Group consolidated financial statements
NOTE 6.
Revenue
Group revenue breaks down as follows: (in € thousands)
30 June 2026
%
30 June 2025 restated
%
Sales of goods
247,892
98.0 %
216,083
98.5 %
Sales of services & licence fees
5,175
2.0 %
3,395
1.5 %
253,067
100.0%
219,478
100.0%
30 June 2026
%
30 June 2025 restated
%
Europe
195,631
77.3 %
170,875
77.9 %
Of which Greece
97,042
38.3 %
88,572
40.4 %
Of which France
11,465
4.5 %
14,337
6.5 %
North America
18,957
7.5 %
14,109
6.4 %
TOTAL REVENUE The Group’s revenue by geographical area is broken down as follows: (in € thousands)
Of which United States
16,800
6.6 %
11,822
5.4 %
Asia
35,770
14.1 %
32,882
15.0 %
Oceania
1,506
0.6 %
1,378
0.6 %
Africa
94
-%
128
0.1 %
Other
1,110
0.4 %
106
-%
253,067
100.0%
219,478
100.0%
TOTAL REVENUE Sales recognised at a point in time when control of the goods or services is transferred to the customer represented 99.0% of Group sales in the six months ended 30 June 2026 (98.3% in the six months ended 30 June 2025 restated) and totalled 250.4 million euros (215.8 million euros in the six months ended 30 June 2025 restated). In 2026, sales recognised over time as performance obligations were satisfied amounted to 2.6 million euros, representing 1.0% of total sales for the period (3.7 million euros and 1.7%, respectively, in the six months ended 30 June 2025 restated).
NOTE 7.
The Group estimates that around 85% of its revenue comes from the sale of dual-use goods. Dual-use goods are products, software and technologies which can be used for both civil and military applications.
Other purchases and external expenses
(in € thousands)
30 June 2026
30 June 2025 restated
Temporary employees
-12,287
-10,600
Professional fees
-7,441
-7,258
Travel and entertainment
-2,223
-1,879
Subcontracting
-3,713
-2,552
Rent
-1,008
-996
Maintenance
-5,821
-6,744
Advertising, publications, public relations
-1,254
-1,022
Insurance premiums
-1,215
-968
Transport of goods and collective passenger transport
-803
-553
Postal and telecommunication costs
-487
-475
Banking and related services
-678
-176
Other services – miscellaneous
-825
-712
Studies and research
-730
-427
Other (sundry external services, property management expenses, rental)
-1,060
-642
OTHER PURCHASES AND EXTERNAL EXPENSES
-39,547
-35,003
For the six months ended 30 June 2026, the “Other purchases and external expenses” line was -39,547 thousand euros (-35,003 thousand euros for the six months ended 30 June 2025 restated). This increase mainly reflected increases of 1,687 thousand euros in temporary staffing costs and 1,161 thousand euros in subcontracting costs, in line with the higher level of activity. This
increase was partly offset by a decrease of 922 thousand euros in maintenance expenses. Professional fees remained relatively stable at -7,441 thousand euros (-7,258 thousand euros for the six months ended 30 June 2025, restated) and mainly related to strategic studies and support provided to the Group in connection with its external growth activities.
Half-year financial report 2026
EXOSENS
27
02
CONDENSED CONSOLIDATED INTERIM FINANCIAL STATEMENTS AS AT 30 JUNE 2026 Group consolidated financial statements
NOTE 8.
Employee benefit expense
(in € thousands)
30 June 2026
30 June 2025 restated
Wages and salaries
-55,232
-45,403
Social security contributions
-14,588
-12,141
Post-employment benefits
358
-230
Other employee costs
-7,552
-9,855
EMPLOYEE BENEFIT EXPENSE
-77,014
-67,629
The increase in wages and salaries was due to the inclusion of employees from Noxant, NVLS and Phasics, which were acquired in 2025, and to growth-related increases in headcount. Other employee benefit expenses mainly comprise statutory profit-sharing and incentive payments amounting to 6,203 thousand euros for the six months ended 30 June 2026 (5,510 thousand euros for the six months ended 30 June 2025 restated).
NOTE 9.
Other operating income and expenses
The EXOSENS Group receives public financing in the form of grants for the development of certain projects. Investment grants are initially recognised at fair value when there is reasonable assurance that the grant will be received and that the Group will comply with all related conditions.
In accordance with IAS 20, Accounting for Government Grants and Disclosure of Government Assistance, these advances are recognised in deferred income and released to profit or loss over the useful life of the related development costs.
Other operating income (in € thousands)
30 June 2026
30 June 2025 restated
1,880
980
Other operating income
396
436
Other
51
168
2,328
1,584
Investment grants
TOTAL OTHER OPERATING INCOME
The increase in investment grants mainly reflects higher funding received for innovation projects, particularly the development of uncooled imaging technologies.
Other operating expenses (in € thousands)
30 June 2026
30 June 2025 restated
Other operating expenses
-376
-361
Business acquisition costs
-1,449
-490
Other TOTAL OTHER OPERATING EXPENSES
-91
-1
-1,916
-853
Other operating expenses totalling 376 thousand euros (2025: 361 thousand euros) correspond to various individually insignificant items.
28
EXOSENS
Half-year financial report 2026
CONDENSED CONSOLIDATED INTERIM FINANCIAL STATEMENTS AS AT 30 JUNE 2026 Group consolidated financial statements
NOTE 10. Depreciation, amortisation, impairment and provision charges,
net of reversals
Depreciation, amortisation, impairment and provision charges (net of reversals) are broken down as follows: (in € thousands)
Note
30 June 2026
30 June 2025 restated
On other non-current assets (excluding IFRS 16)
16/17
-17,551
-15,359
On brands
16
-28,160
On other non-current assets (IFRS 16 restatement)
18
-2,157
-1,715
1,219
-2,246
405
815
On impairment of current assets On provisions
26
On provisions not reflecting core operating performance TOTAL CHARGES NET OF REVERSALS
0
0
-46,244
-18,505
The difference between the total above and the “Depreciation, amortisation, impairment and provision charges, net of reversals” line in the consolidated statement of cash flows corresponds to 101 thousand euros in reversals of provisions used during the period.
NOTE 11. Other income and expenses Other income and expenses comprise items excluded from Management’s performance assessment because of their nature or their material and unusual nature.
For the six months ended 30 June 2026, other income and expenses totalled 20 thousand euros (-41 thousand euros for the six months ended 30 June 2025 restated).
(in € thousands)
30 June 2026
30 June 2025 restated
Other
20
-41
OTHER INCOME AND EXPENSES
20
-41
30 June 2026
30 June 2025 restated
-5,676
-6,239
-655
-404
NOTE 12. Net finance income/(expense) The cost of net debt and other finance income and expenses break down as follows: (in € thousands) Interest expense on bank borrowings Interest expense on leases Other finance expense
0
0
-6,330
-6,643
Foreign exchange gains and losses
676
-2,253
Other financial gains/(losses) on derivative instruments
-193
-692
GAINS/(LOSSES) ON DERIVATIVE INSTRUMENTS
483
-2,945
COST OF NET DEBT
Other* NET FINANCE INCOME/(EXPENSE)
-191
1,266
-6,038
-8,322
• The “Other” line includes the remeasurement of the put option over non-controlling interests, with an impact of -0.8 million euros.
Interest expense on bank borrowings mainly relates to the 250 million euro term loan. Foreign exchange gains/(losses) mainly arise from the effect of exchange-rate movements on intragroup current-account balances.
Finance income/(expense) from derivative instruments for the six months ended 30 June 2026 mainly relates to changes in the fair value of caps not designated for hedge accounting.
Half-year financial report 2026
EXOSENS
29
02
CONDENSED CONSOLIDATED INTERIM FINANCIAL STATEMENTS AS AT 30 JUNE 2026 Group consolidated financial statements
NOTE 13. Income tax The tax expense amounted to 9,869 thousand euros for the six months ended 30 June 2026 compared with a tax expense of 11,087 thousand euros for the six months ended 30 June 2025 restated. After taking into account the utilisation of tax loss carryforwards and dividend payments, the effective current tax rate is 26%.
Deferred tax income of 2.6 millions euros for the six months ended 30 June 2026 mainly arose from the reversal of deferred tax liabilities in connection with brand impairment (+7.6 million euros) and the utilisation of recognised tax loss carryforwards (-5.6 million euros).
The tax loss carryforward recognised as an asset by the French tax consolidation group was therefore reversed in an amount of 22.5 million euros at 30 June 2026.
(in € thousands)
30 June 2026
30 June 2025
Current tax expense
-12,436
-8,657
Deferred tax income/(expense) (excluding brand impairment)
-4,997
-2,430
Deferred tax income/(expense) relating to brand impairment
7,564
0
INCOME TAX
-9,869
-11,087
NOTE 14. Earnings per share Basic earnings per share is calculated by dividing profit or loss attributable to the Company’s shareholders by the weighted average number of shares outstanding during the period, excluding shares repurchased by the Group and held as treasury shares. Diluted earnings per share are calculated by adjusting the weighted average number of shares outstanding to take into account the
PROFIT/(LOSS) (IN EUROS) Profit/(loss) from continuing operations Profit/(loss) from discontinued operations Weighted average number of shares BASIC EARNINGS PER SHARE (IN EUROS)
30
potentially dilutive effect of all equity instruments issued by the Company, including unvested performance shares. As at 30 June 2026, there are outstanding dilutive instruments related to the deferred matching contribution under the ExoShare plan and the performance share award plans. The impact on earnings per share is not material.
30 June 2026
30 June 2025
15,339,685
27,909,421
15,339,685
29,611,974
0
-1,702,553
50,441,791
50,782,552
0.30
0.55
Basic earnings per share from continuing operations (in euros)
0.30
0.58
Basic earnings per share from discontinued operations (in euros)
0.00
-0.03
EXOSENS
Half-year financial report 2026
CONDENSED CONSOLIDATED INTERIM FINANCIAL STATEMENTS AS AT 30 JUNE 2026 Group consolidated financial statements
NOTE 15. Goodwill In accordance with IAS 36, Impairment of Assets, an entity must assess at each reporting date whether there is any indication that an asset may be impaired.
As at 30 June 2026, the Group did not identify any indications of impairment of the cash-generating units (CGUs) requiring the performance of specific impairment tests.
Recoverable amounts are determined on the basis of value-in-use calculations. In this context, the Group verified that the business plans prepared at the 2025 annual reporting date on the basis of management assumptions consistent with macroeconomic forecasts had not been materially called into question.
The methodologies applied by the Group as well as additional information are described in Note 15, “Goodwill”, to the consolidated financial statements for the year ended 31 December 2025.
Goodwill changed as follows: (in € thousands) AMOUNT AS AT 31 DECEMBER 2024 Translation adjustments
Gross value
Impairment losses
Total
189,495
0
189,495
-957
0
-957
47,564
0
47,564
0
0
0
-2,770
0
-2,770
233,332
0
233,332
109
0
109
Changes in consolidation scope
0
0
0
Impairment, net
0
0
0
Other
0
0
0
233,441
0
233,441
30 June 2026
31 December 2025
Changes in consolidation scope Impairment, net Other AMOUNT AS AT 31 DECEMBER 2025 Translation adjustments
AMOUNT AS AT 30 JUNE 2026 As at 30 June 2026, goodwill was allocated to CGUs as follows: (in € thousands) Amplification
99,353
99,353
Detection & Imaging
134,087
133,978
GOODWILL
233,441
233,332
Half-year financial report 2026
EXOSENS
31
02
CONDENSED CONSOLIDATED INTERIM FINANCIAL STATEMENTS AS AT 30 JUNE 2026 Group consolidated financial statements
NOTE 16. Intangible assets The following table provides details regarding the Group’s intangible assets: Development costs and technologies
Software, concessions, patents
Customer relationships and brands
Other intangible assets
TOTAL
GROSS AMOUNT AS AT 31 DECEMBER 2024
93,400
5,250
152,016
11,084
261,751
Changes in consolidation scope
16,729
221
22,222
-52
39,120
Acquisitions
13,714
422
0
3,783
17,918
0
-55
0
-32
-87
-1,140
-393
-1,063
-256
-2,852
(in € thousands)
Disposals Translation adjustments Transfers and other GROSS AMOUNT AS AT 31 DECEMBER 2025 Changes in consolidation scope
-7,945
0
-10,015
-461
-18,422
114,758
5,446
163,159
14,066
297,428
0
0
0
0
0
Acquisitions
9,170
439
0
1,133
10,742
Disposals
-578
0
0
-27
-605
Translation adjustments
512
159
823
-8
1,486
Transfers and other
-13,082
28
0
0
-13,053
GROSS AMOUNT AS AT 30 JUNE 2026
110,780
6,072
163,983
15,163
295,998
Development costs and technologies
Software, concessions, patents
Customer relationships and brands
Other intangible assets
TOTAL
-28,476
-2,463
-25,362
-522
-56,822
(in € thousands) AMORTISATION AND IMPAIRMENT AS AT 31 DECEMBER 2024 Changes in consolidation scope Amortisation
0
0
0
0
0
-12,634
-824
-11,082
-324
-24,864 -589
Impairment, net
0
0
0
-589
Disposals
0
19
0
0
19
159
485
89
44
777
Translation adjustments Transfers and other AMORTISATION AND IMPAIRMENT AS AT 31 DECEMBER 2025 Changes in consolidation scope
5,863
-7
4,021
-29
9,848
-35,087
-2,789
-32,334
-1,420
-71,630
0
0
0
0
0
-4,874
-372
-5,467
-141
-10,854
Impairment, net
0
0
-28,160
-590
-28,750
Disposals
20
0
0
0
20
-140
-128
-262
2
-529
Amortisation
Translation adjustments Transfers and other
13,048
0
0
34
13,082
AMORTISATION AND IMPAIRMENT AS AT 30 JUNE 2026
-27,033
-3,289
-66,223
-2,116
-98,661
NET AMOUNTS AS AT 30 JUNE 2026
83,747
2,783
97,759
13,047
197,337
NET AMOUNTS AS AT 31 DECEMBER 2025
79,670
2,657
130,825
12,646
225,798
NET AMOUNTS AS AT 31 DECEMBER 2024
64,925
2,787
126,654
10,562
204,928
Development costs and technologies As at 30 June 2026, the net carrying amount of development costs and technologies recognised in the consolidated statement of financial position was 83,747 thousand euros (31 December 2025: 79,670 thousand euros), of which 26,277 thousand euros related to technologies. This net carrying amount relates to projects for the
32
EXOSENS
Half-year financial report 2026
development of new products and services. Research and development costs that were not capitalised, net of grants and other tax credits relating to research and development, amounted to 6,161 thousand euros for the six months ended 30 June 2026 (for the year ended 31 December 2025: 13,975 thousand euros).
CONDENSED CONSOLIDATED INTERIM FINANCIAL STATEMENTS AS AT 30 JUNE 2026 Group consolidated financial statements
Brands As at 30 June 2026, the net carrying amount of the brands recognised in the consolidated statement of financial position was nil (31 December 2025: 28,431 thousand euros) following the
impairment of the Photonis, Telops and Xenics brands. This impairment arose from the unification of all the Group’s brands under the single EXOSENS brand identity during the first half of 2026.
Customer relationships As at 30 June 2026, customer relationships are recognised in the consolidated statement of financial position at a carrying amount of 97,759 thousand euros (31 December 2025: 102,394 thousand euros).
This amount mainly corresponds to the value of customer lists recognised in business combinations, particularly those involving EXOSENS International, Xenics, Telops, El-Mul, Centronic, Noxant and Phasics, and to the value attributed to the order backlog as part of the allocation of NVLS goodwill.
NOTE 17. Property, plant and equipment The Group’s main categories of property, plant and equipment as at 30 June 2026 are as follows: (in € thousands)
Land
GROSS AMOUNT AS AT 31 DECEMBER 2024
2,798
Technical Buildings installations 22,111
58,490
Other
PP&E under construction
TOTAL
6,241
27,975
117,615
Changes in consolidation scope
0
5
1,629
695
0
2,329
Acquisitions
53
3,239
10,655
1,077
18,570
33,594
Disposals
0
0
-303
36
22
-245
Translation adjustments
0
-328
-2,203
-391
-425
-3,347
Transfers and other
340
881
-2,058
-628
-11,304
-12,771
3,190
25,907
66,210
7,029
34,838
137,175
Changes in consolidation scope
0
0
0
0
0
0
Acquisitions
0
6
2,010
924
18,453
21,393
Disposals
0
0
-530
-5
0
-535
Translation adjustments
0
181
779
176
45
1,181
GROSS AMOUNT AS AT 31 DECEMBER 2025
Transfers and other
280
3,435
4,631
284
-9,026
-396
GROSS AMOUNT AS AT 30 JUNE 2026
3,470
29,530
73,100
8,408
44,309
158,817
(in € thousands)
Land
Technical Buildings installations
Other
PP&E under construction
TOTAL -24,054
DEPRECIATION AND IMPAIRMENT AS AT 31 DECEMBER 2024 Change in consolidation scope Depreciation
-4,147
-17,313
-2,594
0
0
0
0
0
0
-1,978
-7,270
-1,250
0
-10,497
Impairment, net
0
0
0
0
0
Disposals
0
220
11
0
230
Translation adjustments
92
1,665
350
0
2,107
Transfers and other
584
6,158
1,370
0
8,112
-5,448
-16,540
-2,113
0
-24,101
0
0
0
0
0
-1,223
-4,273
-769
0
-6,265
DEPRECIATION AND IMPAIRMENT AS AT 31 DECEMBER 2025 Change in consolidation scope Depreciation Impairment, net
0
0
0
0
0
Disposals
0
450
4
0
455
-57
-473
-147
0
-676
0
371
0
0
371
-6,728
-20,464
-3,025
0
-30,217
Translation adjustments Transfers and other DEPRECIATION AND IMPAIRMENT AS AT 30 JUNE 2026 NET AMOUNTS AS AT 30 JUNE 2026
3,470
22,802
52,636
5,383
44,309
128,600
NET AMOUNTS AS AT 31 DECEMBER 2025
3,190
20,459
49,670
4,916
34,838
113,073
NET AMOUNTS AS AT 31 DECEMBER 2024
2,798
17,964
41,177
3,647
27,975
93,561
Half-year financial report 2026
EXOSENS
33
02
CONDENSED CONSOLIDATED INTERIM FINANCIAL STATEMENTS AS AT 30 JUNE 2026 Group consolidated financial statements
NOTE 18. Right-of-use assets Right-of-use assets changed as follows: IFRS 16 right-of-use assets Buildings
Technical equipment
Other
Total
GROSS AMOUNTS AS AT 1 JANUARY 2025
13,208
4,633
50
17,891
Changes in consolidation scope
2,978
784
-52
3,710
Acquisitions
8,878
721
0
9,599
Disposals
-515
-858
0
-1,373
(in € thousands)
Translation adjustments
-817
-17
-2
-836
Transfers and other
-6,837
-357
0
-7,194
GROSS AMOUNT AS AT 31 DECEMBER 2025
16,894
4,907
-4
21,796
DEPRECIATION AND IMPAIRMENT AS AT 1 JANUARY 2025
-5,025
-2,273
-34
-7,332
0
-274
34
-240
-2,938
-1,411
0
-4,349
Disposals
408
872
0
1,280
Translation adjustments
537
17
1
556
3,084
238
0
3,321
DEPRECIATION AND IMPAIRMENT AS AT 31 DECEMBER 2025
-3,935
-2,831
1
-6,764
GROSS AMOUNTS AS AT 1 JANUARY 2026
16,894
4,907
-4
21,796
Change in consolidation scope Depreciation
Transfers and other
Changes in consolidation scope
0
0
0
0
Acquisitions
1,893
591
0
2,483
Disposals
-194
-396
0
-589
Translation adjustments
486
23
0
509
0
0
0
0
GROSS AMOUNT AS AT 30 JUNE 2026
19,079
5,125
-4
24,200
DEPRECIATION AND IMPAIRMENT AS AT 1 JANUARY 2026
-3,935
-2,831
1
-6,764
0
0
0
0
-1,397
-601
0
-1,998
Disposals
194
396
0
589
Translation adjustments
-274
-11
0
-285
Transfers and other
Change in consolidation scope Depreciation
Transfers and other
0
-3
2
-1
DEPRECIATION AND IMPAIRMENT AS AT 30 JUNE 2026
-5,413
-3,050
4
-8,459
NET RIGHT-OF-USE ASSETS AS AT 30 JUNE 2026
13,666
2,075
-1
15,741
NET RIGHT-OF-USE ASSETS AS AT 31 DECEMBER 2025
12,959
2,076
-3
15,032
The increase in IFRS 16 right-of-use assets was mainly attributable to new property leases in the United States and new leases for production equipment in France and the Netherlands.
34
EXOSENS
Half-year financial report 2026
CONDENSED CONSOLIDATED INTERIM FINANCIAL STATEMENTS AS AT 30 JUNE 2026 Group consolidated financial statements
NOTE 19. Investments in equity-accounted companies
and other investments
(in € thousands)
Total
AS AT 1 JANUARY 2025
3,414
Change in consolidation scope
200
Acquisitions of equity investments
294
Share of profit/(loss) of equity-accounted investees
0
Translation adjustments
-39
Impairment
0
AS AT 31 DECEMBER 2025
3,840
AS AT 1 JANUARY 2026
3,840
Change in consolidation scope
0
Acquisitions of equity investments
4,499
Share of profit/(loss) of equity-accounted investees
0
Translation adjustments
62
Impairment
0
AS AT 30 JUNE 2026 As at 30 June 2026, changes in investments were as follows: • the acquisition of 100% of the shares of the Finnish company Emberion for 2,506 thousand euros. This investment was not included in the consolidation scope as at 30 June 2026 and will be included starting from the second half of 2026 (Note 3);
8,459 • the acquisition of an additional equity interest in Adelphi Technology Inc. for 1,993 thousand euros, bringing the Group’s stake to 29.99%. Given the Group’s significant influence over this entity, the investment is accounted for using the equity method in accordance with IAS 28 (Note 3).
No indications of impairment were identified as at 30 June 2026.
NOTE 20. Inventories Inventories break down as follows: (in € thousands)
30 June 2026
31 December 2025
Raw materials
58,807
50,888
Work in progress
55,601
50,621
Finished goods
26,059
21,576
Bought-in goods
350
243
140,817
123,328
INVENTORIES – GROSS VALUE Provision for obsolescence
-17,560
-18,240
INVENTORIES – NET VALUE
123,257
105,088
As at 30 June 2026, the increase in inventories amounted to 17,489 thousand euros, in connection with the activity and in order to prepare for deliveries in the second half of 2026.
NOTE 21. Trade receivables The carrying amount of trade receivables breaks down as follows: (in € thousands)
30 June 2026
31 December 2025
Trade receivables – gross value
68,695
66,205
Unbilled receivables
8,341
8,236
Loss allowance on trade receivables
-1,024
-1,316
TRADE RECEIVABLES – NET
76,011
73,125
As at 30 June 2026, the increase in trade receivables was mainly attributable to strong revenue growth in the first six months, partially offset by improved customer payment times. The loss allowance on trade receivables amounted to 1,024 thousand euros as at 30 June 2026 (31 December 2025: 1,316 thousand euros).
Half-year financial report 2026
EXOSENS
35
02
CONDENSED CONSOLIDATED INTERIM FINANCIAL STATEMENTS AS AT 30 JUNE 2026 Group consolidated financial statements
NOTE 22. Current financial assets and other current assets Current financial assets and other current assets break down as follows: (in € thousands)
30 June 2026
31 December 2025
VAT and other tax receivables
12,333
13,269
Income tax
10,868
11,354
Other receivables*
13,073
8,435
Tax and employee-related receivables
121
182
Current financial assets
426
11
36,821
33,252
CURRENT FINANCIAL ASSETS AND OTHER CURRENT ASSETS *
Including 6.0 million euros in prepaid expenses (6.9 million euros as at 30 June 2025), 2.5 million euros in current-account advances related to the acquisition of Emberion, 1.7 million euros in advances related to the disposal of the MA business in 2025 and 1.6 million euros in other receivables (1.9 million euros as at 30 June 2025).
NOTE 23. Cash and cash equivalents Cash and cash equivalents break down as follows: (in € thousands)
30 June 2026
31 December 2025
68,794
58,110
Bank deposits subject to a notice period up to three months
14
10,406
Accrued interest receivable
0
102
Cash and cash equivalents
68,808
68,618
Cash and cash equivalents
Bank overdrafts CASH AND CASH EQUIVALENTS NET OF BANK OVERDRAFTS
1
0
68,807
68,617
Accrued interest receivable as at 30 June 2026 does not qualify as cash and is presented under current financial assets (Note 22).
36
EXOSENS
Half-year financial report 2026
CONDENSED CONSOLIDATED INTERIM FINANCIAL STATEMENTS AS AT 30 JUNE 2026 Group consolidated financial statements
NOTE 24. Share capital and share premiums
Issued capital As at 30 June 2026, the Company’s issued share capital amounted to 21,648,119 euros and consists of 50,936,749 ordinary shares with a nominal value of 0.425 euros each, fully subscribed and paid up.
These issues included total share premiums of 346,763 thousand euros. HLD Europe is the majority shareholder.
Rights, preferences and restrictions of each share class The following table presents outstanding ordinary and preference shares: (in thousands of shares)
Ordinary shares
AS AT 1 JANUARY 2025
50,783
Preference shares
50,783
154
154
Capital subscription Increase
0
Decrease AS AT 31 DECEMBER 2025
Total
0 50,937
0
(in thousands of shares)
Ordinary shares
Preference shares
AS AT 1 JANUARY 2026
50,937
50,937
Capital subscription
0
0
Increase
0
0
Decrease
0
AS AT 30 JUNE 2026
50,937
50,937
Total
0 0
50,937
As at 30 June 2026, the Company held 25,873 treasury shares under the liquidity agreement with Kepler Cheuvreux. This agreement was put in place on 8 July 2024 to enhance the liquidity of the Company’s shares on Euronext Paris, for an amount up to 2 million euros. It runs for an initial period to 30 June 2026 and is renewable by tacit agreement for successive periods of one year. These are the only treasury shares held by the Company.
A 2026–2028 LTIP was implemented following a decision by the Board of Directors on 20 February 2026. It concerns 197,000 shares (approximately 0.39% of the Company’s share capital) allocated to the managers and employees of the Company and its subsidiaries. These share awards are subject to a three-year vesting period and a oneyear holding period and are conditional on the achievement of collective financial and CSR targets.
A 2025–2026 LTIP was implemented following a decision by the Board of Directors on 28 February 2025. It concerns 234,500 shares (approximately 0.46% of the Company’s share capital) allocated to the managers and employees of the Company and its subsidiaries. These share awards are subject to a two-year vesting period and a one-year holding period and are conditional on the achievement of collective financial and CSR targets.
The share capital is 21,648,119 euros divided into 50,936,749 shares with a nominal value of 0.425 euros.
Half-year financial report 2026
EXOSENS
37
02
CONDENSED CONSOLIDATED INTERIM FINANCIAL STATEMENTS AS AT 30 JUNE 2026 Group consolidated financial statements
NOTE 25. Financial liabilities The carrying amount of financial liabilities is detailed below: 30 June 2026 (in € thousands)
Note
31 December 2025
Total
Current
Non-current
Total
Current
Non-current
Term Loan B(1)
247,134
0
247,134
246,869
0
246,869
Lease liabilities(2)
17,750
4,970
12,781
16,616
2,971
13,645
Other financial liabilities(3)
4,551
245
4,306
2,868
457
2,412
Accrued interest(4)
36
36
0
36
36
0
Bank overdrafts
1
1
0
0
0
0
269,472
5,251
264,221
266,389
3,463
262,926
FINANCIAL LIABILITIES Derivative financial instruments (liabilities)
30
0
0
0
76
76
0
Derivative financial instruments (assets)
30
-848
-848
0
-146
-146
0
-848
-848
0
-71
-71
0
Cash and cash equivalents
23
-68,794
-68,794
0
-58,110
-58,110
0
Bank deposits subject to a notice period of up to three months
23
-14
-14
0
-10,406
-10,406
0
-102
-102
0
-68,618
-68,618
0
264,221
197,701
-65,225
262,926
DERIVATIVE FINANCIAL INSTRUMENTS (NET)
Accrued interest receivable CASH AND CASH EQUIVALENTS
-68,808
-68,808
-385
-385
199,816
-64,405
Accrued interest receivable TOTAL NET FINANCIAL LIABILITIES
(1) The amount of the term loan (Term Loan B) includes a gross amount equal to 250.0 million euros, less 3.9 million euros in borrowing costs. The presentation of the liabilities takes account of the effective interest rate (EIR), in accordance with IFRS 9. (2) The increase in lease liabilities was due to extensions of property leases. (3) Other financial debts mainly correspond to several loans taken out by Photonis France (3.6 million euros), Phasics (0.6 million euros) and Xenics (0.2 million). (4) Interest accrued in 2026 mainly relates to the term loan. Interest accrues and is payable in accordance with the contractual terms of the debt.
The pledges and commitments given by the Group in respect of financial liabilities are presented in Note 29, “Off-balance sheet commitments”. Changes in financial liabilities and derivative instruments are broken down by type of movement in the table below: Cash flow
(in € thousands)
Opening as at 1 January 2025
Bonds, borrowings and other
Inflows Outflows
247,785
1,460
0
0
1,170
-1,135
35
249,281
8,175
0
0
0
3,426
2,044
5,470
13,645
NON-CURRENT FINANCIAL LIABILITIES
255,961
1,460
0
0
4,596
909
5,505
262,926
Bonds, borrowings and other
2,660
33
-3,972
-229
1,442
558
1,772
493
Lease liabilities
2,724
0
-3,432
0
159
3,519
3,678
2,971
Lease liabilities
Overdrafts CURRENT FINANCIAL LIABILITIES TOTAL FINANCIAL LIABILITIES
314
0
-300
0
2
-17
-14
0
5,698
33
-7,703
-229
1,604
4,061
5,436
3,463
261,659
1,493
-7,703
-229
6,199
4,970
10,941
266,389
Derivative instrument assets
-6
0
0
0
0
-141
-141
-147
Derivative instrument liabilities
136
0
0
0
0
-61
-61
76
Net impact (inflows/outflows) in the consolidated statement of cash flows
38
Non-cash movements Changes in Accrued consolidation Other interest scope variations Total non-cash 31/12/2025
EXOSENS
Half-year financial report 2026
-6,211
CONDENSED CONSOLIDATED INTERIM FINANCIAL STATEMENTS AS AT 30 JUNE 2026 Group consolidated financial statements
Cash flow
(in € thousands)
Opening as at 1 January 2026
Non-cash movements
Inflows Outflows
Changes in Accrued consolidation Other interest scope variations
Total “noncash”(1)
30/6/2026
Bonds, borrowings and other
249,281
2,227
0
0
0
-67
-67
251,440
Lease liabilities
13,645
0
0
0
0
-864
-864
12,781
NON-CURRENT FINANCIAL LIABILITIES
262,926
2,227
0
0
0
-931
-931
264,221
Bonds, borrowings and other
493
0
-473
0
0
261
261
281
2,971
0
-1,616
0
0
3,615
3,615
4,970
Lease liabilities Overdrafts CURRENT FINANCIAL LIABILITIES TOTAL FINANCIAL LIABILITIES
0
1
0
0
0
0
0
1
3,463
1
-2,089
0
0
3,876
3,876
5,251
266,389
2,227
-2,089
0
0
2,945
2,945
269,472
Derivative instrument assets
-147
0
0
0
0
-702
-702
-849
Derivative instrument liabilities
76
0
0
0
0
-76
-76
0
Net impact (inflows/outflows) in the consolidated statement of cash flows(2)
138
(1) Other non-cash movements mainly comprise the amortisation of debt issuance costs and the increase in lease liabilities arising from new leases. (2) The total of the lines in the consolidated statement of cash flows cross-referenced to Note 25 shows a difference of 0.4 million euros corresponding to the term loan renegotiation costs.
Financing structure As part of its successful IPO on 7 June 2024, EXOSENS established a Senior Credit Agreement including two lines of credit with a maximum total amount of 350 million euros, including: • a 5-year term loan of a maximum amount of 250 million euros, paying interest ranging from 1.50% to 2.50% + 3-month Euribor, repayable on maturity; and • a 5-year revolving credit facility (RCF) with a maximum amount of 100 million euros, paying interest ranging from 1.50% to 2.50%
- 3-month Euribor.
On 3 June 2026, the Group renegotiated certain terms of its bank financing. As part of the renegotiation, the margin applicable to the
term loan was revised and now ranges from 0.95% to 1.75% in addition to three-month Euribor. The revolving credit facility, which was undrawn as at 30 June 2026, bears interest at three-month Euribor plus a margin ranging from 0.55% to 1.75%. In addition, the Group exercised the accordion feature under the financing agreement, increasing the capacity of the revolving credit facility from 100 million euros to 200 million euros and thereby strengthening its financial flexibility and its ability to finance its development projects. On 24 June 2026, EXOSENS entered into a credit facility of up to 140 million euros with the European Investment Bank, with a maturity of up to seven years and repayable at maturity.
Financial covenants The syndicated loan agreement contains a financial covenant requiring compliance with a leverage ratio calculated as the ratio of consolidated net debt to consolidated adjusted EBITDA.
The Group regularly monitors compliance with its financial covenants. The Group did not breach its leverage ratio covenants in financial years 2025 and 2026.
As at 30 June 2026, the leverage ratio had to be below 3.00 for the term loan agreement (Term Loan B).
There are no financial covenants based on Group consolidated equity.
The Group’s leverage ratio as at 30 June 2026 was 1.2x (unaudited data).
Half-year financial report 2026
EXOSENS
39
02
CONDENSED CONSOLIDATED INTERIM FINANCIAL STATEMENTS AS AT 30 JUNE 2026 Group consolidated financial statements
NOTE 26. Provisions and other liabilities Provisions and other liabilities amounted to 101,043 thousand euros as at 30 June 2026 (as at 31 December 2025: 93,141 thousand euros) and mainly comprise provisions for customer warranties, payroll tax liabilities and amounts payable to the State.
Provisions In the ordinary course of the Group’s business activities, the Company and its subsidiaries have entered into various warranty contracts that include compensation and guarantee provisions, especially in the case of product returns. The Group records a provision for these guarantees, based on statistical product return rates. The Group recognises provisions for litigation when it is probable that present (in € thousands) OPENING AS AT 1 JANUARY 2025 Changes in consolidation scope
obligations arising from past events will give rise to an outflow of resources with no equivalent consideration and a reliable estimate can be made of the obligation. Provisions are also recognised when the Group identifies probable or certain obligations related to future commitments whose amount or timing is uncertain.
Provisions for litigation
Customer warranties
Other provisions
Total
1,410
2,264
5,195
8,869
0
0
3
3
Additions
208
931
1,808
2,947
Reversals
-1,410
-583
-4,452
-6,444
Reclassification
0
1
0
1
Other movements
0
0
0
0
Translation adjustments
0
-63
-9
-72
AS AT 31 DECEMBER 2025
208
2,550
2,546
5,304
OPENING AS AT 1 JANUARY 2026
208
2,550
2,546
5,304
Changes in consolidation scope
0
0
0
0
Additions
0
195
143
338
Reversals
0
-356
-506
-862
Reclassification
0
0
0
0
Other movements
0
0
0
0
Translation adjustments
0
9
0
9
208
2,398
2,183
4,789
AS AT 30 JUNE 2026
Other non-current and current liabilities Other non-current liabilities totalled 8,377 thousand euros (as at 31 December 2025: 10,034 thousand euros) and mainly relate to research and development grants amounting to 6,617 thousand euros. Other current liabilities break down as follows: (in € thousands)
30 June 2026
31 December 2025
Social security liabilities
30,669
31,209
VAT and other taxes
20,058
11,901
Accrued expenses
9,948
8,885
Capital expenditure payables
2,472
2,846
Advances and down payments received on orders
16,072
13,495
Miscellaneous liabilities*
8,658
9,467
OTHER CURRENT LIABILITIES
87,877
77,802
Miscellaneous liabilities mainly comprise contingent consideration liabilities of 3.8 million euros, a deposit of 1.7 million euros received in connection with litigation and 1.1 million euros relating to research tax credits.
As at 30 June 2026, the increase in other current liabilities was mainly attributable to higher advances and down payments received on orders and increases in amounts payable to the State and social security bodies.
40
EXOSENS
Half-year financial report 2026
CONDENSED CONSOLIDATED INTERIM FINANCIAL STATEMENTS AS AT 30 JUNE 2026 Group consolidated financial statements
NOTE 27. Post-employment benefit obligations The Group has commitments under long-term employee benefit plans. In accordance with IAS 19, Employee Benefits, the obligation to provide benefits under defined benefit plans is determined by independent actuaries using the projected unit credit actuarial valuation method. As at 30 June 2026, provisions for post-employment benefit obligations amounted to 7,750 thousand euros (7,864 thousand euros as at 31 December 2025). They include provisions for post-employment benefits and provisions for supplementary pension commitments and mainly concern France.
The net benefit expense recognised in the first half of 2026 for pension commitments is equal to 50% of the projected expense for the 2026 financial year determined on the basis of actuarial assumptions as at 31 December 2025 in accordance with the provisions of IAS 19 and in the absence of significant market fluctuations occurring since the end of the previous financial year. The details of the benefits received by the Group’s employees are presented in Note 29 “Commitments for post-employment benefits” to the consolidated financial statements for the financial year ended 31 December 2025.
NOTE 28. Trade payables (in € thousands)
30 June 2026
31 December 2025
Amounts due to suppliers
22,990
19,536
Purchase invoice accruals
11,141
11,632
Notes payable
1,503
28
TRADE PAYABLES
35,633
31,196
Half-year financial report 2026
EXOSENS
41
02
CONDENSED CONSOLIDATED INTERIM FINANCIAL STATEMENTS AS AT 30 JUNE 2026 Group consolidated financial statements
NOTE 29. Off-balance sheet commitments As at 30 June 2026
Type of commitments
Commitments given
Exosens SA
Guarantee
Bank guarantee of €127,191 (BNP) relating to the lease for EXOSENS’ premises at 18 avenue de Pythagore, Mérignac (signed on 22 July 2022, with the lease term running from 1 July 2022 to 30 June 2031). Guarantee issued on 31 December 2022 by BNP in favour of Société Épargne Foncière. Following the sale of the property by Épargne Foncière to Société BAGAN AMBRE on 25 July 2024, the new owner confirmed that the guarantor remained liable to it and that the guarantee remained in effect, without the need to issue a new guarantee in the name of BAGAN Ambre and obtain the release of the previous guarantee.
Joint and several guarantee
If a subsidiary were to draw on EXOSENS’ financing facilities (the term loan or the RCF), EXOSENS would automatically become jointly and severally liable as guarantor
Joint and several guarantee
Joint and several guarantee of 40 million euros provided to Citi in connection with the establishment of cash pooling
RCF (Revolving Credit Facility)
Financing line of 200 million euros granted by a pool of banks – end of commitment June 2029
Loan
A 140 million euro financing facility from the European Investment Bank, with a maximum term of seven years, repayable at maturity and available for drawdown for 36 months, including a 12-month grace period.
Exosens International SAS
Guarantees
A corporate guarantee of 800 thousand euros was granted to the Spanish Ministry of Defence to secure the commitments made by Exosens International in connection with the foreign investment review relating to NVLS. The guarantee is in force for eight years from 8 July 2025, unless released early if (a) Exosens International ceases to control NVLS or (b) NVLS ceases to carry on its defence-related activities.
PHOTONIS France SAS
Guarantees given in respect AED 4.7 M performance bond (CIC) of foreign export contracts INR 0.5 million earnest money deposit (EMD) guarantee (CIC) EUR 1.0 million performance bond (CIC + BNP) EUR 0.5 M guarantee (CIC + LCL) INR 2.0 M performance bond (CIC) EUR 1.5 M advance payment guarantee (BNP) EUR 0.02 million customs bond (SG) Loan
Loan agreement for EUR 7.85 million – EUR 3.6 million drawn as at 30 June 2026
Loan
Loan agreement for EUR 1.25 million – undrawn as at 30 June 2026
PHOTONIS Germany
Customs guarantee
EUR 0.01 million bond in favour of the Darmstadt Custom Office (Zollamt Darmstadt) issued by Volksbank Kurpfalz.
Exosens Detection Israel Ltd
Guarantee issued for a lease
ILS 1.4 million bank guarantee with counter-guarantee issued by BNP
Deposit
ILS 0.4 million deposit at the bank for account operation and bank cards
Telops
Guarantee given to banks
CAD 2 M guarantee given for the bank margin (EDC)
Guarantees given to banks
CAD 1.5 M guarantee given for ATA carnets
Other commitments
Commitments to purchase goods from various suppliers totalling USD 5.4 M, CAD 0.8 M and EUR 0.1 M
Guarantee issued for the Kuwait MOD
Bank guarantee for EUR 0.2 million
Guarantee issued for a lease
Bank guarantee for EUR 0.04 million
Guarantee issued for the Spanish MOD
Bank guarantee for EUR 3.0 million
NVLS
42
EXOSENS
Half-year financial report 2026
CONDENSED CONSOLIDATED INTERIM FINANCIAL STATEMENTS AS AT 30 JUNE 2026 Group consolidated financial statements
NOTE 30. Financial risk management
Risks The Group’s activities expose it to a variety of financial risks: market risk (including interest rate risk and foreign exchange risk), credit risk and liquidity risk. The Group’s overall risk management programme focuses on the unpredictability of financial markets and seeks to
minimise potential adverse effects on the Group’s financial performance. The Group uses derivative financial instruments to hedge certain risk exposures.
Risk management arrangements The Group uses derivative financial instruments to manage foreign exchange risk and interest rate risk on borrowings.
For all financial instruments, the carrying amount best represents the maximum exposure to credit risk.
Most of the financial instruments entered into by the Group are interest rate caps and swaps and forward purchases and sales of foreign currencies. These derivatives were entered into to protect the Group against both increases in interest rates and adverse movements in exchange rates. By offsetting market risks on the underlying liabilities with derivatives, the Group manages the concentration of risk on its financial liabilities.
The financial risk management policy and procedures defined by the Group are identical to those described in Note 32, “Financial risk management”, to the consolidated financial statements for the year ended 31 December 2025.
In addition, to protect against counterparty risk on derivatives, the Group enters into contracts with several banks.
Hedging transactions entered into or unwound during the period did not significantly change the EXOSENS Group’s exposure to financial risks. The main risks (liquidity risk, foreign exchange risk, interest rate risk, credit and counterparty risk) are described in this note to the consolidated financial statements for the year ended 31 December 2025.
Half-year financial report 2026
EXOSENS
43
02
CONDENSED CONSOLIDATED INTERIM FINANCIAL STATEMENTS AS AT 30 JUNE 2026 Group consolidated financial statements
Derivative financial instruments Financial instruments break down as follows: 30 June 2026 (in € thousands)
31 December 2025
Assets
Liabilities
Assets
0
0
0
0
Caps/Floors
848
0
146
0
TOTAL
0
CURRENT PORTION
Liabilities
848
0
146
NON-CURRENT PORTION
0
0
0
0
Caps/Floors
0
0
0
76
TOTAL
0
0
0
76
The carrying amount best represents the maximum exposure to credit risk for all derivatives subscribed to by the Group (no collateral held as a guarantee, etc.). The total fair value of a hedging derivative is classified as a non-current asset or liability if the remaining maturity of the hedged item is more than 12 months and as a current asset or liability if the maturity of the hedged item is less than 12 months. As at 30 June 2026, the derivative financial instruments used by the Group break down as follows: Company
Instrument
Nominal amount
Maturity
Bank
EXOSENS
Swaps
€25 million
31/12/2026
BNP PARIBAS
EXOSENS
Swaps
€25 million
31/12/2026
CIC
EXOSENS
Swaps
€25 million
31/12/2026
ARKEA
EXOSENS
Swaps
€50 million
31/12/2026
BNP PARIBAS
EXOSENS
Swaps
€50 million
31/12/2027
BANQUE POSTALE
EXOSENS
Swaps
€25 million
31/12/2027
CIC
EXOSENS
Swaps
€50 million
31/12/2028
BNP PARIBAS
EXOSENS
Swaps
€25 million
31/12/2028
LCL
EXOSENS
Swaps
€25 million
31/12/2028
CIC
EXOSENS
Swaps
€25 million
31/12/2028
ARKEA
EXOSENS
CAP
€50 million
31/12/2026
BANQUE POSTALE
EXOSENS
CAP
€75 million
31/12/2027
BANQUE POSTALE
EXOSENS
CAP
€25 million
31/12/2027
BANQUE POSTALE
Financial instruments and fair-value estimation Accounting policy IFRS 13 requires the valuation techniques used for each financial asset and liability to be classified within a fair-value hierarchy. The categories are defined as follows: • level 1: direct reference to quoted prices (unadjusted) in active markets, for identical assets or liabilities; • level 2: valuation techniques based on inputs other than quoted prices that are observable, either directly or indirectly; • level 3: valuation techniques based on non-observable inputs.
The fair value of financial assets and liabilities recognised at amortised cost is close to the carrying amount, except for financial debt.
44
EXOSENS
Half-year financial report 2026
The fair value of financial liabilities is determined for each borrowing by discounting future cash flows at a rate based on the Euribor yield curve at the reporting date, adjusted for the Group’s credit risk (Level 2). The fair value of derivatives is measured using models commonly used to value these financial instruments (models integrating observable market inputs). The inclusion of counterparty default risk and the specific credit risk of the entity does not have a material impact on the fair value of derivatives.
CONDENSED CONSOLIDATED INTERIM FINANCIAL STATEMENTS AS AT 30 JUNE 2026 Group consolidated financial statements
Financial instruments break down as follows: 30 June 2025
(in € thousands) Non-current financial assets
Financial instruments by category
Other financial Net Cash and liabilities at carrying cash Loans and amortised amount equivalents receivables cost 653
Fair Value Assumptions
Assets/ liabilities at fair value Hedging through financial profit or loss derivatives
Fair value
Level 1(1)
653
653
653
Derivative financial instruments
848
Trade receivables
68,695
68,695
68,695
68,695
Other current assets
26
26
26
26
Current financial assets
426
426
426
426
37
Cash and cash equivalents
68,808
68,808
TOTAL ASSETS
139,456
68,808
Loans and borrowings
269,472
Derivative financial instruments Trade payables
69,799
0
37
0
22,257
TOTAL LIABILITIES
314,719
812
269,472
848
22,990
68,808
68,808 138,607
269,472
269,472
22,257 0
0
314,719
0
0
848
0 22,990
Level 3(3)
848
139,456
0
22,990
Other current liabilities(4)
812
Level 2(2)
0
0 22,990
22,257
22,257
314,719
314,719
0
0
(1) Quoted prices (unadjusted) in active markets for identical assets or liabilities. (2) Inputs other than quoted prices included in Level 1 that are observable for the asset or liability, either directly (as prices) or indirectly (derived from prices). (3) Data relating to the asset or liability that are not based on observable market data (unobservable data). (4) “Other current liabilities” mainly comprise accrued supplier invoices of 11.1 million euros, other liabilities of 4.8 million euros, contingent consideration liabilities of 3.8 million euros and amounts payable to suppliers of property, plant and equipment of 2.5 million euros.
The fair value of debt is not materially different from its carrying amount as the debt was recently taken out. Loans and borrowings include variable-rate loans from banks and fixed-rate shareholder loans which cannot be traded. There is no material customer concentration risk.
Capital management The Group’s policy is to maintain a strong capital base so as to maintain investor, creditor and market confidence and to sustain the future development of the business.
Half-year financial report 2026
EXOSENS
45
02
CONDENSED CONSOLIDATED INTERIM FINANCIAL STATEMENTS AS AT 30 JUNE 2026 Group consolidated financial statements
NOTE 31. Consolidated companies The Group’s legal entities (“the Entities”) have been consolidated using the full consolidation or equity method and using the functional currencies listed below: Fully consolidated entities as at 30 June 2026
% interest
Exosens
% control
Functional currency
Parent company
EUR
Exosens International
100.0%
100.0%
EUR
Photonis France
100.0%
100.0%
EUR
Photonis Netherlands B.V.
100.0%
100.0%
EUR
Imagine Sensors International
100.0%
100.0%
EUR
Photonis Infrared France
100.0%
100.0%
EUR
Exosens Holding USA Inc.
100.0%
100.0%
USD
Exosens Scientific USA Inc.
100.0%
100.0%
USD
Photonis Defense Inc.
100.0%
100.0%
USD
Photonis Shenzhen Technologies
100.0%
100.0%
CNY
Xenics NV
100.0%
100.0%
EUR
Xenics Inc.
100.0%
100.0%
USD
Sinfrared
100.0%
100.0%
EUR
Telops France
100.0%
100.0%
EUR
Telops Inc.
100.0%
100.0%
CAD
Telops USA Inc.
100.0%
100.0%
USD
Exosens Detection Israel Ltd.
100.0%
100.0%
ILS
Photonis Germany
100.0%
100.0%
EUR
Exosens UK
100.0%
100.0%
GBP
Centronic Limited
100.0%
100.0%
GBP
Centronic Holdings Limited
100.0%
100.0%
GBP
Centronic Group Limited
100.0%
100.0%
GBP
Exosens Spain
100.0%
100.0%
EUR
NVLS S.L
100.0%
85.0%
EUR
Noxant France S.A.S
100.0%
100.0%
EUR
Photonis USA Night Vision
100.0%
100.0%
USD
Phasics
100.0%
100.0%
EUR
Phasics Corp
100.0%
100.0%
USD
% interest
% control
Functional currency
IGG Photonis Night Vision Electronics and Equipment Repairs and Testing LLC
49.0%
49.0%
AED
Adelphi Technology Inc.
30.0%
30.0%
USD
Equity-accounted entities
NOTE 32. Post-balance sheet events No significant events occurred between the reporting date and the date on which the financial statements were authorised for issue by the Board of Directors.
46
EXOSENS
Half-year financial report 2026
CONDENSED CONSOLIDATED INTERIM FINANCIAL STATEMENTS AS AT 30 JUNE 2026 Statutory Auditors’ review report on the half-yearly financial information
2.2 STATUTORY AUDITORS’ REVIEW REPORT ON THE HALF-YEARLY FINANCIAL INFORMATION (Period from 1 January 2026 to 30 June 2026) To the shareholders of Exosens, EXOSENS 18 avenue de Pythagore 33700 Mérignac
In compliance with the assignment entrusted to us by your Articles of Association and decision of the shareholders and in accordance with the requirements of article L. 451-1-2 III of the French monetary and financial code (“code monétaire et financier”), we hereby report to you on: • the review of the accompanying condensed consolidated interim financial statements of EXOSENS, for the period from 1 January 2026 to 30 June 2026; • the verification of the information presented in the half-year activity report.
These condensed consolidated interim financial statements are the responsibility of the Board of Directors. Our role is to express a conclusion on these financial statements based on our review.
Conclusion on the financial statements We conducted our review in accordance with professional standards applicable in France. A review of interim financial information consists of making inquiries, primarily of persons responsible for financial and accounting matters, and applying analytical and other review procedures. A review is substantially less in scope than an audit conducted in accordance with professional standards applicable in France and consequently does not enable us to obtain assurance that we would become aware of all significant matters that might be identified in an audit. Accordingly, we do not express an audit opinion. Based on our review, nothing has come to our attention that causes us to believe that the accompanying condensed consolidated interim financial statements are not prepared, in all material respects, in accordance with IAS 34, Interim Financial Reporting, as adopted by the European Union.
Specific verification We have also verified the information presented in the half-yearly management report on the condensed consolidated interim financial statements subject to our review. We have no matters to report as to its fair presentation and consistency with the condensed consolidated interim financial statements.
Nantes, 28 July 2026 The Statutory Auditors
PricewaterhouseCoopers Audit
Baker Tilly Strego
Anne Parenty
François Pignon-Hériard
Partner
Partner
Half-year financial report 2026
EXOSENS
47
48
EXOSENS
Half-year financial report 2026
03
ADDITIONAL INFORMATION
3.1
Statement by the person responsible
50
Half-year financial report 2026
EXOSENS
49
03
ADDITIONAL INFORMATION Statement by the person responsible
3.1 STATEMENT BY THE PERSON RESPONSIBLE “I certify that, to the best of my knowledge, the condensed consolidated interim financial statements contained in this report have been prepared in accordance with the applicable set of accounting standards and give a true and fair view of the assets, financial position and results of the Company and all entities included in the consolidation, and that the attached half-year activity report gives a fair review of the significant events occurring during the first six months of the financial year, their impact on the interim financial statements, the main related-party transactions and the principal risks and uncertainties for the remaining six months of the financial year.” Mérignac, 30 July 2026 Jérôme Cerisier, Chief Executive Officer of the Company.
50
EXOSENS
Half-year financial report 2026
Photo credits EXOSENS, @Shutterstock, @AdobeStock. All rights reserved. Graphic design and production Ruban Blanc
Exosens H1 2026 Results Tuesday, 28th July 2026
Transcript produced by Global Lingo London – 020 7870 7100 www.global-lingo.com
Exosens H1 2026 Results
Tuesday, 28th July 2026
Exosens H1 2026 Results Operator: Welcome to Exosens 2026 Half-Year Results Presentation. For the first part of the conference call, the participants will be in listen-only mode. During the questions and answers session, participants are able to ask questions by dialling pound key five on their telephone keypad. Now I will hand the conference over to Laurent Sfaxi, Head of Investor Relations, to begin today's call. Laurent Sfaxi: Good morning, everyone, and thank you for joining us for Exosens' first-half 2026 results presentation. I am Laurent Sfaxi, Head of IR at Exosens. I am joined today by Jérôme Cerisier, our CEO, and Quynh-Boi Demey, our CFO.
They will review our first-half
business performance and strong financial results and also present our outlook for the year. This presentation will be followed by a Q&A session, so you will be able to ask your questions. I will now hand over to Jérôme. Jérôme Cerisier: Thank you, Laurent. Good morning, everyone, and thank you for joining us. Exosens delivered another strong performance in the first half of 2026, as we combined sustained double-digit growth, further margin expansion, robust cash generation and a sound balance sheet. Let me start perhaps with four key messages. First, the revenues reached €253.1 million, an increase of 15.3% year-on-year and 11.4% on a like-for-like basis. Growth was broad-based across both segments. Amplification revenue increased by 11.6%, including a 10% like-forlike growth, while Detection & Imaging grew 24.3%, with a particularly strong like-for-like growth of 14.6%. Second, profitability reached a new record level. Adjusted EBITDA increased by 18.3% to €83.6 million, and the EBITDA margin expanded to 33%. This performance reflects the strength of our technology positions, but also a favourable product mix, higher volumes and consistent operational execution across our industrial footprint. Third, we continued to invest for future growth while preserving a strong cash generation and some financial flexibility. The free cash flow amounted to €31.4 million despite a significant acceleration in our growth CAPEX. Our leverage ratio is now 1.2 times adjusted EBITDA to be compared with 1.3 times at the end of 2025. Fourth and finally, based on the strong first-half performance and our current visibility, we now expect the guidance to be towards the upper end of our 2026 revenue and adjusted EBITDA guidance ranges. I will come back to that at the end of the presentation. Let us review the main developments across our businesses. On the Amplification market. Amplification continued to deliver strong execution, supported by commercial momentum, technology leadership and continued expansion of our industrial platform. On the commercial side, a major milestone was actually achieved during this first half of the year with award of a contract linked to the US Army's, the BiNOD programme.
This is
programme of record is key to validates our in-country industrial strategy that will also strengthen our long-term position in the United States.
And as you know, the US market
represents approximately 45% of the global night vision market. www.global-lingo.com
2
Exosens H1 2026 Results
Tuesday, 28th July 2026
We also continued to win business across a broad range of European markets and NATO countries, as the sole sizable ITAR-free supplier. On innovation, we are progressing with our Augmented Reality MicroDisplay, which brings digital information directly into the image of an image intensifier tube. This technology is fully from and fit compatible with existing goggles, so it allows real-time tactical information display while preserving the night performance, the core image quality, the identification performance that every single user continues to expect. In parallel, we completed the integration of NVLS. As you know, NVLS expands our addressable market in high-end, man-portable night vision, particularly through its wide field-of-view expertise. In the United States, we are preparing also the co-location of Photonis Defence headquarters in Sturbridge, Massachusetts, alongside our existing Detection business and so alongside our Image Intensifiers tube production facility being incepted. This co-location, this US hub, creates a more integrated US organisation, enables a closer engagement with customers and generates efficiencies through shared services for support functions. We continue to invest into our production capacity as we continue to witness the strength of customer demand. Since 2020, we have successive and progressively implemented successive investment stages. Back in 2025, we announced two capacity or two stages of expansion for a total of €37 million investment, and this programme is now ongoing both for the Europe and the United States. I remind you, it is expected to increase image intensifier production capacity by about 40% by the end of 2027 if we compare it to 2024. The first benefits of the European investments are expected in the second half of 2026 while the first deliveries of the US facility are expected in H1 2027. At the same time, given the acceleration in global demand and the market opportunities we see, we are actively evaluating further staggered capacity additions beyond the current programme to respond to this increasing demand. Our approach in capacity increase remains disciplined to invest in line with visibility on demand, while it’s important that we preserve our industrial mastership, our product quality, our efficiency and overall, our high yields. They command our ability to serve our customers and they command also our margins. Most specifically on US facility, if I turn now to the rollout of our new Sturbridge production facility, it is progressing as planned. It’s, as you can see, located to our existing US Scientific and Photonis Defence operations. The key production equipment has been ordered. The project teams are on board. The first personnel have been trained or are being trained within our Europe’s facilities. I remind you that the initial facility is expected to represent 10% to 15% of the total image intensifier capacity by end 2027. This facility provides us with an ITAR-controlled production capability to serve the US Department of Defence and law-enforcement markets. It is an important step. Actually, it’s a strategic step in accessing the US market as the US market requires a local production for its forces. We are committed to serve this market in the short, in the medium, in the long term with this establishment.
3
Exosens H1 2026 Results
Tuesday, 28th July 2026
Concerning Detection & Imaging. We delivered a significant acceleration in growth during the first half, supported by strong demand in Defence & Surveillance, continued commercial developments in our other verticals, and disciplined M&A execution. In Defence & Surveillance, we are expanding our customer base among leading unmannedsystem OEMs, autonomous-system developers, first tiers OEM in all types of applications, be it surface, be it ground, be it air. During this half, we also secured our largest order to-date from a major European developer of autonomous air defence systems, which confirms the increasing role of advanced imaging in drone, in counter-drone and autonomous defence applications. In our commercial markets, we achieved several new design-in wins in high-performance mass spectrometry, electron microscopy and semiconductor detector applications, which will in turn nurture growth in the coming years. We are also seeing, by the way, in nuclear, a strong commercial momentum, especially in the US concerning small modular reactors. Our innovation pipeline remains active.
On the M&A side, we completed the integration of
Phasics, so a leader in wavefront sensing technology, and we completed the acquisition of Emberion, which adds differentiated quantum dot-based SWIR capability to our portfolio. I think we will come back to Emberion in our M&A section. Let me perhaps give me a little bit more light on the Defence & Surveillance applications in Detection & Imaging. This is definitely, for the time being, one of the most attractive areas of growth for Exosens. We cover the whole spectrum from ultraviolet to visible light through near, short, mid and long-wave infrared, which enables us to address a wide range of missioncritical applications. We have identified three particularly attractive application areas. Platforms, with an expected mid-term growth of around 8%. Surveillance, with expected growth of around 10%, driven by the counter drone applications. And last but not least, the drone themselves, where drone imaging represents a mid-term growth rate of around 17% as per our estimates. These markets require increasingly capable multi-spectral solutions for detection, identification, tracking, targeting and situational awareness. Exosens, as a Group, is very well positioned because we combine a broad technology field proven portfolio of technologies. We cover most usages with the ability to industrialise, to scale up, to deliver in quality, in quantity, reliable and high-performance products. It’s this combination that puts us in a good position on this market. We wanted to also illustrate better our position. Our position is really in the value chain, is at the core of it. We operate in the critical sensing and imaging layers. We create data. We create information. We supply sensors and detectors that convert light or photonic radiations into an electrical signal or into images. So, we provide mission-critical data that are needed by our OEMs to integrate, to make decisions and to act at the system level. Our customers, they integrate these technologies into payloads, into gimbals, into turrets, into sights, into complete mission systems, finally, for the benefit of our end users. This is what allows us to partner with a broad range of OEMs with a common platform, common sensors, common devices. We can serve all OEMs in their different applications.
4
Exosens H1 2026 Results
Tuesday, 28th July 2026
That allows nevertheless us to remain focused on the areas where our technology and industrial know-how create the greatest value and with the right effort needed to master these technologies. Defence & Surveillance is the fastest-growing defence segment for the time being. We see strong momentum across platforms, across surveillance and drone-related applications. If I want to dig a little bit more into the detail there. On platforms, the European defence modernisation and the fast equipment paces are driving the procurement of advanced electro-optical or optronic systems in all types of medias. We continue to strengthen our relationships with leading defence primes, with OEMs in absolutely all domains. Drones and counter-drone applications remain the fastest-growing market. The demand for advanced imaging combat qualified and proven solutions continues to increase, and we are strengthening our position with leading OEM, but also with autonomous system providers which are part of the new defence ecosystem. In surveillance, investment is increasing in border protection, but more importantly in critical infrastructure and in counter-drone capabilities.
This segment or this market requires
particularly cooled infrared solutions for long-range detection and tracking of drones, again, across all medias, so that is air, land and sea. We are seeing our technologies being increasingly selected by OEMs for these demanding applications. That has resulted for Exosens in the need to expand our capacity. This accelerating demand actually requires larger volumes of production at shorter time frames. For compact thermal imaging solution used in drone payloads and air-defence systems, we are tripling our capacity by the end of 2026. For cooled infrared cameras, we are doubling this capacity over the same period. These investments have started. They are already underway. They are partially implemented. They will continue throughout the year, and they are designed to support the strong growth while maintaining the product performance and the industrial mastership of the quality and the delivery ability that is expected by all our customers. Here again, we will continue to expand as the market demands and as the market commands. We see capacity expansions as a way to follow the requirements of our customers, and we are doing so in a disciplined yet rigorous way. On commercial markets, the picture remains differentiated by vertical, but the long-term structural drivers are intact. In Life Sciences, if I start with that one, the market conditions remain soft in the US scientific research and the microscopy. However, the mass spectrometry inventory correction has ended, which is allowing for a renewed increase in demand and a confirmed long trend towards higherperformance analytical systems, which is perfectly well supported by our technical leadership, especially in the time-of-flight programmes. That resulted in several design wins, not only in mass spectrometry but also in electronic microscopy. These design for instruments will result in future growth when these instruments are launched, starting 2027 and more notably in 2028. www.global-lingo.com
5
Exosens H1 2026 Results
Tuesday, 28th July 2026
In Industrial Control, the market conditions are gradually improving.
The deployment of
artificial intelligence infrastructure is supporting renewed investments in all areas, especially in semiconductors, in industrial automation, or in advanced manufacturing. That creates for us a structural demand driving growth for machine vision applications and real-time process monitoring, which we are providing cameras to. Finally, in Nuclear, we continue to see a strong momentum in the US small modular reactors. The Department of Energy’s Reactors Pilot Programme that was launched last year is creating studies and prototype demand, which is now starting to be followed by near-term pre-series orders, all of that resulting in strong growth for our activities. The commercial opportunities we see are increasing. Obviously, this is driven by the new quick close to usage point, alternative sources of electric power that are required or heat energy even. So, over the long-term, the growing electricity demand for AI centres, coupled with local production, seems to be a good outcome, let’s say, for SMR market, as it saves basically the grid connection costs, and that seems to be fuelling significantly the demand for SMR market. We see this market as being growing at a fast pace for the coming years. I will now hand over to Quynh-Boi, having finished the overview of the market, and Quynh-Boi will take you through the M&A strategy and our financial performance. Quynh-Boi Demey: Thank you, Jérôme.
As we said at the time of the IPO, our strategy
combines strong organic growth with targeted bolt-on acquisitions. Our ambition is clear and is to become the leading consolidation platform in electro-optics while we remain highly disciplined in how we deploy capital. First, we target companies with technology assets that complement our own portfolio. When developing a technology internally would take too long or involve significant execution risk, acquisitions allow us to accelerate innovation while reducing time-to-market. Second, we focus on companies that operate within our four core end-markets, so Defence & Surveillance, Life Sciences, Industrial Control and Nuclear, that expand our addressable market and strengthen our competitive positioning. Third, we prioritise businesses that have already reached industrial scale, with proven customer relationships and leadership positions in their respective niches. That said, we also remain open to early-stage companies when they offer strategically important technologies with strong long-term potential, which is typically the case of our latest acquisition, Emberion, that I will show you later. What do we bring to these businesses?
We provide global commercial platforms that
accelerates market penetration, industrial excellence across manufacturing and supply chain, and a strong technology ecosystem supported by deep R&D capabilities and a robust IP portfolio. This creates value on multiple fronts: faster growth, broader market exposure and a more diversified, resilient business model. Importantly, our acquisitions are not only growth-accretive, they also create value through operational synergies, margin expansion and stronger cash generation. Emberion is a good example of our acquisition strategy. It is an innovative company specialising in short-wave infrared imaging, with operations in Finland and in the UK. www.global-lingo.com
The acquisition 6
Exosens H1 2026 Results
Tuesday, 28th July 2026
strengthens our position in SWIR technologies and it also opens new opportunities in defence applications, especially for drones and portable imaging systems, while it also allows us to broaden our offering in industrial control and semiconductor inspection. Most importantly, Emberion is exactly the type of company we are looking for.
It offers
differentiated technology that can grow faster by leveraging Exosens' global commercial platform, industrial capabilities and technology expertise. Now, let’s have a look at what Jérôme explained earlier on the market trends, have translated into our financial performance for the first half of 2026. We continue to deliver strong growth while also improving our margin. Revenue is up 15%, adding €33 million overall. So, €18 million from Amplification, driven by solid defence investments, but also excellent execution with our factories that now run at full capacity. €15 million of the growth is coming from Detection & Imaging, mainly driven by the drone and counter-drone markets and also the addition of the newly acquired companies, Noxant and Phasics. Our adjusted gross margin also grew by 17% to €129.9 million. As a percentage of sales, adjusted gross margin improved from 50.8% to 51.3%, and that’s up 0.5 point compared to last year. This adds about €18 million in gross margin, with €11 million from Amplification and €7 million from D&I. Let’s dive into the details on the next slide by segment. Let's start first with Amplification. Revenue grew by 11.6%, or 10.0% on a like-for-like basis, as NVLS Spain had a limited contribution during the first half. This strong organic performance was driven by three factors: sustained market demand, good operational execution and a favourable product mix. On the demand side, growth continues to be fuelled by increasing deliveries of night vision goggles for land forces, which rely on our image intensifier tubes. The changing nature of modern warfare, particularly in Ukraine, continues to reinforce the importance of night vision capabilities and is driving sustained demand from armed forces, and especially in Europe with the threat of Russia. Operationally, we are currently running our European production sites at full capacity. Despite ongoing expansion works, we maintained very high production yields through continuous process
improvements,
optimised
production
scheduling
and
excellent
manufacturing
execution, that finally results in limited scrap and rework. Finally, we continue to benefit from a favourable product mix, with growing demand for our highest performance image intensifier tubes. As a result, Amplification gross margin increased by 110 basis points year-on-year to a 52.5%, which is a record level for the business. Turning now to Detection & Imaging. Revenue increased by 24.3%, that includes a 14.6% likefor-like growth, that reflects both the contribution from the acquisitions that we completed in 2025 and the strong organic momentum. Organic growth was primarily driven by continued strength in Defence & Surveillance, and particularly
imaging
solutions
for
drone,
counter-drone
and
long-range
surveillance
applications, together with a sustained momentum in nuclear instrumentation, as commented www.global-lingo.com
7
Exosens H1 2026 Results
Tuesday, 28th July 2026
earlier by Jérôme. These positive trends were partly offset by the continued softness in US scientific research and Life Sciences, where customers remain cautious with their investment spending. On profitability, our gross margin reached 48.1%. They are broadly stable compared with the full year of 2025, but it’s 60 basis points lower than in the first half of last year, and it’s mainly the result of an unfavourable product mix due to the lower contribution from our higher-margin Scientific Research and Life Sciences activities. Moving to profitability, adjusted EBITDA increased by 18% to €83.6 million.
The adjusted
EBITDA margin reached 33%, an improvement of 84 basis points year-on-year and it’s a new record level for the Group. Adjusted EBIT increased by 19% to €71.8 million, with the margin expanding by 93 basis points to 28.4%, which is also a new record for the Group. The principal drivers of this performance were operational excellence, the favourable product mix in Amplification and the benefits of volume and scale. We continued to grow faster than our fixed-cost base, while maintaining discipline across the organisation and investing selectively in the capabilities required for future growth. This performance flows down to the net income. Excluding the non-cash trademark impairment, net profit from continuing operations increased by 21% year-on-year to €35.9 million. There are two points I'd like to highlight here. The first is our 2025 results, we still have a €1.7 million loss from the Microwave Amplifiers business, which we divested at the end of 2025. This business is therefore no longer part of our continuing operations. Second, during the first half of 2026, we completed the transition to a single Exosens brand across the Group. As Exosens has become increasingly recognised since the IPO, moving to a single brand provides customers and partners with a clearer and more consistent identity. As part of this transition, we recognised a non-cash trademark impairment of approximately €21 million on a net basis, mainly related to the Photonis brand. This accounting adjustment has no impact on the Group's cash flow or underlying operating performance. I’ll skip the slide on R&D and CAPEX for the sake of time, so that we have enough time for the Q&A. Let's move directly to the free cash generation, slide 29. Cash flow generation. We delivered a very solid performance in the first half. Free cash flow amounted to €31.4 million, is broadly in line with the strong level that we achieved in 2025, despite a significant increase in growth investments. Higher EBITDA, that you see, was partly offset by increased working capital requirements, which is a natural consequence of delivering more than 15% revenue growth.
That said, disciplined working capital management, and
especially on receivables, helped contain the increase. At the same time, growth CAPEX almost doubled as we continued to invest in expanding our production capacity.
Our capacity expansion programme is progressing on schedule.
Construction is underway in France, the Netherlands, and the US to accommodate additional production equipment.
In Europe, new machines have already been commissioned and
qualified, with the first additional capacity expected to come on stream in the second half of 2026. In the US, the new facility remains on track to come on stream in mid-2027. www.global-lingo.com
8
Exosens H1 2026 Results
Tuesday, 28th July 2026
Finally, our CAPEX to sales. As we increase our CAPEX for growth, our CAPEX to sales ratio remained fully in line with our guidance of 9.2%. Let me conclude with our balance sheet. At the time of the IPO, we significantly strengthened our financial profile through the refinancing of our debt, as we secured a €250 million Term Loan B and a €100 million of revolving credit facility, both maturing in 2029. In June, we further enhanced our financial flexibility by doubling the size of our RCF to €200 million and we also secured a new facility with the European Investment Bank for a total amount of €140 million. Both facilities remain fully undrawn today. Our balance sheet remains very strong. Leverage decreased from 1.3 times at the end of 2025 to 1.2 times at the end of June, while we maintain a solid cash position. With strong cash generation, a conservative leverage profile and more than €340 million of undrawn committed financing, we are well-positioned to fund both our organic growth ambitions and our bolt-on disciplined acquisition strategy. With that, I'll hand over to Jérôme, who will conclude today's presentation with our outlook for 2026 and the mid-term. Jérôme Cerisier: Thank you, Quynh-Boi. Based on the strong first half performance and the continued momentum we are seeing across our businesses and our end-markets, we are now expecting both revenue and adjusted EBITDA to be towards the upper end of our guidance ranges for 2026. As a reminder, they were given as for revenue between €520 million and €540 million, and for adjusted EBITDA between €168 million and €178 million. As our capacity expansion programmes continues to progress as planned in both Europe and the US, we also reaffirm our guidance for industrial CAPEX of around 9% of sales, and R&D capitalisation of about 3% of sales. Beyond 2026, our investment case remains unchanged and strong. We continue to target an average annual organic revenue growth of up to the mid-teens, while growing the adjusted EBITDA at more than 15% per year on average, supported by further margin expansion. At the end of our current investment cycle, we expect industrial CAPEX to normalise to around 5% of sales while maintaining R&D capitalisation at about 3% of our sales. As a conclusion, we are very pleased with the performance delivered in the first half.
We
achieved another period of double-digit growth, a further margin expansion, and a strong cash generation, while of course continuing to invest for the future. We also see the structural drivers supporting our business, be it in Defence & Surveillance, in Life Sciences, in Industrial Control, in Nuclear, remain firmly in place. Our balance sheet gives us the flexibility to continue investing in both organic growth in the form of hard CAPEX, R&D, and working capital, and in targeted acquisitions. Overall, we remain very confident in our outlook for the second half of 2026 and in our further ability to continue to creating value over the coming years until the mid-term. That concludes, I think, our presentation of the results. With that, operator, I think we’re ready to take any questions. www.global-lingo.com
9
Exosens H1 2026 Results
Tuesday, 28th July 2026
Questions and Answers Operator: Ladies and gentlemen, if you wish to ask a question, please dial pound five on your telephone keypad to enter the queue. If you wish to withdraw your question, please dial pound key six on your telephone keypad.
The next question comes from Aleksander Peterc from
Bernstein. Please go ahead. Aleksander Peterc (Bernstein): Yes. Good morning, and thank you for taking my question. I just have two. The first one is on your potential further capacity increases. Could you help us understand if you see today that demand is very strong into the end of the decade? Why wouldn’t you decide on this further capacity increase today? Or do you have more time you need to complete first the current cycle of this 40% increase and only then start putting in place the next stage? That would be my first question. The second one is on M&A. Can you give us an idea of the pipeline of opportunities you have right now? How many companies you are looking at, and what kind of size of the targets? Are they effectively larger now that you have more firepower? Thank you. Jérôme Cerisier: Okay. Thank you, Aleksander. On further capacity increase, as we stated, we constantly re-evaluate demand. We are in an active phase in really understanding what the demand is looking like, and the demand continues to strengthen.
We will consider further
capacity increase as soon as practically demand solidifies. We don’t necessarily need to wait until the current capacity increases are implemented before making this decision. We didn’t do that, by the way, in the past, but as you know, capacity increase takes 18 to 24 months to be implemented. So as a matter of fact, we are not going to wait the mid-term before we decide to increase capacity further if the market and if the demand continues to strengthen earlier than that. Quynh-Boi Demey: On the M&A, we don’t change our strategy, which has always been to continuously screen the market and look for high-value technology assets. Most of the time they are of dual use, so we don’t really mind whether it’s for defence or non-defence. They have to be positioned in the four core verticals where we operate. In terms of pipeline, we constantly have seven to eight companies that we screen, which is the case today. Our pipeline is quite rich. But as you know, with M&A, it always takes time. And in terms of the size of our acquisitions, so far, we’ve always looked for companies which typically had sales above €10 million. But as you saw with Emberion, we also looked for assets which have long-term potential growth and differentiated technology, which is typically the case of Emberion with the quantum dots that would strengthen and would sway our portfolio. Now what we can afford as well is to look for acquisitions which can be a little bit larger, so €50 million to €100 million of sales, typically. As you know, with M&A, it takes time. So, we’ll see. Aleksander Peterc: Thank you very much. Very clear. Operator: The next question comes from Aurélien Sivignon from ODDO BHF. Please go ahead. Aurélien Sivignon (ODDO BHF): Hi. Good morning. Thank you for taking my question. I have three.
The first one on D&I. Could you give us a bit more colour on the Defence &
Surveillance growth in H1? Since I guess it’s pretty much above the 15% like solar growth www.global-lingo.com
10
Exosens H1 2026 Results
Tuesday, 28th July 2026
reported at division level. Was it mainly driven by existing programme ramping up, or are you already starting to see some contribution from new platforms wins? Then a follow-up maybe on the previous question regarding capacity increase. Can you just precise if you are looking at capacity additions in Europe, in the US or in a new location? The last one on NVLS. Can you provide an update on the integration? And since the contribution was, I think, rather small in H1, should we expect the deliveries under the Spanish programme to start contributing more meaningfully, let’s say, to revenue from H1 onwards? Thank you. Jérôme Cerisier: Okay. So, concerning Detection & Imaging and the growth of the defence vertical in this market, the drones and counter-drones applications are definitely the fastestgrowing applications in the Detection & Imaging segment so far. So yes, it is higher than the average growth for the segment, as the demand is there. The typology of our customers is actually already quite spread, quite large, with both tier ones, but also newcomers.
Newcomers in the sense that they are recent companies that are
participating into the drone and counter-drone rally, and that are belonging and starting to form the new defence ecosystem. So, we have both of that. As a matter of fact, the largest orders we are seeing and the most promising, let’s say, orders we are seeing are coming from new OEM platforms. As far as capacity increase is concerned, concerning D&I, we are really focusing on strengthening our supply chain, reducing our delivery times, securing our supply chain. The capacity increase that we have is in Europe as our production for Detection & Imaging is entirely in Europe. And that did not prevent us from being successful in exporting to countries that are outside of the continent, including North America. However, today it is in Europe. Should the market expand further, and should the need arise? We could consider one day to produce in different continents. But as of today, we are talking and doing expansion in our current facilities in Europe. Quynh-Boi Demey: With regards to your question on NVLS, indeed, in the first half had a limited contribution of NVLS, which we expect much higher in the second half. Aurélien Sivignon: Okay. Thank you for the colour. Operator: As a reminder, if you wish to ask a question, please dial pound key five on your telephone keypad.
The next question comes from Marie-Thérèse Grübner from Cantor
Fitzgerald Europe. Please go ahead. Marie-Thérèse Grübner (Cantor Fitzgerald): Yes. Good morning. Thank you for taking my questions. I have two, if I may. The first one pertains to assuming D&I is now growing faster, both organically and inorganically, considering the M&A pipeline and considering the strength of the Defence & Surveillance sub-segment in particular. I was wondering if you are considering moving to an adjusted EBITDA breakdown by divisions, not just the gross margin, but also the adjusted EBITDA sometime in the near future. That would be my first question. Jérôme Cerisier: And your second question, if we may take them both together. Marie-Thérèse Grübner: Yes, of course. The second question. I mean, I noticed that there is one domain that is currently not addressed or seemingly not addressed by Exosens, which is the space domain, and I can imagine that there are various applications that are possible for www.global-lingo.com
11
Exosens H1 2026 Results
Tuesday, 28th July 2026
your competencies in the space domain. I was wondering if this is something that you are looking to address in the future as well. Jérôme Cerisier: Okay. Quynh-Boi Demey: On the first question about the D&I adjusted EBITDA by division. What we said at the time of the IPO, and this has not changed, is that, in our sites, the common resources are quite shared between the two divisions. So, splitting between the two doesn’t make really sense because it will be pure allocation. This is the reason why at the time of the IPO, we decided to split only at the gross margin level. Jérôme Cerisier: Actually, concerning space, this is definitely a domain that is not far from the verticals we are currently addressing. As a matter of fact, our overall strategy is to selfinvest in products and to develop the best products for the different applications we target. And doing so, we are ready, and actually we are doing, we are proposing these products to our customers with little customisation. When it comes to space, you have two sides to space.
The traditional, let’s say, space
programmes, more referred to one-offs and to a programme type of industry, which is not what we are going to do in principle, since, again, we are putting and developing our products for a wide range of applications. However, in the new space, the usage of off-the-shelf products is more widespread.
But so far, we haven’t, let’s say, identified the right fit between the
technology and the exact applications these companies or these constellations, let's say, we’re looking for. We continue to be present on the space market in the form of scientific missions, which are scarce and rare, but where we provide critical technology more on a, let’s say, technology that is already available to these space missions when it is about discovering the limits or, let’s say, the envelopes or the physics in the universe. This is our space participation today. Should we find an application or applications of our products that are in our portfolios, we would have absolutely no problem in working in space, of course. Marie-Thérèse Grübner: Okay. Thank you very much for these clear answers. Operator: The next question comes from Sriram Krishnan from Deutsche Bank. Please go ahead. Sriram Krishnan (Deutsche Bank): Good morning. Thank you for the opportunity. I had just one question and probably two parts to that one. With regards to the capacity expansion coming from the D&I division, could you give us some idea about what’s the kind of CAPEX spend which is happening, specifically on D&I on the back of the doubling of production capacity announced this morning? That’s part one. Then related note. You did reiterate that the counter-drone and the drone market is set to grow at 17% CAGR during the mid-term. Do you think your capacity plans currently, whatever you have announced, is sufficient to capture that kind of a demand, or do you think that’s also a moving target, so to speak, where you will continue to assist in the coming quarters, so to speak? Thank you. Jérôme Cerisier: Okay. Concerning our capacity expansions in Detection & Imaging, what is important to note is that the type of expansion is not of the same nature than in our www.global-lingo.com
12
Exosens H1 2026 Results Amplification market.
Tuesday, 28th July 2026
It’s mainly about assembly expansion, which is much less CAPEX-
intensive, but which requires much more coordination, management, programme management to coordinate the whole supply chain with all of our suppliers. It’s more of a different nature. The CAPEX intensity is embarked into or can be embarked in our normative CAPEX that we target on the mid-term. Further capacity expansions as a result, and because it has been our policy and it will remain our policy, they are decided based on demand. Today, we consider that the doubling and the tripling of our capacity in the drone and counterdrone markets are serving the demand for the, let’s say, the 12, 18 months to come. Should we see further expansion in demand? We would have no issue in deciding and investing more in the capacity expansion. Again, this is less a question of CAPEX than a question of supply chain, in that case, in Detection & Imaging. Operator: As a reminder, if you wish to ask a question, please dial pound key five on your telephone keypad. The next question comes from David Perry from JP Morgan. Please go ahead. David Perry (JP Morgan): Hi, Jérôme and Quynh-Boi. I apologise, I was on the Safran call, I missed a lot of your call. Sorry for that, and apologies if you’ve already answered this. I was just curious, what percent of D&I sales in H1 came from the defence end market, please? Jérôme Cerisier: I’m sorry, David, we couldn’t hear very well your question. Could you repeat, please? Quynh-Boi Demey: How much of the Defence & Surveillance account for the D&I? Is that your question, David? David Perry: Yes, please. Quynh-Boi Demey: We usually don’t report on a half year basis because it’s not representative of the full year. As you know, the phasing of the Life Sciences businesses is more towards the end of the year. If we would calculate, this would be higher than the one-third that we reported at the end of 2025, but this is not representative at all of what the full year would look like. David Perry: So, you still think about a third for the full year? Quynh-Boi Demey: Yes. Jérôme Cerisier: Yes. David Perry: All right. Thank you. I’ll read the transcript and see what I missed. Thanks a lot. Operator: Thank you for your questions. I hand the conference back to the speakers for any closing comments. Laurent Sfaxi: Thank you, everyone, for joining us for this call. We remain at your disposal if you have any further questions. We wish you a very good day, and a great summer holiday. Thank you all. [END OF TRANSCRIPT]
13
PRESS RELEASE MÉRIGNAC, FRANCE – 7 AUGUST 2026
MONTHLY INFORMATION ON THE TOTAL NUMBER OF SHARES AND VOTING RIGHTS IN THE SHARE CAPITAL In accordance with articles L. 233-8 II of the French Commercial Code and 223-16 of the General Regulations of the French Autorité des Marchés Financiers ISIN code: FR001400Q9V2
Date
Total number of shares
Total number of voting rights
31/07/2026
50,936,749
Number of theoretical voting rights: 59,455,018 Number of exercisable voting rights*: 59,196,149
- After deduction of treasury shares without voting rights.
-
The wavefront of the parabolic deformable mirror couldn't be measured, so what did NASA do?
Jul 29th 2026
Markets
Technologies
The wavefront of the parabolic deformable mirror couldn't be measured, so what did NASA do?
In direct imaging of exoplanets, even tiny wavefront errors in the optical system show up as residual speckles. These degrade the coronagraph's dark hole and make it harder to pick out the faint signal of a planet.
Most current high-contrast imaging systems use two flat deformable mirrors placed in different optical planes. As the beam travels between them, the two mirrors work together to adjust both phase and amplitude. It's a mature approach, but it comes with a cost: the mirrors need enough separation for the beam to propagate properly, and the system needs extra driver electronics, cabling, and support structure, all of which add weight, power draw, and thermal load.
NASA Goddard's ExoSpec project took a different approach. Rather than adding a separate correcting mirror, the team used a custom parabolic deformable mirror that combined the system’s required focusing function with wavefront-control capability. The Parabolic Deformable Mirror (PDM) is the same focusing mirror the imaging system requires, now fitted with a full array of actuators behind it so the mirror can reshape its surface to correct wavefront aberrations in the optical system. This architecture can simplify packaging by eliminating the need for a far out-of-pupil deformable mirror. At the system level, a lower overall actuator count may also reduce harnessing, drive electronics, mass, and power requirements.
A supplier developed a custom off-axis parabolic deformable mirror for the project. Its actuator array deforms a continuous reflective membrane, allowing the optic to retain its focusing or collimating function while also correcting wavefront aberrations.
The first-generation PDM has 277 actuators. Before calibrating and controlling them, the team first needed a clean picture of the mirror's starting condition: the wavefront error while the prototype was unpowered and none of the actuators were active. From there they would build up to closed-loop correction, then test thermal stability over longer runs. Simulations using two 16×16 PDMs plus one 32×32 flat pupil-plane deformable mirror kept contrast below 10⁻⁹ across a 5–12 λ/D dark hole, even with bandwidth pushed up to 35%.
Once the first PDM prototype was delivered, though, the team ran into challenge almost right away. The initial aberration was too large, and their existing Fizeau interferometer setup couldn't reconstruct the wavefront.
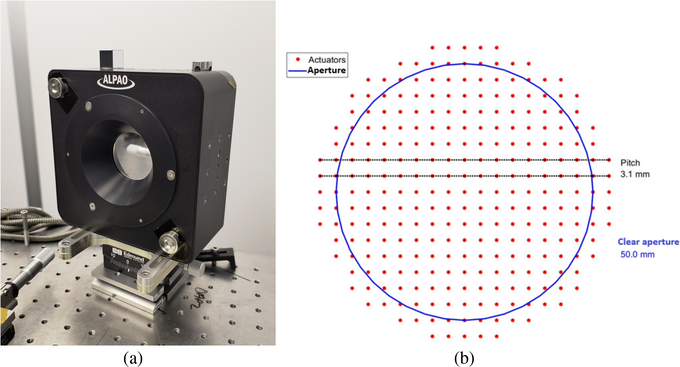
How did Phasics SID4 HR support actuator calibration and wavefront measurement during closed-loop operation?
Before the first-generation PDM could go into a high-contrast imaging testbed, it needed its own characterization: both its optical performance and how each actuator actually responded.
The team started with a static off-axis parabolic mirror matching the PDM's optical parameters. Using a Fizeau interferometer with a 632.8 nm collimated beam (4-inch diameter) and a CaliBall, they built a double-pass setup to confirm surface error, off-axis distance, focal length, and focus position. Once the alignment and measurement method were confirmed, they swapped in the unpowered first-generation PDM.
That's when the original setup ran into difficulties. The Fizeau system couldn't reconstruct a full wavefront from the interference fringes it picked up. Unpowered, the PDM's surface carried roughly 3500nm RMS of initial aberration and steep local slopes, more than a Fizeau interferometer's dynamic range could handle. The fringes packed too densely, and phase unwrapping failed.
So the team switched their approach: from a double-pass interferometer to a single-pass configuration using a collimating lens and a Phasics SID4 HR wavefront sensor. SID4 HR doesn't need to interfere a reference beam against a measurement beam, it pulls a wavefront directly from a single pass. Despite the PDM’s large initial aberration and steep local slopes, SID4 HR was able to acquire the wavefront where the Fizeau setup could not converge. The sensor was then used to measure actuator responses during calibration and to provide wavefront data throughout closed-loop operation, with SID4 HR integrated into the team’s custom control system through the Phasics Software Development Kit API.
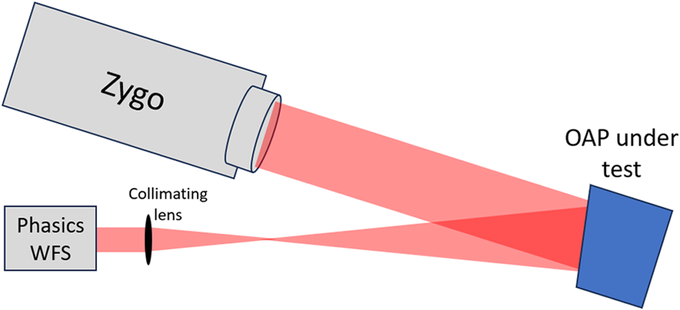
With the unpowered PDM's initial wavefront in hand, the team moved on to testing all 277 actuators one by one.
The first-generation PDM has a 3.125 mm actuator pitch and a 50 mm clear aperture. For each actuator, researchers sent a series of poke commands at different amplitudes, and the SID4 HR captured how the mirror surface responded each time.
From this data, the team worked out how much of the mirror surface each actuator affects, whether command and displacement stayed linear, each actuator's stroke range and hysteresis, and how the response varied across different regions of the mirror.
Once all 277 actuators were characterized, the team assembled their influence functions into a control matrix, recording which part of the mirror each actuator moves and by how much.
They then ran a singular value decomposition to select the surface deformation modes worth controlling, keeping the top 150 for wavefront correction. In closed-loop operation, SID4 HR measures the current wavefront, the control system computes new actuator commands from that measurement, the mirror adjusts, and the process repeats, gradually driving the error down. Unpowered, this first-generation prototype started at 3706 nm RMS of wavefront error.
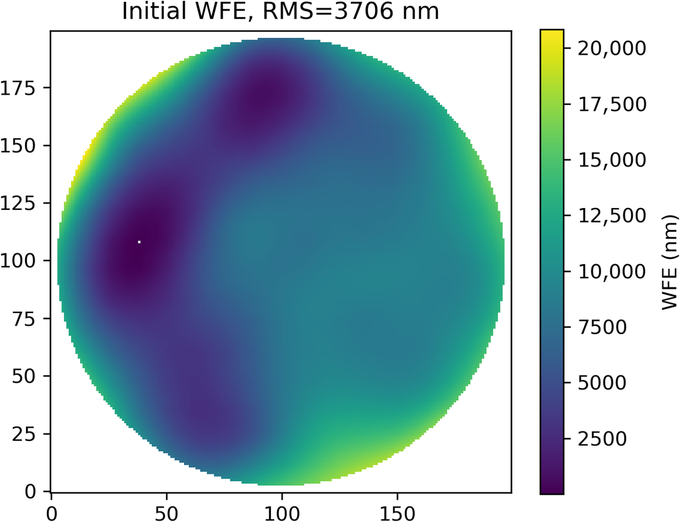
After several closed-loop iterations, the wavefront came down to 164 nm RMS. Some low-order aberration remained in the residual, and faint actuator cross-coupling was visible on the mirror surface. These results have since helped the team map out where this generation's performance limits sit, and they're informing the structural design of the next PDM.
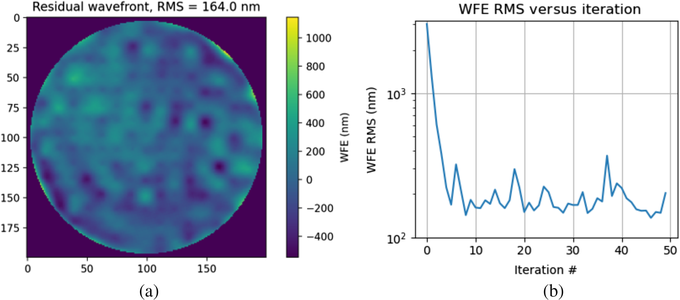
The first-generation PDM uses voice-coil actuators. Driven continuously, they generate heat; the device warms internally, which can cause actuator drift and change the mirror's shape. To check for this, the team ran a dedicated thermal stability test.
Most actuators received a +0.3 normalized drive command, while actuator #120 received a higher +0.95. The Phasics SID4 HR ran continuously for 30 minutes, tracking both the overall mirror shape and the position drift of that one actuator over time.
Actuator #120, driven hardest and drawing the most power, showed the clearest displacement drift. Comparing wavefront data against internal temperature readings, the team found a clear correlation between the two: actuator displacement shifted noticeably as temperature changed. The test gave them a clearer picture of how drive power, internal temperature, and mirror stability relate.
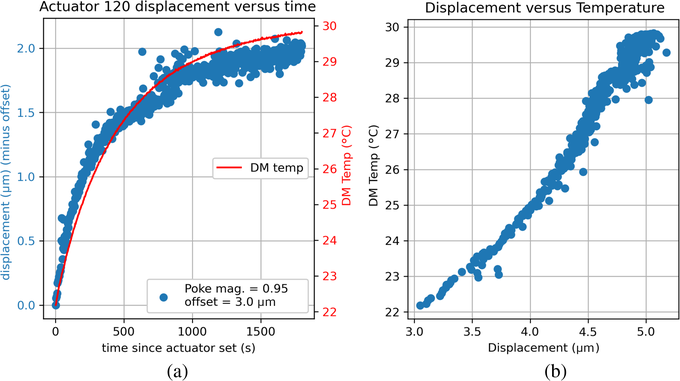
Any wavefront measurement method has to match the actual condition of the device under test. When aberration and local slope are too large, a Fizeau interferometer runs into challenges: the fringes get too dense, and the measurement hits the limits of dynamic range and phase-unwrapping ability.
Phasics SID4 HR, based on QWLSI technology, uses a self-referenced measurement principle with no separate reference arm, enabling a compact single-pass configuration. With 416 × 360 phase sampling, 24 µm spatial resolution, phase resolution below 2 nm RMS, and a dynamic range of up to 500 µm PV, it can measure the PDM’s large initial wavefront error while retaining the sensitivity required to monitor smaller residual variations during closed-loop operation.
Beyond the 632.8 nm single-pass configuration used in this study, Phasics also provides Kaleo Kit modular metrology systems and custom measurement solutions. Depending on the application and optical layout, configurations can be adapted for single- or double-pass measurements, with wavelengths ranging from 193 nm to 3,900 nm and pupil diameters from 8 to 200 mm.
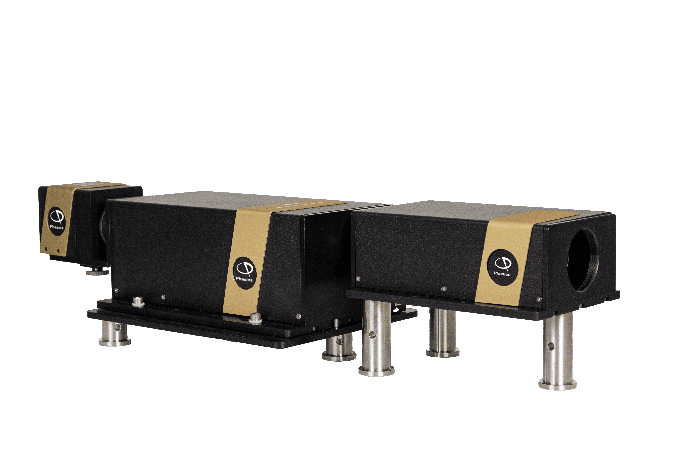
If you're testing or need to control deformable mirrors or other active optical elements, reach out to Phasics (an Exosens company) to discuss a measurement approach suited to your application.
Related content
Event
Hannover.
FROM Mar 09th 2027 TO Mar 12th 2027
DSEI Germany 2027
Financial press release
Oct 27th 2026
9M 2026 Results
Exosens delivers +23.5% revenue growth in Q3 2026
Event
Shanghai.
FROM Mar 08th 2027 TO Mar 10th 2027
Laser world of photonics 2027
Join Exosens at LASER WORLD OF PHOTONICS SHANGHAI from 8 March 2027 to 10 March 2027 in Shanghai, China
Event
Nuremberg.
FROM Mar 01st 2027 TO Mar 03rd 2027
ENFORCE TAC 2027
Join Exosens at SPIE BIOS from 30 January 2027 to 31 January 2027 in San Francisco, USA
Event
Orlando.
FROM Jan 11th 2027 TO Jan 15th 2027
AIAA SciTech 2027
Join Exosens at AIAA SciTech from 11 January 2027 to 15 January 2027 in Orlando, USA
Stay connected
Stay informed and connected to the latest news from Exosens by signing up.
Subscribe
-
Product Types Cameras Detectors & Sensors Image Intensifier Tubes Measurement Systems
-
Applications Analytical Environment Imaging defense Industrial & NDT Laser & Optical Metrology Night vision Nuclear & Radiation Scientific Surveillance
-
Company
EXOSENS ANNONCE LA PUBLICATION DE SON RAPPORT FINANCIER SEMESTRIEL 2026 Communiqué de presse, Mérignac (France), le 28 juillet 2026 – Exosens (EXENS ; FR001400Q9V2), société de haute technologie spécialisée dans les missions et la fourniture de technologies critiques d'amplification, de détection et d'imagerie, annonce avoir déposé auprès de l’Autorité des marchés financiers (AMF) son rapport financier semestriel 2026 relatif au semestre clos le 30 juin 2026. Le rapport financier semestriel 2026 est disponible sur le site internet de la Société à l’adresse suivante : www.exosens.com (Accueil/Investisseurs/Informations réglementées/Rapports financiers).
À propos d'Exosens
Exosens est une entreprise de haute technologie avec plus de 85 ans d'expérience dans l'innovation, le développement, la fabrication et la vente de technologies dans le domaine de la détection, de la photo-détection et de l'imagerie. Aujourd'hui, elle propose à ses clients des détecteurs et des solutions d’imagerie dont des caméras numériques, des détecteurs d’ions, d’électrons, de neutrons et gamma, et des tubes intensificateurs de lumière. Cela permet à Exosens de répondre à des problématiques complexes dans des environnements extrêmement exigeants en proposant des solutions sur-mesure à ses clients. Grâce à ses investissements soutenus, Exosens est reconnu internationalement comme un innovateur majeur en optoélectronique, avec une production et une R&D réalisées sur 12 sites, en Europe et en Amérique du Nord, et plus de 2 000 employés. Exosens est coté sur le compartiment A du marché réglementé d’Euronext Paris (Ticker : EXENS ; ISIN : FR001400Q9V2). Exosens figure sur le segment Euronext Tech Leaders et est par ailleurs inclus dans plusieurs indices, notamment SBF 120, CAC All-Tradable, CAC Mid 60, FTSE Total Cap et MSCI France Small Cap. Pour plus d'informations : www.exosens.com. Relations Investisseurs
Laurent Sfaxi, [email protected]
EXOSENS Domaine de Pelus – Axis Business Park – Bât 5 E 18 Avenue de Pythagore 33700 Mérignac - France
Exosens.com
Exosens triples thermal camera production capacity to support accelerating demand for drone and counter-drone applications
Jul 28th 2026
Markets
Technologies
Shortwave Infrared , Midwave Infrared , Longwave Infrared
Exosens triples thermal camera production capacity to support accelerating demand for drone and counter-drone applications
PRESS RELEASE
MÉRIGNAC, FRANCE – JULY, 28TH 2026
- Exosens plans to triple its thermal camera production capacity in 2026, reinforcing its industrial capabilities in the fastest growing defense markets
- Supporting accelerating demand for compact thermal imaging solutions for seamless integration into next-generation drone and counter-drone systems
- Leveraging Exosens’ UxV market expertise, agile supply chain and scalable industrial capabilities to support leading defense OEMs and autonomous systems developers
Exosens (EXENS; FR001400Q9V2), a high-tech company specializing in mission- and performance-critical amplification, detection and imaging technologies, today announces plans to triple its production capacity for thermal cameras in 2026, in response to accelerating global demand for advanced imaging solutions supporting next-generation drone and counter-drone applications.
The rapid evolution of modern conflicts is reshaping defense priorities, accelerating the deployment of autonomous systems across air, land and maritime domains. Drone and counter-drone systems have become a core pillar of modern warfare, driven by the increasing need for rapidly deployable, mission-ready and cost-efficient defense capabilities that can be fielded at scale.
Exosens' advanced imaging technology portfolio is ideally positioned to address the rapidly evolving operational needs of modern defense operations. Its compact, SWaP-optimized thermal cameras enable seamless integration into drone payloads and counter-drone systems, supporting detection, identification, tracking and targeting of potential threats across a wide range of defense missions.
Leveraging its deep understanding of UxV market requirements, Exosens supports leading defense OEMs and autonomous systems developers throughout the design-in phase. Combined with an agile supply chain and scalable industrial capabilities, the Group enables faster integration and time-to-market, supporting large-scale deployment of next-generation drone and counter-drone systems.
"The tripling of our thermal camera production capacity reflects the accelerating adoption of advanced imaging technologies across drone and counter-drone applications. As autonomous systems continue to reshape modern defense operations, our customers increasingly require compact, cost-effective thermal imaging solutions that can be rapidly deployed into next-generation platforms. This expansion reinforces our ability to support accelerating customer demand with scalable industrial capabilities, while strengthening our position as a trusted, ITAR-free strategic partner for leading defense OEMs and autonomous systems developers. It also reflects our confidence in the long-term structural growth of the drone and counter-drone market", said Jérôme Cerisier, Chief Executive Officer of Exosens.
This announcement complements the previously announced doubling of cooled infrared camera production capacity dedicated to long-range surveillance and counter-drone systems, reinforcing Exosens' ability to address the full spectrum of operational requirements across modern defense.
Download the press release - EN
Investor Relations
Laurent Sfaxi, [email protected]
Media Relations
Brunswick Group, [email protected]
Related content
Event
Hannover.
FROM Mar 09th 2027 TO Mar 12th 2027
DSEI Germany 2027
Financial press release
Oct 27th 2026
9M 2026 Results
Exosens delivers +23.5% revenue growth in Q3 2026
Event
Shanghai.
FROM Mar 08th 2027 TO Mar 10th 2027
Laser world of photonics 2027
Join Exosens at LASER WORLD OF PHOTONICS SHANGHAI from 8 March 2027 to 10 March 2027 in Shanghai, China
Event
Nuremberg.
FROM Mar 01st 2027 TO Mar 03rd 2027
ENFORCE TAC 2027
Join Exosens at SPIE BIOS from 30 January 2027 to 31 January 2027 in San Francisco, USA
Event
Orlando.
FROM Jan 11th 2027 TO Jan 15th 2027
AIAA SciTech 2027
Join Exosens at AIAA SciTech from 11 January 2027 to 15 January 2027 in Orlando, USA
Stay connected
Stay informed and connected to the latest news from Exosens by signing up.
Subscribe
-
Product Types Cameras Detectors & Sensors Image Intensifier Tubes Measurement Systems
-
Applications Analytical Environment Imaging defense Industrial & NDT Laser & Optical Metrology Night vision Nuclear & Radiation Scientific Surveillance
-
Company
Exosens delivers strong performance in H1 2026, driven by sustained momentum in night vision and accelerating demand in defense imaging
Jul 28th 2026
Exosens delivers strong performance in H1 2026, driven by sustained momentum in night vision and accelerating demand in defense imaging
2026 outlook: now expecting to be towards the upper end of the guidance
PRESS RELEASE
MÉRIGNAC, FRANCE – JULY, 28TH 2026
HIGHLIGHTS
- Sustained revenue growth of +15.3% to €253.1 million in H1 2026, including strong LFL growth of +11.4%, driven by accelerating demand for advanced defense imaging and night vision solutions
- Amplification revenue up +11.6%, with strong LFL growth (+10.0%), supported by growing demand for high-performance image intensifier tubes in mission-critical night vision applications
- D&I revenue up +24.3%, with accelerating LFL growth (+14.6%), confirming increasing adoption of Exosens' advanced imaging technologies across Defense & Surveillance markets, particularly in drone and counter-drone applications
- Significant improvement profitability, with adjusted EBITDA of €83.6 million in H1 2026 (+18.3%), representing a new record-high margin of 33.0% (+84Bps vs. H1 2025), driven by strong revenue growth and continued operational excellence
- Net profit from continued operations, excluding the one-off trademark impairment charge , of €35.9 million in H1 2026 (+21.4%); net profit of €15.3 million
- Sound capital structure supporting our growth strategy, with leverage ratio of 1.2x as at 30 June 2026 (vs. 1.3x as at 31 December 2025); strengthened liquidity profile with extended RCF of €200 million and new €140 million EIB financing facility
- Night vision capacity expansion progressing as planned across Europe and the U.S., with first benefits from the European expansion expected from H2 2026; additional production capacity under active evaluation as demand continues to strengthen
- Scaling production capacity for advanced imaging solutions to support accelerating demand across drone, counter-drone and long-range surveillance applications
- Continued disciplined execution of our targeted, value-creating M&A strategy with the acquisition of Emberion, a company specializing in quantum dot-based infrared sensors; proprietary technology complementing Exosens' portfolio and supporting growth opportunities in Defense & Surveillance and Industrial Control markets
OUTLOOK
- Fully on track to deliver on our 2026 guidance: now expecting revenue and adjusted EBITDA to be towards the upper end of their respective ranges
- Revenue in the range of €520 million to €540 million
- Adjusted EBITDA in the range of €168 million to €178 million
- Capital expenditure at around 9% of 2026 revenue (ex. capitalized R&D), driven by production capacity expansion in Europe and the United States
Exosens (EXENS; FR001400Q9V2), a high-tech company focused on providing mission- and performance-critical amplification, detection and imaging technologies, today releases its results for six-month period ended 30 June 2026 .
“Our first-half performance reflects both sustained commercial momentum and disciplined execution, with over +11% like-for-like revenue growth and a record 33% adjusted EBITDA margin. In Amplification, demand for advanced night vision solutions remains strong, while our capacity expansion plan is progressing as expected. We also achieved a key milestone in our U.S. strategy with the award of the U.S. Army BiNOD contract. In Detection & Imaging, we continue to benefit from the growing adoption of our advanced imaging technologies across drone, counter-drone and long-range surveillance applications, contributing to +15% like-for-like growth in the first half. We are also scaling our imaging production capacity to support accelerating customer demand. Beyond Defense & Surveillance, nuclear continues to deliver strong momentum, with increasing investment in next-generation SMR technologies, particularly in the U.S. Looking ahead, we remain fully on track to deliver on our 2026 guidance and now expect both revenue and adjusted EBITDA to be towards the upper end of their respective ranges”, said Jérôme Cerisier, CEO of Exosens.
Key financial indicators
| In € millions | H1 2025 | H1 2026 | Change (%) |
| Revenue | 219.5 | 253.1 | +15.3% |
| Adjusted gross margin | 111.5 | 129.9 | +16.5% |
| As a % of revenue | 50.8% | 51.3% | +53Bps |
| Adjusted EBITDA | 70.6 | 83.6 | +18.3% |
| As a % of revenue | 32.2% | 33.0% | +84Bps |
| Adjusted EBIT | 60.2 | 71.7 | +19.2% |
| As a % of revenue | 27.4% | 28.4% | +92Bps |
| Operating income1 | 49.0 | 59.4 | +21.2% |
| As a % of revenue | 22.3% | 23.5% | +114Bps |
| Net profit from continued operations ex-impairment2 | 29.6 | 35.9 | +21.4% |
| Net profit from continued operations ex. PPA amortization & impairment | 36.2 | 43.9 | +21.4% |
| Net profit | 27.9 | 15.3 | (45.0)% |
| Net profit ex. PPA amortization & impairment | 34.5 | 43.9 | +27.4% |
| Free cash flow | 30.0 | 31.4 | +4.7% |
| Capex-to-sales ratio (%) | 6.7% | 9.2% | +256Bps |
| Net debt3 | 197.7 | 199.8 | +1.0% |
| Leverage ratio (x) | 1.3x | 1.2x | (0.1)x |
| 1 Excluding €(28.2) million non-cash trademark impairment charge. | |||
| 2 Net profit from continued operations excluding €(20.6) million net non-cash impact of trademark impairment. | |||
| 3 Net debt as at 31 December 2025 and as at 30 June 2026. |
Strong H1 2026 revenue performance, driven by accelerating demand across global defense and surveillance markets
| In € millions | H1 2025 | H1 2026 | Change (€m) | Change (%) | LFL (%) |
| Amplification | 157.9 | 176.3 | +18.4 | +11.6% | +10.0% |
| Detection & Imaging | 62.3 | 77.4 | +15.1 | +24.3% | +14.6% |
| Eliminations & Other | (0.7) | (0.6) | +0.1 | nm | nm |
| Total revenue | 219.5 | 253.1 | +33.6 | +15.3% | +11.4% |
The Group's consolidated revenue reached €253.1 million in H1 2026, representing strong growth of +15.3% (+€33.6 million) compared with H1 2025. This performance reflects the contribution from 2025 acquisitions and sustained like-for-like growth of +11.4% year-on-year, mainly driven by accelerating demand for advanced night vision and imaging solutions supporting mission-critical defense and surveillance applications.
AMPLIFICATION
Amplification revenue amounted to €176.3 million (c.70% of Group sales) in H1 2026, up +11.6% (+€18.4 million) compared with H1 2025, driven by higher sales volumes, improved yields and a favorable product mix. Like-for-like growth was also robust, reaching +10.0% in H1 2026.
Global defense markets continued to benefit from sustained structural demand in H1 2026, driven by increasing defense spending and the continued modernization of armed forces, resulting in accelerated procurement of advanced night vision systems. As the world's leading supplier of high-performance, ITAR-free image intensifier tubes, Exosens further strengthened its position as a strategic partner to NATO members and Tier 1 allies, supported by its technological leadership and industrial capabilities.
Commercial momentum remained particularly strong in Europe, supported by the continued execution of major night vision procurement programs, including the OCCAR framework for the German and Belgian armed forces, as well as sustained demand across Eastern and Northern Europe. The adoption of 5G continues to expand, driven by growing demand from special forces across NATO countries.
Against the backdrop of accelerating global demand and with night vision equipment penetration remaining well below end users' target levels over the mid-term, Exosens announced in 2025 an investment plan to expand its production capacity in Europe and the U.S., targeting a 40% increase by 2027. The plan is progressing on schedule, with the first benefits from the European capacity expansion expected from H2 2026.
In the U.S., the rollout of the new manufacturing facility is underway, establishing scalable in-country production capacity to support future growth in the world's largest single night vision market. Underscoring the effectiveness of its industrial strategy, Exosens reached a key milestone with the award of a major IDIQ U.S. Army contract for the development, production and testing of Binocular Night Observation Device (BiNOD). This contract marks a new phase in the Group's U.S. expansion, positioning Exosens as a partner to the U.S. Army while supporting significant long-term growth opportunities in the U.S. defense market.
With demand continuing to strengthen, Exosens is actively evaluating further capacity additions to support growing demand in the night vision market.
DETECTION & IMAGING
Detection & Imaging revenue reached €77.4 million (c.31% of Group sales) in H1 2026, up +24.3% (+€15.1 million) compared with H1 2025. This performance reflects the contribution from 2025 acquisitions (Noxant, Phasics), as well as strong like-for-like growth of +14.6%, supported by sustained demand across the defense and surveillance markets, particularly in drone and counter-drone application, and continued strength in nuclear instrumentation.
Defense & Surveillance
Imaging technologies are becoming central to modern defense operations, driven by two converging trends: (i) the growing adoption of advanced optronic technologies across platform-based applications and (ii) the rapid proliferation of drones and counter-drone systems as a core pillar of modern warfare. Against this favorable backdrop, Exosens is well positioned to capitalize on accelerating market growth through its comprehensive portfolio of advanced imaging solutions. Spanning multi-spectral and multi-domain capabilities, these technologies enable situational awareness, threat detection, identification and tracking, targeting, and long-range observation, enhancing mission effectiveness for defense and surveillance applications.
Commercial momentum continued to accelerate across the fast-growing drone and counter-drone market, driven by increasing adoption of Exosens' imaging technologies by leading OEMs and autonomous systems developers. Underscoring this strong momentum, the Group secured a record order for interceptor drone-based imaging solutions from a major European air defense systems developer, demonstrating its technological leadership in next-generation autonomous defense systems. Exosens leverages its deep understanding of the UxV market requirements and its ability to support customers throughout the design-in phase, enabling faster time-to-market. This is further reinforced by agile supply chain and scalable production capacity, enabling rapid response to accelerating demand.
Surveillance markets continued to benefit from increasing investments in homeland security and counter-drone capabilities amid rising sovereignty concerns and the growing threat of land and airborne incursions. Demand remained strong, particularly for advanced imaging solutions enabling long-range surveillance and counter-drone operations, with Exosens' technologies increasingly adopted by leading OEMs and system integrators.
To support this accelerating demand, the Group is doubling its production capacity for cooled infrared cameras in 2026, highlighting its ability to anticipate rapidly evolving market requirements and scale production capacity to meet growing demand.
Commercial Markets
In Nuclear, commercial momentum remained strong, with growing demand for advanced detectors and instruments. The nuclear market continues to benefit from rising needs for carbon-free energy, due to the rapid expansion and unprecedented power requirements of AI-enabled data centers, reinforcing long-term investment in SMR-specific technologies. Recent developments in the U.S., including key milestones achieved under the Department of Energy's Reactor Pilot Program, confirm the accelerating deployment of next-generation nuclear technologies. These achievements are expected to translate into pre-series production orders in the near term and support long-term demand for Exosens' advanced nuclear instrumentation solutions, particularly across SMR applications.
In Industrial Control, market conditions improved, showing early signs of recovery. The accelerating deployment of AI infrastructure is expected to drive renewed investment in semiconductor manufacturing and advanced industrial automation, supporting demand for high-performance imaging technologies used in semiconductor inspection, machine vision, and real-time process monitoring. Exosens is well positioned to benefit from these trends through its cutting-edge portfolio of infrared, UV and wavefront sensing technologies.
In Life Sciences, global uncertainty continued to weigh on scientific research and demand for microscopy components, while inventory drawdowns in mass spectrometry seem to be nearing completion after having temporarily softened demand for advanced detectors. Despite these temporary headwinds, market fundamentals remain favorable, driven by the transition toward higher-performance mass spectrometry systems and increased R&D investments in next-generation life sciences applications, supporting long-term demand for Exosens' advanced detection solutions.
M&A
On 24 April 2026, Exosens completed the acquisition of Emberion, a Finland- and UK-based company specializing in the design and manufacturing of innovative infrared sensors leveraging patented quantum dot imaging technology. This acquisition strengthens Exosens’ position as a leading provider of advanced imaging solutions, with the addition of emerging quantum dot-based short-wave infrared sensors, supporting new growth opportunities in the high-resolution defense and surveillance markets, particularly for portable and drone-based imaging systems, as well as in industrial control applications such as semiconductor inspection.
Adjusted gross margin up +16.5% in H1 2026
| H1 2025 | H1 2026 | Change | ||||
| In €m | % of sales | In €m | % of sales | In €m | In % | |
| Amplification | 81.2 | 51.5% | 92.6 | 52.5% | +11.4 | +14.0% |
| Detection & Imaging | 30.3 | 48.7% | 37.2 | 48.1% | +6.9 | +22.8% |
| Eliminations & Other | (0.1) | nm | 0.1 | nm | +0.1 | nm |
| Adjusted gross margin | 111.5 | 50.8% | 129.9 | 51.3% | +18.4 | +16.5% |
The Group's adjusted gross margin reached €129.9 million in H1 2026, up +16.5% (+€18.4 million) compared with €111.5 million in H1 2025. As a percentage of sales, adjusted gross margin increased by +53 basis points to 51.3% in H1 2026 (versus 50.8% in H1 2025).
The Amplification segment's adjusted gross margin amounted to €92.6 million in H1 2026, up +14.0% (+€11.4 million) compared with H1 2025. Margin rate increased by +109 basis points to 52.5% in H1 2026 (versus 51.5% in H1 2025), driven by increased sales volumes, improved yields and a favorable product mix.
The Detection & Imaging segment's adjusted gross margin amounted to €37.2 million in H1 2026, up +22.8% (+€6.9 million) compared with H1 2025. Margin rate decreased by (60) basis points to 48.1% in H1 2026 (versus 48.7% in H1 2025). This margin decline reflects a less favorable product mix, driven by lower sales of high-margin life sciences detectors.
Record-high profitability driven by strong operational execution in H1 2026
Exosens delivered further profitability improvement in H1 2026, achieving record-high margins and strengthening its best-in-class profitability profile. This performance was driven by higher sales volumes, continued yield improvement and a favorable product mix.
Adjusted EBITDA reached €83.6 million in H1 2026, up +18.3% (+€12.9 million) compared with €70.6 million in H1 2025. As a result, adjusted EBITDA margin increased by +84 basis points to 33.0% in H1 2026 (versus 32.2% in H1 2025), reaching a record-high level for the Group, driven by sustained revenue growth and continued operational excellence.
Adjusted EBIT amounted to €71.7 million in H1 2026, up +19.2% (+€11.5 million) compared with €60.2 million in H1 2025. As a result, adjusted EBIT margin rose by +92 basis points to 28.4% in H1 2026 (versus 27.4% in H1 2025).
Excluding a €(28.2) million non-cash trademark impairment charge recognized in connection with the Group's rebranding under the single Exosens brand, operating income amounted to €59.4 million in H1 2026, up +21.2% (+€10.4 million) compared with €49.0 million in H1 2025. As a result, the Group's operating margin increased by +114 basis points to 23.5% in H1 2026 (versus 22.3% in H1 2025).
Net profit from continued operations ex-impairment of €35.9 million in H1 2026
Excluding €(20.6) million net non-cash impact of trademark impairment , the Group's posted a net profit from continued operations of €35.9 million in H1 2026, up by +21.4% (+€6.3 million) compared with €29.6 million in H1 2025. On a reported basis, net profit was €15.3 million in H1 2026 compared with €27.9 million in H1 2025.
Robust free cash flow generation despite increased growth capex in H1 2026
Exosens generated free cash flow of €31.4 million in H1 2026 compared with €30.0 million in H1 2025. The strong increase in the Group's adjusted EBITDA was partly offset by higher growth capital expenditure related to the ongoing implementation of its production capacity expansion plan. The Group also maintained disciplined working capital management despite strong revenue growth, leading to an improvement in working capital days of sales.
Sustained R&D investment in H1 2026, supporting technology leadership
Gross R&D expenses reached €20.1 million (7.9% of sales) in H1 2026, up +18.0% (+€3.1 million) compared with H1 2025. The Group continued its sustained investment in R&D to foster innovation and strengthen its technological leadership, focusing on advanced night vision, detection and imaging solutions addressing evolving customer needs across Defense & Surveillance, Industrial Control, Life Sciences and Nuclear markets. These innovations are expected to support future growth, while reinforcing Exosens' leading technology position.
Accelerated investment in production capacity in H1 2026
Capital expenditure (excluding capitalized R&D expenses) amounted to €23.3 million (9.2% of sales) in H1 2026, up +59.6% (+€8.7 million) compared with H1 2025. Growth capex was €18.7 million (7.4% of sales) in H1 2026, representing an increase of +98.6% compared with H1 2025, driven by investment in plant infrastructure works and additional equipment in the Group's light amplification factories. Maintenance capex was €4.7 million (1.8% of sales) in H1 2026, focused on productivity-enhancing projects, driving future margin expansion.
Sound balance sheet, supporting our growth strategy
Net financial debt stood at €199.8 million as at 30 June 2026 compared with €197.7 million as at 31 December 2025. Accordingly, the leverage ratio reached 1.2x as at 30 June 2026 compared with 1.3x as at 31 December 2025, providing the Group with ample financial flexibility to support its long-term growth strategy.
The Group also maintained a strong liquidity position, with €68.8 million in cash and cash equivalents as at 30 June 2026. During the period, Exosens reinforced its funding resources through the extension of its Revolving Credit Facility (RCF) from €100 million to €200 million, with improved financial terms, and by securing a new €140 million financing facility with the European Investment Bank (EIB).
2026 outlook: Now expecting to be towards the upper end of guidance
Building on sustained commercial momentum, particularly in the Defense and Surveillance markets, and strong operational execution, Exosens remains fully on track to deliver on its 2026 guidance and now expects revenue and adjusted EBITDA to be towards the upper end of their respective ranges:
• Revenue in the range of €520 million to €540 million;
• Adjusted EBITDA in the range of €168 million to €178 million.
In addition, the Group intends to continue implementing its investment plan aimed at expanding production capacity by 40% by 2027, both in Europe and the United States, to meet strong demand, while continuing its efforts to improve productivity. In this context, the Group expects capital expenditure to represent around 9% of 2026 revenue (excluding capitalized R&D expenses, expected at around 3% of revenue).
Webcast
Jérôme Cerisier, CEO and Quynh-Boi Demey, CFO will hold a conference call and webcast to discuss Exosens’ First-Half 2026 results on Tuesday, 28 July 2026 at 9:00 a.m. CEST. This presentation will be followed by a Q&A session and can be accessed via the following link:
https://exosens.engagestream.euronext.com/2026-half-year-results.
The press release and the presentation will be available in the Investor Relations section on Exosens’ website at www.exosens.com/investors
Download the full press release - EN
Financial Calendar:
- 27/10/2026: 9M 2026 revenue & adjusted gross margin (before market opening).
Investor Relations
Laurent Sfaxi, [email protected]
Media Relations
Brunswick Group, [email protected]
Related content
Event
Hannover.
FROM Mar 09th 2027 TO Mar 12th 2027
DSEI Germany 2027
Financial press release
Oct 27th 2026
9M 2026 Results
Exosens delivers +23.5% revenue growth in Q3 2026
Event
Shanghai.
FROM Mar 08th 2027 TO Mar 10th 2027
Laser world of photonics 2027
Join Exosens at LASER WORLD OF PHOTONICS SHANGHAI from 8 March 2027 to 10 March 2027 in Shanghai, China
Event
Nuremberg.
FROM Mar 01st 2027 TO Mar 03rd 2027
ENFORCE TAC 2027
Join Exosens at SPIE BIOS from 30 January 2027 to 31 January 2027 in San Francisco, USA
Event
Orlando.
FROM Jan 11th 2027 TO Jan 15th 2027
AIAA SciTech 2027
Join Exosens at AIAA SciTech from 11 January 2027 to 15 January 2027 in Orlando, USA
Stay connected
Stay informed and connected to the latest news from Exosens by signing up.
Subscribe
-
Product Types Cameras Detectors & Sensors Image Intensifier Tubes Measurement Systems
-
Applications Analytical Environment Imaging defense Industrial & NDT Laser & Optical Metrology Night vision Nuclear & Radiation Scientific Surveillance
-
Company
Choosing the Right Approach for Your Application
Jul 22nd 2026
Markets
Industrial Control , Defense & Surveillance
Technologies
Cooled and Uncooled Infrared Cameras: Choosing the Right Approach for Your Application
Introduction
Infrared cameras have become essential tools across a wide range of industries, from defense and surveillance to industrial inspection. Unlike conventional cameras that capture visible light, thermal imaging systems detect infrared radiation emitted by objects, as well as scenes or phenomena that are only visible in the infrared spectrum. In some applications, the infrared part of the spectrum is also selected because it provides specific properties of interest, such as thermal contrast, material signatures, or improved visibility in challenging conditions.
Within this field, two main types of technologies exist: cooled and uncooled infrared cameras. Each is built around a different sensing approach, offering distinct advantages depending on the application. Understanding how they work, and where each fit, helps users select the right solution for their specific operational needs.
What Is a Cooled Infrared Camera?
A cooled infrared camera uses a sensor that is maintained at very low temperatures through a built-in cooling system, often referred to as a cryocooler. This cooling reduces thermal noise generated by the sensor itself, enabling the camera to detect extremely small variations in infrared radiation.
By lowering the detector temperature well below ambient levels, these systems achieve very high sensitivity. This allows them to distinguish subtle temperature differences and detect objects at long distances, even when contrast between the target and its background is minimal. This extreme sensitivity can also support the use of longer focal-length optics and slower optical systems, which is especially valuable when an application requires extended range, narrow fields of view, or detailed observation of low-contrast targets.
Cooled infrared cameras also feature fast exposure time and global shutter sensor architecture, enabling the observation and tracking of high-speed targets, preserving image sharpness and detail even during rapid motion.
For applications requiring this level of performance, Exosens offers dedicated cooled infrared camera platforms, designed to support long-range detection, high-speed imaging, and precise thermal measurements. These platforms are suited to demanding use cases where sensitivity, image quality, acquisition speed, and optical flexibility are decisive selection criteria.
What Is an Uncooled Infrared Camera?
In contrast, uncooled infrared cameras operate at or near ambient temperature and do not require any cryogenic cooling system. Most of these cameras rely on microbolometer sensors, which detect infrared radiation by measuring small changes in temperature across an array of pixels.
A microbolometer works by absorbing incoming infrared energy, causing a slight temperature change in each pixel. This change alters the electrical resistance of the material, which is then converted into a measurable signal and processed into a thermal image.
Exosens also offers uncooled LWIR infrared cameras, for applications where compact design, robust operation, power efficiency, and cost efficiency are key considerations. Integration is not a determining limitation: Exosens infrared cameras are designed to be easy to integrate, allowing system developers to focus on the application requirements, optical configuration, and overall benefit-to-cost balance.
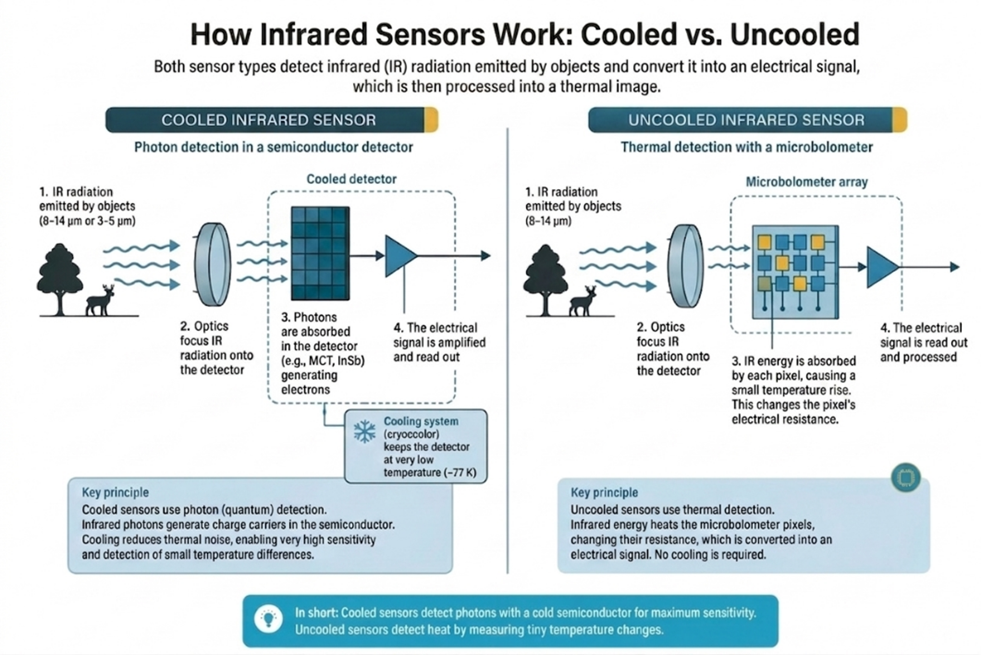
Key Differences
The main differences between cooled and uncooled infrared cameras come down to performance, system architecture, and operational trade-offs.
Cooled infrared cameras offer higher sensitivity, detecting small temperature differences for long-range and detailed analysis, while supporting faster response, advanced measurement capabilities, and improved image clarity in low-contrast conditions.
Uncooled infrared cameras provide reliable performance for many applications, offering sufficient sensitivity for general detection, stable operation, compactness, and consistent image quality across typical conditions. They often represent the most practical choice when deployment constraints, power consumption, size, and cost are central to the system design.
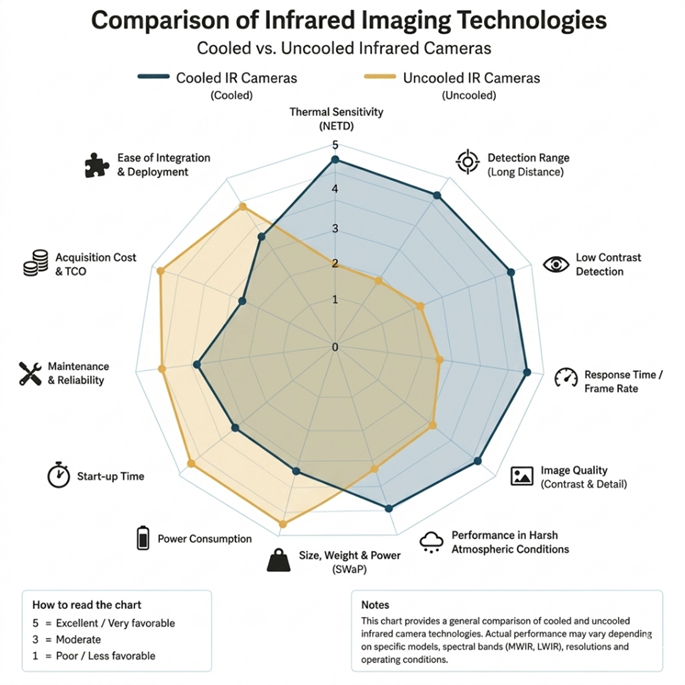
Typical Application Areas
The choice between cooled and uncooled technologies depends largely on the application rather than performance alone.
Cooled infrared cameras are typically used in demanding scenarios that require high sensitivity and long-range detection, such as long-range surveillance, target tracking, high-speed thermal events, advanced scientific measurements, or applications where subtle temperature variations must be resolved.
Uncooled infrared cameras are widely used in industrial and commercial environments. Common applications include thermal inspection, predictive maintenance, firefighting, security monitoring, and drone-based surveillance and inspection. Their compact size, lower power needs, and attractive cost profile make them well suited for portable devices, aerial platforms, embedded systems, and large-scale deployment.
In many cases, the decision is best framed as a benefit-to-cost balance. Uncooled systems can provide the right level of performance with simpler operation and lower system burden, while cooled systems are selected when mission requirements justify the additional complexity and investment. Exosens experts can help assess these trade-offs and guide users toward the most suitable technology for their application.
Choosing the Right Infrared Technology
Selecting the right infrared camera depends on several factors, including the level of performance required, the operating environment, target characteristics, optical architecture, and system constraints such as size, power, cost, and integration roadmap.
If the application demands high sensitivity, long detection range, fast response, or low-noise imaging, a cooled system may be necessary. For applications where size, power efficiency, simpler operation, and cost are key considerations, uncooled LWIR cameras such as the Ceres and XP Series ranges are often the preferred choice.
Ultimately, the decision should not rely on specifications alone, but on how the camera will perform within the complete system and mission context.
Avoiding Mis-Selection: Why Expertise Matters
Choosing between cooled and uncooled technologies is not simply a matter of performance comparison, it requires a clear understanding of operational priorities, system constraints, and long-term deployment goals. A mis-selection can lead to unnecessary complexity, increased costs, or insufficient performance in critical conditions.
With extensive experience across defense, industrial, and scientific applications, Exosens supports system designers and integrators in evaluating these trade-offs. By aligning technology capabilities with real-world use cases, Exosens helps ensure that each solution delivers the expected performance, reliability, and value.
For applications where the balance is not immediately clear, engaging with experts early in the design process can help reduce risk and secure the right technological choice.
To discuss your requirements, you can contact our specialists for cooled infrared solutions at [email protected]
and for uncooled solutions at [email protected]
Related content
Event
Hannover.
FROM Mar 09th 2027 TO Mar 12th 2027
DSEI Germany 2027
Financial press release
Oct 27th 2026
9M 2026 Results
Exosens delivers +23.5% revenue growth in Q3 2026
Event
Shanghai.
FROM Mar 08th 2027 TO Mar 10th 2027
Laser world of photonics 2027
Join Exosens at LASER WORLD OF PHOTONICS SHANGHAI from 8 March 2027 to 10 March 2027 in Shanghai, China
Event
Nuremberg.
FROM Mar 01st 2027 TO Mar 03rd 2027
ENFORCE TAC 2027
Join Exosens at SPIE BIOS from 30 January 2027 to 31 January 2027 in San Francisco, USA
Event
Orlando.
FROM Jan 11th 2027 TO Jan 15th 2027
AIAA SciTech 2027
Join Exosens at AIAA SciTech from 11 January 2027 to 15 January 2027 in Orlando, USA
Stay connected
Stay informed and connected to the latest news from Exosens by signing up.
Subscribe
-
Product Types Cameras Detectors & Sensors Image Intensifier Tubes Measurement Systems
-
Applications Analytical Environment Imaging defense Industrial & NDT Laser & Optical Metrology Night vision Nuclear & Radiation Scientific Surveillance
-
Company
Crosstalk Limits in Multifocal Parallel Femtosecond Direct Laser Writing: Decoherence Strategies and Quantitative Validation of Nanostructure Optical Phase
Jul 07th 2026
Markets
Technologies
Crosstalk Limits in Multifocal Parallel Femtosecond Direct Laser Writing: Decoherence Strategies and Quantitative Validation of Nanostructure Optical Phase
Crosstalk in Multifocal Parallel Direct Writing
In the field of ultrafast laser micro/nanofabrication, femtosecond laser direct writing relies on nonlinear absorption mechanisms to achieve highly localized structural modification inside transparent materials. This capability has led to widespread use in the fabrication of three-dimensional optical structures, functional devices, and phase-modulating elements.
As processing schemes move from single-focus, point-by-point writing to multifocal parallel fabrication, system behavior becomes considerably more complex. A growing body of recent research shows that under high numerical aperture (NA) focusing and high structural density, the superposition and mutual interaction of light fields at multiple foci can have a non-negligible effect on processing outcomes. In single-focus femtosecond laser processing, the nonlinear threshold effect allows the modified region to be significantly smaller than the linear diffraction limit. In multifocal parallel processing, however, the spatial proximity of adjacent foci introduces additional field-coupling effects. Prior studies have indicated that this coupling can arise from spatial coherent interference between foci as well as from sequential or quasi-sequential exposure processes. Under high-NA focusing conditions, these effects tend to manifest as localized variations in energy distribution and non-uniform structural morphology, thereby limiting the minimum feature spacing that can be achieved.
Decoherent Parallel Direct Writing and Quantitative Validation of Optical Phase
A recent study published in Nature Communications presents an engineering-level solution to the long-standing challenge of limited structural density in multifocal parallel femtosecond laser processing. Combining experimental and theoretical analysis, the study shows that once the spacing between adjacent foci enters the sub-wavelength regime, spatial coherent interference and temporal sequencing effects give rise to pronounced processing crosstalk, resulting in non-uniform structural morphology and constraining the minimum achievable feature spacing.
To mitigate these effects, the research team proposed a De-coherent Parallel Direct Laser Writing (Dc-PDLW) strategy. This approach uses light-field engineering to control the coherence relationships among multiple foci.
Specifically, the researchers employed a non-iterative Stripe Segmentation Phase (SSP) hologram to generate the multifocal light field, avoiding the wavefront disorder that iterative algorithms tend to introduce under high-NA focusing conditions. A Binary Mask (BM) was then introduced to spatially partition the foci into separate zones, each assigned an orthogonal polarization state, thereby suppressing interference between neighboring foci.
Experimental results in sapphire crystal demonstrate double-pore spacing of approximately 300 nm (λ/4) using this method. Under identical laser parameters (224 fs, 450 nJ) used for comparison, the average double-pore spacing achieved with an iterative algorithm and with conventional point-by-point writing was approximately 545 nm and 601 nm, respectively, while the SSP-BM approach achieved an average spacing of approximately 321 nm, with a minimum observed spacing of 292 nm.
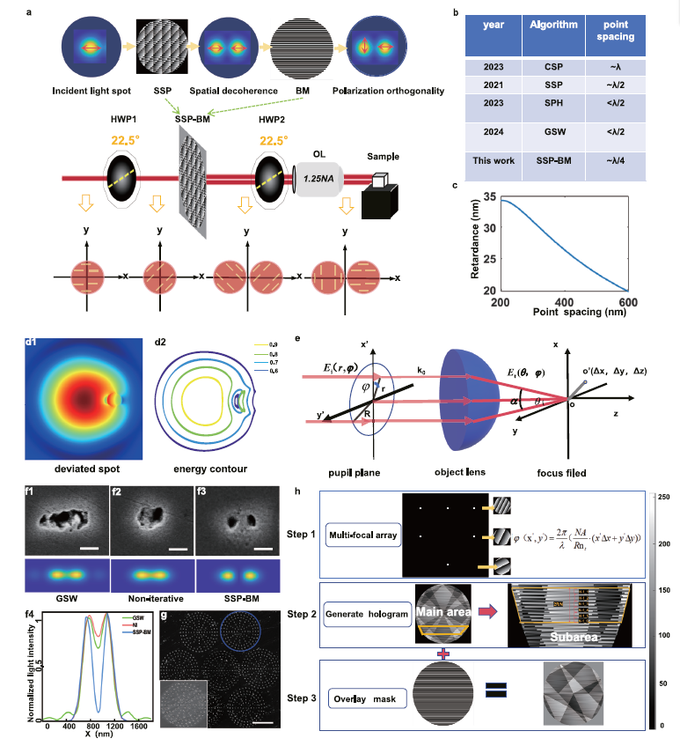
Figure 1 | Schematic of the De-coherent Parallel Direct Laser Writing (Dc-PDLW) method and processing results. The SSP-BM decoherent holographic design generates a multifocal light field, enabling parallel fabrication of sub-300 nm double-pore structures, compared against conventional algorithms. (Image source: Jiang et al., Nature Communications, 2026)
How can one confirm that these structures actually modify the light field as intended? After fabrication, the research team went on to measure the optical phase differences induced by the nanostructures. A Phasics SID4 wavefront sensor was introduced for this purpose. Leveraging its high-resolution quantitative phase imaging capability, the researchers measured the phase modulation induced by nanostructures with different spacing in a single acquisition.
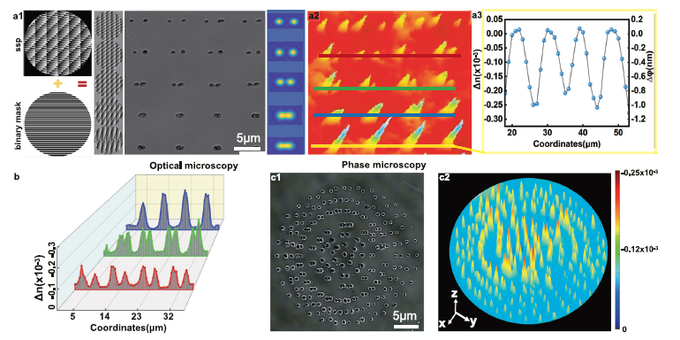
Figure 2 | Optical phase difference and refractive index modulation measurements under different double-pore spacing conditions, showing the effect of structural density on birefringent response. (Image source: Jiang et al., Nature Communications, 2026)
As the double-pore spacing decreased, the measurements showed a progressive increase in structure-induced refractive index modulation and birefringent retardance. By directly measuring wavefront phase with the SID4, the study not only validated the geometric changes in the fabricated structures but also observed their corresponding optical response, providing experimental evidence linking structural design to actual optical behavior.
In multifocal parallel processing systems, the value of wavefront measurement lies not in replacing light-field design, but in providing a quantifiable reference throughout the experimental process. This includes evaluating the consistency of multifocal light fields, identifying local phase variations introduced by processing algorithms, and providing verifiable feedback during parameter optimization, all of which make complex light-field experiments more controllable. Because the SID4 captures complete wavefront information in a single exposure, it allows researchers to directly correlate fabricated structures with their optical phase response, which is of practical significance for research into complex light-field engineering.
For related experimental needs or technical consultations, feel free to contact the Phasics team.
Reference
Reference: Jiang Z. et al., De-coherent parallel laser processing of ultradense nanopores for high-density, large-area 3D optical phase encoding, Nature Communications (2026).
Related content
Event
Hannover.
FROM Mar 09th 2027 TO Mar 12th 2027
DSEI Germany 2027
Financial press release
Oct 27th 2026
9M 2026 Results
Exosens delivers +23.5% revenue growth in Q3 2026
Event
Shanghai.
FROM Mar 08th 2027 TO Mar 10th 2027
Laser world of photonics 2027
Join Exosens at LASER WORLD OF PHOTONICS SHANGHAI from 8 March 2027 to 10 March 2027 in Shanghai, China
Event
Nuremberg.
FROM Mar 01st 2027 TO Mar 03rd 2027
ENFORCE TAC 2027
Join Exosens at SPIE BIOS from 30 January 2027 to 31 January 2027 in San Francisco, USA
Event
Orlando.
FROM Jan 11th 2027 TO Jan 15th 2027
AIAA SciTech 2027
Join Exosens at AIAA SciTech from 11 January 2027 to 15 January 2027 in Orlando, USA
Stay connected
Stay informed and connected to the latest news from Exosens by signing up.
Subscribe
-
Product Types Cameras Detectors & Sensors Image Intensifier Tubes Measurement Systems
-
Applications Analytical Environment Imaging defense Industrial & NDT Laser & Optical Metrology Night vision Nuclear & Radiation Scientific Surveillance
-
Company
PRESS RELEASE MÉRIGNAC, FRANCE – 1 JULY 2026
MONTHLY INFORMATION ON THE TOTAL NUMBER OF SHARES AND VOTING RIGHTS IN THE SHARE CAPITAL In accordance with articles L. 233-8 II of the French Commercial Code and 223-16 of the General Regulations of the French Autorité des Marchés Financiers ISIN code: FR001400Q9V2
Date
Total number of shares
Total number of voting rights
30/06/2026
50,936,749
Number of theoretical voting rights: 60,823,154 Number of exercisable voting rights*: 60,557,281
- After deduction of treasury shares without voting rights.
Prompts
Click prompts to add them under the company line, click again to take one out, then copy the result into your AI chat. Shared by Asian Century Stocks and Uncovered Thai Stocks. Thank you.
ETFs Holding Exosens
Exchange-traded funds whose newest published daily portfolio holds one of the company's listings, largest weight first.
| ETF | Weight in ETF | Shares | Market value | As of |
|---|---|---|---|---|
| AVDS | 0.08% | 5,363 | $ 301.785K | Nov 16, 2026 |
| DFIS | 0.04% | 40,936 | $ 2.369M | Nov 12, 2026 |
| DFAI | 0.01% | 26,119 | $ 1.512M | Nov 12, 2026 |
| DFSI | 0.01% | 1,664 | $ 96.308K | Nov 12, 2026 |
| DFIC | 0.01% | 18,771 | $ 1.086M | Nov 12, 2026 |
| DFAX | 0.00% | 3,958 | $ 229.08K | Nov 12, 2026 |
| AVDE | 0.00% | 1,818 | $ 102.302K | Nov 16, 2026 |