October 28, 2026 at 1:59 AM EDT Supporting Materials: Dassault Systèmes: Strong Q3 performance with improved FY26 objectives and a st… Press Release VELIZY-VILLACOUBLAY, France—October 28, 2026 Dassault Systèmes: Strong Q3 performance****with…
October 28, 2026 at 1:59 AM EDT
Supporting Materials:
Dassault Systèmes: Strong Q3 performance with improved FY26 objectives and a st…
Press Release
VELIZY-VILLACOUBLAY, France—October 28, 2026
Dassault Systèmes: Strong Q3 performance****with improved FY26 objectives and a step change in Life Sciences
Dassault Systèmes (Euronext Paris: FR0014003TT8, DSY.PA) today reports its IFRS unaudited estimated financial results for the third quarter 2026 and nine months ended September 30, 2026. The Group’s Board of Directors approved these estimated results on October 27, 2026. This press release also includes financial information on a non-IFRS basis and reconciliations with IFRS figures in the Appendix.
Summary Highlights****1
(Third quarter 2026 unaudited, non-IFRS, operating cash flow in IFRS,
all growth rates in constant currencies, unless otherwise noted)
-
Total revenue and software revenue up 5% in 3Q26, at the high end of our objectives, with ARR consistent growth of 6%, underscoring the traction of our recurring business
-
3DEXPERIENCE software revenue up 25% and cloud software revenue up 14%
-
Operating margin up 150 bps at 31.6%, and diluted EPS up 8% at €0.32, above our objectives
-
Operating cash flow up 20% year-to-date, supported by strong cash conversion of 111%, compared to 97% last year
-
Completion of ArisGlobal acquisition and appointment of Dr. Ashwini Zenooz as Executive Vice President and CEO, Life Sciences & Healthcare
-
Improving full-year objectives: new revenue range of €6.399 - €6.459 billion, reflecting 4% to 5% growth, from previous range of 3% to 5%. Raising operating margin range to 32.5% - 32.7%, and EPS growth range to 6% - 7%. This includes ArisGlobal contribution.
Dassault Systèmes’ Chief Executive Officer and Chairman of the Board Commentary
Pascal Daloz, Dassault Systèmes’ Chief Executive Officer and Chairman of the Board, commented:
“In the third quarter, we delivered strong execution against our strategic priorities, with broad-based momentum across industries and continued growth across our 3DEXPERIENCE platform and cloud businesses. This performance reflects the strength of our strategy and the growing relevance of our solutions, enabling us to improve our FY2026 objectives while advancing our long-term ambitions.
Industries are undergoing a fundamental transformation: they are becoming AI-native. AI is moving beyond individual features to become integral to how products are designed, tested and brought to life. The next industrial revolution will not be defined by AI alone, but by how intelligence connects the virtual and physical worlds. Through our 3D UNIV+RSES, we bring together science, industrial knowledge and AI to create Industry World Models and Virtual Twins at scale, enabling industries to anticipate outcomes and validate decisions in virtual worlds before acting in the physical world.
In Life Sciences, the completion of the ArisGlobal acquisition marks a major milestone in connecting the journey from molecule to patient and back to science. With Dr. Ashwini Zenooz joining Dassault Systèmes to lead our Life Sciences ambition, we are bringing together capabilities across the product lifecycle to accelerate scientific discovery, advance innovation and ultimately improve patient outcomes.
We will share more at our Capital Markets Day on November 17. We are building the virtual worlds that will enable industries to imagine the future, invent new possibilities and turn them into reality.”
Dassault Systèmes’ Chief Financial Officer Commentary
(operating margin, operating cash flow and diluted EPS (“EPS”) growth rates in constant currencies, data on a non-IFRS basis, operating cash flow in IFRS,
data for the third quarter, unless otherwise noted)
Rouven Bergmann, Dassault Systèmes’ Chief Financial Officer, commented:
“Q3 was a solid quarter on broad-based performance. Revenue grew 5%, at the top of our objectives, and ARR grew 6%, confirming the shift to subscription, cloud and 3DEXPERIENCE. Across our geographies, Asia was excellent, led by China, and Europe was healthy. The Americas executed well, but growth was impacted by a tough year-over-year comparison.
Productivity drove results above our objectives: operating income up 10%, margin up 150 basis points, EPS up 8%. These earnings turned into strong cash generation, with operating cash flow up 20% and cash conversion of 111% both on a year-to-date basis.
By product line, Industrial Innovation delivered solid results driven by 3DEXPERIENCE, and Mainstream Innovation kept its momentum through CENTRIC and SOLIDWORKS. In Life Sciences, we reached two important milestones: MEDIDATA improved sequentially and is on track to deliver growth from Q4 onwards, and we completed the ArisGlobal acquisition in the second half of September.
With improved visibility, we are confident in our full-year objectives. We are narrowing 2026 revenue growth to 4 to 5% and raising our operating margin and EPS objectives. For the fourth quarter, we expect 5 to 8% revenue growth, this includes ArisGlobal, adding 2 points of growth.”
Financial Summary
| In millions of Euros, except per share data and percentages | | IFRS | | IFRS |
| | Q3 2026 | Q3 2025 | Change | Change in constant currencies | | YTD 2026 | YTD 2025 | Change | Change in constant currencies |
| Total Revenue | | 1,551.9 | 1,460.1 | 6% | 5% | | 4,617.0 | 4,554.7 | 1% | 4% |
| Software Revenue | | 1,393.5 | 1,313.7 | 6% | 5% | | 4,169.0 | 4,119.2 | 1% | 4% |
| Operating Margin | | 20.9% | 20.7% | +0.3pt | | | 22.3% | 18.6% | +3.7pts | |
| Diluted EPS | | 0.22 | 0.20 | 8% | | | 0.66 | 0.57 | 16% | |
| In millions of Euros, except per share data and percentages | | Non-IFRS | | Non-IFRS |
| | Q3 2026 | Q3 2025 | Change | Change in constant currencies | | YTD 2026 | YTD 2025 | Change | Change in constant currencies |
| Total Revenue | | 1,551.9 | 1,461.5 | 6% | 5% | | 4,617.4 | 4,557.6 | 1% | 4% |
| Software Revenue | | 1,393.5 | 1,315.1 | 6% | 5% | | 4,169.5 | 4,122.1 | 1% | 4% |
| Operating Margin | | 31.6% | 30.1% | +1.5pts | | | 30.6% | 30.1% | +0.5pt | |
| Diluted EPS | | 0.32 | 0.29 | 10% | 8% | | 0.93 | 0.91 | 3% | 7% |
Third Quarter 2026 Versus 2025 Financial Comparisons
(unaudited, IFRS and non-IFRS unless otherwise noted,
all revenue growth rates in constant currencies)
-
Total Revenue: Total revenue in the third quarter grew 5% to €1.55 billion, and software revenue rose 5% to €1.39 billion. Subscription & support revenue rose 3%; recurring revenue represented 84% of software revenue. Licenses and other software revenue were up 14% to €219 million. Services revenue increased 7% to €158 million.
-
ARR: In the third quarter, ARR grew 6% year-over-year to reach €4.50 billion on a constant currency basis2, reflecting the continued strengthening of our business model.
-
Software Revenue by Geography: Asia (23% of software revenue) was up 12%, delivering a strong quarter across regions, led by China with double-digit growth. Aerospace and High-Tech showed good momentum. Europe (38% of software revenue) grew 10% in IFRS and 9% in non-IFRS, underscoring a strong quarter despite weakness in Central and Southern Europe. The region saw broad-based performance across industries driven by 3DEXPERIENCE adoption. The Americas (39% of software revenue revenue) decreased 3% on a strong baseline, which masked healthy growth in Home & Lifestyle, High-Tech, and Industrial Equipment. In addition, Life Sciences improved this quarter.
-
Software Revenue by Product Line:
-
Industrial Innovationsoftware revenue was up 5% to €753 million, with solid performance from 3DEXPERIENCE and Cloud, ENOVIA leading the momentum.
-
Mainstream Innovation software revenue increased by 8% to €375 million. SOLIDWORKS delivered solid broad-based growth and CENTRIC building momentum with new client wins.
-
Life Sciences & Healthcaresoftware revenue was up 1% to €266 million. MEDIDATA delivered flat growth, improving sequentially, with bookings continuing to accelerate ARR growth. This quarter reached a key milestone with the acquisition of ArisGlobal, which was completed in September 2026 and had no material revenue impact.
-
**Software Revenue by Industry:**High-Tech, Home & Lifestyle and Industrial Equipment were the main contributors to growth this quarter.
-
Key Strategic Drivers: 3DEXPERIENCE software revenue increased 25% and represented 46% of 3DEXPERIENCE eligible software revenue, compared to 40% last year. Cloud software revenue grew 14%, representing 28% of software revenue during the period. This performance reflects customers’ increasing focus on transforming their operations and preparing for Industrial AI at scale.
-
Operating Income and Margin: IFRS operating income increased 8% to €325 million, as reported. Non-IFRS operating income increased 11% to €490 million, as reported, and increased 10% in constant currencies. The IFRS operating margin stood at 20.9% compared to 20.7% last year. The non-IFRS operating margin totaled 31.6%, versus 30.1% in the same period of last year.
-
Diluted Earnings per Share: IFRS diluted EPS was €0.22, increasing 8% as reported. Non-IFRS diluted EPS grew to €0.32, up 10% as reported and up 8% in constant currencies.
Nine Months Ended 2026 Versus 2025 Financial Comparisons
(unaudited, IFRS and non-IFRS unless otherwise noted,
all revenue growth rates in constant currencies)
-
Total Revenue: In the first nine months, total revenue grew 4% to €4.62 billion. Software revenue increased 4% to €4.17 billion. Subscription and support revenue rose 3% to €3.48 billion; recurring revenue represented 83% of total software revenue. Licenses and other software revenue increased 7% to €691 million. Services revenue was up 6% to €448 million.
-
Software Revenue by Geography: The Americas grew by 1%, Europe increased by 5% and Asia was up 8%, representing respectively 39%, 38% and 23% of software revenue.
-
Software Revenue by Product Line:
-
Industrial Innovation software revenue rose 3% to €2.27 billion and represented 54% of software revenue. ENOVIA and 3DEXPERIENCE were among the strongest contributors to growth.
-
Life Sciencessoftware revenue decreased 2% to €777 million, representing 19% of software revenue.
-
Mainstream Innovation software revenue increased by 10% to €1.12 billion. Mainstream Innovation represented 27% of software revenue.
-
**Software Revenue by Industry:**Home & Lifestyle, Industrial Equipment, High-Tech and Transportation & Mobility were among the strongest contributors to growth.
-
Key Strategic Drivers: 3DEXPERIENCE software revenue increased by 15%, representing 44% of 3DEXPERIENCE eligible software revenue. Cloud software revenue grew 12% in non-IFRS, and represented 27% of software revenue.3DEXPERIENCE Cloud software revenue increased 46% in constant currencies.
-
**Operating Income and Margin:**IFRS operating income was up 22%, to €1.03 billion, as reported. Non-IFRS operating income increased 3% to €1.41 billion, as reported, and increased 7% in constant currencies. IFRS operating margin totaled 22.3% compared to 18.6% for the same period in 2025. Non-IFRS operating margin stood at 30.6% in the first nine months, compared to 30.1% in the same period last year.
-
Diluted Earnings per Share: IFRS diluted EPS was €0.66, an increase of 16% as reported. Non-IFRS diluted EPS increased 3% to €0.93, as reported, and increased by 7% in constant currencies.
-
Cash Flow from Operations (IFRS): In the first nine months, cash flow from operations was up 20% in constant currencies to €1.57 billion, compared to €1.30 billion last year. Cash flow from operations was supported by strong cash conversion, and was principally used for the acquisition of ArisGlobal, net of cash acquired of €1.5 billion and dividend payments of €357 million.
-
**Balance Sheet (IFRS):**Dassault Systèmes’ net financial position totaled €1.05 billion as of September 30, 2026, including cash and cash equivalents of €3.81 billion in the first nine months.
Financial Objectives for 2026
Dassault Systèmes’ fourth quarter and 2026 financial objectives presented below are given on a non-IFRS basis and reflect the principal 2026 currency exchange rate assumptions for the US dollar and Japanese yen as well as the potential impact from additional non-Euro currencies:
| | | | | | |
| | | | Q4 2026 | FY 2026 | |
| | Total Revenue (billion) | €1.782 - €1.842 | €6.399 - €6.459 | |
| | Growth | 6 - 9% | 3 - 4% | |
| | Growth ex FX | 5 - 8% | 4 - 5% | |
| | | | | | |
| | Software revenue growth * | 5 - 8% | 4 - 5% | |
| | Services revenue growth * | 8 - 14% | 6 - 8% | |
| | | | | | |
| | Operating Margin | 37.2% - 37.8% | 32.5% - 32.7% | |
| | | | | | |
| | Diluted EPS | €0.42 - €0.43 | €1.35 - €1.36 | |
| | Growth | 4 - 8% | 3 - 4% | |
| | Growth ex FX | 3 - 7% | 6 - 7% | |
| | | | | | |
| | US dollar | $1.14 per Euro | $1.16 per Euro | |
| | Japanese yen (before hedging) | JPY 170.0 per Euro | JPY 180.5 per Euro | |
| | * Growth in Constant Currencies | | | |
These objectives are prepared and communicated only on a non-IFRS basis and are subject to the cautionary statement set forth below.
The 2026 non-IFRS financial objectives set forth above do not take into account the following accounting elements below and are estimated based upon the 2026 principal currency exchange rates above: contract liabilities write-downs was not significant; share-based compensation expenses, including related social charges, estimated at approximately €116 million (these estimates do not include any new stock option or share grants issued after September 30, 2026); amortization of acquired intangibles and of tangibles reevaluation, estimated at approximately €343 million, largely impacted by the acquisition of MEDIDATA; and lease incentives of acquired companies at approximately €1 million.
The above objectives also do not include any impact from other operating income and expenses, net principally comprised of acquisition, integration, IT transformation projects and restructuring expenses, and impairment of goodwill and acquired intangible assets; from one-time items included in financial revenue; from one-time tax effects; and from the income tax effects of these non-IFRS adjustments. Finally, these estimates do not include any new acquisitions or restructuring completed after September 30, 2026.
Corporate Announcements
-
October 28, 2026: Dassault Systèmes Takes its Life Sciences Ambition to the Next Level with a Unified AI Platform Connecting Science, Medicine and Patients
-
October 28, 2026: MEDIDATA Named by IDC MarketScapeTMas a Leader in Worldwide Life Sciences R&D RWDIRWE Data Platforms, Technology Solutions, and Consulting Services
-
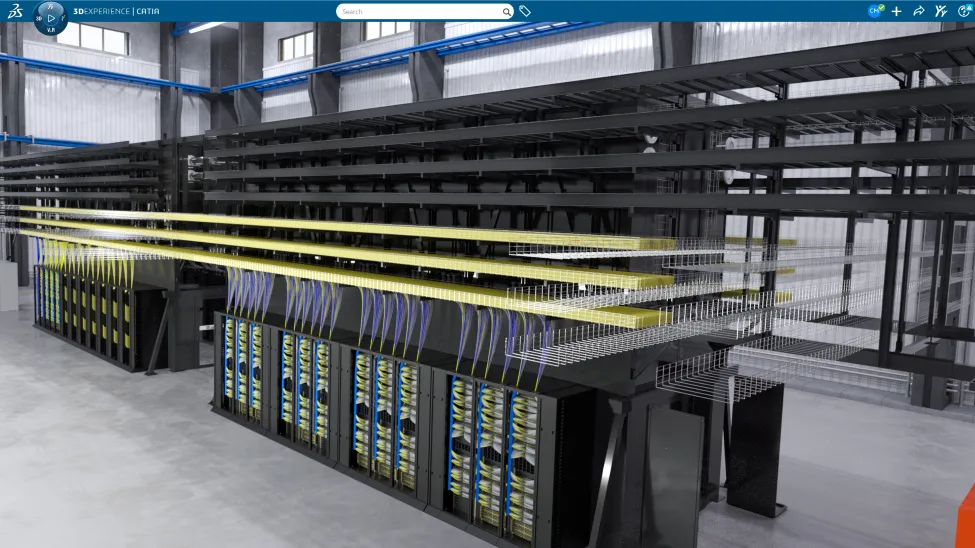
October 22, 2026: Dassault Systèmes and Vertiv Team to Accelerate AI Factory Design and Deployment
-
October 16, 2026: Dassault Systèmes Showcases AI-Powered Virtual Twin Factories at NVIDIA GTC Berlin 2026
-
October 7, 2026: Dassault Systèmes Brings Virtual Twins and Industrial AI to the Paris Motor Show 2026
-
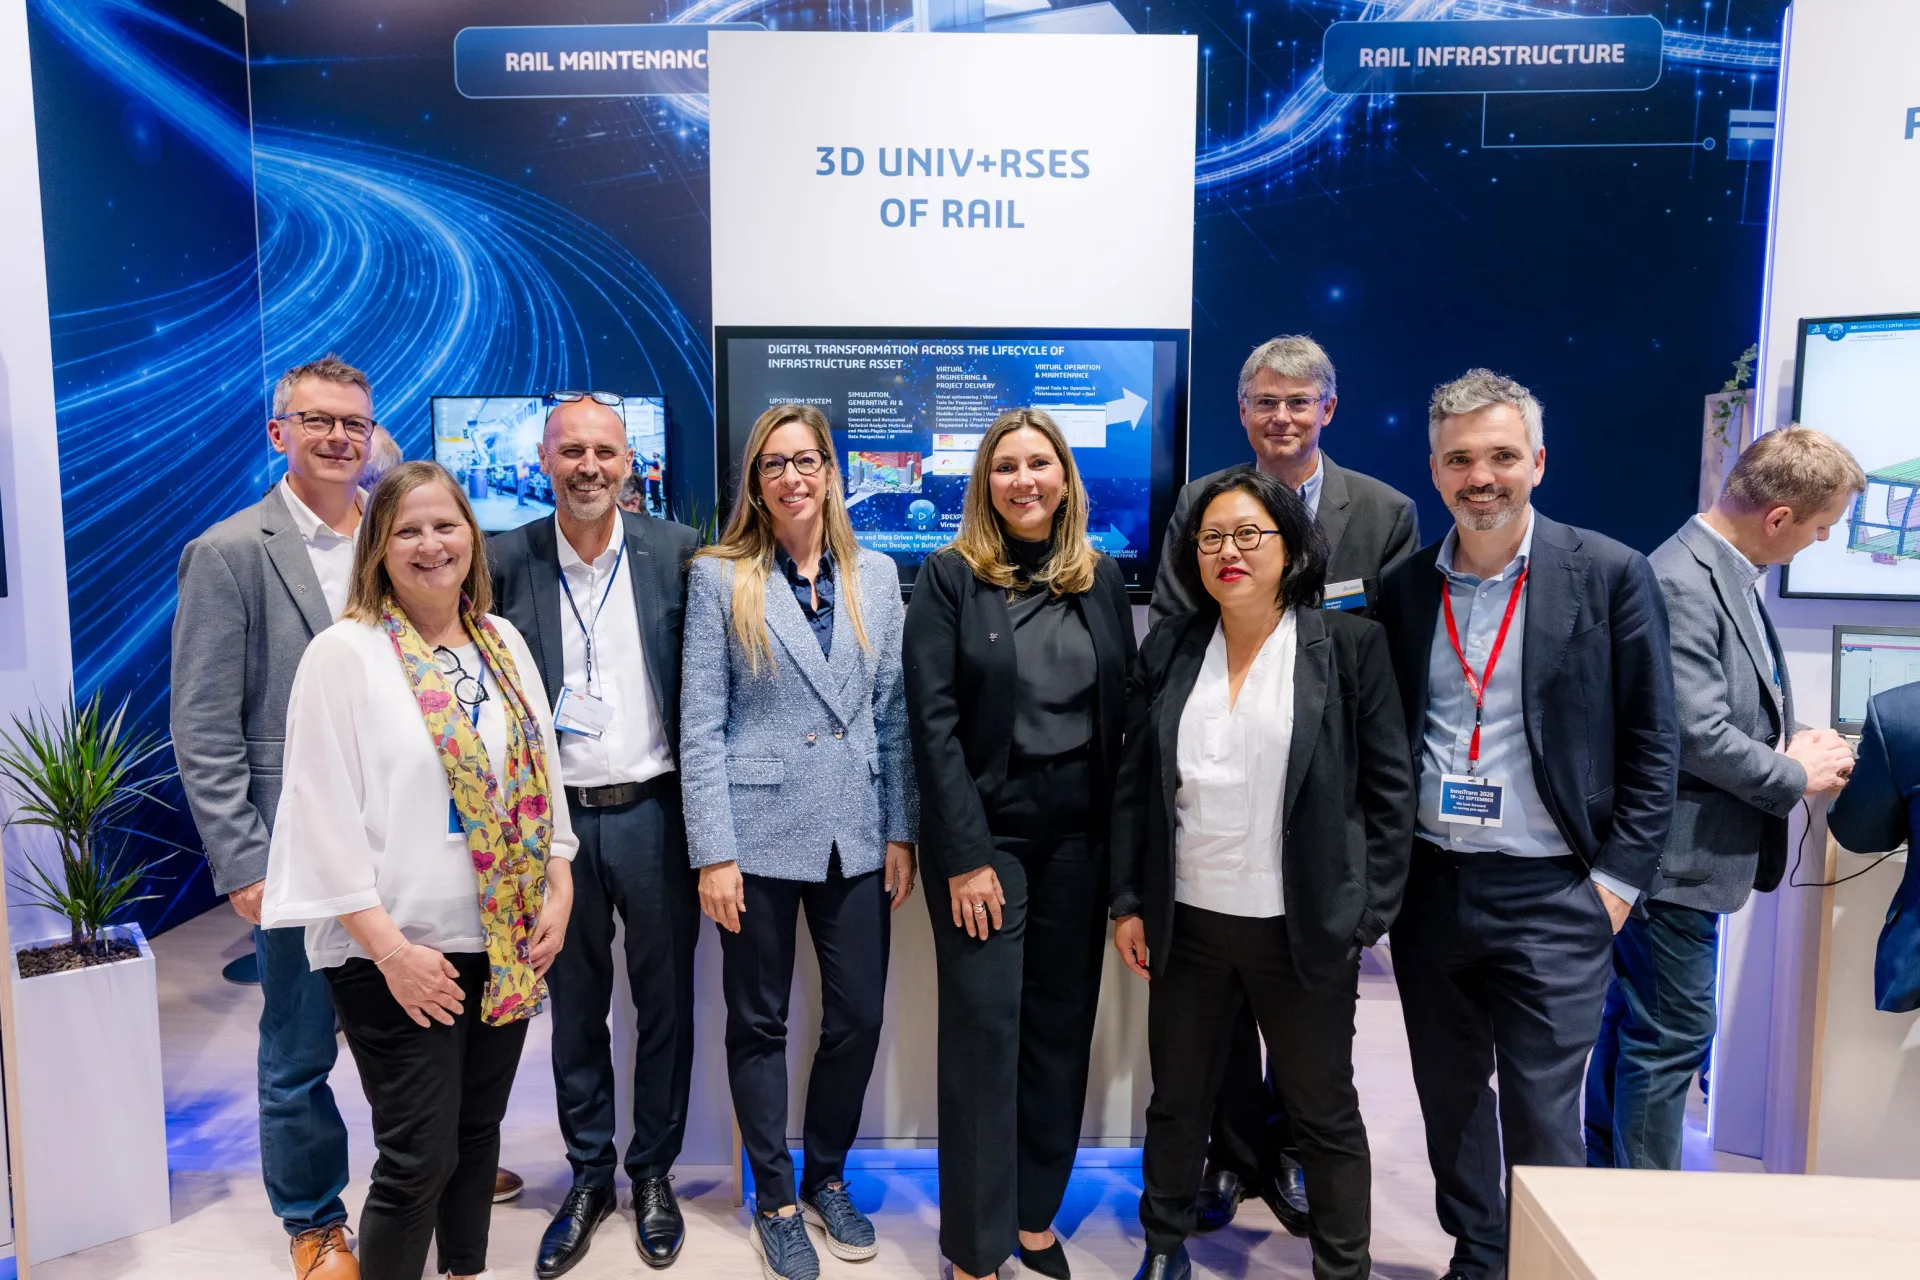
September 24, 2026: SYSTRA and Dassault Systèmes Enter into a Technological Collaboration Around a New Generation of Virtual Twins for Transport Infrastructures
-
September 10, 2026: Centric Software Unveils Centric AI to Power Smarter Product Decisions at NRF 2026
-
July 23, 2026: Dassault Systèmes to acquire ArisGlobal, creating a unified AI intelligence platform for the Life Sciences industry connecting molecule, patient and real-world outcomes
-
July 23, 2026: Medidata Launches Medidata Plus, an AI-Native Foundation Built to Scale Clinical Portfolios
-
July 23, 2026: Dassault Systèmes Expands the 3DEXPERIENCE AI-Native Agentic Platform with New Virtual Companion Skills to Co-Engineer with Humans
-
July 23, 2026: Dassault Systèmes Sets New SBTi-Validated Net-Zero Target
Today’s Webcast and Conference Call Information
Today, Wednesday, October 28, 2026, Dassault Systèmes will host, from London, a webcasted presentation at 9:00 AM London Time / 10:00 AM Paris time, and will then host a conference call at 8:30 AM New York time / 1:30 PM London time / 2:30 PM Paris time. The webcasted presentation and conference calls will be available online by accessing investor.3ds.com.
Additional investor information is available at investor.3ds.com or by calling Dassault Systèmes’ Investor Relations at +33.1.61.62.69.24.
Investor Relations Events
-
Capital Markets Day: November 17, 2026
-
Fourth Quarter 2026 Earnings Release: February 3, 2027
-
First Quarter 2027 Earnings Release: April 28, 2027
-
Second Quarter 2027 Earnings Release: July 28, 2027
Forward-looking Information
Statements herein that are not historical facts but express expectations or objectives for the future, including but not limited to statements regarding the Group’s non-IFRS financial performance objectives are forward-looking statements. Such forward-looking statements are based on Dassault Systèmes management's current views and assumptions and involve known and unknown risks and uncertainties. Actual results or performances may differ materially from those in such statements due to a range of factors.
The Group’s actual results or performance may be materially negatively affected by numerous risks and uncertainties, as described in the “Risk Factors” section 1.9 of the 2025 Universal Registration Document (‘Document d'enregistrement universel’) filed with the AMF (French Financial Markets Authority) on March 31, 2026, available on the Group’s website www.3ds.com.
In particular, please refer to the risk factor “Uncertain Global Environment” in section 1.9.1.1 of the 2025 Universal Registration Document set out below for ease of reference:
“In light of the uncertainties regarding economic, business, social, health and geopolitical conditions at the global level, Dassault Systèmes’ revenue, net earnings and cash flows may grow more slowly, whether on an annual or quarterly basis, mainly due to the following factors:
-
the deployment of Dassault Systèmes’ solutions may represent a large portion of a customer’s investments in software technology. Decisions to make such an investment are impacted by the economic environment in which the customers operate. Uncertain global geopolitical, economic and health conditions and the lack of visibility or the lack of financial resources may cause some customers, e.g. within the automotive, aerospace, energy or natural resources industries, to reduce, postpone or cancel their investments, or to reduce or not renew ongoing paid maintenance for their installed base, which impact larger customers’ revenue with their respective sub-contractors;
-
the geopolitical, economic and monetary situation in certain geographic regions where Dassault Systèmes operates could become more volatile and negatively affect Dassault Systèmes’ business, and in particular its revenue, for example due to stricter export compliance rules, or the implementation of new customs barriers or controls on the exchange of goods and services;
-
continued inflationary pressure or volatility on raw materials, computer hardware and energy prices could also slow down Dassault Systèmes’ diversification efforts in new industries or negatively affect its financial health; and
-
the sales cycles of Dassault Systèmes’ products, which are relatively long due to the strategic nature of such investments for customers, could further lengthen.
Tensions, particularly geopolitical, economic, financial or customs tensions, and the occurrence of crises could adversely impact the financial situation or financing and supply capabilities of Dassault Systèmes’ existing and potential customers, commercial and technology partners, some of whom may be forced to temporarily close sites or to cease operations. Certain crises – health and geopolitical crises in particular – could also have consequences both for the health and safety of Dassault Systèmes’ employees and for the Company. A deteriorating economic environment, such as deflationary pressure in Asia, could generate increased price pressure and affect the collection of receivables, which would negatively affect Dassault Systèmes’ revenue, financial performance and market position. Dassault Systèmes makes every effort to take into consideration this uncertain outlook. Dassault Systèmes’ business results, however, may not develop as anticipated. Furthermore, due to factors affecting sales of Dassault Systèmes’ products and services, there may be a substantial time lag between an improvement in global economic and business conditions and an upswing in the Company’s business results.”
In preparing such forward-looking statements, the Group has in particular assumed an average US dollar to euro exchange rate of US$1.14 per €1.00 as well as an average Japanese yen to euro exchange rate of JPY170.0 to €1.00, before hedging for the fourth quarter 2026. The Group has assumed an average US dollar to euro exchange rate of US$1.16 per €1.00 as well as an average Japanese yen to euro exchange rate of JPY180.5 to €1.00, before hedging for the full year 2026. However, currency values fluctuate, and the Group’s results may be significantly affected by changes in exchange rates.
Non-IFRS Financial Information
Readers are cautioned that the supplemental non-IFRS financial information presented in this press release is subject to inherent limitations. It is not based on any comprehensive set of accounting rules or principles and should not be considered in isolation from or as a substitute for IFRS measurements. The supplemental non-IFRS financial information should be read only in conjunction with the Company’s consolidated financial statements prepared in accordance with IFRS. Furthermore, the Group’s supplemental non-IFRS financial information may not be comparable to similarly titled “non-IFRS” measures used by other companies. Specific limitations for individual non-IFRS measures are set forth in the Company’s 2025 Universal Registration Document filed with the AMF on March 31, 2026.
In the tables accompanying this press release the Group sets forth its supplemental non-IFRS figures for revenue, operating income, operating margin, net income and diluted earnings per share, which exclude the effect of adjusting the carrying value of acquired companies’ deferred revenue, share-based compensation expense and related social charges, the amortization of acquired intangible assets and of tangibles reevaluation, certain other operating income and expense, net, including impairment of goodwill and acquired intangibles, acquisition, integration, IT transformation projects and restructuring expenses, the effect of adjusting lease incentives of acquired companies, certain one-time items included in financial revenue and other, net, and the income tax effect of the non-IFRS adjustments and certain one-time tax effects. The tables also set forth the most comparable IFRS financial measure and reconciliations of this information with non-IFRS information.