Oct. 16 2026 LinkedIn Twitter Facebook share Print How Bureau Veritas helps manufacturers and other economic operators achieve compliance while strengthening safety, digital resilience, and cybersecurity. Replacing the Machinery Directive 2006/42/EC,…
Oct. 16 2026
How Bureau Veritas helps manufacturers and other economic operators achieve compliance while strengthening safety, digital resilience, and cybersecurity.
Replacing the Machinery Directive 2006/42/EC, the Regulation establishes new obligations for manufacturers, authorized representatives, importers, and distributors involved in placing machinery and related products on the EU market.
For many organizations, the key questions are:
-
What are the main changes compared to Machinery Directive 2006/42/EC?
-
Does the Regulation apply to my machinery, partly completed machinery, or related products?
-
What about substantial changes?
-
How do the new cybersecurity requirements impact compliance?
-
What actions must be completed before and after January 2027?
-
How can we avoid delays, non-compliance, or market access issues?
Talk to a Machinery Regulation Expert
Our solution
Navigating the EU Machinery Regulation (EU) 2023/1230 requires expertise across both machinery safety and cybersecurity. Bureau Veritas brings together leading Industrial Product Certification and Cybersecurity capabilities to help manufacturers and economic operators identify compliance gaps, manage risks, strengthen cyber resilience, and confidently place compliant products on the European market.
Global Webinar Series:
If you are a machinery manufacturer, system integrator, machine builder, importer, distributor, or involved in machinery safety and conformity assessment, this expert session is designed for you. This live 30-minute webinar is offered in four languages:
-
Register here for free or watch on-demand:
WHAT IS THE EU MACHINERY REGULATION?
The EU Machinery Regulation (EU) 2023/1230 replaces the Machinery Directive 2006/42/EC and introduces a modernized regulatory framework for machinery and related products placed on the European market.
The Regulation has been developed to address emerging technologies and evolving risks associated with increasingly connected and intelligent machinery, including:
- Connected and networked machinery
- Industrial Internet of Things (IIoT)
- Artificial Intelligence (AI) and machine learning applications
- Software-driven and digital safety functions
- Cybersecurity threats that may affect machinery safety and performance
The Regulation aims to ensure that machinery placed on the European market remains safe, secure, and compliant in an increasingly digital world, while providing legal clarity and a consistent framework for manufacturers and other economic operators.
KEY DATES YOU NEED TO KNOW
- June 2023: Machinery Regulation published by the European Union
- 20 January 2027: Mandatory application date
- All new machinery placed on the EU market shall comply with the Machinery Regulation (EU) 2023/1230.
WHO IS IMPACTED?
The Machinery Regulation (EU) 2023/1230 applies to:
-
Manufacturer
Any natural or legal person who:
(a) manufactures products within the scope of the Regulation or who has those products designed or manufactured, and markets those products under its name or trademark; or
(b) manufactures products within the scope of the Regulation and puts those products into service for its own use.
-
Authorized Representative
Any natural or legal person established within the Union who has received a written mandate from a manufacturer to act on its behalf in relation to specified tasks.
-
Importer
Any natural or legal person established within the Union who places a product within the scope of the Regulation from a third country on the Union market.
-
Distributor
Any natural or legal person in the supply chain, other than the manufacturer or the importer, who makes a product within the scope of this Regulation available on the market.
WHAT ARE THE KEY CHANGES?
-
Structure
The new Machinery Regulation (EU) 2023/1230 expands from 63 to 102 pages, making it more comprehensive than the previous Directive. It includes 86 recitals, compared to 30, providing greater insight into the legislator’s intent. The binding legal requirements are contained in 54 articles, up from 29. Both frameworks retain 12 annexes.
-
Economic Operators
Image
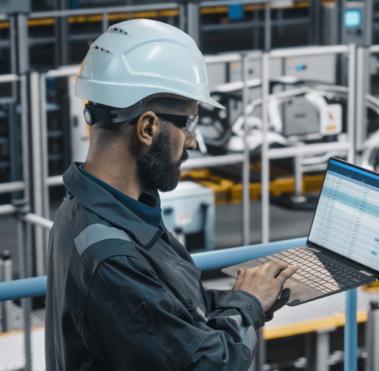
The Machinery Regulation defines four key economic operators: manufacturers, authorized representatives, importers, and distributors. Manufacturers are responsible for compliant machinery placed on the market. Authorized representatives may act on behalf of manufacturers under a written mandate. Importers place products from third countries on the EU market, while distributors make them available through the supply chain. These roles ensure clear responsibility throughout the product lifecycle.
-
Technologies
Image

Protection against corruption - Cybersecurity
The Machinery Regulation introduces specific requirements to protect machinery against unauthorized modifications and cyber-related corruption. Manufacturers must ensure that hardware, software, and safety-related data cannot be altered in a way that compromises safety. Safety-critical software should be identifiable, monitored, and protected throughout the machine's lifecycle.
Fully and partly self-evolving behaviour - AI
The Machinery Regulation recognizes machinery incorporating AI and adaptive systems that can change their behaviour after deployment. Manufacturers must ensure that fully or partly self-evolving systems remain safe under all intended operating conditions. Any learning or adaptation process must not create new unacceptable risks or reduce the effectiveness of safety functions. The limits of autonomy, decision-making, and system behaviour must be clearly defined, validated, and controlled throughout the machine's lifecycle.
-
Substantial Modifications
Image

A substantial modification is a change to machinery that introduces new risks or increases existing risks after it has been placed on the market. The party making the modification assumes the responsibilities of a manufacturer and may need to perform a new conformity assessment. This applies to both physical and digital modifications, including software updates. If the modification affects safety functions, control systems, or risk levels, it may qualify as substantial. After 20 January 2027, machinery undergoing a substantial modification must comply with the Machinery Regulation (EU) 2023/1230.
-
Digital Documentation
Image

The Machinery Regulation formally recognizes digital user manuals as an alternative to paper documentation. Manufacturers may provide instructions, assembly guides, and declarations of conformity in digital format. Paper copies must still be supplied upon request within a defined period. Digital documentation must remain accessible for at least 10 years after the product is placed on the market. This change supports digitalization while maintaining user access to essential safety information.
-
Machinery Definition
Image
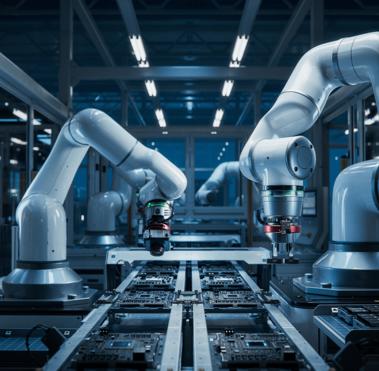
The Machinery Regulation maintains the traditional definition of machinery while introducing the new category of “related products.” Software is now explicitly recognized as a key element of machinery. A machine without the necessary application-specific software is still considered a machine under this regulation. This clarification reflects the growing importance of digital technologies in modern machinery.
-
Expansion of Safety Components list – Annex II
Image
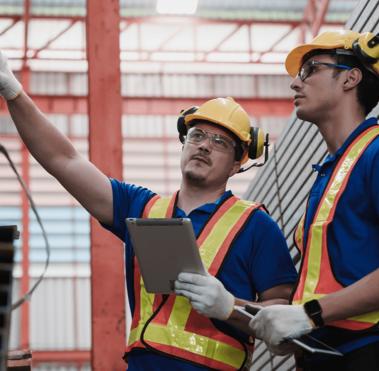
The Machinery Regulation expands the definition of safety components to explicitly include software. Safety components are products that perform a safety function, and whose failure could endanger people. The Regulation also provides an indicative list of safety components in Annex II. This clarification reflects the increasing role of digital and programmable safety systems in machinery.
-
Structure
The new Machinery Regulation (EU) 2023/1230 expands from 63 to 102 pages, making it more comprehensive than the previous Directive.
-
Economic Operators
Image

The Machinery Regulation defines four key economic operators: manufacturers, authorized representatives, importers, and distributors. Manufacturers are responsible for compliant machinery placed on the market.
-
Technologies
Image

The Machinery Regulation introduces specific requirements to protect machinery against unauthorized modifications and cyber-related corruption.
-
Substantial Modifications
Image

A substantial modification is a change to machinery that introduces new risks or increases existing risks after it has been placed on the market.
-
Digital Documentation
Image

The Machinery Regulation formally recognizes digital user manuals as an alternative to paper documentation.
-
Machinery Definition
Image

The Machinery Regulation maintains the traditional definition of machinery while introducing the new category of “related products.”
-
Expansion of Safety Components list – Annex II
Image

The Machinery Regulation expands the definition of safety components to explicitly include software.
WHAT DOES THIS MEAN FOR YOUR BUSINESS?
|
|
| Potential Business Risks |
The Opportunity |
| Without adequate preparation organizations may face: |
Organizations that prepare early can: |
| ❌ Delayed market access |
✅ Improve product safety |
| ❌ Increased compliance costs |
✅ Strengthen customer trust |
| ❌ Product redesign requirements |
✅ Accelerate market access |
| ❌ Non-conformity findings |
✅ Reduce compliance risks |
| ❌ Reputational and cybersecurity risks |
✅ Differentiate through secure-by-design products |
| ❌ Supply chain disruptions |
|
HOW BUREAU VERITAS HELPS
A Combined Industrial Product Certification + Cybersecurity Approach
Most organizations will require both traditional conformity expertise and cybersecurity expertise.
Image

Industrial Product Certification (IPC)
Support for:
- Conformity assessment
- Technical file reviews
- Gap assessments
- Machinery safety evaluations
- CE marking pathways
Image

Cybersecurity Services
Support for:
- Machinery cybersecurity assessments
- IEC 62443 alignment
- Secure development practices
- Security testing
- Cybersecurity-by-design strategies
Image

Integrated Compliance Journey
- Initial Gap Assessment
- Regulatory Review
- Machinery Safety Evaluation
- Cybersecurity Assessment
- Corrective Action Plan
- Compliance Support
- Market Readiness
FAQs
-
What is the EU Machinery Regulation 2023/1230?
The Machinery Regulation (EU) 2023/1230 is the European regulation that replaces the Machinery Directive 2006/42/EC and introduces updated requirements covering machinery safety, cybersecurity, digital technologies and conformity assessment.
-
When does the Machinery Regulation become mandatory?
The regulation becomes mandatory on 20 January 2027.
-
Does it replace the Machinery Directive?
Yes. Regulation (EU) 2023/1230 replaces Machinery Directive 2006/42/EC.
-
Do non-European manufacturers need to comply?
Yes. Any organization placing machinery on the EU market must comply, regardless of where the machinery is manufactured.
-
Does the Machinery Regulation include cybersecurity requirements?
Yes. The regulation introduces requirements addressing cyber risks that may impact machinery safety and compliance.
-
Why is cybersecurity included?
Because cyber incidents can affect machinery safety, operational integrity and protection of workers.
-
Does the regulation affect software?
Yes. Software and digital safety functions can form part of compliance obligations under the regulation.
-
Can Bureau Veritas support both machinery safety and cybersecurity?
Yes. Bureau Veritas combines Industrial Product Certification and Cybersecurity expertise to provide a coordinated compliance approach.
Contact an Expert
MACHINERY & ADVANCED MANUFACTURING CERTIFICATION
CONTACT OUR TEAM OF EXPERTS
Follow us on
Join us
Leave your mark with us
Our job offers
Top