|
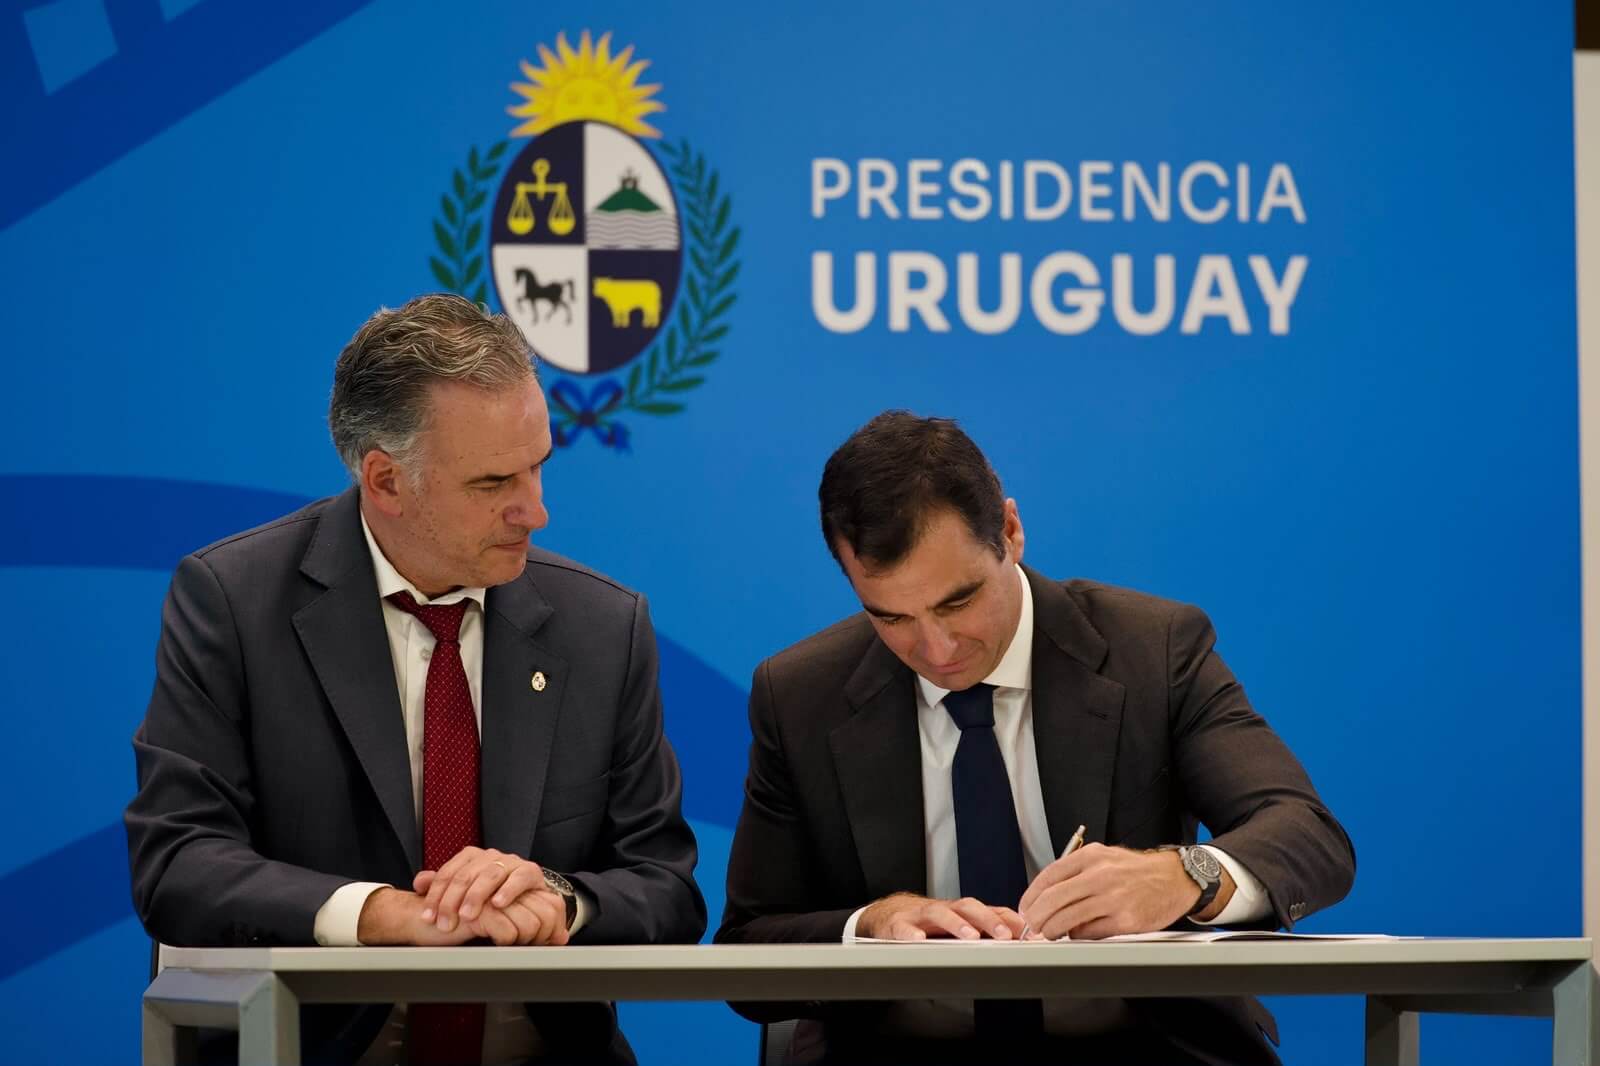
Solaria Energía y Medio Ambiente is a renewable energy company specializing in the development, construction, and operation of solar photovoltaic power plants. The company's core business involves generating and selling electricity from solar energy, with a portfolio of operational assets and a significant pipeline of projects under development. Solaria operates across southern Europe, managing facilities in Spain, Italy, Portugal, Greece, and Uruguay. In addition to power generation, the company engages in energy storage solutions and data center infrastructure, including a strategic agreement with the Uruguayan government to develop a data center technology campus. The group includes subsidiaries such as Indarberri, which focuses on project development in the Basque Country. Solaria was founded in 2002 and has transitioned from manufacturing solar modules to focusing exclusively on energy generation and infrastructure. The company finances its projects through project finance mechanisms and maintains a long-term strategy to expand its renewable energy capacity. Summarised from the company's own disclosures, fiscal year ended Dec 2025 |
Industry Utilities - Independent Power Producers | Homepage solariaenergia.com |
| Sector Utilities | IR page — | |
|
Tags
solar photovoltaic, renewable energy generation, energy storage, data centers, project finance, agrivoltaics, electricity sales, Indarberri, Cifuentes-Trillo, Herdades dos Canhoes, Mendo Marco, Monte Falcato, San Andrés, Budía, Armus, Hércules, Draco, Delphinus, Casaís da Marmeleira
|
Press page — |
Metrics
| Valuation | |
|---|---|
| Market cap | — |
| Market cap (USD) | — |
| P/E | 12.69 |
| PEG | 0.84 |
| P/BV | — |
| P/S | — |
| P/OCF | — |
| P/FCF | — |
| Dividend yield | 4.1% |
| Turnover / mcap | — |
| Returns | |
|---|---|
| ROE | 20.7% |
| ROI | 16.9% |
| ROIC | 21.6% |
| Profit margin | 69.6% |
| Growth | |
|---|---|
| Revenue growing | Yes |
| Profits growing | Yes |
| Revenue up 3y | No |
| Revenue up 5y | No |
| Earnings growth 3y (net profit CAGR) | 15.1% |
| Quality | |
|---|---|
| Profitable | Yes |
| Margin expanding | Yes |
| Buying back stock | Yes |
| Diluting (TTM) | — |
| Debt/Equity | — |
| Podcast bulls (TTM) | Sign up |
| Podcast bears (TTM) | Sign up |
| Podcast sentiment (TTM) | Sign up |
| Podcast sentiment % (TTM) | Sign up |
| News sentiment (TTM) | 0 |
| Quality score | 46.7% |
| Insiders | |
|---|---|
| Buys, 1w | Sign up |
| Buys, 1m | Sign up |
| Buys, 1y | Sign up |
| Sells, 1w | Sign up |
| Sells, 1m | Sign up |
| Sells, 1y | Sign up |
Sign up to see this company's insider trades
| Figure | FY 2025 | FY 2024 | FY 2023 | FY 2022 | FY 2021 | FY 2020 | FY 2019 | FY 2018 | FY 2017 | FY 2016 | FY 2015 | FY 2014 | FY 2013 | FY 2012 | FY 2011 | FY 2010 |
|---|---|---|---|---|---|---|---|---|---|---|---|---|---|---|---|---|
| Revenue | 197.443M | 176.906M | 191.322M | 139.281M | 95.07M | 53.266M | 34.54M | 33.791M | 31.124M | 15.874M | 16.535M | 24.265M | 39.767M | 35.074M | 111.169M | 161.335M |
| Net profit | 137.39M | 88.614M | 107.514M | 90.048M | 73M | 33.072M | 23.871M | 21.346M | 15.011M | 8.026M | 6.643M | 7.021M | -76.613M | -24.185M | -96.32M | 6.504M |
| Free cash flow | -260.098M | -72.066M | -230.526M | -216.976M | -101.244M | -86.799M | — | — | — | — | — | — | — | — | — | — |
Filed figures
Lines the statements and their notes report beside the headline figures, read from the filings' XBRL as filed (no restatement applied), with figures computed from one filing's own lines. Cash-flow lines carry their cash direction: an outflow is negative. Each period links to its filing; a figure's period, report date and tag are in its tooltip.
| Figure | Dec 2019 | Dec 2020 | Dec 2021 | Dec 2022 | Dec 2023 | Dec 2024 | Dec 2025 |
|---|---|---|---|---|---|---|---|
| Balance sheet detail | |||||||
| Trade receivables (EUR) | — | 18.5M | 34.5M | 40.7M | 58.4M | 70M | 78.6M |
| ↳ YoY growth | +86.7% | +17.9% | +43.7% | +19.7% | +12.4% | ||
| ↳ 5y CAGR | +33.6% | ||||||
| Other receivables (EUR) | — | 169,000 | 227,000 | 183,000 | 0.00 | — | — |
| Borrowings, current (EUR) | — | 5.78M | 54.5M | 46.8M | 111M | 79.2M | 150M |
| Borrowings, non-current (EUR) | — | 116M | 122M | 128M | 117M | 109M | 111M |
| Bonds payable (EUR) | — | 122M | 177M | 175M | 229M | 188M | 261M |
| Lease liabilities (EUR) | — | 45.7M | 111M | 104M | 111M | 156M | 194M |
| Cash and deposits (EUR) | 118M | 81.3M | 153M | 151M | 77.3M | 54.3M | 73.3M |
| Right-of-use assets (EUR) | — | 45.4M | 112M | 104M | 110M | 144M | 187M |
| Net debt (borrowings + leases - cash) (EUR) | — | 86M | 135M | 128M | 262M | 289M | 381M |
| Cash flow detail | |||||||
| Operating cash flow (EUR) | — | 47.6M | 94M | 114M | 98.1M | 115M | 138M |
| Purchases of property, plant and equipment (EUR) | — | -134M | -195M | -331M | -329M | -187M | -398M |
| Change in payables (cash effect) (EUR) | — | — | — | 2.93M | -40.5M | -9.04M | 2.98M |
| Share buybacks (cash effect) (EUR) | — | — | — | — | — | 0.00 | -61.5M |
| Interest paid (cash effect) (EUR) | — | — | -12.4M | -14.2M | -34M | -37.1M | -44.6M |
| Income taxes paid (cash effect) (EUR) | — | 432,000 | 1.26M | 2.74M | 9.76M | -624,000 | -12.9M |
| Free cash flow (OCF - PPE - intangibles) (EUR) | — | -86.8M | -101M | -217M | -231M | -72.1M | -260M |
| Income detail | |||||||
| Total comprehensive income (EUR) | — | 29.3M | 24.8M | 95.9M | 180M | 91M | 135M |
| Comprehensive income to owners (EUR) | — | — | — | 95.9M | 180M | 91M | 135M |
| Reported | Feb 28, 2022 | Feb 28, 2022 | Feb 28, 2023 | Feb 28, 2024 | Feb 28, 2024 | Feb 26, 2026 | Feb 26, 2026 |
Sign up to see institutional holdings
Sign UpPodcast Mentions
Sign up to see podcast mentions and sentiment
Sign UpInside information and other relevant information filed with the CNMV, newest first, titles as filed, own-share transactions and liquidity-contract reports included. The link opens the filed document. Press releases from the company's own website, newest first.


Prompts
Click prompts to add them under the company line, click again to take one out, then copy the result into your AI chat. Shared by Asian Century Stocks and Uncovered Thai Stocks. Thank you.
ETFs Holding SOLARIA ENERGIA Y MEDIO AMBIENTE SA
Exchange-traded funds whose newest published daily portfolio holds one of the company's listings, largest weight first.
| ETF | Weight in ETF | Shares | Market value | As of |
|---|---|---|---|---|
| VCLN | 1.39% | 3,938 | $ 76.381K | Jul 31, 2026 |
| OAIM | 0.83% | 163,823 | $ 3.228M | Aug 31, 2026 |
| CCNR | 0.53% | 117,447 | $ 2.278M | Jul 31, 2026 |
| DFIS | 0.07% | 239,116 | $ 4.328M | Nov 12, 2026 |
| AVDS | 0.05% | 10,938 | $ 178.344K | Nov 16, 2026 |
| DXIV | 0.04% | 4,793 | $ 86.75K | Nov 12, 2026 |
| AVDV | 0.03% | 321,198 | $ 5.237M | Nov 16, 2026 |
| AVSD | 0.03% | 7,199 | $ 117.38K | Nov 16, 2026 |
| JSTC | 0.03% | 4,524 | $ 74.188K | Nov 17, 2026 |
| DFSI | 0.02% | 15,079 | $ 272.918K | Nov 12, 2026 |
| DISV | 0.02% | 44,940 | $ 813.379K | Nov 12, 2026 |
| DFIC | 0.02% | 133,224 | $ 2.411M | Nov 12, 2026 |
| DFAX | 0.01% | 63,255 | $ 1.145M | Nov 12, 2026 |
| DFAI | 0.01% | 76,238 | $ 1.38M | Nov 12, 2026 |
| AVDE | 0.00% | 15,661 | $ 255.353K | Nov 16, 2026 |