|
Banco de Sabadell S.A. is a Spanish banking group founded in 1881, operating as one of the main private banking groups in the country. The company provides a global range of financial products and services through two commercial banks, with a significant presence in Spain and Mexico. In Mexico, the group operates through Banco Sabadell, S.A., I.B.M., focusing on corporate and business banking with specialized financial structures. The group's business segments include personal and corporate banking, insurance, and asset management, supported by a multi-brand and multi-channel model. Key subsidiaries include Sabadell Digital S.A., a technology subsidiary, and Sabadell Consumer Finance, S.A.U. The group serves individual and corporate clients in Spain and internationally. Notable partnerships include a strategic cooperation exploration with BPCE and the completion of a real payment using Mastercard's Agent Pay. Summarised from the company's own disclosures, fiscal year ended Oct 2026 |
Industry Banks - Diversified | Homepage grupbancsabadell.com |
| Sector Financial Services | IR page comunicacion.grupbancsabadell.com | |
|
Tags
corporate banking, personal banking, insurance, asset management, consumer finance, digital banking, investment banking, wealth management, Banco Sabadell S.A. I.B.M. (México), Sabadell Digital S.A., Sabadell Consumer Finance S.A.U., BanSabadell Pensiones E.G.F.P. S.A., BanSabadell Seguros. Generales S.A. de Seguros y Reaseguros, BanSabadell Vida S.A. de Seguros y Reaseguros
|
Press page — |
Metrics
| Valuation | |
|---|---|
| Market cap | € 20.362B |
| Market cap (USD) | $ 22.504B |
| P/E | 31.00 |
| PEG | 1.77 |
| P/BV | 1.67 |
| P/S | 3.24 |
| P/OCF | -1.44 |
| P/FCF | 14.76 |
| Dividend yield | 6.8% |
| Turnover / mcap | — |
| Returns | |
|---|---|
| ROE | 12.2% |
| ROI | 12.6% |
| ROIC | 10.2% |
| Profit margin | 22.8% |
| Growth | |
|---|---|
| Revenue growing | No |
| Profits growing | No |
| Revenue up 3y | No |
| Revenue up 5y | No |
| Earnings growth 3y (net profit CAGR) | 17.5% |
| Quality | |
|---|---|
| Profitable | Yes |
| Margin expanding | Yes |
| Buying back stock | Yes |
| Diluting (TTM) | — |
| Debt/Equity | — |
| Podcast bulls (TTM) | Sign up |
| Podcast bears (TTM) | Sign up |
| Podcast sentiment (TTM) | Sign up |
| Podcast sentiment % (TTM) | Sign up |
| News sentiment (TTM) | 76 |
| Quality score | 5.6% |
| Insiders | |
|---|---|
| Buys, 1w | Sign up |
| Buys, 1m | Sign up |
| Buys, 1y | Sign up |
| Sells, 1w | Sign up |
| Sells, 1m | Sign up |
| Sells, 1y | Sign up |
| Figure | FY 2025 | FY 2024 | FY 2023 | FY 2022 | FY 2021 | FY 2020 | FY 2019 | FY 2018 | FY 2017 | FY 2016 | FY 2015 | FY 2014 | FY 2013 | FY 2012 | FY 2011 | FY 2010 |
|---|---|---|---|---|---|---|---|---|---|---|---|---|---|---|---|---|
| Revenue | 7.796B | 11.422B | 10.33B | 6.731B | 5.809B | 1.538B | 1.629B | 6.421B | 6.318B | 6.546B | 6.009B | 5.484B | 5.736B | 5.461B | 4.032B | 3.215B |
| Net profit | 1.777B | 1.829B | 1.334B | 869.39M | 538.707M | 3.01M | 776.878M | 335.23M | 805.178M | 715.853M | 712.245M | 376.645M | 268.835M | 96.035M | 235.872M | 382.922M |
| Free cash flow | 1.38B | -11.272B | -10.76B | -6.867B | 12.113B | 20.027B | -10.841B | — | — | — | — | — | — | — | — | — |
Filed figures
Lines the statements and their notes report beside the headline figures, read from the filings' XBRL as filed (no restatement applied), with figures computed from one filing's own lines. Cash-flow lines carry their cash direction: an outflow is negative. Each period links to its filing; a figure's period, report date and tag are in its tooltip.
| Figure | Dec 2018 | Dec 2019 | Dec 2020 | Dec 2021 | Dec 2022 | Dec 2023 | Dec 2024 | Dec 2025 |
|---|---|---|---|---|---|---|---|---|
| Balance sheet detail | ||||||||
| Cash and deposits (EUR) | 23.5B | 15.2B | 35.2B | 49.2B | 41.3B | 30B | 18.4B | 12.4B |
| Intangible assets (EUR) | — | 1.53B | 1.57B | 1.55B | 1.46B | 1.46B | 1.53B | 1.47B |
| Cash flow detail | ||||||||
| Operating cash flow (EUR) | — | -10.4B | 20.4B | 12.3B | -6.63B | -10.5B | -11.1B | 1.68B |
| Purchases of property, plant and equipment (EUR) | — | -445M | -395M | -226M | -239M | -236M | -201M | -298M |
| Purchases of intangible assets (EUR) | — | -333M | -288M | -276M | -195M | -296M | -346M | -312M |
| Dividends paid (cash effect) (EUR) | — | -56.3M | -113M | 0.00 | -281M | -274M | -591M | -1.37B |
| Share buybacks (cash effect) (EUR) | — | -211M | -146M | -64.4M | -86.5M | -276M | -114M | -1.04B |
| Income taxes paid (cash effect) (EUR) | — | 267M | 35.1M | -74.3M | 67.5M | 409M | 376M | 490M |
| Free cash flow (OCF - PPE - intangibles) (EUR) | — | -11.2B | 19.7B | 11.8B | -7.06B | -11.1B | -11.6B | 1.07B |
| Income detail | ||||||||
| Total comprehensive income (EUR) | — | 1B | -254M | 676M | 604M | 1.42B | 1.94B | 1.58B |
| Comprehensive income to owners (EUR) | — | 993M | -255M | 668M | 594M | 1.42B | 1.93B | 1.58B |
| Provision for credit losses (EUR) | — | — | — | — | — | — | 554M | 486M |
| Reported | Feb 16, 2021 | Feb 16, 2021 | Feb 16, 2021 | Feb 18, 2022 | Feb 20, 2023 | Feb 23, 2024 | Feb 20, 2026 | Feb 20, 2026 |
Podcast Mentions
Inside information and other relevant information filed with the CNMV, newest first, titles as filed, own-share transactions and liquidity-contract reports included. The link opens the filed document. Press releases from the company's own website, newest first.
3T26
Informe Financiero Trimestral
Tercer trimestre de 2026
1
Aspectos clave
3
Principales magnitudes
5
Evolución de resultados y actividad
6
Entorno macroeconómico
6
Evolución de la cuenta de resultados
8
Evolución del balance
13
Gestión del riesgo
17
Gestión de la liquidez
20
Gestión del capital y calificaciones crediticias
21
Resultados por unidades de negocio
23
La acción
27
Hechos relevantes
28
Conciliación y glosario de términos sobre medidas del rendimiento
29
Conciliación de la información contable del grupo
29
Medidas alternativas del rendimiento
32
Aviso legal Este documento tiene únicamente finalidad informativa y no constituye una oferta de contratar ningún producto. Ni este documento, ni ninguna parte del mismo, deben erigirse en el fundamento en el que se base o del que dependa ningún acuerdo o compromiso. La decisión sobre cualquier operación financiera debe hacerse teniendo en cuenta las necesidades del cliente y su conveniencia desde un punto de vista jurídico, fiscal, contable y/o financiero y de conformidad con los documentos informativos previstos por la normativa vigente. Las inversiones comentadas o recomendadas podrían no ser interesantes para todos los inversores. Las opiniones, proyecciones o estimaciones contenidas en este documento se basan en información pública disponible y constituyen una valoración de Banco de Sabadell, S.A. a la fecha de su realización, pero de ningún modo aseguran que los futuros resultados o acontecimientos serán conformes con dichas opiniones, proyecciones o estimaciones. La información está sujeta a cambios sin previo aviso, no se garantiza su exactitud y puede ser incompleta o resumida. Banco de Sabadell, S.A. no aceptará ninguna responsabilidad por cualquier pérdida que provenga de cualquier utilización de este documento o de sus contenidos o de cualquier otro modo en relación con los mismos. Bases de presentación La cuenta de resultados y el balance de situación consolidados al cierre de septiembre de 2026 y de 2025, junto a los diferentes desgloses de partidas que se muestran en este Informe Financiero, se presentan siguiendo las bases, principios y criterios contables definidos en la Nota 1 de las cuentas semestrales consolidadas del grupo a 30 de junio de 2026. De acuerdo a las Directrices sobre medidas alternativas del rendimiento publicadas por la European Securities and Markets Authority el 5 de octubre de 2015 (ESMA/2015/1415es) se adjunta un glosario de las definiciones y la conciliación con las partidas presentadas en los estados financieros de ciertas medidas financieras alternativas utilizadas en el presente documento. Ver apartado Glosario de términos sobre medidas del rendimiento.
Tercer trimestre de 2026
2
NOTA: La información presentada en este informe corresponde a datos de gestión. Para consultar datos contables y su conciliación, ver el apartado 6. La información relativa a los apartados de cuenta de resultados, magnitudes de balance de clientes, gestión del riesgo y liquidez hace referencia al perímetro Ex TSB. Asimismo, en la cuenta de resultados se muestra la aportación neta de TSB agregada en un único epígrafe.
- Aspectos clave Margen de intereses
Margen de intereses
El margen de intereses se sitúa en 2.694 millones de euros a septiembre de 2026, un 0,6% inferior al registrado un año antes, como resultado del impacto de la evolución de los tipos de interés sobre el rendimiento de los activos, que ha neutralizado el efecto positivo del crecimiento de los volúmenes. El crecimiento trimestral del margen de intereses, del 2,0%, refleja la positiva evolución de los volúmenes medios y el reprecio al alza de los activos, que compensan el aumento del coste de los recursos.
Variación YoY:
-0,6%
2.709
2.694
9M25
Variación QoQ:
9M26
+2,0%
902
920
2T26
3T26
Comisiones netas Las comisiones netas ascienden a 983 millones de euros a septiembre de 2026, un 2,1% más que en el mismo periodo del año anterior. Esta evolución refleja la mayor contribución de las comisiones de gestión de activos y seguros.
Comisiones netas Variación YoY:
+2,1%
962
983
En el trimestre las comisiones de fondos de inversión impulsan el crecimiento del 3,7% del total de comisiones, estando impactadas positivamente por el nuevo acuerdo con Amundi. Las comisiones de servicios y las relacionadas con operaciones de riesgos se mantienen estables, pese a la estacionalidad negativa del trimestre. Total costes El total de costes se sitúa en 1.797 millones de euros a cierre de septiembre de 2026, incluyendo 88 millones de euros de costes no recurrentes derivados de iniciativas de eficiencia en España registrados en el primer semestre del año. Por su parte, los costes recurrentes incrementan un 3,8% interanual, destacando el aumento de las amortizaciones, impactadas por la reclasificación, desde la línea de dotaciones, de gastos asociados a activos del negocio de pagos (Paycomet) en el cuarto trimestre de 2025 tras no materializarse su venta. Aislando este impacto, los costes recurrentes incrementan un 2,7% interanual. Los costes disminuyen un 5,5% en términos trimestrales, reflejando el impacto del registro en el segundo trimestre de 33 millones de euros de costes no recurrentes. Excluyendo este efecto, los costes recurrentes se mantienen estables respecto al trimestre anterior. Beneficio neto A cierre de septiembre de 2026, el beneficio neto se sitúa en 1.297 millones de euros, cifra que asciende a 1.376 millones de euros al incorporar la aportación neta de TSB correspondiente a los cuatro primeros meses del ejercicio.
9M25
9M26
Variación QoQ:
+3,7%
328
340
2T26
3T26
Total costes (1)
Variación YoY:
+3,8%
1.646
1.797 88
1.646
1.709
0
Variación QoQ:
(1)
0
603 33
9M25
-0,1%
9M26 Costes recurrentes
570
570
570
2T26
3T26
Costes no recurrentes
(1) Variación sobre el total de costes recurrentes.
Beneficio neto Variación YoY:
El RoTE asciende a 15,5%, siendo el RoTE recurrente de 14,2%*. 1.148
- Proforma ajustando en el periodo la venta de TSB, que implica el reparto de un dividendo de 50 céntimos y la desconsolidación de los intangibles. No incluye el beneficio de TSB ni considera impactos extraordinarios.
Tercer trimestre de 2026
+13,0%
Variación QoQ:
1.297 608
9M25
-33,3%
9M26
2T26
405 3T26
3
Inversión crediticia viva (performing)
Inversión crediticia viva
El crédito vivo registra un crecimiento interanual del 4,0%, apoyado en la evolución positiva de todos los segmentos, con un buen comportamiento tanto en España como en los negocios internacionales, especialmente en Miami y México.
Variación YoY:
En términos trimestrales, la inversión registra una ligera reducción del 0,2%, afectada por la estacionalidad.
Recursos de clientes Los recursos de clientes registran un crecimiento interanual del 5,6%, impulsado tanto por la evolución favorable de los recursos en balance como por el aumento de los recursos fuera de balance. Dentro de estos últimos, destaca especialmente la positiva dinámica de los fondos de inversión, apoyada en las suscripciones netas positivas y en el buen comportamiento de la actividad de gestión de patrimonios.
+4,0%
Variación QoQ:
-0,2%
120.103
125.184
124.913
Sep 25
Jun 26
Sep 26
Total recursos de clientes
Variación YoY:
+5,6%
+0,7% 189.449
54.726
55.880
127.660
133.380
133.569
Sep 25
Jun 26
179.330 51.670
En términos trimestrales, los recursos de clientes crecen un 0,7%, impulsados principalmente por los recursos fuera de balance.
Variación QoQ:
188.106
Recursos de clientes en balance
Sep 26 Recursos fuera de balance
Stage 3 y ratios de cobertura (%)
Activos problemáticos (NPAs) La ratio de morosidad se reduce al 2,40%, mientras que la ratio de cobertura stage 3 con el total de provisiones incrementa hasta el 70,1%. El saldo de NPAs se reduce en 140 millones de euros en el trimestre y en 477 millones de euros en los últimos doce meses, incrementando la cobertura hasta el 64,7%.
69,3
68,7
70,1
53,3
52,5
53,5
67 , 00
57 , 00
47 , 00
37 , 00
2,75
2,47
2,40
Sep 25
Jun 26
Sep 26
27 , 00
17 , 00
Ratio de morosidad
El coste del riesgo de crédito se sitúa en 32 pbs, mientras que el coste del riesgo total asciende a 40 pbs.
Ratio de cobertura stage 3 con total provisiones
Activos problemáticos 4.363
4.025
3.886
636
588
3.634
3.390
3.298
Sep 25 Activos stage 3
Jun 26 Sep 26 Activos inmobiliarios problemáticos
729
Ratio de capital La ratio CET1 fully-loaded* se sitúa en el 13,12% a cierre de septiembre de 2026. La ratio CET1 phase-in se sitúa en el 13,17% y la ratio de Capital Total asciende al 18,11%, por lo que se sitúa por encima de los requerimientos regulatorios, con un MDA buffer de 424 pbs.
Ratio de cobertura stage 3
CET1 fully-loaded (%)
13,74
13,11
13,12
Jun 26
Sep 26
- Aplicando calendario regulatorio del output floor. Sep 25
Tercer trimestre de 2026
4
- Principales magnitudes 3 0 .0 9 .2 5
3 0 .0 9 .2 6
(5) Y o Y ( %)
M argen de intereses M argen básico M argen bruto M argen antes de do tacio nes B eneficio neto
2.709 3.672 3.738 2.092 1.148
2.694 3.677 3.777 1.981 1.297
-0,6 0,1 1,0 -5,3 13,0
B eneficio neto co n TSB
1.390
1.376
--
To tal activo s
244.529
199.258
-18,5
Inversió n crediticia bruta viva Inversió n crediticia bruta de clientes Recurso s de clientes en balance Recurso s fuera de balance To tal recurso s de clientes P atrimo nio neto Fo ndo s pro pio s
120.103 123.670 127.660 51.670 179.330 14.112 14.654
124.913 128.309 133.569 55.880 189.449 12.013 12.401
4,0 3,8 4,6 8,1 5,6 -14,9 -15,4
0,8 2,4 12,5 15,0 44,0
0,8 2,3 12,7 15,5 47,6
2,75 69,3 21 41
2,40 70,1 32 40
94,0 184 135
92,8 185 132
79.608 13,80 13,74 17,25 19,51 29,07 9,50 5,64
70.568 13,17 13,12 16,35 18,11 28,04 10,15 5,92
-11,4
4.997 3,300 16.491 0,34 2,93 2,42 1,36 9,84
4.681 3,652 17.096 0,33 2,65 2,13 1,71 11,18
-6,3 10,7 3,7 -2,6 -9,7 -11,8
1.163 14.168
1.083 13.749
Cuenta de resultados (m illones de € )
Balance (m illones de € )
Rentabilidad y eficiencia (%) ROA RORWA ROE ROTE Eficiencia (incluye co stes no recurrentes)
Gestión del riesgo Ratio de mo ro sidad (%) Ratio de co bertura stage 3 co n to tal pro visio nes (%) Co ste del riesgo de crédito (pbs) Co ste del riesgo to tal (pbs)
Gestión de la liquidez (%) Lo an-to -depo sit ratio LCR NSFR
(1)
Gestión del capital
(2)
A ctivo s po nderado s po r riesgo (A P R) (millo nes de €) Co mmo n Equity Tier 1 (%) Co mmo n Equity Tier 1 fully-lo aded (%) Tier 1 (%) Ratio to tal de capital (% ) M REL (% A P R) M REL (% LRE) Leverage ratio (%)
Acciones (datos a fin de período) Número de accio nes en circulació n meno s la auto cartera (en millo nes) Valo r de co tizació n (€) Capitalizació n bursátil (millo nes de €) B eneficio neto atribuido po r acció n (B P A ) (€) Valo r co ntable po r acció n (€) Valo r co ntable tangible po r acció n (€) Valo r de co tizació n so bre el valo r co ntable tangible P rice-to -earnings ratio
(3) (4)
Otros datos Oficinas Empleado s
(1) (2) (3) (4) (5)
Teniendo en cuenta la mejor estimación a la fecha de publicación del informe. Ratio fully-loaded aplicando calendario regulatorio del output floor. Conforme a las expectativas de los supervisores, las ratios regulatorias deberán reflejar una deducción en CET1 correspondiente a cualquier exceso sobre el umbral fijado en cada momento para distribuciones extraordinarias de capital (definido en términos de ratio fully-loaded aplicando el calendario regulatorio del output floor). Número de acciones totales deduciendo la posición final de la autocartera (incluyendo programa de recompra si aplica). Sin ajustar los valores históricos. Las variaciones YoY a lo largo del documento referentes a la cuenta de resultados hacen referencia a los nueve meses acumulados de 2026 vs nueve meses acumulados de 2025.
Tercer trimestre de 2026
5
- Evolución de resultados y actividad Entorno macroeconómico Contexto económico, político y financiero internacional Las tensiones en Oriente Medio aumentaron durante el verano. Se reanudaron los ataques entre Estados Unidos e Irán, que pasaron a involucrar también a milicias proiraníes en Irak y Yemen. Asimismo, los ataques contra infraestructuras energéticas en Arabia Saudí obligaron a cerrar el oleoducto Este-Oeste, una de las principales rutas alternativas para exportar petróleo sin atravesar el estrecho de Ormuz. En este contexto, los precios de las materias primas energéticas y de los productos refinados se mantuvieron elevados, pese al acuerdo entre Estados Unidos y Rusia para suministrar diésel al mercado estadounidense. En el ámbito comercial, persistieron las tensiones con China, aunque el presidente estadounidense extendió la tregua comercial hasta mediados de enero y la Unión Europea y China acordaron establecer una cuota para las importaciones europeas de vehículos híbridos procedentes de China. La actividad económica continuó mostrando resiliencia, apoyada por la inversión vinculada a la IA. No obstante, persistieron focos de debilidad en algunas economías. En China, estos estuvieron asociados principalmente a la atonía de la demanda interna. En Europa, la actividad recibió el apoyo del programa de expansión fiscal de Alemania. El FMI incorporó estas dinámicas en una nueva revisión al alza de su previsión de crecimiento del PIB mundial para 2026, aunque mantuvo su valoración de que los riesgos para las perspectivas económicas seguían sesgados a la baja. La inflación repuntó en diversas economías como consecuencia del aumento de los precios de la energía y se mantuvo claramente por encima de los objetivos de los bancos centrales. A ello se añadió la persistencia de una inflación elevada en los servicios. En el ámbito político, el partido de extrema derecha Alternativa para Alemania (AfD) registró un avance significativo, en un contexto de tensiones dentro del Gobierno de coalición que retrasaron la aplicación de reformas estructurales. La formación obtuvo resultados históricamente elevados en varios estados del este de Alemania y pasó a encabezar las encuestas de intención de voto. Situación económica en España En España, la economía mantuvo un crecimiento sólido durante el 3T26 tras el avance del PIB del 0,7% trimestral en el 2T26, impulsado por la fortaleza del consumo, la inversión y las exportaciones de servicios. Los indicadores de confianza mejoraron a lo largo del trimestre, con un PMI de servicios en niveles compatibles con una expansión robusta y un PMI manufacturero que recuperó terreno al cierre del periodo. Asimismo, el mercado laboral siguió mostrando un notable dinamismo, con nuevos avances de la afiliación a la Seguridad Social (en parte favorecidos por el proceso extraordinario de regularización de inmigrantes) y un nuevo descenso de la tasa de paro, hasta el 9,9% en el 2T26, mínimos desde 2008. En este contexto, el Banco de España revisó al alza sus previsiones de crecimiento hasta el 2,6% para 2026 y el 2,2% para 2027. No obstante, algunos indicadores siguieron reflejando una mayor debilidad de la
industria y del sector exterior, con señales de deterioro de la producción industrial y del déficit comercial. En cuanto a los precios, la inflación repuntó con fuerza durante el verano y alcanzó el 5,0% interanual en septiembre, impulsada principalmente por el encarecimiento de la energía y los carburantes. Por su parte, la inflación subyacente se moderó gradualmente, aunque permaneció en niveles relativamente elevados, mientras que los precios industriales y de comercio exterior también mostraron una aceleración. En línea con ello, el Banco de España elevó sus previsiones de inflación hasta el 3,9% en 2026 y el 3,7% en 2027. Por último, en materia de política económica destacaron la aprobación de nuevas medidas para mitigar el impacto del encarecimiento de la energía y la aprobación de dos decretos en materia de vivienda. Las dificultades para convalidar inicialmente parte de las medidas de vivienda desembocaron en la convocatoria de elecciones generales anticipadas para el 29 de noviembre. Situación en México En México, la inversión ha mostrado una mejor dinámica recientemente. Además, la producción industrial siguió mostrando un buen tono hasta agosto, posiblemente influida por la dinámica de las exportaciones a Estados Unidos. Estas se han visto impulsadas por productos tecnológicos vinculados a la IA, lo que ha más que compensado la menor contribución de las exportaciones de automóviles. En adelante, será clave si la inversión consigue consolidar la mejoría observada en los últimos meses, a pesar de la incertidumbre generada por la decisión de Estados Unidos de no extender, de momento, el T-MEC más allá de 2036. Mientras tanto, persisten las dudas respecto a la capacidad que tendrá México para consolidar las cuentas públicas. En cuanto a los precios, la inflación, tanto general como subyacente, se mantuvo dentro del rango objetivo del banco central. En cualquier caso, la inflación de servicios siguió mostrando una elevada inercia con tasas superiores al 4%. En este contexto, el Banxico mantuvo inalterado el tipo oficial en el 6,50%, en línea con lo esperado por el consenso. El tipo oficial permanece en ese nivel desde que la autoridad monetaria finalizó el ciclo de bajadas el pasado mes de mayo. El Banxico puntualizó que, dado que las condiciones macroeconómicas en México son diferentes a las de Estados Unidos, la política monetaria no tendría que reaccionar de manera mecánica ante las subidas de tipos de la Reserva Federal (Fed). Además, continuó considerando que persisten los riesgos a la baja sobre la actividad económica en México y que los riesgos sobre la inflación están sesgados al alza. Mercados de renta fija El BCE continuó su ciclo de endurecimiento monetario y elevó nuevamente los tipos de interés en septiembre, situando la facilidad de depósito en el 2,50%. La institución justificó la decisión por el deterioro de las perspectivas de inflación. En concreto, el BCE revisó al alza su previsión de inflación para 2027, hasta el 2,5%. Posteriormente, varios miembros del BCE mantuvieron abierta la posibilidad de
Tercer trimestre de 2026
6
nuevas subidas de tipos, con el objetivo de evitar la aparición de efectos de segunda ronda. La Fed también elevó los tipos de interés en su reunión de septiembre y situó el intervalo objetivo de los fondos federales entre el 3,75% y el 4,00%. La decisión se produjo después de un giro hacia una orientación más restrictiva, que ya se había puesto de manifiesto a finales de agosto durante el simposio anual de Jackson Hole. Durante el mismo, K. Warsh señaló que la política monetaria podría no estar siendo suficientemente restrictiva. Además, la Reserva Federal revisó al alza sus previsiones de crecimiento e inflación e indicó que el impulso de la inversión en inteligencia artificial estaba generando presiones de demanda. Las proyecciones sobre los tipos de interés también reflejaron una orientación más restrictiva. En particular, pasaron a anticipar una subida adicional en 2026, mientras que la mediana de las proyecciones se situó por encima de la publicada en junio. Las rentabilidades de la deuda pública a 10 años repuntaron de forma importante, llegando a alcanzar máximos de varios años en Japón, Reino Unido, Alemania y Estados Unidos. Entre los factores que explicaron este movimiento destacaron: (i) el enquistamiento del conflicto en Oriente Medio y la consecuente alza de los precios energéticos; (ii) la resiliencia de la economía global al shock energético; (iii) el tono tensionador de la Fed y el BCE; (iv) las expectativas de endurecimiento de la política monetaria en Japón; (v) mayores preocupaciones fiscales a escala global; (vi) el volumen elevado de emisiones de los hyperscalers para financiar la inversión en IA; y (vii) la decepción en el anuncio de buybacks por parte del Tesoro americano.
sus cuentas públicas y ante las dificultades del gobierno para aprobar presupuestos con medidas de consolidación fiscal. El gobernador del banco central advirtió de que el país corre el riesgo de verse asfixiado por los costes de financiación si no acomete este proceso de ajuste fiscal. En cualquier caso, varios miembros del BCE reiteraron que la situación actual no justifica una intervención del BCE en el mercado de deuda soberana y Lagarde indicó que el banco central posee los instrumentos necesarios para intervenir en los mercados si se producen movimientos injustificados. Las primas de riesgo de los países de la periferia también se vieron presionadas al alza, especialmente Italia y Grecia, debido a los temores sobre Francia. Mercados de renta variable Los mercados de renta variable presentaron un comportamiento desigual durante el 3T26. Su evolución estuvo condicionada por los cambios en las expectativas sobre los tipos de interés, las dudas relativas a la financiación, la competencia y la rentabilidad de las inversiones en inteligencia artificial, así como por la incertidumbre comercial y geopolítica. Estados Unidos volvió a mostrar una mayor fortaleza relativa, con el S&P 500 avanzando un 2,0%, mientras que las bolsas europeas cerraron mayoritariamente a la baja: el Euro Stoxx retrocedió un 1,58%, el IBEX 35 un 0,89% y el CAC 40 destacó negativamente con una caída del 5,9%, frente a la práctica estabilidad del DAX (+0,15%). En Asia, el Nikkei cedió un 0,81%.
En Francia, la prima de riesgo repuntó de manera significativa y se situó en máximos desde 2012, debido a la fragilidad de
PIB – EE.UU. vs. Zona euro (variación interanual en %) PIB EEUU
Tipo de interés oficial – EE.UU. vs. Zona euro (en %) Tipo de interés oficial EEUU
PIB zona euro
Tipo de interés oficial zona euro
16,0 5,5
12,0 8,0
4,5
4,0
3,5
0,0
2,5
-4,0 1,5
-8,0
0,5
9/26
9/25
9/24
9/23
9/22
9/21
9/20
9/19
-0,5 9/18
9/26
9/25
9/24
9/23
9/22
9/21
9/20
9/19
9/18
9/17
-16,0
9/17
-12,0
Fuente: Bloomberg.
Tipos de cambio: Paridad 1 euro/moneda
30.09.25 31.12.25 31.03.26 30.06.26 30.09.26 USD
1,1741
1,1750
1,1498
1,1394
1,1355
MXN
21,5314
21,1180
20,7101
19,9030
20,5816
Fuente: Banco de España.
Tercer trimestre de 2026
7
Evolución de la cuenta de resultados Resumen de resultados: A cierre de septiembre de 2026, Banco Sabadell ha obtenido un beneficio neto de 1.297 millones de euros, que asciende a 1.376 millones de euros incorporando la aportación neta de TSB de los cuatro primeros meses del año.
incremento de las comisiones, especialmente las vinculadas a fondos de inversión. Asimismo, la contención de los costes y la mejora de las dotaciones, en particular las asociadas al riesgo de crédito, contribuyen favorablemente a la evolución del resultado.
En el tercer trimestre, el beneficio neto asciende a 405 millones de euros, lo que supone un crecimiento del 12,9% una vez aislados los impactos no recurrentes registrados y detallados en el trimestre anterior. Esta evolución viene impulsada por el crecimiento del margen de intereses, apoyado en la positiva evolución de los volúmenes medios y el reprecio al alza de los activos, así como por el
Cuenta de pérdidas y ganancias acumulada (en millones de € )
Margen de intereses
9M25
9M26
YoY (%)
-0,6
2.709
2.694
Comisiones netas
962
983
2,1
Margen básico
3.672
3.677
0,1
-15 136 -54
46 105 -51
--22,6 -6,3
Margen bruto
3.738
3.777
1,0
Gastos de explotación Gastos de personal Otros gastos generales de administración Amortización Total costes
-1.381 -893 -488 -265 -1.646
-1.492 -996 -496 -304 -1.797
8,1 11,6 1,7 14,7 9,1
-1.646
-1.709
3,8
0
-88
--
2.092
1.981
-5,3
-296 -24 -47 -17
-385 -41 8 277
30,0 69,6
1.708
1.840
7,7
-559 1
-539 3
-3,5 185,0
1.148
1.297
13,0
Aportación neta TSB
242
79
--
Beneficio neto con TSB
1.390
1.376
--
Resultados operaciones financieras y diferencias de cambio Resultados método participación y dividendos Otros productos y cargas de explotación
Promemoria: Costes recurrentes Costes no recurrentes
Margen antes de dotaciones Dotaciones para insolvencias Dotaciones a otros activos financieros Otras dotaciones y deterioros Plusvalías por venta de activos y otros resultados
Resultado antes de impuestos Impuesto sobre beneficios Resultado atribuido a intereses minoritarios
Beneficio neto
Tercer trimestre de 2026
8
Cuenta de pérdidas y ganancias trimestral 3 T2 5
4 T2 5
1T 2 6
2 T2 6
3 T2 6
Qo Q ( % )
Margen de intereses
899
895
872
902
920
2,0
Co misio nes netas
314
332
315
328
340
3,7
Margen básico
1.213
1.227
1.187
1.230
1.260
2,4 82,3
(en millo nes de €)
Resultado s o peracio nes financieras y diferencias de cambio
-31
-4
1
16
29
Resultado s méto do participació n y dividendo s
34
45
24
41
40
-3,9
Otro s pro ducto s y cargas de explo tació n
-11
-56
-17
-20
-14
-30,2
Margen bruto
1.204
1.212
1.195
1.267
1.315
3,7
Gasto s de explo tació n
-470
-486
-523
-501
-468
-6,7
Gasto s de perso nal
-301
-315
-361
-333
-302
-9,4
Otro s gasto s generales de administració n
-169
-171
-162
-168
-166
-1,2
-91
-119
-100
-102
-102
0,1
-561
-605
-624
-603
-570
-5,5
-561
-605
-569
-570
-570
-0,1
0
0
-55
-33
0
-100,0
Margen antes de dotaciones
643
608
572
664
745
12,2
Do tacio nes para inso lvencias
-117
-130
-120
-137
-127
-7,2
Do tacio nes a o tro s activo s financiero s
-3
-14
-18
-15
-7
-50,6
Otras do tacio nes y deterio ro s
-6
20
5
0
2
--
P lusvalías po r venta de activo s y o tro s resultado s
-4
-20
0
280
-3
--
Resultado antes de im puestos
513
463
438
792
610
-23,0
Impuesto so bre beneficio s
-169
-153
-152
-183
-204
11,8
0
1
2
1
0
-100,0
Beneficio neto
344
310
284
608
405
-33,3
Aportación neta TSB
70
76
63
16
0
--
Beneficio neto con TSB
414
386
347
624
405
--
Margen de intereses:
Margen de clientes y margen sobre ATMs:
El margen de intereses se sitúa en 2.694 millones de euros a septiembre de 2026, un 0,6% inferior al registrado un año antes, como resultado del impacto de la evolución de los tipos de interés sobre el rendimiento de los activos, que ha neutralizado el efecto positivo del crecimiento de los volúmenes. El crecimiento trimestral del margen de intereses, del 2,0%, refleja la positiva evolución de los volúmenes medios y el reprecio al alza de los activos, que compensan el aumento del coste de los recursos.
El margen de clientes se sitúa en el 2,86% al cierre del tercer trimestre de 2026, con una mejora de 2 pbs en el trimestre y una reducción de 5 pbs comparado con el mismo periodo del año anterior. La mejora trimestral viene impulsada por el mayor rendimiento del crédito, asociado al reprecio de la cartera, que compensa el incremento del coste de los recursos de clientes. Respecto al tercer trimestre del año anterior, el mayor coste de los recursos supera el efecto positivo del aumento del rendimiento del crédito.
A mo rtizació n To tal co stes P ro memo ria:
0
Co stes recurrentes Co stes no recurrentes
Resultado atribuido a intereses mino ritario s
Por su parte, el margen sobre activos totales medios mejora en 2 pbs tanto en el trimestre como respecto al mismo periodo del año anterior.
Evolución del margen (en %)
2,91%
2,88%
2,85%
2,84%
2,86% Margen de clientes
Margen de intereses sobre ATM 1,79%
1,83%
1,78%
1,79%
1,81%
3T25
4T25
1T26
2T26
3T26
Tercer trimestre de 2026
9
Evolución del margen de intereses
899
895
872
902
920
3T25
4T25
1T26
2T26
3T26
Variación YoY:
-0,6%
Variación QoQ:
+2,0%
Evolución trimestral del margen de intereses (millones €)
+3
+24
-9
920
902
2T26
Margen de intereses de clientes
Número de días
Cartera de renta fija, liquidez, coste financiación mayorista y otros
3T26
Rendimientos y cargas trimestrales 3 T2 5 S a l do
(en millones de €) Efectivo y equivalentes (1 ) Crédito a la clientela (neto) Cartera de renta fija Otros activos
Total activos Entidades de crédito (2) Depósitos de la clientela M ercado de capitales Otros pasivos y recursos propios
Total recursos
m e di o
28.256 118.000 34.496 17.602
198.354
4 T2 5 S a l do
Ti po %
R t dos
2,39 3,68 2,99 0,65
170 1.093 260 29
21.926 119.104 34.893 17.632
3,10 1.552
193.554
m e di o
1T 2 6 S a l do
Ti po %
R t dos
2,41 3,64 2,97 0,26
133 1.093 261 12
24.989 119.374 36.348 17.926
3,07 1.499
198.637
m e di o
2 T2 6 S a l do
Ti po %
R t dos
2,21 3,63 2,94 0,20
136 1.070 263 9
25.246 122.190 37.564 16.957
3,02 1.478
201.957
m e di o
3 T2 6 S a l do
Ti po %
R t dos
2,22 3,62 2,86 0,53
140 1.104 268 22
23.573 123.842 37.393 16.593
3,05 1.534
201.401
m e di o
Ti po %
R t dos
2,39 3,70 2,88 0,59
142 1.155 272 25
3,14 1.593
28.405 126.488 21.808 21.652
-2,48 -0,77 -3,08 -1,13
-177 -244 -169 -62
22.600 128.014 21.446 21.495
-2,54 -0,76 -2,99 -0,98
-145 -244 -161 -53
25.018 131.932 21.536 20.151
-2,40 -0,78 -3,00 -0,90
-148 -253 -159 -45
27.084 132.854 20.754 21.265
-2,37 -0,78 -3,17 -0,94
-160 -258 -164 -50
25.182 134.768 21.078 20.372
-2,51 -0,84 -3,38 -0,99
-159 -284 -180 -51
198.354
-1,31
-652
193.554
-1,24
-604
198.637
-1,24
-605
201.957
-1,26
-632
201.401
-1,33
-673
Margen de intereses
899
895
872
902
920
Margen de clientes
2,91
2,88
2,85
2,84
2,86
Margen de intereses sobre ATM
1,79
1,83
1,78
1,79
1,81
(1) (2)
Incluye caja, bancos centrales, entidades de crédito y adquisiciones temporales de activos. Incluye las cesiones temporales de activos.
Resultados por operaciones financieras y diferencias de cambio: A cierre de septiembre de 2026, este epígrafe alcanza los 46 millones de euros, por encima del registrado en el mismo periodo del año anterior, impulsado por unos mayores resultados de derivados y por la mayor aportación de BSCapital. En comparación con el trimestre precedente, el crecimiento viene explicado principalmente por la positiva evolución del resultado de derivados.
Comisiones netas: Las comisiones netas ascienden a 983 millones de euros a septiembre de 2026, un 2,1% más que en el mismo periodo del año anterior. Esta evolución refleja la mayor contribución de las comisiones de gestión de activos y seguros. En el trimestre, las comisiones de fondos de inversión impulsan el crecimiento del 3,7% del total de comisiones, estando impactadas positivamente por el nuevo acuerdo con Amundi. Las comisiones de servicios y las relacionadas con operaciones de riesgos se mantienen estables, pese a la estacionalidad negativa del trimestre.
Tercer trimestre de 2026
10
Evolución de las comisiones 315
328
340
72
65
67
68
159
158
169
168
82
101
93
92
103
3T25
4T25
1T26
2T26
3T26
314
65
166
332
Gestión de activos y seguros
Servicios
Variación YoY:
+2,1%
Variación QoQ:
+3,7%
Operaciones de riesgo
Comisiones 2 T2 6
3 T2 6
Qo Q ( % )
9M 25
9M 26
Y oY (% )
Operaciones de activo
42
45
5,7
130
129
-1,0
Avales y otras garantías
24
24
-2,8
72
71
-1,7
Com isiones derivadas de operaciones de riesgo
67
68
2,6
202
200
-1,3
M edios de pago
46
50
8,2
137
136
-0,5
Órdenes de pago
15
15
-2,4
48
44
-8,7
Valores
19
18
-4,2
51
55
7,1
Cuentas a la vista
54
60
10,0
165
170
2,7
Cambio de billetes y divisas
19
20
2,1
63
58
-8,8
Resto
16
6
-59,0
44
32
-27,8
169
168
-0,5
510
495
-2,9
Fondos de inversión
33
45
36,8
92
110
19,4
Comercialización de fondos pensiones y seguros Gestión de patrimonios
49
47
-3,7
128
147
15,0
10
11
9,9
31
31
2,0
Gestión de activos y seguros
92
103
12,4
251
288
15,0
Total com isiones
328
340
3,7
962
983
2,1
(en millones de €)
Com isiones de servicios
Resultados método participación y dividendos:
Total costes:
Este epígrafe se sitúa en 105 millones de euros a septiembre de 2026, por debajo del registrado en el mismo periodo del año anterior, principalmente por la menor aportación del negocio asegurador, afectado por la volatilidad de los mercados. En términos trimestrales, la evolución se mantiene estable respecto al trimestre anterior.
El total de costes se sitúa en -1.797 millones de euros a cierre de septiembre de 2026, donde se incorporan -88 millones de euros de costes no recurrentes derivados de iniciativas de eficiencia en España registrados en el primer semestre del año. Por su parte, los costes recurrentes incrementan un 3,8% interanual, destacando el aumento de las amortizaciones, impactadas por la reclasificación, desde la línea de dotaciones, de gastos asociados a activos del negocio de pagos (Paycomet) en el cuarto trimestre de 2025 tras no materializarse su venta . Aislando este impacto, los costes recurrentes incrementan un 2,7% interanual.
Otros productos y cargas de explotación: Se sitúan en -51 millones de euros a cierre de septiembre de 2026, presentando una mejora interanual de 3 millones de euros. En el trimestre se sitúan en -14 millones de euros.
Los costes disminuyen un 5,5% en términos trimestrales, reflejando el impacto del registro en el segundo trimestre de -33 millones de euros de costes no recurrentes. Excluyendo este efecto, los costes recurrentes se mantienen estables respecto al trimestre anterior.
Tercer trimestre de 2026
11
Total costes 2 T2 6
3 T2 6
Qo Q ( % )
9M 25
9M 26
Y oY (% )
Gastos de personal
-333
-302
-9,4
-893
-996
11,6
Informática y comunicaciones
-67
-67
0,2
-190
-201
5,9
Publicidad
-13
-14
4,5
-48
-41
-15,3
Inmuebles e instalaciones
-11
-10
-15,6
-25
-29
16,8
Informes técnicos y gastos judiciales
-6
-11
64,7
-30
-24
-19,2
(en millones de €)
Servicios administrativos subcontratados
-18
-19
5,5
-56
-57
2,3
Contribuciones e impuestos
-29
-25
-13,5
-86
-81
-6,2
Otros
-23
-21
-9,8
-52
-62
19,1
Otros gastos generales de adm inistración
-168
-166
-1,2
-488
-496
1,7
Am ortización
-102
-102
0,1
-265
-304
14,7
Total costes
-603
-570
-5,5
-1.646
-1.797
9,1
-570
-570
-0,1
-1.646
-1.709
3,8
-33
0
-100,0
0
-88
--
44,0
47,6
P ro memo ria: Co stes recurrentes Co stes no recurrentes Ratio de eficiencia (incluye co stes no recurrentes) (%)
Evolución de total costes
0
0
0
91
119
624 55 100
169
171
162
167
166
301
315
307
301
302
3T25
4T25
1T26
2T26
3T26
561
605
Gastos de personal recurrentes Amortización recurrente
Variación YoY:
+3,8% (1)
Variación QoQ:
-0,1% (1)
603 33 102
570
102
Otros gastos generales recurrentes Costes no recurrentes
(1) Variación sobre el total de costes recurrentes.
Dotaciones para insolvencias y otros deterioros: Las dotaciones totalizan -418 millones de euros a septiembre de 2026, lo que supone un incremento respecto al mismo periodo del año anterior, debido a unas mayores dotaciones por riesgo de crédito, que compensan la mejora registrada en las provisiones de inmuebles y gastos de gestión de NPAs. En términos trimestrales, las dotaciones muestran una evolución favorable, por el menor volumen de dotaciones por riesgo de crédito. Con este nivel de dotaciones, el coste del riesgo de crédito se sitúa en 32 pbs a cierre de septiembre de 2026 y el coste del riesgo total asciende a 40 pbs. Plusvalías por venta de activos y otros resultados: A cierre de septiembre de 2026, en este epígrafe se registran principalmente 331 millones de euros brutos relacionados con la venta de TSB y -45 millones de euros brutos/netos
relacionados con la venta de una participación accionarial, ambos contabilizados en el segundo trimestre del año. Tanto en este trimestre como en el mismo periodo del año anterior, se registran write off de activos, que impactan negativamente en la evolución del epígrafe. Beneficio neto: A cierre de septiembre de 2026, el beneficio neto alcanza los 1.297 millones de euros, representando un incremento del 13,0% interanual. Teniendo en cuenta la aportación neta de TSB de los cuatro primeros meses del ejercicio, el beneficio asciende a 1.376 millones de euros. Aislando los 201 millones de euros netos de impactos no recurrentes registrados y comentados en el primer semestre, el beneficio neto presenta una reducción interanual del 5,3% y un incremento en el trimestre del 12,9%.
Tercer trimestre de 2026
12
Evolución del balance Aspectos relevantes: El crédito vivo presenta una evolución positiva en términos interanuales apoyado en la evolución positiva de todos los segmentos, con un buen comportamiento tanto en España como en los negocios internacionales. En la comparativa trimestral la inversión registra una ligera reducción afectada por la estacionalidad.
balance. Dentro de estos últimos, destacan especialmente los fondos de inversión, así como la positiva evolución de la actividad de gestión de patrimonios. En términos trimestrales, los recursos de clientes mantienen una evolución favorable, apoyada principalmente en el crecimiento de los recursos fuera de balance.
Los recursos de clientes registran un crecimiento interanual, impulsado tanto por la evolución favorable de los recursos en balance como por el aumento de los recursos fuera de
Préstamos y anticipos a la clientela: La inversión crediticia bruta viva se sitúa en 124.913 millones de euros a septiembre de 2026, lo que supone un crecimiento interanual del 4,0%. En términos trimestrales, la inversión se ve afectada por la estacionalidad, registrando una ligera reducción del 0,2%. En el perímetro España, la inversión crediticia bruta viva crece un 2,1% en términos interanuales, apoyada en el crecimiento de la cartera hipotecaria y en crédito al consumo, mientras que en el trimestre muestra una reducción del 0,6%.
En el perímetro España, incluyendo las oficinas en el extranjero, la inversión crediticia bruta viva crece un 3,4% en términos interanuales y se reduce un 0,3% en el trimestre. México presenta un incremento del 19,0% interanual y del 0,8% en el trimestre, impactados por la evolución del dólar y del peso mexicano. A tipo de cambio constante, el crecimiento interanual se sitúa en el 14,4%, mientras que la variación trimestral alcanza el 2,8%, reflejando la positiva evolución del negocio.
La inversión crediticia bruta viva de las oficinas en el extranjero (Europa y Miami) asciende a 13.004 millones de euros a septiembre de 2026, lo que supone un crecimiento interanual del 15,7%, impulsado principalmente por la positiva evolución de la cartera de Miami. En términos trimestrales, la inversión aumenta un 2,4%, apoyada en el crecimiento registrado por las oficinas de Europa.
Préstamos y anticipos a la clientela (en millones de €) Préstamos y créditos con garantía hipotecaria Préstamos y créditos con otras garantías reales Crédito comercial Arrendamiento financiero Deudores a la vista y varios
Inv e rs ió n c re dit ic ia brut a v iv a Activos stage 3 (clientela) Ajustes por periodificación
Inv e rs ió n c re dit ic ia brut a de c lie nt e s s in a dquis ic ió n t e m po ra l de a c t iv o s Adquisición temporal de activos
Inv e rs ió n c re dit ic ia brut a de c lie nt e s Correcciones de valor por deterioro de activos
P ré s t a m o s y a nt ic ipo s a la c lie nt e la
V ar iació n Y o Y ( %) Qo Q ( %) 4,7 1,7 42,1 -1,3 1,8 -2,1 4,7 -1,1 0,2 -1,5
3 0 .0 9 .2 5 50.343 4.956 8.481 2.611 53.712
3 0 .0 6 .2 6 51.824 7.134 8.821 2.764 54.642
3 0 .0 9 .2 6 52.689 7.041 8.632 2.734 53.816
12 0 .10 3
12 5 .18 4
12 4 .9 13
4 ,0
- 0 ,2
3.367 200
3.145 175
3.061 279
-9,1 39,7
-2,7 59,9
12 3 .6 7 0
12 8 .5 0 4
12 8 .2 5 3
3 ,7
- 0 ,2
0
0
56
--
--
12 3 .6 7 0
12 8 .5 0 4
12 8 .3 0 9
3 ,8
- 0 ,2
-2.374
-2.196
-2.188
-7,8
-0,4
12 1.2 9 7
12 6 .3 0 8
12 6 .12 1
4 ,0
- 0 ,1
Tercer trimestre de 2026
13
Inversión crediticia bruta viva por segmento, 30.09.26 (en %)
(en millones de € ) Hipotecas Crédito al consumo Pymes y grandes empresas Sector público Otra financiación
30.09.26 40.716 5.880 45.599 11.989 2.250
Variación YoY (%) 3,5% 12,7% -0,4% 5,2% -11,0%
QoQ (%) 1,3% 4,5% -0,1% -4,4% -26,1%
Total España excluyendo OFEX
106.434
2,1%
-0,6%
5.150 7.854
14,5% 16,6%
4,0% 1,3%
119.438
3,4%
-0,3%
México
5.475
19,0%
0,8%
Total
124.913
4,0%
-0,2%
OFEX EMEA Miami
Total España incluyendo OFEX
Pasivo: Recursos de clientes: El total de recursos de clientes asciende a 189.449 millones de euros a septiembre de 2026, lo que representa un crecimiento del 5,6% interanual y del 0,7% respecto al trimestre anterior. Los recursos de clientes en balance totalizan 133.569 millones de euros, con un crecimiento interanual del 4,6%, impulsado por la favorable evolución tanto de las cuentas a la vista como de los depósitos a plazo. En términos trimestrales, los recursos en balance registran un ligero incremento del 0,1%. Los saldos de cuentas a la vista ascienden a 110.726 millones de euros, lo que supone un crecimiento del 3,3% respecto al mismo periodo del año anterior y del 0,6% en el trimestre. Por su parte, los depósitos a plazo alcanzan los 22.381 millones de euros, un 11,0% más que un año antes, mientras que en términos trimestrales registran una disminución del 1,7%, compensada por el crecimiento de otras categorías de recursos de clientes.
Los recursos de clientes fuera de balance ascienden a 55.880 millones de euros a septiembre de 2026, lo que supone un crecimiento interanual del 8,1%. Esta evolución viene impulsada por la favorable dinámica de los fondos de inversión, apoyada en las suscripciones netas positivas, así como por el buen comportamiento de la actividad de gestión de patrimonios. En términos trimestrales, los recursos fuera de balance aumentan un 2,1%, sustentados en estas mismas líneas de negocio.
Recursos gestionados y comercializados: Totalizan 215.198 millones de euros a septiembre de 2026, lo que supone un crecimiento del 1,6% interanual y del 1,1% en el trimestre. Estas variaciones se encuentran afectadas por la evolución de las cesiones temporales de activos. Aislando dicho impacto, los recursos gestionados y comercializados registran un crecimiento del 4,6% respecto al mismo periodo del año anterior y del 0,5% frente al trimestre precedente.
Tercer trimestre de 2026
14
Depósitos de la clientela, 30.09.26 (en %) (*)
Evolución de los recursos de clientes (en millones de €) 184.692
184.768
188.106
189.449
20.949
21.066
22.154
22.740
31.023
31.707
31.464
32.571
33.141
127.660
132.037
132.239
133.380
133.569
Sep 25
Dic 25
Jun 26
Sep 26
179.330 20.647
Depósitos a plazo 16%
Cesión temporal de activos 4%
Cuentas a la vista 80% (*) Sin ajustes por periodificación ni cobertura con derivados.
Mar 26
Recursos de clientes en balance
Fondos de inversión
Otros recursos fuera de balance (1)
Recursos de clientes en balance
4,6% 0,1%
Variación YoY: Variación QoQ: Total recursos de clientes
5,6% 0,7%
Variación YoY: Variación QoQ:
(1) Incluye fondos de pensiones, seguros comercializados y gestión de patrimonios.
Recursos de clientes V a ria c ió n Y o Y ( %) Q o Q ( %)
(en millones de €)
3 0 .0 9 .2 5
3 0 .0 6 .2 6
3 0 .0 9 .2 6
Pasivos financieros a coste amortizado
179.252
183.639
182.912
2,0
-0,4
51.591 0 13.784 32.426 5.381
50.259 440 18.247 24.677 6.896
49.344 0 18.198 25.749 5.396
-4,4 -32,0 -20,6 0,3
-1,8 -100,0 -0,3 4,3 -21,8
127.660
133.380
133.569
4,6
0,1
138.800 107.142 20.165 11.303 190
137.168 110.100 22.769 4.134 165
138.793 110.726 22.381 5.514 172
0,0 3,3 11,0 -51,2 -9,5
1,2 0,6 -1,7 33,4 4,4
17.039 4.247
17.626 3.263
17.278 3.248
1,4 -23,5
-2,0 -0,5
160.086
158.057
159.318
-0,5
0,8
Fo ndo s de inversió n So ciedades de inversió n IIC co mercializadas no gestio nadas
31.023 784 30.238
32.571 920 31.651
33.141 953 32.188
6,8 21,5 6,4
1,7 3,5 1,7
Gestió n de patrimo nio s
5.538
6.892
7.433
34,2
7,8
Fo ndo s de pensio nes Individuales Empresas A so ciativo s
3.386 2.169 1.213 4
3.537 2.267 1.267 4
3.482 2.229 1.249 4
2,8 2,8 3,0 1,5
-1,6 -1,7 -1,4 -2,1
Seguro s co mercializado s
11.723
11.725
11.825
0,9
0,9
Recursos fuera de balance
51.670
54.726
55.880
8,1
2,1
Recursos gestionados y comercializados
211.756
212.782
215.198
1,6
1,1
P asivo s financiero s sin naturaleza mino rista Depó sito s de banco s centrales Depó sito s de entidades de crédito Emisio nes institucio nales Otro s pasivo s financiero s
Recursos de clientes en balance Depó sito s de la clientela Cuentas a la vista Depó sito s a plazo Cesió n tempo ral de activo s A justes po r perio dificació n y co bertura co n derivado s Empréstito s y o tro s valo res nego ciables P asivo s subo rdinado s
(1)
(1) (1)
(1) (2)
Recursos en balance
(1)
(2)
0
0
Los recursos de clientes en balance a 30.09.26 incluyen 110.726 millones de euros de cuentas a la vista (110.100 millones de euros a 30.06.26 y 107.142 millones de euros a 30.09.25), 22.226 millones de euros de depósitos a plazo excluyendo cédulas multicedente, depósitos subordinados y Yankee CD (22.653 millones de euros a 30.06.26 y 20.099 millones de euros a 30.09.25), y 617 millones de euros de emisiones retail (pagarés), incluidos en Empréstitos y otros valores negociables (626 millones de euros a 30.06.26 y 419 millones de euros a 30.09.25). Se trata de los pasivos subordinados de los valores representativos de deuda.
Tercer trimestre de 2026
15
Patrimonio neto: La siguiente tabla muestra la evolución del patrimonio neto a cierre de septiembre de 2026: Patrimonio Neto V a ria c ió n (en millo nes de €)
3 0 .0 9 .2 5
3 0 .0 6 .2 6
3 0 .0 9 .2 6
Yo Y
Qo Q
Fondos propios
14.654
12.381
12.401
-2.253
20
Capital
628
611
596
-32
-15
Reservas
12.987
11.055
10.663
-2.324
-392
Otro s elemento s de patrimo nio neto
26
18
18
-8
1
M eno s: accio nes pro pias
-27
-273
-253
-226
20
B eneficio atribuido al grupo
1.390
971
1.376
-14
405
M eno s: dividendo s a cuenta
-350
0
0
350
0
-576 35
-244 38
-424 37
152 2
-180 -1
14.112
12.175
12.013
-2.099
-161
Otro resultado global acum ulado Intereses de m inoritarios
Patrimonio neto
Tercer trimestre de 2026
16
Gestión del riesgo Aspectos relevantes: La calidad de los activos continúa mejorando, donde la ratio de morosidad se reduce hasta el 2,40% y la ratio de cobertura stage 3 con el total de provisiones incrementa y se sitúa en el 70,1% a septiembre de 2026. Los activos problemáticos muestran una reducción de 140 millones de euros en el trimestre, siendo la reducción del saldo de stage 3 de 92 millones de euros y el de los activos inmobiliarios problemáticos de 48 millones de euros. En los últimos doce meses, el saldo de activos problemáticos se reduce en 477 millones de euros, de los que 336 millones de euros corresponden a saldo de stage 3 y 141 millones de euros a activos inmobiliarios problemáticos.
La cobertura de activos problemáticos incrementa en el trimestre hasta el 64,7%. En cuanto al desglose del crédito por stages, destacar que el crédito en stage 2 representa el 3,8% del total siendo su cobertura del 4,7%, mientras que el crédito en stage 3 representa un 2,4%, con una cobertura del 53,5%.
Gestión del riesgo: Los activos problemáticos presentan un saldo de 3.886 millones de euros a cierre de septiembre de 2026, de los que 3.298 millones de euros corresponden a activos stage 3 y 588 millones de euros a activos inmobiliarios problemáticos.
Ratio de morosidad (en %) (*)
La ratio de NPAs bruta se reduce hasta el 2,8%, mientras que la ratio de NPAs neta hasta el 1,0%.
Ratios de cobertura stage 3 con el total de provisiones (en %) (*)
7 6 9 8 0 , 3 4 7 1 6 4 3 0
2,75
2,65
2,55
2,47
2,40
69,34
69,46
70,74
68,73
70,10
Sep 25
Dic 25
Mar 26
Jun 26
Sep 26
Sep 25
Dic 25
Mar 26
Jun 26
Sep 26
(*) Calculado incluyendo riesgos contingentes.
Ratio de morosidad por segmentos (*) Sep 25
D ic 2 5
M ar 26
J un 2 6
Hipo tecas
1,96%
1,89%
1,60%
1,57%
1,50%
Crédito al co nsumo
5,64%
5,10%
5,31%
5,10%
5,26%
P ymes y grandes empresas
3,93%
3,69%
3,52%
3,47%
3,31%
Resto
1,29%
1,52%
1,72%
1,61%
1,62%
2,75%
2,65%
2,55%
2,47%
2,40%
Ratio de morosidad
Sep 26
(*) Calculado incluyendo riesgos contingentes.
Tercer trimestre de 2026
17
Evolución activos stage 3 (millones €) (*)
Evolución activos inmobiliarios problemáticos (millones €) (*)
-9% YoY
-19% YoY 3.634
3.491
3.411
3.390
3.298
729
684
659
636
588
Sep 25
Dic 25
Mar 26
Jun 26
Sep 26
Sep 25
Dic 25
Mar 26
Jun 26
Sep 26
Composición activos inmobiliarios problemáticos (en %)
Evolución activos problemáticos (millones €) (*) -11% YoY
Edificios en construcción 0,2%
Suelo 7%
Edificios terminados 93%
4.363
4.176
4.070
4.025
3.886
Sep 25
Dic 25
Mar 26
Jun 26
Sep 26
(*) Calculado incluyendo riesgos contingentes.
La siguiente tabla muestra la evolución de los activos problemáticos de los últimos trimestres: Variación trimestral de activos problemáticos (en millo nes de €)
3T 25
4T 25
1T 2 6
2T 26
Entradas brutas
426
509
494
538
290
Recuperacio nes y ventas
-379
-562
-508
-460
-291
Entrada neta ordinaria (stage 3)
47
-53
-14
78
-1
3T 26
Entradas brutas
14
5
4
6
2
Ventas
-58
-50
-30
-29
-50
Variación activos inmobiliarios problemáticos
-44
-45
-26
-23
-48
3
-98
-40
54
-48
Entrada neta ordinaria (stage 3) + Variación activos inmobiliarios problemáticos Fallido s
-87
-90
-66
-99
-92
Variación trimestral de activos problemáticos
-84
-188
-106
-44
-140
Tercer trimestre de 2026
18
Evolución de activos problemáticos (*) (en millones de € ) Riesgos stage 3
Sep 25
Dic 25
Mar 26
Jun 26
Sep 26
3.634
3.491
3.411
3.390
3.298
Total provisiones
2.520
2.425
2.413
2.330
2.312
69,3%
69,5%
70,7%
68,7%
70,1%
3.634
3.491
3.411
3.390
3.298
Ratio de cobertura stage 3 con total provisiones (%) Riesgos stage 3 Provisiones stage 3
1.938
1.834
1.862
1.781
1.766
53,3%
52,5%
54,6%
52,5%
53,5%
Activos inmobiliarios problemáticos
729
684
659
636
588
Provisiones
272
251
239
222
204
37,3%
36,6%
36,2%
34,9%
34,6%
Total activos problemáticos
4.363
4.176
4.070
4.025
3.886
Provisiones
2.791
2.675
2.651
2.552
2.515
Ratio de cobertura de activos problemáticos (%)
64,0%
64,1%
65,2%
63,4%
64,7%
Inversión crediticia bruta sin adquisición temporal de activos + garantías financieras y otras garantías concedidas + activos inmobiliarios problemáticos
132.862
132.338
134.430
137.998
137.754
3,3%
3,2%
3,0%
2,9%
2,8%
Ratio de cobertura stage 3 (%)
Ratio de cobertura de inmuebles problemáticos (%)
Ratio NPA bruta (%) Activos problemáticos netos
1.572
1.500
1.418
1.473
1.370
Ratio NPA neta (%) Activos problemáticos netos sobre total activos (%)
1,2% 0,8%
1,1% 0,8%
1,1% 0,7%
1,1% 0,7%
1,0% 0,7%
(*) Incluye riesgos contingentes. (1) La ratio NPA bruta se calcula como activos problemáticos brutos sobre inversión crediticia bruta sin adquisición temporal de activos y garantías concedidas más activos inmobiliarios problemáticos y la ratio NPA neta se calcula como activos problemáticos netos incluyendo todas las provisiones sobre inversión crediticia bruta sin adquisición temporal de activos y garantías concedidas más activos inmobiliarios problemáticos.
Desglose del crédito y provisiones por stages (en millones de € ) Inversión crediticia bruta sin adquisición temporal de activos y garantías financieras y otras garantías concedidas Variación QoQ Variación YoY Provisiones
% Stage s/ Total inversión Cobertura
Tercer trimestre de 2026
Stage 1
Stage 2
Stage 3
128.719
5.149
3.298
0,1% 5,2% 303
-4,4% -15,6% 243
-2,7% -9,3% 1.766
93,8% 0,2%
3,8% 4,7%
2,4% 53,5%
19
Gestión de la liquidez Aspectos relevantes: Banco Sabadell ha realizado una emisión de 500 millones de euros de cédulas hipotecarias en el primer trimestre de 2026 y una adicional de 750 millones de euros en el tercer trimestre del año. Adicionalmente ha realizado una emisión de 201 millones de euros de Senior Preferred en el segundo trimestre (emisión realizada por México en pesos mexicanos).
Sólida posición de liquidez donde la ratio LCR (Liquidity Coverage Ratio) se sitúa en 185% a cierre de septiembre de 2026, con una cifra total de activos líquidos de 52.199 millones de euros. La ratio de loan to deposit a cierre de septiembre de 2026 se sitúa en el 92,8% con una estructura de financiación minorista equilibrada.
30.09.25
30.06.26
30.09.26
121.297 -1.267
126.308 -2.811
126.066 -2.076
Crédito neto ajustado
120.030
123.497
123.990
Recursos de clientes en balance
127.660
133.380
133.569
94,0
92,6
92,8
(en millones de € ) Préstamos y anticipos a la clientela Créditos mediación
(1)
Loan-to-deposit ratio (%) (1)
Excluye las adquisiciones temporales de activos.
Estructura de financiación, 30.09.26 (en %)
Desglose mercado mayorista, 30.09.26 (en %) Emisiones retail 0%
Subordinadas 17% Yankee CD 1%
Deuda senior 36%
Titulizaciones 8%
Repos 11% Depósitos 77% Mercado mayorista 12% Otros bancos centrales 0%
BCE 0%
Cédulas hipotecarias 38%
Vencimientos S a ldo (en millo nes de €)
2026
2027
2028
2029
2030
2031
2 0 3 1
v iv o
Cédulas hipo tecarias
390
1.100
985
950
1.250
950
2.000
11.624
Senio r preferred
0
0
750
1.471
750
0
0
3.268
Senio r no n preferred
67
18
500
1.500
500
500
1.195
4.280
Subo rdinadas
0
0
0
0
0
0
1.015
1.515
457
1.118
2.235
3.921
2.500
1.450
4.210
15.891
Total
Nota: Los vencimientos de deuda excluyen las emisiones de AT1 e incluyen la amortización anticipada en las emisiones con fecha de amortización opcional cuando estas hayan sido ya anunciadas.
Detalle de nuevas emisiones del año (en millones de € ) Cédulas hipotecarias Senior preferred Total
1T26 500 0 500
2T26 0 201 201
Detalle de vencimientos del año 3T26 750 0 750
(en millones de € ) Cédulas hipotecarias Senior preferred Senior non preferred Subordinadas Total
Tercer trimestre de 2026
1T26 0 500 0 500 1.000
2T26 0 0 0 0 0
3T26 1.000 0 0 0 1.000
4T26 390 0 67 0 457
20
Gestión del capital y calificaciones crediticias Aspectos relevantes: La ratio CET1 fully-loaded* se sitúa en el 13,12% a cierre de septiembre de 2026. La ratio CET1 phase-in se sitúa en el 13,17% a cierre de septiembre de 2026, incrementando 1 pbs en el trimestre, donde la generación orgánica de capital se ve lastrada por el impacto negativo de los ajustes de valoración de la cartera de renta fija (-13 pbs). La ratio de Capital Total asciende al 18,11%, por lo que se sitúa por encima de los requerimientos regulatorios con un MDA buffer de 424 pbs. Los requerimientos mínimos prudenciales aplicables para septiembre de 2026 a Banco Sabadell tras el proceso de revisión y evaluación supervisora (SREP) se sitúan en el 8,92% para el CET1 y 13,34% para el Capital Total. La Leverage ratio phase-in asciende al 5,92%. La ratio MREL como % de los APR’s se sitúa en el 28,04%, superior al requerimiento vigente del 25,38%(1) y la ratio MREL como % de Leverage ratio exposure (LRE) se sitúa en el 10,15%, superior al requerimiento vigente del 6,26%.
Banco Sabadell ha recibido la decisión del Banco Central Europeo respecto a los requerimientos mínimos prudenciales que le son aplicables desde el 1 de enero de 2027, resultantes del proceso de revisión y evaluación supervisora (SREP). El requerimiento a nivel consolidado exige a Banco Sabadell mantener una ratio mínima de Common Equity Tier I (CET1 phased-in) del 9,24% y una ratio de Capital Total phased-in mínima de 13,61%. Estas ratios incluyen el requerimiento mínimo de Pilar 1 (8,00%, del que CET1 supone el 4,50%), el requerimiento de Pilar 2, que se ha visto reducido en 10 puntos básicos (2,00%, del que CET1 supone el 1,125%), el colchón de conservación de capital (2,50%), el requerimiento derivado de su consideración como “otra entidad de importancia sistémica” (0,25%) y el colchón anticíclico (0,86%). Tomando como referencia las ratios de capital a cierre de septiembre de 2026 y considerando los nuevos requerimientos regulatorios aplicables desde el 1 de enero de 2027, el MDA buffer se situaría en 393 pbs.
- Aplicando calendario regulatorio del output floor. (1) La ratio incluye el Combined Buffer Requirement, estimado en 3,24%.
Ratios de capital P ha s e - in (en millo nes de €)
F ully- lo a de d
3 0 .0 9 .2 5
3 0 .0 6 .2 6
3 0 .0 9 .2 6
3 0 .0 9 .2 5
3 0 .0 6 .2 6
Capital
628
611
596
628
611
596
Reservas
13.566
11.532
11.631
13.566
11.532
11.631
Deduccio nes
(1)
Recursos Common Equity Tier 1 CET 1 (% ) P articipacio nes preferentes y o tro s
3 0 .0 9 .2 6
-3.211
-2.833
-2.936
-3.206
-2.829
-2.931
10.983 13,80%
9.309 13,16%
9.291 13,17%
10.988 13,74%
9.313 13,11%
9.295 13,12%
2.750
2.250
2.250
2.750
2.250
2.250
Recursos Tier I Tier I (% )
13.733 17,25%
11.559 16,34%
11.541 16,35%
13.738 17,17%
11.563 16,28%
11.545 16,29%
Recursos Tier II Tier II (% )
1.796 2,26%
1.259 1,78%
1.242 1,76%
1.796 2,24%
1.259 1,77%
1.242 1,75%
Base de capital
15.529
12.818
12.783
15.533
12.823
12.787
Ratio total de capital (% )
19,51%
18,12%
18,11%
19,42%
18,05%
18,05%
Activos ponderados por riesgo (APR)
79.608
70.748
70.568
79.989
71.030
70.853
Leverage ratio (% )
5,64%
5,94%
5,92%
5,64%
5,95%
5,92%
CET 1 individual (% )
15,17%
13,98%
13,98%
Tier I individual (% )
18,86%
17,30%
17,32%
Tier II individual (% )
2,34%
1,85%
1,83%
Ratio total de capital individual (% )
21,21%
19,14%
19,15%
4.711
3.597
3.883
ADIs
(2)
Nota: Ratio fully-loaded aplicando calendario regulatorio del output floor. A 30.09.2026 la ratio pay-out se mantiene en los mismos niveles c.60% (excluye la plusvalía por la venta de TSB). Conforme a las expectativas de los supervisores, las ratios regulatorias deberán reflejar una deducción en CET1 correspondiente a cualquier exceso sobre el umbral fijado en cada momento para distribuciones extraordinarias de capital (definido en términos de ratio fully-loaded aplicando el calendario regulatorio del output floor). (1) (2)
Incluye los ajustes transicionales de la normativa CRR3 (Basilea IV) a partir del 1 de enero de 2025. “Available Distributable Items”: Hace referencia al beneficio distribuible. No incluye el dividendo a cuenta ni la prima de emisión.
Tercer trimestre de 2026
21
Evolución de MREL (% APR, % LRE)
28,04%
10,15%
3,98%
1,44%
5,94%
2,15%
1,76% 3,19%
0,64% 1,15%
Senior preferred Senior non preferred Tier 2 AT1 CET 1
13,17%
4,76%
Sep 26 % APR
Sep 26 % LRE
Calificaciones de las agencias de rating Agencia S&P Global Ratings Moody's Ratings (2) Fitch Ratings Morningstar DBRS
(1)
Fecha
Largo Plazo
Corto plazo
Perspectiva
16.12.2025 10.06.2026 08.07.2026 17.02.2026
ABaa1 AA (low )
A-2 A2 F2 R-1 (low )
Positiva Estable Estable Estable
(1) Copyright by Standard & Poor’s, A division of the M cGraw-Hill Companies, Inc. Reproduced with permission of Standard & Poor’s. (2) El rating a corto plazo corresponde a los depósitos.
El grupo mantiene la categoría de grado de inversión (investment grade, por su denominación en inglés) por parte de todas las agencias de rating que lo califican. Con fecha 16 de diciembre de 2025 S&P Global Ratings mejoró la perspectiva desde estable a positiva, afirmando el rating de crédito del emisor a largo y corto plazo en 'A-/A-2' respectivamente. La mejora de la perspectiva reflejaba la posibilidad de que S&P Global Ratings mejore el rating de Banco Sabadell en el caso de que la entidad alcance y mantenga un colchón suficiente de instrumentos subordinados con capacidad de absorción de pérdidas (que supere el 6%), de manera que, en un escenario de resolución, ofrezca protección adicional a los bonistas de deuda senior. Con fecha 10 de junio de 2026, Moody’s Ratings confirmó la calificación de los depósitos de Banco Sabadell en 'A2'/'Prime-1' y la calificación de la deuda senior unsecured en 'Baa1'. La perspectiva de los depósitos a largo plazo fue mejorada de estable a positiva, mientras que la perspectiva de la deuda senior unsecured se mantuvo estable. La perspectiva positiva de los depósitos a largo plazo refleja la expectativa de Moody’s de que la calidad de los activos del Banco continuará mejorando, con la ratio de activos problemáticos (NPA) descendiendo por debajo del 3% durante el periodo de revisión de la perspectiva. La perspectiva positiva también incorpora una rentabilidad estable con un margen de intereses retomando el crecimiento trimestral en el segundo trimestre de 2026.
Con fecha 8 de julio de 2026 Fitch Ratings confirmó el rating a largo plazo de Banco Sabadell en 'A-' con perspectiva estable. En opinión de Fitch, la estrategia del Banco para el período 2025-2027 se está ejecutando correctamente, lo que está dando lugar a un aumento sostenible de los volúmenes de negocio y de los beneficios. Esto se ve favorecido por el entorno de crecimiento económico en España y por unas menores provisiones, derivadas de la mejora de la calidad de los activos. Las calificaciones también tienen en consideración la amplia solvencia del Banco. El rating a corto plazo se mantuvo en ‘F2'. Con fecha 17 de febrero de 2026, Morningstar DBRS confirmó el rating a largo plazo de Banco Sabadell en 'A (low)' con perspectiva estable, reflejando la mejora de la rentabilidad, la cual se ve beneficiada por unos tipos de interés más elevados, el crecimiento del crédito, la disciplina de costes y el descenso del coste del riesgo. Asimismo, la agencia destaca la amplia posición de capital, liquidez y la diversificación de la estructura de financiación. El rating a corto plazo se mantuvo en 'R-1 (low)'.
Tercer trimestre de 2026
22
Resultados por unidades de negocio ofreciendo al mismo tiempo un grado de compromiso total. Las grandes empresas se gestionan básicamente por oficinas especializadas. El resto de empresas, que incluyen pymes, negocios y autónomos, se gestionan desde las oficinas. Tanto unas como otras cuentan con gestores especializados en el segmento, así como con el asesoramiento experto de especialistas de producto y/o sector. Todo ello permite a Banco Sabadell ser un referente para todas las empresas y líder en experiencia cliente. También se incluye Banca Privada que ofrece un asesoramiento personalizado y experto, respaldado con la capacidad de producto especialista y de alto valor para nuestros clientes.
Se presenta en este apartado información de los resultados y otros indicadores por unidades de negocio del grupo. Los criterios con los que grupo Banco Sabadell informa de los resultados por segmentos son: • •
Dos áreas geográficas: Negocio Bancario España y México. Tanto al Negocio bancario España como a México se le asigna un 13% de capital sobre sus activos ponderados por riesgo, asignando todas las deducciones correspondientes a cada unidad de negocio y el exceso de fondos propios se asigna al Negocio Bancario España.
En lo referente al resto de criterios aplicados, la información por segmentos se estructura, en primer lugar, siguiendo una distribución geográfica y, en segundo lugar, en función de los clientes a los que van dirigidos.
•
Banca Corporativa: A través de su presencia tanto en el territorio español como internacional en 6 países más, ofrece soluciones financieras y de asesoramiento a grandes corporaciones e instituciones financieras españolas e internacionales. Estructura su actividad en dos ejes: el eje cliente, cuyo objetivo es dar servicio a sus clientes naturales en todo el espectro de sus necesidades financieras, delimitado por el carácter de los mismos y que integra a las grandes corporaciones de Banca Corporativa; las instituciones financieras, la Banca Privada en USA, y el negocio de capital riesgo desarrollado a través de BSCapital y, en segundo lugar, el ámbito de los Negocios Especializados, que agrupa las actividades de Financiación Estructurada, Tesorería, Banca de Inversión y Contratación, Custodia y Análisis, cuyo objetivo es el asesoramiento, diseño y ejecución de operaciones a medida, que anticipen las necesidades financieras específicas de sus clientes, sean empresas o particulares, extendiendo su ámbito desde las grandes corporaciones a compañías y clientes de menor tamaño, en la medida en que sus soluciones constituyen la mejor respuesta a unas necesidades financieras cada vez más complejas.
•
Negocio bancario México: Ofrece servicios bancarios y financieros de Banca Corporativa, Banca Comercial y Banca de Particulares en México.
Segmentación por área geográfica y unidades de negocio •
Negocio bancario España: agrupa las unidades de negocio de Particulares, Empresas y Banca Corporativa, donde Particulares y Empresas se gestionan bajo la misma Red Comercial:
•
Banca Particulares: Es la unidad de negocio que ofrece productos y servicios financieros a personas físicas con destino particular. El negocio se basa en un modelo de banca que combina procesos de un banco digital para las interacciones que demandan autonomía, inmediatez y sencillez que ofrecen los canales digitales con una gestión comercial especializada y personalizada para aquellas interacciones en las que se demanda el acompañamiento experto, a través de la red comercial, tanto en las propias oficinas como a distancia. Entre los principales productos comercializados, destacan productos de inversión y financiación a corto, medio y largo plazo tales como préstamos al consumo, hipotecas y servicios de leasing o renting. Desde el punto de vista de los recursos, los principales productos ofrecidos son los depósitos y cuentas a la vista de los clientes, seguros de ahorro, fondos de inversión y planes de pensiones. Adicionalmente, entre los principales servicios también se encuentran los medios de pago como tarjetas y los productos de seguros en sus distintas modalidades.
•
Banca Empresas: A través de su presencia tanto en el territorio español como internacional en 3 países más, ofrece productos y servicios financieros a personas jurídicas y personas físicas con destino empresarial, atendiendo a todo tipo de empresas con facturación hasta 200 millones de euros, así como al sector institucional. Los productos y servicios que se ofrecen para las empresas se basan en soluciones de financiación para corto y largo plazo, soluciones para la gestión del excedente de tesorería, productos y servicios para garantizar la operativa diaria de cobros y pagos por cualquier canal y ámbito geográfico, así como productos de cobertura de riesgos y banca seguros. Banco Sabadell tiene claramente definido un modelo de relación para cada segmento de empresas, innovador y diferenciador de la competencia, que permite estar muy cerca del cliente adquiriendo un amplio conocimiento del mismo,
Tercer trimestre de 2026
Destacar que, durante los cuatro primeros meses del ejercicio, el Grupo ha contado con la contribución del negocio bancario en Reino Unido a través de la franquicia TSB, que integraba la actividad desarrollada en dicho mercado, incluyendo cuentas corrientes y de ahorro, crédito, tarjetas e hipotecas. La aportación neta de este negocio se presenta de forma agregada en una línea específica de la cuenta de resultados. La información que se presenta está basada en la contabilidad individual de cada una de las sociedades que forman el grupo, con las eliminaciones y los ajustes correspondientes de consolidación. Destacar que toda la información reportada hace referencia a información de gestión. Cada negocio soporta sus costes directos, obtenidos a partir de la contabilidad general.
23
Cuenta de resultados 9M26 (en millones de € )
Margen de intereses
Negocio bancario España
Negocio bancario México
Total
2.536
158
2.694
Comisiones netas
959
24
983
Margen básico
3.495
182
3.677
39 105 -29
7 0 -22
46 105 -51
Margen bruto
3.610
167
3.777
Gastos de explotación Amortización Total costes Promemoria: Costes recurrentes Costes no recurrentes
-1.425 -292 -1.717
-68 -12 -80
-1.492 -304 -1.797
-1.629 -88
-80 0
-1.709 -88
Margen antes de dotaciones
1.893
88
1.981
-402 277
-16 0
-418 277
1.768
72
1.840
-520 3
-19 0
-539 3
Beneficio neto Aportación neta TSB Beneficio neto con TSB
1.245 0 1.245
52 0 52
1.297 79 1.376
ROTE Eficiencia (incluye costes no recurrentes) Ratio de morosidad Ratio de cobertura stage 3 con total provisiones
15,9% 47,6% 2,4% 70,4%
9,8% 47,6% 2,6% 63,5%
15,5% 47,6% 2,4% 70,1%
Negocio bancario España
Negocio bancario México
Total
2.568
141
2.709
Resultados operaciones financieras y diferencias de cambio Resultados método participación y dividendos Otros productos y cargas de explotación
Total dotaciones y deterioros Plusvalías por venta de activos y otros resultados
Resultado antes de impuestos Impuesto sobre beneficios Resultado atribuido a intereses minoritarios
Cuenta de resultados 9M25 (en millones de € )
Margen de intereses Comisiones netas
945
17
962
Margen básico
3.513
159
3.672
-15 136 -34
0 0 -20
-15 136 -54
Margen bruto
3.600
138
3.738
Gastos de explotación Amortización Total costes
-1.318 -255 -1.573
-63 -11 -73
-1.381 -265 -1.646
Margen antes de dotaciones
2.027
65
2.092
-366 -13
-1 -3
-367 -17
1.648
60
1.708
-549 1
-10 0
-559 1
Beneficio neto Aportación neta TSB Beneficio neto con TSB
1.098 0 1.098
50 0 50
1.148 242 1.390
ROTE Eficiencia Ratio de morosidad Ratio de cobertura stage 3 con total provisiones
15,2% 43,7% 2,8% 69,3%
10,6% 53,0% 1,9% 70,8%
15,0% 44,0% 2,8% 69,3%
Negocio bancario España
Negocio bancario México
Total
Total activo
191.732
7.526
199.258
Inversión crediticia bruta viva Exposición inmobiliaria problemática
119.438 384
5.475 0
124.913 384
Total pasivo y patrimonio neto
191.732
7.526
199.258
Recursos de clientes en balance Financiación mayorista mercado capitales Fondos propios asignados
130.328 19.910 11.638
3.241 0 763
133.569 19.910 12.401
Recursos de clientes fuera de balance
55.880
0
55.880
Negocio bancario España
Negocio bancario México
Negocio bancario Reino Unido
Total
Total activo
185.879
6.561
52.088
244.529
Inversión crediticia bruta viva Exposición inmobiliaria problemática
115.500 457
4.603 0
40.967 0
161.070 457
Total pasivo y patrimonio neto
185.879
6.561
52.088
244.529
Recursos de clientes en balance Financiación mayorista mercado capitales Fondos propios asignados
124.396 19.439 11.475
3.264 0 757
40.119 6.171 2.422
167.780 25.610 14.654
Recursos de clientes fuera de balance
51.670
0
0
51.670
Resultados operaciones financieras y diferencias de cambio Resultados método participación y dividendos Otros productos y cargas de explotación
Total dotaciones y deterioros Plusvalías por venta de activos y otros resultados
Resultado antes de impuestos Impuesto sobre beneficios Resultado atribuido a intereses minoritarios
Balance sep 26 (en millones de € )
Balance sep 25 (en millones de € )
Tercer trimestre de 2026
24
Negocio bancario España El beneficio neto a cierre de septiembre de 2026 se sitúa en 1.245 millones de euros, incrementando así en un 13,4% interanual. Aislando los impactos extraordinarios registrados y comentados en el primer semestre, el beneficio neto presenta una reducción interanual del 4,9%.
Los resultados por el método de la participación y dividendos muestran una reducción interanual principalmente por la menor aportación del negocio asegurador, afectado por la volatilidad de los mercados. El total de costes incorpora ‑88 millones de euros de costes no recurrentes por iniciativas de eficiencia relacionadas con prejubilaciones registradas en el primer semestre. Los costes recurrentes presentan un aumento del 3,6% interanual, destacando el incremento de las amortizaciones, impactadas por la reclasificación desde la línea de dotaciones de gastos asociados a activos del negocio de pagos (Paycomet) en el cuarto trimestre de 2025 tras no materializarse su venta. Aislando este impacto, los costes recurrentes incrementan un 2,4% interanual.
El margen de intereses asciende a 2.536 millones de euros a cierre de septiembre de 2026, representando una reducción del 1,3% interanual, como resultado del impacto de la evolución de los tipos de interés sobre el rendimiento de los activos, que ha neutralizado el efecto positivo del crecimiento de los volúmenes. Las comisiones netas se sitúan en 959 millones de euros, un 1,5% por encima del cierre de septiembre del año anterior, explicado principalmente por la mayor contribución de las comisiones de gestión de activos y seguros.
En el epígrafe de plusvalías por ventas de activos y otros resultados se registran principalmente 331 millones de euros brutos relacionados con la venta de TSB y -45 millones de euros brutos/netos relacionados con la venta de una participación accionarial.
Los resultados por operaciones financieras y diferencias de cambio presentan un crecimiento impulsado por unos mayores resultados de derivados y por la mayor aportación de BSCapital.
Evolutivo Sim ple (en millones de € )
9M25
9M26
YoY (%)
1T25
2T25
3T25
4T25
1T26
2T26
3T26
Margen de intereses
2.568
2.536
-1,3
857
862
850
843
825
848
863
Comisiones netas
945
959
1,5
318
318
309
322
308
320
330
Margen básico
3.513
3.495
-0,5
1.175
1.180
1.158
1.166
1.133
1.169
1.193
Resultados operaciones financieras y diferencias de cambio
-15
39
--
25
-11
-29
-7
-3
16
26
Resultados método participación y dividendos
136
105
-22,6
61
41
34
45
24
41
40
Otros productos y cargas de explotación
-34
-29
-15,7
-23
-6
-5
-48
-10
-12
-6
3.600
3.610
0,3
1.238
1.204
1.158
1.156
1.144
1.214
1.252
-1.318
-1.425
8,1
-444
-426
-448
-466
-501
-478
-445
-255
-292
14,9
-82
-85
-87
-116
-96
-98
-98
-1.573
-1.717
9,2
-526
-512
-535
-581
-597
-577
-543
-1.573
-1.629
3,6
-526
-512
-535
-581
-543
-544
-543
0
-88
--
0
0
0
0
-55
-33
0
2.027
1.893
-6,6
712
692
622
575
546
637
709
Total dotaciones y deterioros
-366
-402
9,8
-129
-112
-124
-107
-130
-149
-123
Plusvalías por venta de activos y otros resultados
-13
277
--
-12
-1
-1
-20
0
280
-3
1.648
1.768
7,3
572
579
497
447
416
768
584
-549
-520
-5,2
-196
-186
-166
-151
-147
-177
-196
1
3
185,0
0
1
0
1
2
1
0
1.098
1.245
13,4
375
392
331
296
267
590
388
ROTE
15,2%
15,9%
15,3%
15,5%
15,2%
14,4%
13,6%
15,3%
15,9%
Eficiencia (incluye costes no recurrentes)
43,7%
47,6%
42,5%
42,5%
43,7%
45,3%
52,2%
49,8%
47,6%
Ratio de morosidad
2,8%
2,4%
3,1%
2,8%
2,8%
2,7%
2,6%
2,5%
2,4%
Ratio de cobertura stage 3 con total provisiones
69,3%
70,4%
67,3%
68,8%
69,3%
69,9%
71,2%
69,2%
70,4%
Margen bruto Gastos de explotación Amortización Total costes Promemoria: Costes recurrentes Costes no recurrentes
Margen antes de dotaciones
Resultado antes de impuestos Impuesto sobre beneficios Resultado atribuido a intereses minoritarios
Beneficio neto Ratios acumulados
Los recursos de clientes en balance incrementan un 4,8% interanual. Los recursos fuera de balance crecen un 8,1%, destacando los fondos de inversión, apoyados en suscripciones netas positivas, así como la favorable evolución de la actividad de gestión de patrimonios.
La inversión crediticia bruta viva incrementa un 3,4% interanual, creciendo en todos los segmentos.
Evolutivo Sim ple (en millones de € )
Sep 25
Sep 26
YoY (%)
Mar 25
Jun 25
Sep 25
Dic 25
Mar 26
Jun 26
Sep 26
Total activo
185.879
191.732
3,1
188.073
192.914
185.879
186.300
189.606
191.720
191.732
Inversión crediticia bruta viva
115.500
119.438
3,4
110.768
114.396
115.500
114.669
116.298
119.753
119.438
457
384
-16,0
484
467
457
434
420
413
384
Total pasivo y patrimonio neto
185.879
191.732
3,1
188.073
192.914
185.879
186.300
189.606
191.720
191.732
Recursos de clientes en balance
124.396
130.328
4,8
123.602
124.356
124.396
128.598
129.052
130.021
130.328
Financiación mayorista mercado capitales Fondos propios asignados
19.439 11.475
19.910 11.638
2,4 1,4
20.481 11.952
21.039 11.734
19.439 11.475
19.531 11.375
18.522 11.345
20.216 11.587
19.910 11.638
Recursos de clientes fuera de balance
51.670
55.880
8,1
47.591
49.318
51.670
52.656
52.529
54.726
55.880
Empleados
13.660
13.256
13.594
13.638
13.660
13.617
13.450
13.348
13.256
Oficinas
1.151
1.071
1.153
1.153
1.151
1.149
1.150
1.104
1.071
Exposición inmobiliaria problemática
Otros datos
Tercer trimestre de 2026
25
Negocio bancario México El beneficio neto se sitúa en 52 millones de euros a septiembre de 2026, lo que representa un crecimiento interanual del 4,3%, favorecido por la apreciación del peso mexicano. A tipo de cambio constante muestra una reducción del 3,4%, como consecuencia del incremento de dotaciones, que neutraliza la buena evolución del margen de intereses y comisiones.
Las comisiones netas se sitúan en 24 millones de euros a cierre de septiembre de 2026, presentando un crecimiento del 28,3% interanual a tipo de cambio constante por una mayor actividad del negocio. El total de costes asciende a -80 millones de euros, lo que supone un incremento interanual del 0,7% a tipo de cambio constante, derivado principalmente de mayores gastos generales.
En cuanto al margen de intereses, se sitúa en 158 millones de euros, creciendo un 3,8% interanual a tipo de cambio constante, impulsado principalmente por el incremento de los volúmenes de crédito y el menor coste de los recursos.
Las dotaciones y deterioros presentan un incremento interanual, debido a que el ejercicio anterior incorporaba liberaciones asociadas a acreditados singulares. Evolutivo Sim ple
(en millones de € )
9M25
9M26
YoY (%)
YoY (%) a tipo constante
1T25
2T25
3T25
4T25
1T26
2T26
3T26
Margen de intereses
141
158
12,0
3,8
47
44
50
52
47
54
57
Comisiones netas
17
24
38,4
28,3
4
8
5
10
7
7
10
Margen básico
159
182
14,9
6,4
51
53
55
62
54
61
67
2
-2
Resultados operaciones financieras y diferencias de cambio
0
7
--
--
0
3
4
0
3
Resultados método participación y dividendos
0
0
--
--
0
0
0
0
0
0
0
Otros productos y cargas de explotación
-20
-22
9,6
1,6
-7
-7
-7
-7
-7
-7
-7
Margen bruto
138
167
20,9
12,0
45
48
46
57
52
53
62
Gastos de explotación
-63
-68
8,3
0,4
-20
-20
-22
-20
-22
-23
-23
Amortización
-11
-12
2,4
-4
-4
-4
-3
-4
-4
-4
Total costes
-73
-80
8,6
0,7
-24
-24
-26
-24
-26
-27
-27
Margen antes de dotaciones
65
88
34,7
24,8
21
24
21
33
25
27
35
Total dotaciones y deterioros
-1
-16
--
--
2
-2
-1
-17
-3
-3
-9
Plusvalías por venta de activos y otros resultados
-3
0
-100,0
-100,0
0
0
-3
0
0
0
0
10,5
Resultado antes de impuestos
60
72
18,4
9,7
22
22
16
16
22
24
26
Impuesto sobre beneficios
-10
-19
85,7
72,1
-3
-4
-3
-2
-5
-6
-9
Resultado atribuido a intereses minoritarios
Beneficio neto
0
0
--
--
0
0
0
0
0
0
0
50
52
4,3
-3,4
19
18
13
14
17
18
17
Ratios acumulados ROTE
10,6%
9,8%
11,0%
11,2%
10,6%
10,0%
9,2%
9,1%
9,8%
Eficiencia
53,0%
47,6%
53,8%
51,9%
53,0%
49,8%
50,6%
50,3%
47,6%
Ratio de morosidad
1,9%
2,6%
2,4%
2,2%
1,9%
2,7%
2,5%
2,6%
2,6%
Ratio de cobertura stage 3 con total provisiones
70,8%
63,5%
61,6%
66,4%
70,8%
59,8%
60,9%
59,2%
63,5%
La inversión crediticia viva presenta un incremento del 14,4% interanual a tipo de cambio constante.
Los recursos de clientes en balance muestran una reducción del 4,8% a tipo de cambio constante. Evolutivo Sim ple
Sep 25
Sep 26
YoY (%)
YoY (%) a tipo constante
Mar 25
Jun 25
Sep 25
Dic 25
Mar 26
Jun 26
Sep 26
Total activo
6.561
7.526
14,7
10,2
6.558
6.329
6.561
7.208
7.230
7.364
7.526
Inversión crediticia bruta viva
4.603
5.475
19,0
14,4
4.358
4.314
4.603
4.946
5.288
5.431
5.475
Total pasivo y patrimonio neto
6.561
7.526
14,7
10,2
6.558
6.329
6.561
7.208
7.230
7.364
7.526
Recursos de clientes en balance
3.264
3.241
-0,7
-4,8
3.244
3.048
3.264
3.439
3.186
3.359
3.241
757
763
0,7
-3,7
717
771
757
768
793
794
763
Empleados
508
493
513
501
508
500
493
494
493
Oficinas
12
12
12
12
12
12
12
12
12
(en millones de € )
Fondos propios asignados Otros datos
Nota: El tipo de cambio EUR/MXN acumulado a 30.09.26 aplicado en la cuenta de resultados es de 20,206 (el aplicado a 30.09.25 fue de 21,804) y en el caso del balance, el tipo de cambio aplicado es de 20,581 (el aplicado a 30.09.25 fue de 21,531) para el peso mexicano. En balance el tipo de cambio EUR/USD es del 1,135 a 30.09.26 (el aplicado a 30.09.25 fue de 1,174).
Tercer trimestre de 2026
26
- La acción 30.09.25
30.06.26
30.09.26
Acciones y contratación Número de acciones en circulación menos la autocartera (en millones)
(1)
4.997
4.781
4.681
Contratación media diaria (millones de € )
(2 )
44
63
62
Valor de cotización (€ )
(3 )
Inicio del año
1,877
3,365
3,365
Máxima del año
3,482
3,520
3,770
Mínima del año
1,795
2,788
2,788
Cierre del periodo
3,300
3,099
3,652
Capitalización bursátil (millones € )
16.491
14.816
17.096
Ratios bursátiles Beneficio neto atribuido por acción (BPA) (€ ) Valor contable (millones € )
0,34
0,32
0,33
14.654
12.381
12.401
Valor contable por acción (€ )
2,93
2,59
2,65
12.094
9.976
9.993
Valor contable tangible por acción (€ ) Valor de cotización sobre el valor contable tangible
2,42 1,36
2,09 1,49
2,13 1,71
Price-to-earnings ratio
9,84
9,62
11,18
Valor contable tangible (millones € )
(1) (2) (3)
Número de acciones totales deduciendo la posición final de la autocartera (incluyendo programa de recompra si aplica). Según datos de BME (Bolsas y Mercados Españoles). Sin ajustar los valores históricos.
Evolución comparativa de la acción SAB (*)
Evolución comparativa de la acción SAB ajustada por los dividendos
Período del 30.09.25 al 30.09.26
Período del 30.09.25 al 30.09.26
SAB 09/25
(1)
11/25
IBEX 35 01/26
Europe Banks (1) 03/26
05/26
STOXX Europe 50 07/26
09/26
SAB 09/25
STOXX Europe 600 Banks
(1)
11/25
IBEX 35 01/26
Europe Banks (1) 03/26
05/26
STOXX Europe 50 07/26
09/26
STOXX Europe 600 Banks
(*) El 29.05.26 se distribuyó un dividendo extraordinario en efectivo por importe de 50 céntimos de euro (brutos) por acción relacionado con la venta de TSB.
Tercer trimestre de 2026
27
- Hechos relevantes Como continuación a la Información Privilegiada de 1 de julio de 2025 (número de registro oficial 2805) y a la Comunicación de Otra Información Relevante de 6 de agosto 2025 (número de registro oficial 36328), Banco Sabadell informa de que, tras haberse obtenido las aprobaciones regulatorias necesarias, en el día 30 de abril de 2026 transmitió el 100% del capital social de TSB Banking Group plc (TSB) por un importe de 2.863 millones de libras esterlinas a Santander UK plc (la Operación). La contraprestación es el resultado del precio de 2.650 millones de libras esterlinas, ajustado al alza en 213 millones de libras esterlinas por la variación positiva experimentada por el Valor Neto Contable Tangible de TSB entre 1 de abril de 2025 y el 30 de abril de 2026, tal y como se había acordado. La Operación conlleva además la transmisión a Santander UK plc de otros instrumentos de capital y valores, no vencidos, emitidos por TSB y suscritos por Banco Sabadell, por un importe de 1.217 millones de libras esterlinas. La Operación dio lugar a una plusvalía de 322 millones de euros netos para Banco Sabadell, una vez considerados todos los impactos derivados de la Operación, y una generación de capital de más de 400 puntos básicos en la ratio Common Equity Tier 1 (CET1) fully-loaded, de los que 369 pbs se materializan en este ejercicio, y 36 pbs asociados a menores activos ponderados por riesgo operacional se materializarán entre 2027 y 2028. Como consecuencia de ello y en ejecución del acuerdo adoptado por la Junta General Extraordinaria celebrada el 6 de agosto de 2025, el 29 de mayo se distribuyó un dividendo extraordinario en efectivo, con cargo a reservas voluntarias de libre disposición, por importe de 50 céntimos de euro (brutos) por acción. La distribución de este dividendo extraordinario tuvo un impacto en la ratio de capital Common Equity Tier 1 (CET 1) de Banco Sabadell de 378 puntos básicos. De acuerdo con la normativa contable aplicable al grupo, las operaciones llevadas a cabo por TSB y sus entidades dependientes, que constituían la práctica totalidad del segmento Negocio bancario Reino Unido, pasaron a considerarse como operaciones interrumpidas desde el 1 de julio de 2025 hasta la fecha de su venta. En consecuencia: • En la cuenta de pérdidas y ganancias contable del Grupo, los resultados asociados a TSB y sus entidades dependientes se presentan en una única línea, bajo el epígrafe “resultados de actividades interrumpidas”, para el ejercicio 2025. Esto implica que los ingresos y gastos vinculados a estos resultados se excluyan, línea por línea, del desglose de actividades continuadas de ambos periodos. • En el balance consolidado del Grupo, los activos y pasivos relacionados con la venta de TSB y sus entidades dependientes se agrupan bajo las líneas “activos no corrientes y grupos enajenables de elementos clasificados como mantenidos para la venta” y “pasivos incluidos en grupos enajenables de elementos clasificados como mantenidos para la venta”. Esta clasificación aplica exclusivamente a los balances posteriores a 1 de julio de 2025, sin afectar a balances anteriores. No obstante: A efectos de elaboración de la información de gestión, los resultados de TSB y sus entidades dependientes se registran aplicando los mismos criterios de desagregación utilizados en periodos anteriores. Esto se debe a que, hasta que la operación se ha completado, la gestión de TSB ha continuado bajo el mismo modelo operativo anterior al anuncio de la venta . No obstante, en la cuenta de resultados de gestión presentada en este informe, su aportación neta se muestra agregada en un único epígrafe.
Tercer trimestre de 2026
28
- Conciliación y glosario de términos sobre medidas del rendimiento Conciliación de la información contable del grupo A continuación, se presenta la cuenta de pérdidas y ganancias y el balance de situación contable del grupo así como la conciliación entre la cuenta de pérdidas y ganancias contable y la cuenta de resultados de gestión, que es la que se muestra a lo largo de este informe. Las principales diferencias son:
- El tratamiento de los resultados generados por TSB y sus entidades dependientes tras el acuerdo de venta alcanzado en la Junta General Extraordinaria de Accionistas el 6 de agosto de 2025. Es decir, en la cuenta de resultados de gestión, los resultados de TSB y sus entidades dependientes se han registrado de forma desagregada y epígrafe a epígrafe, tal como se venía haciendo en los informes trimestrales previos, aunque se muestra su aportación neta en una sola línea de la cuenta de resultados, mientras que el tratamiento en la cuenta de pérdidas y ganancias contable, de acuerdo a la normativa contable de aplicación, se presentan en un único epígrafe “resultados de actividades interrumpidas”. A tener en cuenta que la cuenta de resultados contable de periodos anteriores se ha reexpresado a efectos comparativos.
líneas “activos no corrientes y grupos enajenables de elementos clasificados como mantenidos para la venta” y “pasivos incluidos en grupos enajenables de elementos clasificados como mantenidos para la venta”. Esta clasificación aplica exclusivamente a los balances posteriores a 1 de julio de 2025, sin afectar a balances anteriores.
- Tras la resolución, en octubre de 2025, del acuerdo firmado con Nexi S.p.A. - que incluía la venta de la filial Paycomet - el Grupo, de acuerdo con la normativa contable aplicable, dejó de clasificar los activos y pasivos de dicha filial como no corrientes mantenidos para la venta. En consecuencia, volvió a aplicar las políticas contables y criterios de valoración vigentes antes de la firma del acuerdo. La modificación más relevante consistió en reclasificar los gastos por amortización de los activos de Paycomet (principalmente TPVs) desde el epígrafe “Otras dotaciones y deterioros” a “Costes”. A nivel contable, se ha reexpresado la información comparativa del ejercicio 2025, mientras que, en términos de gestión, no se han reexpresado los periodos anteriores.
Adicionalmente, en el balance consolidado contable del Grupo, los activos y pasivos relacionados con la venta de TSB y sus entidades dependientes se agrupan bajo las Cuenta de pérdidas y ganancias acumulada contable (en millones de € )
9M25
9M26
YoY (%)
Margen de intereses
0,6
2.656
2.671
Comisiones netas
962
983
2,1
Margen básico
3.619
3.654
1,0
-3 136 -54
38 105 -51
--22,6 -6,3
Margen bruto
3.698
3.747
1,3
Gastos de explotación Amortización Total costes
-1.385 -308 -1.693
-1.492 -316 -1.808
7,7 2,5 6,8
Margen antes de dotaciones
2.004
1.939
-3,3
-296 -24 -28 -17
-385 -41 8 -133
30,0 69,6
1.639
1.388
-15,3
-534
-515
-3,6
1.105
873
-21,0
286 1
506 3
77,1 185,0
1.390
1.376
--
Resultados operaciones financieras y diferencias de cambio Resultados método participación y dividendos Otros productos y cargas de explotación
Dotaciones para insolvencias Dotaciones a otros activos financieros Otras dotaciones y deterioros Plusvalías por venta de activos y otros resultados
Resultado antes de impuestos Impuesto sobre beneficios
Resultado de las actividades continuadas Resultado de las actividades interrumpidas Resultado atribuido a intereses minoritarios
Beneficio neto con TSB
Tercer trimestre de 2026
29
Cuenta de pérdidas y ganancias trimestral contable 3T25
4T25
1T26
2T26
3T26
QoQ (% )
Margen de intereses
883
880
855
896
920
2,6
Co misio nes netas
314
332
315
328
340
3,7
Margen básico
1.196
1.212
1.170
1.224
1.260
2,9 185,5
(en millo nes de €)
Resultado s o peracio nes financieras y diferencias de cambio
-27
-4
-1
10
29
Resultado s méto do participació n y dividendo s
34
45
24
41
40
-3,9
Otro s pro ducto s y cargas de explo tació n
-11
-56
-17
-20
-14
-30,3
Margen bruto
1.192
1.199
1.176
1.256
1.315
4,7
Gasto s de explo tació n
-471
-482
-523
-501
-468
-6,6
A mo rtizació n
-106
-113
-109
-105
-102
-2,6
To tal co stes
-577
-595
-632
-606
-570
-5,9
Margen antes de dotaciones
615
604
544
650
745
14,6
Do tacio nes para inso lvencias
-117
-130
-120
-137
-127
-7,2
Do tacio nes a o tro s activo s financiero s
-3
-14
-18
-15
-7
-50,6
Otras do tacio nes y deterio ro s
0
2
5
0
2
--
P lusvalías po r venta de activo s y o tro s resultado s
-4
-20
0
-130
-3
-97,9
Resultado antes de im puestos
490
441
410
368
610
65,8
Impuesto so bre beneficio s
-161
-151
-144
-166
-204
22,8
Resultado de las actividades continuadas
330
289
266
202
405
101,2
Resultado de las actividades interrumpidas
85
97
83
424
0
-100,0
Resultado atribuido a intereses mino ritario s
0
1
2
1
0
-100,0
414
386
347
624
405
--
Beneficio neto con TSB
Conciliación Contable – Gestión cuenta de pérdidas y ganancias acumulada 2026
(en millones de € )
Margen de intereses
Resultados contables
9M26 Ajustes relacionados con la venta de TSB
Resultados gestión
3.108
2.671
436
Comisiones netas
983
26
1.008
Margen básico
3.654
462
4.116
Resultados operaciones financieras y diferencias de cambio
38
15
53
Resultados método participación y dividendos
105
0
105
Otros productos y cargas de explotación
-51
-32
-83
3.747
444
4.191
-1.492
-242
-1.734
-316
-28
-344
Total costes
-1.808
-270
-2.078
Margen antes de dotaciones
Margen bruto Gastos de explotación Amortización
1.939
174
2.113
Dotaciones para insolvencias
-385
-24
-409
Dotaciones a otros activos financieros
-41
0
-41
8
0
8
-133
410
277
1.947
Otras dotaciones y deterioros Plusvalías por venta de activos y otros resultados
Resultado antes de impuestos
1.388
560
Impuesto sobre beneficios
-515
-53
-568
Resultado de las actividades continuadas
873
506
1.379
Resultado de las actividades interrumpidas
506
-506
0
Resultado atribuido a intereses minoritarios
3
0
3
1.376
0
1.376
Beneficio neto con TSB
Tercer trimestre de 2026
30
Conciliación Contable – Gestión cuenta de pérdidas y ganancias acumulada 2025
(en millones de € )
Margen de intereses
Resultados contables
9M25 Ajustes relacionados con Ajustes relacionados la venta de TSB con Paycom et
Resultados gestión
2.656
971
0
Comisiones netas
962
69
0
1.032
Margen básico
3.619
1.040
0
4.659
-3
5
0
2
136
0
0
136
Resultados operaciones financieras y diferencias de cambio Resultados método participación y dividendos Otros productos y cargas de explotación
3.628
-54
-3
0
-57
3.698
1.043
0
4.740
-1.385
-549
4
-1.930
-308
-59
14
-352
Total costes
-1.693
-607
18
-2.282
Margen antes de dotaciones
Margen bruto Gastos de explotación Amortización
2.004
435
18
2.458
Dotaciones para insolvencias
-296
-38
0
-334
Dotaciones a otros activos financieros
-24
1
0
-23
Otras dotaciones y deterioros
-28
0
-18
-47
Plusvalías por venta de activos y otros resultados
-17
1
0
-16
1.639
399
0
2.038
Resultado antes de impuestos Impuesto sobre beneficios
-534
-113
0
-647
1.105
286
0
1.391
Resultado de las actividades interrumpidas
286
-286
0
0
Resultado atribuido a intereses minoritarios
1
0
0
1
1.390
0
0
1.390
Resultado de las actividades continuadas
Beneficio neto con TSB
Balance de situación contable (en millo nes de €) Efectivo , saldo s en efectivo en banco s centrales y o tro s depó sito s a la vista A ctivo s financiero s mantenido s para nego ciar y a valo r razo nable co n cambio s en resultado s A ctivo s financiero s a valo r razo nable co n cambio s en o tro resultado glo bal A ctivo s financiero s a co ste amo rtizado P réstamo s y anticipo s a la clientela P réstamo s y anticipo s a banco s centrales y entidades de crédito Valo res representativo s de deuda Inversio nes en nego cio s co njunto s y aso ciadas A ctivo s tangibles A ctivo s intangibles A ctivo s no co rrientes y grupo s enajenables clasificado s co mo mantenido s para la venta Otro s activo s
3 0 .0 9 .2 5 15.628 2.849 6.145 155.622 121.301 8.646 25.675 489 1.792 2.418 52.691 6.894
3 0 .0 6 .2 6 5.460 5.701 5.766 170.629 126.308 15.058 29.264 468 1.671 2.406 414 6.569
V a ria c ió n 3 0 .0 9 .2 6 Y o Y ( %) Q o Q ( %) 5.239 -66,5 -4,0 5.181 81,8 -9,1 5.924 -3,6 2,7 171.346 10,1 0,4 126.121 4,0 -0,1 15.570 80,1 3,4 29.655 15,5 1,3 486 -0,7 3,9 1.655 -7,6 -0,9 2.408 -0,4 0,1 382 -99,3 -7,9 6.637 -3,7 1,0
Total activo
244.529
199.084
199.258
-18,5
0,1
1.363 178.014 0 13.784 138.825 20.017 5.387 394 49.328 1.318
1.815 183.639 440 18.247 137.168 20.889 6.896 346 0 1.109
2.694 182.912 0 18.198 138.793 20.525 5.396 327 0 1.312
97,7 2,8 -32,0 0,0 2,5 0,2 -17,1 -100,0 -0,5
48,4 -0,4 -100,0 -0,3 1,2 -1,7 -21,8 -5,6 -18,3
230.417
186.909
187.245
-18,7
0,2
14.654 -576 35
12.381 -244 38
12.401 -424 37
-15,4 -26,4 6,3
0,2 73,8 -2,6
Patrimonio neto
14.112
12.175
12.013
-14,9
-1,3
Total pasivo y patrimonio neto
244.529
199.084
199.258
-18,5
0,1
Garantías financieras co ncedidas Co mpro miso s de préstamo s co ncedido s Otro s co mpro miso s co ncedido s
1.836 26.807 7.804
1.896 21.939 8.587
1.956 21.913 9.862
6,5 -18,3 26,4
3,2 -0,1 14,8
P asivo s financiero s mantenido s para nego ciar y a valo r razo nable co n cambio s en resultado s P asivo s financiero s a co ste amo rtizado Depó sito s de banco s centrales Depó sito s de entidades de crédito Depó sito s de la clientela Valo res representativo s de deuda emitido s Otro s pasivo s financiero s P ro visio nes P asivo s incluido s en grupo s enajenables clasificado s co mo mantenido s para la venta Otro s pasivo s
Total pasivo Fo ndo s pro pio s Otro resultado glo bal acumulado Intereses de mino ritario s
Tercer trimestre de 2026
31
Medidas alternativas del rendimiento (MARs) El grupo en la presentación de sus resultados al mercado y para el seguimiento del negocio y toma de decisiones utiliza medidas del rendimiento de acuerdo con la normativa contable generalmente aceptada (NIIF-UE) y también utiliza otras medidas no auditadas comúnmente utilizadas en el sector bancario (Medidas alternativas de rendimiento o “MARs”), como indicadores de seguimiento de la gestión de los activos y pasivos, y de la situación financiera y económica del grupo, lo que facilita su comparabilidad con otras entidades.
Siguiendo las directrices de ESMA sobre las MARs (ESMA/2015/1415es de octubre 2015), cuya finalidad es promover la utilidad y transparencia de la información para la protección a los inversores en la Unión Europea, el grupo presenta a continuación para cada MARs la conciliación con las partidas presentadas en los estados financieros (en cada uno de los apartados del informe) y su definición y cálculo.
Definición y cálculo ROA ROE RORWA ROTE Ratio de eficiencia (incluye costes no recurrentes)
Margen de clientes
Página
Resultado consolidado del ejercicio (últimos 12 meses) / activos totales medios (últimos 12 meses). Beneficio atribuido al grupo (últimos 12 meses) / fondos propios medios (últimos 12 meses).
5 5
Resultado consolidado del ejercicio (últimos 12 meses) / activos ponderados por riesgo medios (APR) (últimos 12 meses). Beneficio atribuido al grupo (últimos 12 meses) / fondos propios medios (últimos 12 meses). El denominador excluye el importe de los activos intangibles y el fondo de comercio de las participadas. () Gastos de administración y amortizaciones / margen bruto. Es la diferencia entre el rendimiento y los costes de los activos y pasivos relacionados con clientes. En su cálculo se considera la diferencia entre el tipo medio que el banco cobra por los créditos a sus clientes y el tipo medio que el banco paga por los depósitos de sus clientes. El tipo medio del crédito a clientes es el (*) porcentaje anualizado entre el ingreso financiero contable del crédito a clientes en relación al saldo medio () diario del crédito a clientes. El tipo medio de los recursos de clientes es el porcentaje anualizado entre los costes financieros contables de los recursos de clientes en relación al saldo medio diario de los recursos de clientes.
5 5 5
9
Coste del riesgo de crédito (pbs)
Su cálculo se compone de un cociente donde el numerador considera los últimos 12 meses de las dotaciones a insolvencias ajustando los costes asociados a la gestión de activos stage 3 y el denominador incluye el (**) promedio de los últimos 12 meses de: i) la inversión crediticia bruta de clientes, sin adquisiciones temporales de activos, y riesgos en stage 3 de entidades de crédito y ii) garantías financieras y otras garantías concedidas.
12
Coste del riesgo total (pbs)
Su cálculo se compone de un cociente donde el numerador considera los últimos 12 meses del total de dotaciones y deterioros y el denominador incluye el promedio de los últimos 12 meses de: i) la inversión (**) crediticia bruta de clientes, sin adquisiciones temporales de activos, y riesgos en stage 3 de entidades de crédito y ii) garantías financieras y otras garantías concedidas y iii) activos inmobiliarios problemáticos.
12
Ratio de cobertura stage 3 con total provisiones
Muestra el porcentaje de riesgos stage 3 que está cubierto por provisiones totales. Su cálculo se compone (**) del cociente entre la suma de las correcciones de valor por deterioro de activos del balance y las provisiones registradas en el pasivo del balance asociadas a exposiciones fuera de balance, y el total de riesgos stage 3.
17
Ratio de morosidad
Su cálculo se compone de un cociente donde en el numerador se incluyen los riesgos clasificados en el stage 3 y en denominador se incluyen: i) la inversión crediticia bruta de clientes, sin adquisiciones temporales (**) de activos, y riesgos en stage 3 de entidades de crédito y ii) garantías financieras y otras garantías concedidas.
17
Activos problemáticos
(**)
Los activos problemáticos son la suma de los riesgos clasificados en stage 3 y los activos inmobiliarios problemáticos.
18
Loan-to-deposit ratio
Préstamos y anticipos a la clientela excluyendo ATAs y créditos de mediación sobre recursos de clientes en balance. El denominador está formado por los pasivos financieros a coste amortizado excluyendo los pasivos (**) que no sean de naturaleza minorista tales como los depósitos de bancos centrales, los depósitos de entidades de crédito, las emisiones institucionales y otros pasivos financieros.
20
Beneficio neto atribuido por acción
Es el cociente del beneficio neto atribuido al grupo ajustado por el importe del cupón del Additional Tier I de los últimos 12 meses entre el número medio de acciones en circulación de los últimos 12 meses (número medio de acciones totales deduciendo la media de la autocartera, incluyendo los programas de recompra, si aplica).
27
Valor contable por acción
Es el cociente entre el valor contable / número de acciones en circulación (número de acciones totales deduciendo la posición final de autocartera, incluyendo los programas de recompra, si aplica) a fecha de cierre del período. Por valor contable se considera la suma de los fondos propios.
27
Es el cociente entre el valor contable tangible y el número de acciones en circulación (número de acciones totales deduciendo la posición final de autocartera, incluyendo los programas de recompra, si aplica) a fecha de cierre del período. Por valor contable tangible se considera la suma de los fondos propios y ajustado por los activos intangibles y el fondo de comercio de las participadas. Es el cociente entre el precio o valor de cotización de la acción / valor contable tangible por acción. Es el cociente entre el precio o valor de cotización de la acción / beneficio neto atribuible por acción.
27 27 27
Valor contable tangible por acción Valor de cotización sobre el valor contable tangible Price-to-earnings ratio
(*) Media aritmética calculada como la suma de los saldos diarios del periodo de referencia y dividida entre el número de días de dicho periodo. (**) Datos excluyendo la aportación de TSB.
Tercer trimestre de 2026
32
M e dida de re ndim ie nt o
ROA
ROE
RORWA
ROTE
Ratio de eficiencia (incluye co stes no recurrentes)
M argen de clientes (*)
Co ste del riesgo de crédito (pbs)
Co ste del riesgo to tal (pbs)
C o nc ilia c ió n ( e xpre s a do e n m illo ne s de e uro s )
9M 25
9M 26
Resultado co nso lidado del ejercicio (último s 12 meses) A ctivo s to tales medio s (último s 12 meses) R O A ( %) B eneficio atribuido al grupo (último s 12 meses) Fo ndo s pro pio s medio s (último s 12 meses) R O E ( %) Resultado co nso lidado del ejercicio (último s 12 meses) A ctivo s po nderado s po r riesgo medio s (A P R) (último s 12 meses) R O R WA ( %) B eneficio atribuido al grupo (último s 12 meses) Fo ndo s pro pio s medio s, sin activo s intangibles (último s 12 meses) R O T E ( %) To tal co stes M argen bruto R a t io de e f ic ie nc ia ( %) Crédito a la clientela (neto ) Resultado s Saldo medio Tipo medio anualizado % Depó sito s de la clientela Resultado s Saldo medio Tipo medio anualizado % M a rge n de c lie nt e s Do tacio nes para inso lvencias (último s 12 meses) Gasto s NP Ls (último s 12 meses) Inversió n crediticia bruta sin adquisició n tempo ral de activo s (último s 12 meses) Garantías financieras y o tras garantías co ncedidas (último s 12 meses)
1.876 246.220 0 ,8 1.874 15.013 12 ,5 1.876 79.528 2 ,4 1.874 12.497 15 ,0 -1.646 3.738 4 4 ,0
1.766 227.049 0 ,8 1.762 13.871 12 ,7 1.766 75.671 2 ,3 3 1.762 11.357 15 ,5 -1.797 3.777 4 7 ,6
3.367 116.010 3,88
3.329 121.818 3,65
-832 126.302 -0,88 3 ,0 0 -381 -114 119.057 8.574
-795 133.195 -0,80 2 ,8 5 -514 -93 124.987 8.651
C o s t e de l rie s go de c ré dit o ( pbs ) To tal do tacio nes y deterio ro s (último s 12 meses) Inversió n crediticia bruta sin adquisició n tempo ral de activo s (último s 12 meses) Garantías financieras y o tras garantías co ncedidas (último s 12 meses)
21 -524 119.057 8.574
32 -542 124.987 8.651
804
660
41 2.520 3.634 6 9 ,3 % 3.634 123.670 8.463 2 ,7 5 % 3.634 729 4 .3 6 3 120.030 127.660 9 4 ,0 % 1.759 1.874 -114 5.244 0 ,3 4 14.654 4.997 2 ,9 3 12.094 14.654 2.560 4.997 2 ,4 2 3,300 2,42 1,3 6 3,300 0,34 9 ,8 4
40 2.312 3.298 7 0 ,1% 3.298 128.350 8.816 2 ,4 0 % 3.298 588 3 .8 8 6 123.990 133.569 9 2 ,8 % 1.598 1.762 -164 4.891 0 ,3 3 12.401 4.681 2 ,6 5 9.993 12.401 2.408 4.681 2 ,13 3,652 2,13 1,7 1 3,652 0,33 11,18
A ctivo s inmo biliario s pro blemático s (último s 12 meses)
Ratio de co bertura stage 3 co n to tal pro visio nes (%)
Ratio de mo ro sidad (%)
A ctivo s pro blemático s
Lo an-to -depo sit ratio (%)
B eneficio neto atribuido po r acció n (B P A ) (€)
Valo r co ntable po r acció n (€)
Valo r co ntable tangible po r acció n (€)
Valo r de co tizació n so bre el valo r co ntable tangible
P rice-to -earnings ratio
C o s t e de l rie s go t o t a l ( pbs ) To tal pro visio nes Riesgo s stage 3 R a t io de c o be rt ura s t a ge 3 c o n t o t a l pro v is io ne s ( %) Riesgo s stage 3 Inversió n crediticia bruta sin adquisició n tempo ral de activo s Garantías financieras y o tras garantías co ncedidas R a t io de m o ro s ida d ( %) Riesgo s stage 3 A ctivo s inmo biliario s pro blemático s A c t iv o s pro ble m á t ic o s P réstamo s y anticipo s a la clientela sin A TA s ajustado s po r crédito s de mediació n Recurso s de clientes en balance Lo a n- t o - de po s it ra t io ( %) B eneficio atribuido al grupo ajustado B eneficio atribuido al grupo (último s 12 meses) A T1 (último s 12 meses) Número medio de accio nes en circulació n meno s la media de la auto cartera (en millo nes) B e ne f ic io ne t o a t ribuido po r a c c ió n ( B P A ) ( € ) Fo ndo s pro pio s Número de accio nes en circulació n meno s la auto cartera (en millo nes) V a lo r c o nt a ble po r a c c ió n ( € ) Valo r co ntable tangible (millo nes €) Fo ndo s pro pio s A ctivo s intangibles Número de accio nes en circulació n meno s la auto cartera (en millo nes) V a lo r c o nt a ble t a ngible po r a c c ió n ( € ) Valo r de co tizació n (€) Valo r co ntable tangible po r acció n (€) V a lo r de c o t iza c ió n s o bre e l v a lo r c o nt a ble t a ngible Valo r de co tizació n (€) B eneficio neto atribuido po r acció n (B P A ) (€) P ric e - t o - e a rnings ra t io
(*) El margen de clientes está calculado con datos acumulados. Ver listado, definición y finalidad de las MARs utilizadas a nivel grupo Banco Sabadell en: www.grupbancsabadell.com / ACCIONISTAS_E_INVERSORES / INFORMACION_ECONOMICO_FINANCIERA / MEDIDAS_ALTERNATIVAS_DEL_RENDIMIENTO
Tercer trimestre de 2026
33
Relación con accionistas e inversores Para información adicional contacte con:
Relación con Accionistas e Inversores [email protected] +34 91 3217373
Tercer trimestre de 2026
34
Banco Sabadell 3T · 2026
Resultados 29 de octubre de 2026 1
Índice
- Aspectos clave del 3T26
p.3
- Resultados financieros
p.13
- Balance
p.21
- Consideraciones finales
p.25
2
Aspectos clave del 3T26 3
Las mandíbulas positivas continúan ampliándose La actividad comercial mantiene una dinámica positiva Los ingresos siguen creciendo
Crédito vivo
Recursos de clientes
+4,4% vs. dic-25
% +2,6 vs. dic-25
Margen de intereses
Comisiones
+2,0% v.t.
+3,7% v.t.
Costes recurrentes totales
Los costes se mantienen contenidos
% -0,1 v.t.
El plan de prejubilaciones ya está dando resultados
La calidad de los activos sigue siendo favorable
Ratio de morosidad
CoR total
2,40% (-6pbs v.t.)
40pbs
Nuevo dividendo a cuenta
Recompra de acciones pendiente de ejecución
7cts€/acción
57M€ de 331M€ (23 oct. 2026)
Remuneración al accionista sostenible
Rentabilidad recurrente en línea para alcanzar el objetivo del año del 14,5% 4
Las iniciativas estratégicas contribuyen a la consecución de los objetivos Extensión del acuerdo de distribución de fondos de inversión Acuerdo con Amundi renovado hasta 2035 Lógica industrial para ambas partes, aportando mayor escala y más flexibilidad en el catálogo de productos Mejora de las condiciones económicas sin un pago inicial, pero con un nivel de comisiones recurrentes más elevado El nuevo esquema de distribución de comisiones está alineado con las prácticas de mercado actuales
Foco en ejecución
Una estructura organizativa más simple para reforzar la ejecución y la claridad en las responsabilidades La IA y la transformación ganan protagonismo en toda la organización
Mayor foco en la banca relacional y en clientes de alto valor (banca personal, banca privada y empresas) Ambición de convertirnos en el mejor banco de relación de España
El nuevo acuerdo refuerza el crecimiento sostenible de los activos bajo gestión, mejora la propuesta de valor para los clientes e impulsa los ingresos recurrentes
5
Evolución favorable a lo largo del año
Cuenta de resultados
3T26 (M€)
9M26 (M€)
3T26/2T26
9M26/9M25
Margen de intereses
920
2.694
+2,0%
-0,6%
Comisiones
340
983
+3,7%
+2,1%
% 14,2
Costes recurrentes totales
-570
-1.709
-0,1%
+3,8%
RoTE recurrente4
Provisiones
-132
-418
-13,0%
+13,8%
Beneficio neto recurrente
405
1.0961
+12,9%2
-5,3%3
% 15,5 RoTE reportado
Beneficio neto (incl. TSB)
405
1.376
-35,0%
-1,0%
1 El beneficio neto recurrente de 9M26 (1.096M€) = beneficio neto, incl. TSB (1.376M€) - contribución de TSB (79M€) y los extraordinarios (201M€; véase detalle en la diapositiva 36). 2 Excluye la contribución de TSB (16M€) y los extraordinarios (249M€), ambos en 2T26. 3 Excluye la contribución de TSB (79M€ en 9M26
y 242M€ en 9M25) y los extraordinarios (201M€) en 9M26. 4 Proforma desconsolidando TSB desde junio de 2025, lo que implica la distribución de un dividendo de 50 céntimos de euro por acción y la desconsolidación de los intangibles de TSB. No incluye la contribución de TSB al Grupo. Adicionalmente, excluye (neto de impuestos): -21M€ relacionados con la cobertura de tipo del cambio de los ingresos de la venta de TSB, -64M€ de costes no recurrentes asociados al programa de prejubilaciones en España en el 1S26, +322M€ de plusvalía por la venta de TSB y -45M€ vinculados a la venta de una participación accionarial.
6
Mayor dinamismo en la nueva producción de particulares, con impacto estacional en empresas Hipotecas
Préstamos al consumo
Pymes y grandes empresas
Pymes y grandes empresas
M€, nueva producción trimestral en España
M€, nueva producción trimestral en España
Préstamos y créditos M€, nueva producción trimestral en España
Circulante M€, nueva producción trimestral en España
0% i.a.
+7% i.a.
+9% i.a.
-4% i.a.
+5% v.t.
+13% v.t.
-39% v.t.
-2% v.t.
6.288 1.600
3T25
1.516
2T26
1.596
3T26
728
3T25
2T26
8.644
8.495
3T25
2T26
3T26
3.810
3.508 768
8.828
824
3T26
3T25
2T26
3T26
7
El crecimiento en el año está en línea para alcanzar un crecimiento de un dígito medio en 2026 Crédito vivo por segmento MM€
Sep-26
% v.t. % vs. dic-25
Sep-26
% i.a. México
Hipotecas
40,7
+1,3%
+2,4%
+3,5%
Préstamos al consumo
5,9
+4,5%
+9,0%
+12,7%
Miami
-0,4%
Oficinas en el extranjero
Pymes y grandes empresas
45,6
-0,1%
+3,0%
TC constante
TC constante
TC constante
Sector público
12,0
-4,4%
+6,8%
+5,2%
Total internacional
Otra financiación
2,3
-26,1%
-15,9%
-11,0%
TC constante
Total España
106,4
-0,6%
+3,0%
+2,1%
Total TC constante
5,5 7,9 5,1
18,5
124,9
% v.t.
% vs. dic-25
% i.a.
+0,8%
+10,7%
+19,0%
+2,8%
+7,7%
+14,4%
+1,3%
+13,9%
+16,6%
+1,0%
+10,1%
+12,7%
+4,0%
+15,7%
+14,5%
+3,7%
+14,8%
+13,5%
+1,9%
+13,4%
+16,7%
+2,3%
+10,6%
+13,5%
-0,2%
+4,4%
+4,0%
-0,2%
+4,1%
+3,6%
8
Crecimiento de los recursos en balance en línea con el objetivo, conteniendo la beta de depósitos Total Recursos de clientes
Desglose de recursos en balance
MM€
MM€
Sep-26 % v.t. En balance
133,6 +0,1%
133,6 Sep-26
% vs. dic-25
% i.a.
+1,2%
+4,6%
Coste de los recursos de clientes
No remunerados
84pbs
83,8 Remunerados
De los cuales: España Fuera de balance
Total recursos de clientes
126,5 +0,3%
+1,7%
+4,9%
55,9
+6,1%
+8,1%
+2,1%
189,4 +0,7%
+2,6%
+6pbs v.t.
49,7
España
+7pbs i.a.
126,5MM€ Sep-26 2T26
3T26
v.t.
Coste de los recursos de clientes
61pbs
67pbs
+6pbs
Media trimestral Euríbor 3 meses
2,25%
2,52%
+28pbs
Beta de depósitos
27%
26%
-1pp
+5,6%
9
La mejora del margen de clientes confirma el punto de inflexión Rendimiento del crédito y coste de recursos de clientes
Margen de clientes
+8pbs v.t.
3,68%
3,64%
3,63%
3,62%
3,70% +2pbs v.t.
2,91% 2,86%
0,77%
0,76%
0,78%
0,78%
2,88%
2,85%
2,84%
2,86%
1T26
2T26
3T26
c.2,90%
0,84% +6pbs v.t.
3T25
4T25
1T26
2T26
3T26
4T26e
Rendimiento del crédito
3T25
4T25
4T26e
Margen de clientes
Coste de recursos de clientes
Se espera que la mejora del rendimiento del crédito supere el aumento del coste de los depósitos a medida que vayan repreciando los préstamos a tipo variable
El margen de clientes marcó su mínimo en el 2T26 y mejorará gradualmente en los próximos trimestres
10
Ofreciendo una remuneración al accionista atractiva en 2026 2026
2026
2026
2027
29 de mayo
24 de julio
29 de diciembre
Tras la JGA
Novedad
Remuneración recurrente al accionista
331M€
(pay-out del 60% + exceso de capital >13% CET11)
Remuneración extraordinaria procedente de la venta de TSB
1ª distribución a cuenta mediante recompra de acciones (17% pendiente de ejecución)
7cts€/acción (325M€) 2ª distribución a cuenta en efectivo
Distribución final
50cts€/acción Dividendo extraordinario en efectivo
1 CET1 fully-loaded, aplicando el calendario regulatorio del output floor.
Nuevo dividendo a cuenta en efectivo de 7cts € por acción
11
Entrada de BPCE como accionista estratégico
BPCE es el 2º mayor grupo bancario de Francia y el cuarto de la zona euro por capital
Se convierte en un accionista estable y de largo plazo de Banco Sabadell BPCE ha adquirido una participación del 7% del capital de Banco Sabadell, con la intención de mantenerse por debajo del 9,9% Nombramiento de un consejero en el Consejo de Administración de Banco Sabadell1 Potenciales oportunidades de colaboración en: • Banca Corporativa y de Inversión • Leasing de bienes de equipo • Crédito al consumo • Negocio de clientes transfronterizos
1 Sujeto a los procedimientos de gobierno aplicables y a las autorizaciones necesarias.
12
Resultados financieros 13
Rentabilidad en línea para alcanzar el objetivo del 14,5% a cierre de año M€
3T26
9M26
Margen de intereses Comisiones Margen básico ROF y diferencias de cambio Otros resultados de explotación Margen bruto Costes recurrentes Costes no recurrentes Margen antes de dotaciones Total provisiones y deterioros Plusvalías por venta de activos y otros resultados Beneficio antes de impuestos Impuestos & minoritarios
920 340 1.260 29 26 1.315 -570 0 745 -132 -3 610 -204
2.694 983 3.677 46 54 3.777 -1.709 -88 1.981 -418 277 1.840 -543
3T26/2T26 9M26/9M25 2,0% 3,7% 2,4% n.m. 20,2% 3,7% -0,1% n.m. 12,2% -13,0% n.m. -23,0% 11,2%
1
Beneficio neto recurrente
405
1.096
Beneficio neto (incluyendo TSB)
405
1.376
1
2
12,9% -35,0%
-0,6% 2,1% 0,1% n.m. -33,4% 1,0% 3,8% n.m. -5,3% 13,8% n.m. 7,7% -3,1% 2
% 14,2 RoTE recurrente4
3 3
-5,3%
-1,0%
1 El beneficio neto recurrente de 9M26 (1.096M€) = beneficio neto, incl. TSB (1.376M€) - contribución de TSB (79M€) y los extraordinarios (201M€; véase detalle en la diapositiva 36). 2 Excluye la contribución de TSB (16M€) y los extraordinarios (249M€), ambos en 2T26. 3 Excluye la contribución de TSB (79M€ en 9M26
y 242M€ en 9M25) y los extraordinarios (201M€) en 9M26. 4 Proforma desconsolidando TSB desde junio de 2025, lo que implica la distribución de un dividendo de 50 céntimos de euro por acción y la desconsolidación de los intangibles de TSB. No incluye la contribución de TSB al Grupo. Adicionalmente, excluye (neto de impuestos): -21M€ relacionados con la cobertura de tipo del cambio de los ingresos de la venta de TSB, -64M€ de costes no recurrentes asociados al programa de prejubilaciones en España en el 1S26, +322M€ de plusvalía por la venta de TSB y -45M€ vinculados a la venta de una participación accionarial.
14
El margen de intereses del trimestre se apoyó en mayores volúmenes y en la expansión del margen de clientes Margen de intereses trimestral
Evolución trimestral del margen de intereses
M€
M€
+24
+3
+2,0%
-9
3T26/2T26
899
902
920
-0,6%
920
902
9M26/9M25
3T25
2T26
3T26
2T26
3T25
2T26
3T26
Margen de clientes
2,91%
2,84%
2,86%
Margen de intereses sobre ATM
1,79%
1,79%
1,81%
Margen de clientes
Número de días
Cartera de renta fija, liquidez, financiación mayorista y otros
3T26
• El margen de intereses de clientes se benefició de mayores volúmenes medios y del reprecio positivo del activo, parcialmente compensado por un mayor coste de los depósitos en el trimestre • El margen de clientes mejoró ligeramente en el trimestre • El margen de intereses de no clientes se vio afectado por mayores costes de financiación mayorista, parcialmente compensados por una mayor contribución de la cartera de renta fija 15
La mejora del margen de clientes ya ha comenzado, si bien los tipos más altos moderan el ritmo, aunque el potencial se mantiene Evolución trimestral esperada del margen de intereses M€
4T26 vs. 4T25 Crecimiento de un dígito medio
Se espera que el margen de intereses en 4T26 continúe aumentando, con un crecimiento previsto de un dígito medio frente al 4T25, impulsado por: • Se espera que el BCE eleve la facilidad de depósito hasta el 2,75% a cierre de año, 25pbs por encima de lo previsto anteriormente. • Aumento del rendimiento del crédito, debido al reprecio positivo de los préstamos a tipo de interés variable. • Se espera que el coste de los depósitos aumente más rápido de lo previsto en un entorno de tipos de interés más altos. • Se espera que el margen de clientes alcance niveles de aproximadamente 290pbs en el 4T26 (frente a la previsión anterior de niveles superiores a 290pbs).
4T25
1T26
2T26
3T26
4T26e
Se espera que el margen de intereses crezca alrededor de un 1% interanual, ligeramente por debajo del objetivo
16
Las comisiones crecieron alrededor de un 4% en el trimestre, a pesar de la estacionalidad negativa Comisiones netas
Variación trimestral positiva, impulsada por las comisiones de gestión de activos y seguros
M€
328
314 65
166
340
67
68
169
168
+3,7% 3T26/2T26
+2,1% 9M26/9M25
92
82
3T25 3Q25
2T26 2Q26
Crédito y riesgos contingentes
103
3T26 3Q26
•: El crecimiento de las comisiones de gestión de activos se apoyó en mayores activos bajo gestión y se vio impactado positivamente por 10M€ derivados del nuevo acuerdo con Amundi
• Las comisiones de servicios y las relacionadas con operaciones de riesgo de crédito se mantuvieron estables en el trimestre, pese a la habitual estacionalidad negativa
En 4T26, se espera que las comisiones crezcan trimestralmente apoyadas en: • Mayores niveles de actividad • Tras la renovación del acuerdo con Amundi, el nuevo nivel recurrente de comisiones de gestión de activos será c.5M€ superior por trimestre • Las comisiones de éxito de gestión de activos y seguros se registran en el 4T
Servicios Gestión de activos y seguros
Se espera que las comisiones crezcan alrededor de un 4% en el año 17
Los costes recurrentes se mantuvieron contenidos en el trimestre Costes totales M€
En el trimestre, los costes recurrentes totales se mantuvieron estables 561
603 33
570
91
102
102
169
167
166
-0,1% 3T26/2T261
+3,8% 9M26/9M252
301
301
302
• Los gastos de personal se mantuvieron estables, beneficiándose de los ahorros vinculados al plan de prejubilaciones • Los otros gastos generales se mantuvieron estables gracias a la contención de costes
Se espera que los costes recurrentes aumenten en 4T26 respecto al 3T26 • Estacionalidad negativa habitual en el 4T • Los ahorros del plan de prejubilaciones ya se están materializando desde el 3T26
3T25 3Q25
2T26 2Q26
3T26 3Q26
• La reclasificación del negocio de pagos en el 4T25 permitirá una comparativa interanual más favorable en el 4T26
Costes no recurrentes Amortización y depreciación Otros gastos generales Gastos de personal
1 Excluyendo -33M€ en el 2T26 de costes no recurrentes relacionados con iniciativas de eficiencia en España.
2 Excluyendo -88M€ de costes no recurrentes relacionados con iniciativas de eficiencia en España en 9M26.
Se espera que el crecimiento de los costes recurrentes sea de alrededor de 2% en el año, marginalmente mejor que el objetivo
18
Se espera que las mandíbulas sigan ampliándose en adelante Margen recurrente trimestral M€
El margen recurrente trimestral mejoró según lo previsto
2025
2026 • Margen de intereses: +2% trimestral • Comisiones: +3,7% trimestral • Costes recurrentes: -0,1% trimestral Mínimo
Las mandíbulas seguirán ampliándose, apoyadas en el crecimiento de ingresos y la disciplina en costes
1T25
2T25
3T25
4T25
1T26
2T26
3T26 4T26e 4T26
Margen de intereses + comisiones Costes recurrentes
19
El coste del riesgo se mantiene estable en 40pbs, en línea con el objetivo del año Provisiones de crédito
Desglose del total de provisiones 3T26
M€
M€
-8,8%
7
3T26/2T26
115
105
88
3T25 3Q25
32pbs
40pbs
CoR de crédito
CoR total
-3
+50,2% 9M26/9M25
2T26 2Q26
23
3T26 3Q26
El coste de riesgo total se mantendrá en ~40pbs en 2026
132
125 105
102
Provisiones de crédito
Provisiones de activos adjudicados
102
Costes de Otras gestión de provisiones activos problemáticos
Provisiones totales
• El coste de riesgo de crédito se mantuvo en niveles contenidos • La liberación de provisiones sobre activos adjudicados se explica por las plusvalías por ventas de activos inmobiliarios • Los costes de gestión de activos problemáticos y otras provisiones se situaron en línea con los niveles recurrentes
20
Balance 21
El ratio de morosidad siguió mejorando, mientras que los ratios de cobertura se mantuvieron estables Ratios de morosidad y cobertura M€ / %
2,75% 2.75% 3.634
3.390
Sep-25
Jun-26
2,47% 2.47%
2,40% 2.40%
Jun-26
Sep-26
3.298
Sep-25
Sep-26
Dudosos
Ratio de morosidad
69%
69%
Sep-25
Jun-26
Ratios clave de activos problemáticos
M€
%
Stage 3
Sep-26
% i.a.
Sep-26
% i.a.
Exposición (M€)
5.149
-949
3.298
-336
% del libro de crédito
3,8%
-86pbs
2,4%
-35pbs
Cobertura
4,7%
-10pbs
53,5%
+21pbs
1 Activos problemáticos / (inversión bruta + activos adjudicados).
Sep-26
Ratio de cobertura stage 3 con total provisiones
Exposición y ratio de cobertura por stages Stage 2
70%
Ratio de activos problemáticos brutos1 Ratio de activos problemáticos netos Activos problemáticos netos / activos totales
Sep-25
Jun-26
Sep-26
3,3%
2,9%
2,8%
1,2%
1,1%
1,0%
0,8%
0,7%
0,7% 22
Sólida posición de financiación y liquidez Métricas de liquidez
Ratings a largo plazo
%
Sep-26
93%
Rating de crédito Perspectiva a largo plazo
Loan-to-deposit
132% NSFR 185% LCR
Positiva
• AT1: Se espera normalizar el exceso de AT1 en 2027
Estable
• Tier 2: El déficit actual se compensa con el exceso de AT1
A-
Estable
A (low)
Estable
• Senior preferred / non-preferred: Mantener el colchón de gestión de MREL
Standard & Poor’s
A-
Moody’s
Baa1
Fitch Ratings DBRS
Activos líquidos totales MM€
50 18
51 18
52
19
32
33
34
Sep-25
Jun-26
Sep-26
Otros activos líquidos
Plan de financiación 2026
Nuevas emisiones en el año Instrumento
Importe
• Titulizaciones de transferencia significativa del riesgo (SRT): palanca de optimización de capital
(MM€)
Cédulas hipotecarias
1,3
Bonos senior (Certificados Bursátiles Bancarios, Sabadell México)
0,2
Total
- 2 titulizaciones (SRT)
• Cédulas hipotecarias: Emisión oportunista en euros
1,5
Menores necesidades de financiación MREL tras la venta de TSB
HQLAs
23
El ratio CET1 se mantuvo estable pese a los ajustes de valor razonable del trimestre Evolución del CET1 fully-loaded
Creación de valor para el accionista En €
+39pbs
+12%
de generación de capital antes del devengo del dividendo
+2pbs
+50pbs -13pbs
0,57
-38pbs
13,11%
13,12%
2,42
Sep-26 Sep-26
Sep-25 Sep-25
2,13
+1pbs Jun-26 Jun-26
Ajustes de Organic CET1 Fair value Generación valoración generation reservede la orgánica post AT1 adjustment cartera de renta de CET1 coupons fija post cupones
RWAs Crecimiento growth de APRs
Dividenddel Devengo accrual dividendo
Sep-26 Sep-26
Dividendos acumulados TBVpS tangible Cumulative dividends Valor contable por acción
de AT1
Nota: las ratios de capital de septiembre 2026 incluyen 12pbs de exceso de CET1 por encima del 13% (fully-loaded, aplicando el calendario regulatorio del output floor), nivel a partir del cual existe el compromiso de distribución de capital.
24
Consideraciones finales 25
La ampliación de las mandíbulas seguirá siendo la principal palanca de mejora de la rentabilidad en 2026 y en 2027 Objetivos 2026 Ingresos del negocio bancario
Costes Coste del Riesgo
El crecimiento de los ingresos continuará ✓ Se espera que el margen de intereses crezca en el 4T26 ▪ Los volúmenes de crédito y depósitos están en línea con los objetivos ▪ Margen de clientes alrededor de 290pbs a final del año ✓ El crecimiento de comisiones continuará en el 4T26
Mayor visibilidad de cara al cierre de año ✓ Comparativa interanual más favorable en el 4T26
Perspectiva favorable de la calidad de activos ✓ Mejora adicional de la ratio de morosidad ✓ Se espera que el CoR se mantenga estable en el 4T26
En línea para alcanzar nuestro objetivo de RoTE
~1% i.a. (margen de intereses)
~4% i.a.
Ligeramente reducido
(comisiones)
~2%
Ligeramente mejorado
pbs ~40
En línea
14,5% en 2026
16% en 2027
RoTE recurrente
RoTE Recurrente
Nuevo dividendo a cuenta en efectivo de 7cts€/acción, pagadero el 29 de diciembre
26
Anexo 01. Margen de intereses y de clientes 02. Vencimientos de deuda 03. Posición MREL 04. Cartera de renta fija 05. Evolución de activos problemáticos
- Desglose de APRs
- Colchón MDA
- Impactos no recurrentes
- Inteligencia artificial
27
Anexo 1 Rendimiento del crédito, coste de los recursos de clientes, margen de clientes y margen de intereses como % de los activos totales medios
Rendimiento del crédito y coste de recursos de clientes
Margen de clientes y margen de intereses como % de los activos totales medios
En %
En %
3,68%
3,64%
3,63%
3,62%
3,70%
0,77%
0,76%
0,78%
0,78%
0,84%
3T25
4T25
1T26
2T26
3T26
2,91%
2,88%
2,85%
2,84%
2,86%
1,79%
1,83%
1,78%
1,79%
1,81%
3T25
4T25
1T26
2T26
3T26
Rendimiento del crédito
Margen de clientes
Coste de recursos de clientes
Margen de intereses como % de los activos totales medios
28
Anexo 2 Vencimientos de deuda
4.210
3.921 2.500
2.235
457
1.450
1.118
2026
2027
2028
2029
2030
2031
2031
Cédulas hipotecarias
390
1.100
985
950
1.250
950
2.000
Deuda senior preferred
0
0
750
1.471
750
0
0
Deuda senior non-preferred
67
18
500
1.500
500
500
1.195
Deuda subordinada
0
0
0
0
0
0
1.015
Total
457
1.118
2.235
3.921
2.500
1.450
4.210
Vencimientos de deuda en euros y excluyendo emisiones AT1. Incluye únicamente vencimientos, no las calls. Se incluyen las emisiones de Banco Sabadell México.
29
Anexo 2 Vencimientos de deuda
Principales vencimientos y amortizaciones de deuda
Principales vencimientos o calls de deuda
en los últimos 6 meses
en los próximos 12 meses
Instrumento Cédulas hipotecarias Total
Fecha
Importe nominal
28/08/2026
1.000M€ 1.000M€
Fecha
Importe nominal
Cédulas hipotecarias
21/12/2026
390M€
Cédulas hipotecarias
26/04/2027
1.100M€
AT1
19/05/2027 (call)
750M€
Senior non-preferred
16/06/2027 (call)
500M€
Instrumento
Total
Nota: los instrumentos AT1 son perpetuos. Las fechas indicadas corresponden a las primeras fechas opcionales de amortización y se facilitan únicamente a efectos informativos.
2.740M€
30
Anexo 3 Situación MREL
Situación MREL % activos ponderados por riesgo (APR phase-in), % exposición de ratio de apalancamiento (LRE)
28,04%
25,38% Requerimiento en 20261
% 10,15
6,26% Requerimiento en 20261
3,98%
1,44% 2,15%
Posición subordinada MREL
% 18,33
8,71%
1,76%
Subordinación
24,06%
3,19%
Posición subordinada MREL
% 6,26
13,17%
Requerimiento subordinación en 20261
0,64% 1,15%
4,76%
Requerimiento subordinación en 20261
Sep-26 Sep-26 %Reportado RWA Reported (% APR)
CET1
Subordinación
5,94%
AT1
Tier 2
Senior non preferred
Sep-26 Sep-26 % LRE Reported Reportado (% LRE)
Senior preferred
1 Requerimiento aplicable desde el 7 de abril de 2026, según la comunicación recibida a través del Banco de España conforme a l a decisión adoptada por la Junta Única de Resolución (JUR).
Nota 1: las ratios de capital de septiembre 2026 incluyen 17pbs de exceso de CET1 por encima del 13%, nivel a partir del cual existe el compromiso de distribución de exceso de capital. Nota 2: las ratios incluyen el Combined Buffer Requirement (3,24% desde jun-26 en adelante).
31
Anexo 4 Cartera de renta fija
Evolución de la cartera de renta fija
Composición de la cartera de renta fija
MM€
MM€. Sep-26.
2,7 16,1% 31,6
17,5%
17,7%
34,8
35,4
5,6
5,7
5,9
4,1 1,6 1,6
20,1
España
Otros gobiernos europeos
Italia
SSAs y financieras en euros
Francia
Otros gobiernos y agencias no europeas
5,3 29,7
29,3
25,7
Sep-25
Jun-26
• La sensibilidad de la ratio CET1 a un movimiento de 100pbs en los tipos de interés es de 9pbs
Sep-26
• La sensibilidad de la ratio CET1 a un movimiento de 100pbs en los diferenciales de crédito por país es la siguiente: • España: 5pbs • Francia: 2pbs • Italia: 1pbs
Coste amortizado
Valor razonable % del total de activos
• Alrededor de 0,6MM€ vencen en 4T26 y alrededor de 2MM€ en 2027 Sep-26
Rendimiento
Duración total1
Vencimiento medio
Valor razonable
3,4%
1,4 años
4,2 años
Total
2,9%
3,2 años
5,7 años
Nota: la cartera de renta fija excluye la cartera de negociación. 1 La duración incluye el impacto de las coberturas.
• Plusvalías/minusvalías de capital latentes (después de impuestos): • Valor razonable: -0,2pp de CET1 • Coste amortizado: -1,2pp de CET1
32
Anexo 5 Evolución de activos problemáticos
Activos adjudicados M€
Activos adjudicados vendidos % 22
-19% i.a.
últimos 12 meses
+10% Prima promedio 93% Edificios terminados (stock)
729
636
588
Sep-25
Jun-26
Sep-26
Activos adjudicados
37%
35%
35%
Sep-25
Jun-26
Sep-26
Ratio de cobertura
Exposición de activos problemáticos y ratio de cobertura M€ -11% i.a.
64% 4.363
4.025
3.886
Sep-25
Jun-26
Sep-26
Activos problemáticos
Sep-25
63%
Jun-26
65%
Sep-26
Ratio de cobertura
Nota: incluye riesgos contingentes. Ratio de cobertura de activos problemáticos calculada como (provisiones totales de crédito + provisiones totales de activos adjudicados) / (stage 3 + activos adjudicados).
33
Anexo 6 Desglose de APRs
Por tipo:
Por geografía:
Riesgo de crédito
Riesgo operacional
MM€ 57,0
MM€ 12,7
M€ 70.568 APRs phase-in Sep-26
España
MM€ 63,4 Reino Unido
Riesgo de mercado
Otros
MM€ 0,6
MM€ 0,3
MM€ 2,9 México
MM€ 4,3
34
Anexo 7 Colchón MDA
Datos a Sep-26 Requerimientos de capital
Posición de capital
Requerimientos de capital
(phase-in)
(pro-forma de 2027)
pbs 424 Colchón MDA
Pilar 1 CET1
4,50%
4,50%
Requerimiento CET1 de Pilar 2 (P2R)
1,18%1
1,13%1
Colchón de conservación de capital
2,50%
2,50%
Colchón anticíclico
0,49%
0,86%
Otras entidades de importancia sistémica
0,25%
0,25%
CET1
8,92%
13,17%
9,24%
AT1
1,89%1
3,19%
1,88%1
• El MDA se sitúa en 424pbs por encima del requerimiento actual y en 393pbs por encima del requerimiento de 2027
Tier 2
2,53%1
1,76%
2,50%1
• La ratio de apalancamiento phase-in aumentó +28pbs interanualmente
Capital total
13,34%
18,11%
13,61%
% 5,9 Ratio de apalancamiento phase-in
Las ratios de capital incluyen 17pbs de exceso de CET1 por encima del 13%, nivel a partir del cual se activa el compromiso de distribuir el exceso de capital. 1 Aplicando el artículo 104a de la CRD, que asume que el banco puede utilizar exceso de Tier 2 y AT1 para cumplir el P2R (en total el 43,7% del P2R puede cubrirse con exceso de capital híbrido, de los cuales 18,75% sería mediante AT1 y 25% mediante Tier 2).
35
Anexo 8 Impactos no recurrentes
M€ Concepto Venta de TSB Cobertura de la divisa de los ingresos de la venta de TSB
Costes no recurrentes derivados del programa de prejubilaciones
Venta de una participación accionarial Total
Líneas de la cuenta de resultados impactadas
9M26
Últimos 12 meses
Bruto
Neto
Bruto
Neto
Plusvalía por venta de activos y otros resultados
331
316
331
316
ROF y diferencias de cambio
9
6
9
6
ROF y diferencias de cambio
-17
-12
-30
-21
Costes totales
-88
-61
-88
-61
Provisiones
-2
-1
-2
-1
Plusvalía por venta de activos y otros resultados
-2
-2
-2
-2
Plusvalía por venta de activos y otros resultados
-45
-45
-45
-45
201
191
36
Anexo 9 Inteligencia artificial: de casos de uso probados a un escalado selectivo Fases de madurez
Casos de uso de éxito Asistente de IA en tiempo real
Configurar & Probar Foco actual
Seleccionar & Escalar
(para agentes de atención remota al cliente)
Pagos agénticos
Productividad de los empleados
(Mastercard Agent Pay)
(100% de los empleados con acceso a Copilot)
3pp
1er pago
Resolución en el primer contacto
realizado con éxito
20% de los empleados utilizan agentes de IA a diario
Facilitadores clave Nuevo diseño organizativo
Función específica de transformación corporativa e IA para impulsarla a escala
Capacidades IT
Construyendo la base tecnológica para desplegar IA de forma segura y a escala, con la plataforma agéntica de T-Systems como ejemplo destacado
Áreas específicas de foco
Transformar
Relación con clientes
Industrialización de procesos
Productividad comercial
Empleados (Servicios centrales) 37
Glosario
APRs
Activos ponderados por riesgo
MDA
Maximum Distributable Amount
BCE
Banco Central Europeo
MREL
Minimum Requirement of Eligible Liabilities
CET1
Common Equity Tier 1
NSFR
Net Stable Funding Ratio
Pymes
Pequeña y mediana empresa
pbs
Puntos básicos
P2R
Requerimiento Pilar 2
ROF
Resultados de operaciones financieras
RoTE
Return on Tangible Equity
SREP
Supervisory Review and Evaluation Process
SSAs
Sovereigns, Supranationals, and Agencies
CRD HQLA IA
Capital requirements directive High Quality Liquid Assets (Activos líquidos de alta calidad) Inteligencia artificial
i.a.
Interanual
JGA
Junta General de Accionistas
LCR
Ratio de cobertura de liquidez de corto plazo
LRE
Leverage Ratio Exposure
TC
Tipo de cambio
LTV
Loan To Value, Relación valor-préstamo
v.t.
Variación trimestral
38
Aviso legal Esta presentación (la “Presentación”) ha sido preparada y emitida por y es de exclusiva
Valores (“CNMV”) y a disposición del público tanto en la web de Banco Sabadell
Consulte el Informe financiero trimestral (https://www.grupbancsabadell.com/corp/es/accionistas-
responsabilidad de Banco de Sabadell, S.A. (“Banco Sabadell” o la “Sociedad”). A estos efectos,
(www.grupbancsabadell.com) como en la de la CNMV (www.cnmv.es), así como otros factores de e-inversores/informacion-economico-financiera.html) para una explicación más detallada de las
la Presentación comprende e incluye las diapositivas contenidas en este documento, la
riesgo actualmente desconocidos o imprevisibles, que pueden estar fuera del control de Banco
MARs utilizadas, incluyendo su definición o la reconciliación entre los indicadores de gestión
exposición oral que, en su caso, se haga de estas diapositivas por la Sociedad y sus
Sabadell, pueden afectar de forma adversa a su negocio y situación financiera y causar que los
aplicables y las partidas presentadas en los estados financieros consolidados elaborados de
Representantes (según se definen más abajo), así como cualquier sesión de preguntas y
resultados difieran materialmente de aquellos que subyacen en las manifestaciones a futuro y
conformidad con las NIIF.
respuestas que siga a la citada exposición oral y cualquier documento o material informativo que
estimaciones, previsiones, objetivos o proyecciones. En consecuencia, no debe depositarse una
Los datos del mercado y la posición competitiva incluidos en la Presentación se han obtenido
se distribuya o guarde relación con cualquiera de los anteriores.
confianza indebida en las manifestaciones a futuro contenidas en esta Presentación.
generalmente de publicaciones sobre el sector y encuestas o estudios realizados por terceros. La
La información contenida en esta Presentación no pretende ser exhaustiva ni ha sido verificada
La información contenida en esta Presentación, incluyendo pero no limitada a las manifestaciones información sobre otras entidades se ha tomado de informes publicados por dichas entidades.
de forma independiente y parte de ella está expresada en forma resumida. Ni Banco Sabadell ni
a futuro y estimaciones o proyecciones, se entienden realizadas a la fecha de esta Presentación
Existen limitaciones respecto a la disponibilidad, exactitud, exhaustividad y comparabilidad de
ninguna de las sociedades de su grupo (“Grupo Banco Sabadell”), ni sus respectivos consejeros,
(salvo que se refieran a otra fecha específica) y no pretenden dar ninguna seguridad en cuanto a
dicha información. Banco Sabadell no ha verificado dicha información de forma independiente y
directivos, empleados, representantes o agentes (los “Representantes”) realizan ninguna
los resultados futuros. No existe ninguna obligación de actualizar, completar, revisar o mantener
no puede garantizar su exactitud y exhaustividad. Ciertas manifestaciones incluidas en la
manifestación sobre ni garantizan, expresa o tácitamente, la ecuanimidad, exactitud,
al día la información contenida en esta Presentación, sea como consecuencia de nueva
Presentación sobre el mercado y la posición competitiva de Banco Sabadell se basan en análisis
exhaustividad y corrección de la información aquí contenida ni, en consecuencia, debe darse esta información o de sucesos o resultados futuros o por cualquier otro motivo. La información
internos de Banco Sabadell, que conllevan determinadas asunciones y estimaciones. Estos
por sentada. Ni Banco Sabadell ni ninguna de las sociedades del Grupo Banco Sabadell, ni sus
contenida en esta Presentación puede ser objeto de modificación en cualquier momento sin
análisis internos no han sido verificados por ninguna fuente independiente y no puede asegurarse
respectivos Representantes asumen responsabilidad alguna (ya sea a título de negligencia o de
previo aviso y no debe confiarse en ella a ningún efecto.
que dichas estimaciones o asunciones sean correctas. En consecuencia, no se debe depositar
cualquier otro modo) cualquier daño, perjuicio o coste directo o indirecto (incluyendo, pero no
Esta Presentación contiene información financiera derivada de los estados financieros no
una confianza indebida en los datos sobre el sector, el mercado o la posición competitiva de
limitado a daños consecuenciales, daños reputacionales, lucro cesante, daños punitivos o daños
auditados del Grupo Banco Sabadell correspondientes al tercer trimestre de 2026. La información Banco Sabadell contenidos en esta Presentación.
morales) derivado del uso de esta Presentación, de sus contenidos o relacionado de cualquier
financiera por áreas de negocio ha sido formulada de conformidad con las Normas
La distribución de esta Presentación en ciertas jurisdicciones puede estar restringida por la ley.
otra forma con la Presentación por, con excepción de cualquier responsabilidad derivada de dolo, Internacionales de Información Financiera (“NIIF”), así como con los criterios de contabilidad y se exoneran expresamente de cualquier responsabilidad, directa o indirecta, expresa o implícita, internos del Grupo Banco Sabadell con el fin de que cada área presente de manera fiel la
Los receptores de esta Presentación deben informarse sobre estas limitaciones y atenerse a
contractual, extracontractual, legal o de cualquier otra fuente, por la exactitud y exhaustividad de
naturaleza de su negocio. Los criterios mencionados anteriormente no están sujetos a normativa
de la distribución de esta Presentación por sus receptores.
la información contenida en esta Presentación, y por las opiniones vertidas en ella así como por
alguna y podrían incluir estimaciones, así como valoraciones subjetivas que, en caso de
los posibles errores, omisiones o incorrecciones que puedan existir en la Presentación.
El Grupo Banco Sabadell y sus Representantes no son responsables, ni aceptan responsabilidad
adoptarse una metodología distinta, podrían presentar diferencias significativas en la información
alguna, por el uso, las valoraciones, opiniones, expectativas o decisiones que puedan adoptarse
Banco Sabadell advierte que esta Presentación puede contener manifestaciones a futuro y
presentada.
por terceros con motivo de la publicación de esta Presentación.
estimaciones, previsiones, objetivos o proyecciones respecto al negocio, la situación financiera, la Adicionalmente a la información financiera preparada de acuerdo con las NIIF, esta Presentación estrategia, los planes y los objetivos del Grupo Banco Sabadell. Si bien estas manifestaciones a incluye ciertas Medidas Alternativas del Rendimiento (“MARs”) según se definen en el
ellas. El Grupo Banco Sabadell y sus Representantes se exoneran de responsabilidad respecto
Nadie debe adquirir o suscribir valores o instrumentos financieros de la Sociedad con base en esta Presentación. Esta Presentación no constituye, ni forma parte, ni debe entenderse como (i)
futuro y estimaciones, previsiones, objetivos o proyecciones representan la opinión actual del
Reglamento Delegado (UE) 2019/979 de la Comisión, de 14 de marzo de 2019 y en las
Grupo Banco Sabadell sobre las expectativas futuras relativas al desarrollo de su negocio, un
Directrices sobre las Medidas Alternativas del Rendimiento publicadas por la European Securities adquirir, valor o instrumento financiero alguno ni, incluso por el hecho de su comunicación, and Markets Authority el 5 de octubre de 2015 (ESMA/2015/1415es). Las MARs son medidas del constituye ni forma parte, ni puede tomarse como base, ni puede entenderse como una inducción
cierto número de riesgos, incertidumbres y otros factores relevantes podrían ocasionar que los resultados reales sean materialmente diferentes de las expectativas del Grupo Banco Sabadell.
una oferta, solicitud o invitación a suscribir, adquirir, vender, emitir, asegurar o de otra manera
rendimiento financiero elaboradas a partir de la información financiera del Grupo Banco Sabadell
Estos factores incluyen, pero no se limitan a: (1) la situación del mercado, factores
a la ejecución, de ningún contrato o compromiso de cualquier índole en relación con valor o
pero que no están definidas o detalladas en el marco de información financiera aplicable y que,
macroeconómicos, tendencias gubernamentales, políticas y regulatorias; (2) movimientos en los
instrumento financiero alguno; ni como (ii) una forma de opinión financiera, recomendación o
por tanto, no han sido auditadas ni son susceptibles de serlo en su totalidad. Estas MARs se
mercados bursátiles nacionales e internacionales, tipos de cambio y tipos de interés; (3)
asesoramiento de carácter financiero o inversor en relación con valor o instrumento financiero
utilizan con el objetivo de que contribuyan a una mejor comprensión del desempeño financiero del alguno.
presiones competitivas; (4) desarrollos tecnológicos; (5) cambios en la posición financiera o la
Grupo Banco Sabadell pero deben considerarse como una información adicional, y en ningún
solvencia de sus clientes, deudores y contrapartes y (6) el conflicto militar entre Rusia y Ucrania.
caso sustituyen la información financiera elaborada de acuerdo con las NIIF. Asimismo, la forma
Estos y otros factores de riesgo descritos en los informes y documentos pasados o futuros del
en la que el Grupo Banco Sabadell define y calcula estas MARs puede diferir de la de otras
Grupo Banco Sabadell, incluyendo aquellos remitidos a la Comisión Nacional del Mercado de
entidades que empleen medidas similares y, por tanto, podrían no ser comparables entre ellas.
Mediante la recepción de, o el acceso a, esta Presentación Vd. acepta y queda vinculado por los términos, condiciones y restricciones antes expuestos.
39
Presentación de resultados
3T26
Nota de prensa 29 de octubre 2026
Banco Sabadell gana 1.376 M€ hasta septiembre, confirma su sólido dinamismo comercial y anuncia un dividendo a cuenta en efectivo de 325 M€ • El beneficio recurrente asciende a 405 millones de euros en el tercer trimestre, un
13% más que en el segundo, con los ingresos del negocio bancario reafirmando su senda al alza (+2% en el margen de intereses y +3,7% en las comisiones) y los costes recurrentes estables (-0,1%)
• El negocio sigue mostrando su fortaleza, con el crédito creciendo el 4% interanual y los recursos de clientes aumentando el 5,6%. En España, la financiación se incrementa en todos los segmentos durante el ejercicio, liderada por el consumo (+9%) y acompañada por los avances en pymes y empresas (+3%) y en hipotecas (+2,4%)
• La entidad pagará un dividendo a cuenta en efectivo de 7 céntimos por acción el 29
de diciembre y tiene aún pendiente de ejecutar 57 millones de euros del programa de recompra de acciones. La capacidad de retribución al accionista se sustenta en la continua generación orgánica de capital, que sitúa la ratio CET1 fully loaded en el 13,12%
• La rentabilidad aumenta hasta el 14,2%, en línea con los objetivos de RoTE recurrente previstos del 14,5% este año y el 16% en 2027, gracias al continuo crecimiento del negocio, la disciplina en la gestión de los gastos y la calidad de los activos "Demostramos una vez más nuestra capacidad para hacer crecer de forma sostenible el negocio, mientras mejoramos los ingresos y contenemos los costes. En un entorno exigente, la fortaleza del proyecto del banco nos permite seguir creando valor para nuestros clientes y accionistas, al tiempo que progresamos en la transformación de la entidad” Marc Armengol CEO
Dirección de Comunicación [email protected]
“Los resultados ponen de manifiesto la calidad y recurrencia de nuestra generación de beneficios. La combinación de un RoTE creciente, una sólida solvencia y una mejora continuada de la calidad crediticia refuerza nuestra capacidad para sostener una política de remuneración atractiva para nuestros accionistas” Sergio Palavecino CFO
@SabadellPremsa @SabadellPrensa @SabadellPress
1
Presentación de resultados
3T26
Nota de prensa 29 de octubre 2026
Grupo Banco Sabadell ha obtenido un beneficio neto de 1.376 millones de euros entre enero y septiembre de 2026, en línea con el mismo periodo del año anterior (-1%) e incluyendo la aportación de TSB (que en el presente ejercicio formó parte del grupo durante cuatro meses hasta su venta). El banco obtuvo un beneficio neto recurrente de 405 millones de euros en el tercer trimestre de 2026, un 13% más que en el anterior. Esta evolución pone de manifiesto la fortaleza del negocio en España y la capacidad de la entidad para seguir impulsando un crecimiento rentable y sostenible, elevando el beneficio neto recurrente de los nueve primeros meses del ejercicio hasta los 1.096 millones de euros. En línea con lo anticipado, los ingresos del negocio bancario han vuelto a crecer trimestralmente (+2,4%) gracias al fuerte dinamismo de la actividad comercial, una tendencia que continuará en la parte final del año. Esta mejora ha contribuido a que la rentabilidad RoTE recurrente se incremente desde el 13,6% de junio hasta el 14,2%. La pujanza del negocio, la contención de los gastos y la elevada calidad de los activos seguirán elevando dicha rentabilidad en los próximos trimestres, hasta alcanzar los objetivos previstos del 14,5% al cierre de 2026 y el 16% en 2027.
Dirección de Comunicación [email protected]
@SabadellPremsa @SabadellPrensa @SabadellPress
2
Presentación de resultados
3T26
Nota de prensa 29 de octubre 2026
El banco ha anunciado su segunda remuneración al accionista con cargo a los resultados del ejercicio 2026. La entidad abonará un dividendo a cuenta en efectivo de 7 céntimos por acción el próximo 29 de diciembre, lo que supondrá el reparto de 325 millones de euros. El pago es adicional al programa de recompra de acciones por importe de 331 millones de euros que inició en julio, del que aún quedan 57 millones por ejecutar (un 17% del total), y se produce tras el abono en mayo de un dividendo extraordinario de 50 céntimos en efectivo por acción tras la venta de TSB. La atractiva política de remuneración a los accionistas se sustenta en la capacidad del banco de generar capital de manera orgánica. La ratio de solvencia CET1 fully loaded se ha situado en el 13,12%. El consejero delegado de Banco Sabadell, Marc Armengol, ha afirmado: “Demostramos una vez más nuestra capacidad para hacer crecer de forma sostenible el negocio, mientras mejoramos los ingresos y contenemos los costes. En un entorno exigente, la fortaleza del proyecto del banco nos permite seguir creando valor para nuestros clientes y accionistas, al tiempo que progresamos en la transformación de la entidad”. El director financiero de Banco Sabadell, Sergio Palavecino, ha asegurado: “Los resultados ponen de manifiesto la calidad y recurrencia de nuestra generación de beneficios. La combinación de un RoTE creciente, una sólida solvencia y una mejora continuada de la calidad crediticia refuerza nuestra capacidad para sostener una política de remuneración atractiva para nuestros accionistas”.
Continúa el impulso de la actividad comercial El elevado dinamismo comercial ha llevado a un incremento del crédito vivo del 4% interanual, hasta los 124.913 millones de euros. En España, el crecimiento es del 3% en lo que va de año, hasta los 106.434 millones de euros, con aumentos en todos los segmentos. En pymes y grandes empresas, la inversión crediticia se ha situado en 45.599 millones de euros, lo que representa un aumento del 3% en el ejercicio. El crédito vivo en hipotecas también registra una evolución positiva. Aumenta hasta los 40.716 millones de euros (+3,5% interanual), con un crecimiento de la nueva producción del 5% frente al trimestre anterior. El continuado impulso comercial se ha plasmado igualmente en el crédito al consumo, que se ha situado en 5.880 millones de euros (+12,7% interanual), con una nueva producción que se incrementa trimestralmente el 13%.
Dirección de Comunicación [email protected]
@SabadellPremsa @SabadellPrensa @SabadellPress
3
Presentación de resultados
3T26
Nota de prensa 29 de octubre 2026
La pujanza del negocio también se ha plasmado en los recursos de clientes, que experimentan un incremento interanual del 5,6% en el Grupo, hasta los 189.449 millones de euros. El crecimiento se ha producido tanto en los recursos en balance (+4,6% interanual) como en los fuera de balance (+8,1% interanual). En estos últimos, destaca especialmente la positiva dinámica de los fondos de inversión, apoyada en las suscripciones netas positivas, y el buen comportamiento de la actividad de gestión de patrimonios.
Ingresos al alza y costes recurrentes contenidos Sin contar con TSB, Banco Sabadell ha obtenido unos ingresos del negocio bancario (margen de intereses más comisiones) de 3.677 millones de euros entre enero y septiembre, de los que 1.260 millones se han logrado en el tercer trimestre, en el que ha registrado un incremento del 2,4% frente al segundo, y fruto del continuado dinamismo de la actividad comercial. Dichos ingresos han comenzado a crecer interanualmente (+0,1%) y lo harán de forma más pronunciada en los próximos trimestres.
Dirección de Comunicación [email protected]
@SabadellPremsa @SabadellPrensa @SabadellPress
4
Presentación de resultados
3T26
Nota de prensa 29 de octubre 2026
El margen de intereses ha seguido avanzando en la mejora que inició en el segundo trimestre del ejercicio, con un crecimiento trimestral del 2%, hasta los 920 millones de euros, impulsado principalmente por los mayores volúmenes de crédito y acompañado por la gestión disciplinada de los tipos de interés. Tras alcanzar los 2.694 millones de euros entre enero y septiembre, el banco prevé cerrar el año con un alza de en torno al 1% en el conjunto del ejercicio. En la misma tendencia, los ingresos por comisiones mejoran un 3,7% frente al segundo trimestre, hasta los 340 millones de euros, lo que ha favorecido que hayan comenzado a crecer interanualmente un 2,1%, hasta los 983 millones entre enero y septiembre, fruto de la mayor contribución de las comisiones de gestión de activos en el marco de la ampliación del acuerdo con Amundi. Esta tendencia también continuará en la parte final del año y permitirá cerrar el ejercicio con un alza de en torno al 4%. Los costes totales se situaron en 1.797 millones de euros entre enero y septiembre e incorporan 88 millones de euros no recurrentes derivados del plan de prejubilaciones puesto en marcha en España. Este plan se completó en el primer semestre y aportará unos ahorros anualizados de 40 millones de euros brutos a partir de 2027, de los que ya se han empezado a recoger parte de los 20 millones que se prevé obtener en el segundo semestre de 2026. Así, los costes recurrentes permanecieron estables en el trimestre (-0,1%) y la previsión es que crezcan en torno al 2% en el conjunto de 2026, mejor de lo esperado hasta ahora. El resultado entre enero y septiembre recoge varios impactos extraordinarios. Por un lado, la venta de TSB ha generado unas plusvalías netas de impuestos de 322 millones de euros (340 millones brutos). De otra parte, se han registrado otros impactos, como el plan de prejubilaciones en España. El saldo total ha resultado en una aportación positiva de 201 millones de euros netos a la cuenta de resultados. Paralelamente, TSB aportó 79 millones de euros de beneficio en los cuatro meses en que formó parte del Grupo durante el presente ejercicio. En cuanto a la calidad de los activos, la ratio de morosidad continúa mejorando y se reduce al 2,4% en el tercer trimestre de 2026, frente al 2,47% del trimestre anterior y el 2,75% de doce meses antes, con una cobertura stage 3 con el total de provisiones que se eleva al 70,1%. Esta buena evolución es producto de la aceleración en la reducción de los activos problemáticos, que han bajado en 140 millones de euros en el trimestre y 477 millones de euros en los últimos doce meses, hasta los 3.886 millones de euros. Las provisiones totales se han reducido un 13% en el trimestre, mientras que el coste del riesgo se ha mantenido en los 40 puntos básicos, la cifra prevista para el conjunto del ejercicio.
Dirección de Comunicación [email protected]
@SabadellPremsa @SabadellPrensa @SabadellPress
5
Presentación de resultados
Nota de prensa 29 de octubre 2026
3T26
Datos acumulados en millones €
Sep 25
Sep 26
Variación interanual
Margen de intereses
2.709
2.694
-0,6%
962
983
2,1%
3.672
3.677
0,1%
ROF y diferencias de cambio
-15
46
--
Otros resultados de explotación
82
54
-33,4%
3.738
3.777
1,0%
-1.381
-1.492
8,1%
-265
-304
14,7%
-1.646
-1.797
9,1%
-1.646
-1.709
3,8%
0
-88
--
2.092
1.981
-5,3%
Total provisiones y deterioros
-367
-418
13,8%
Plusvalías por venta de activos y otros resultados
-17
277
--
1.708
1.840
7,7%
-560
-543
-3,1%
1.148
1.297
13,0%
Aportación neta TSB
242
79
-67,3%
Beneficio neto con TSB
1.390
1.376
-1,0%
MAGNITUDES Saldos posición en millones €
Sep 25
Sep 26
Variación interanual
Total activos
244.529
199.258
-18,5%
Inversión crediticia bruta viva
120.103
124.913
4,0%
Recursos de clientes en balance
127.660
133.569
4,6%
Recursos de clientes de fuera de balance
51.670
55.880
8,1%
RATIOS
Sep 25
Sep 26
Core capital / Common equity fully-loaded (%)
13,7
13,1
Ratio de morosidad (%)
2,75
2,40
Ratio de cobertura stage 3 con total provisiones (%)
69,3
70,1
Número de oficinas
1.163
1.083
Número de personas empleadas
14.168
13.749
Comisiones
Ingresos del negocio bancario
Margen bruto Gastos de explotación Amortización Total costes Promemoria: Costes recurrentes Costes no recurrentes
Margen antes de dotaciones
Beneficio antes de impuestos Impuestos y minoritarios
Beneficio neto
Dirección de Comunicación [email protected]
@SabadellPremsa @SabadellPrensa @SabadellPress
6

-
Sala de Prensa
-
Nos entendemos
es
Español
-
Sala de Prensa
-
Nos entendemos
 Presentación de resultados 3T26
Banco Sabadell gana 1.376 M€ hasta septiembre, confirma su sólido dinamismo comercial y anuncia un dividendo a cuenta en efectivo de 325 M€
29.10.2026
- El beneficio recurrente asciende a 405 millones de euros en el tercer trimestre, un 13% más que en el segundo, con los ingresos del negocio bancario reafirmando su senda al alza (+2%en el margen de intereses y +3,7% en las comisiones) y los costes recurrentes estables (-0,1%)
- El negocio sigue mostrando su fortaleza, con el crédito creciendo el 4% interanual y los recursos de clientes aumentando el 5,6%. En España, la financiación se incrementa en todos los segmentos durante el ejercicio, liderada por el consumo (+9%) y acompañada por los avances en pymes y empresas (+3%) y en hipotecas (+2,4%)
- La entidad pagará un dividendo a cuenta en efectivo de 7 céntimos por acción el 29 de diciembre y tiene aún pendiente de ejecutar 57 millones de euros del programa de recompra de acciones. La capacidad de retribución al accionista se sustenta en la continua generación orgánica de capital, que sitúa la ratio CET1 fully loaded en el 13,12%
- La rentabilidad aumenta hasta el 14,2%, en línea con los objetivos de RoTE recurrente previstos del 14,5% este año y el 16% en 2027, gracias al continuo crecimiento del negocio, la disciplina en la gestión de los gastos y la calidad de los activos

Demostramos una vez más nuestra capacidad para hacer crecer de forma sostenible el negocio, mientras mejoramos los ingresos y contenemos los costes. En un entorno exigente, la fortaleza del proyecto del banco nos permite seguir creando valor para nuestros clientes y accionistas, al tiempo que progresamos en la transformación de la entidad
Marc Armengol CEO

Los resultados ponen de manifiesto la calidad y recurrencia de nuestra generación de beneficios. La combinación de un RoTE creciente, una sólida solvencia y una mejora continuada de la calidad crediticia refuerza nuestra capacidad para sostener una política de remuneración atractiva para nuestros accionistas
Sergio Palavecino Director Financiero
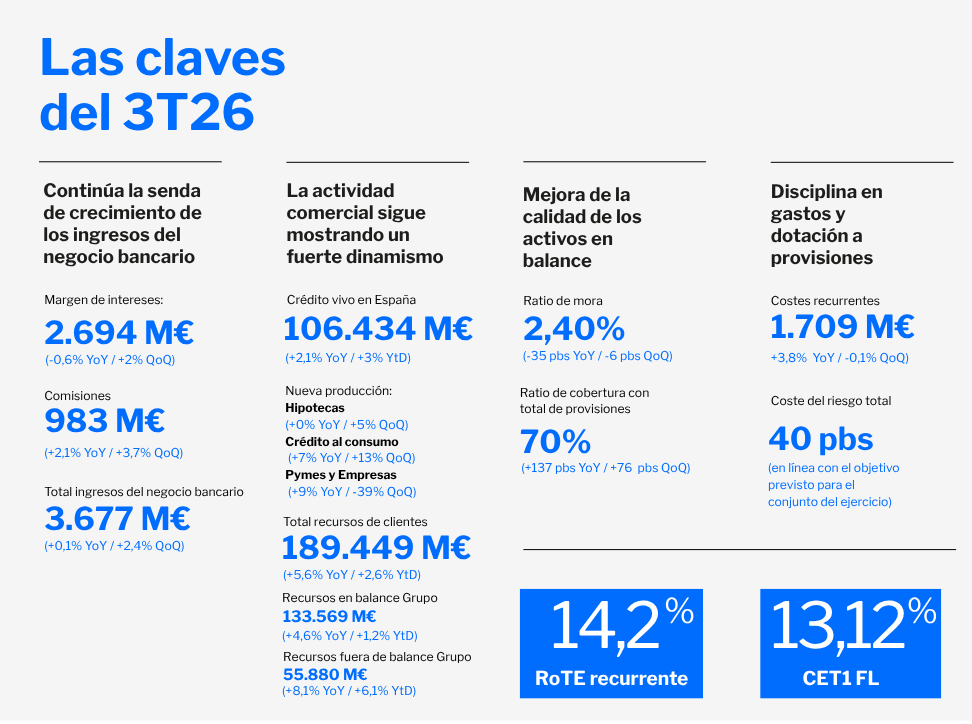
Grupo Banco Sabadell ha obtenido un beneficio neto de 1.376 millones de euros entre enero y septiembre de 2026, en línea con el mismo periodo del año anterior (-1%) e incluyendo la aportación de TSB (que en el presente ejercicio formó parte del grupo durante cuatro meses hasta su venta). El banco obtuvo un beneficio neto recurrente de 405 millones de euros en el tercer trimestre de 2026, un 13% más que en el anterior. Esta evolución pone de manifiesto la fortaleza del negocio en España y la capacidad de la entidad para seguir impulsando un crecimiento rentable y sostenible, elevando el beneficio neto recurrente de los nueve primeros meses del ejercicio hasta los 1.096 millones de euros.
En línea con lo anticipado, los ingresos del negocio bancario han vuelto a crecer trimestralmente (+2,4%) gracias al fuerte dinamismo de la actividad comercial, una tendencia que continuará en la parte final del año. Esta mejora ha contribuido a que la rentabilidad RoTE recurrente se incremente desde el 13,6% de junio hasta el 14,2%. La pujanza del negocio, la contención de los gastos y la elevada calidad de los activos seguirán elevando dicha rentabilidad en los próximos trimestres, hasta alcanzar los objetivos previstos del 14,5% al cierre de 2026 y el 16% en 2027.
El banco ha anunciado su segunda remuneración al accionista con cargo a los resultados del ejercicio 2026. La entidad abonará un dividendo a cuenta en efectivo de 7 céntimos por acción el próximo 29 de diciembre, lo que supondrá el reparto de 325 millones de euros. El pago es adicional al programa de recompra de acciones por importe de 331 millones de euros que inició en julio, del que aún quedan 57 millones por ejecutar (un 17% del total), y se produce tras el abono en mayo de un dividendo extraordinario de 50 céntimos en efectivo por acción tras la venta de TSB. La atractiva política de remuneración a los accionistas se sustenta en la capacidad del banco de generar capital de manera orgánica. La ratio de solvencia CET1 fully loaded se ha situado en el 13,12%.
El consejero delegado de Banco Sabadell, Marc Armengol, ha afirmado: “Demostramos una vez más nuestra capacidad para hacer crecer de forma sostenible el negocio, mientras mejoramos los ingresos y contenemos los costes. En un entorno exigente, la fortaleza del proyecto del banco nos permite seguir creando valor para nuestros clientes y accionistas, al tiempo que progresamos en la transformación de la entidad”.
El director financiero de Banco Sabadell, Sergio Palavecino, ha asegurado: “Los resultados ponen de manifiesto la calidad y recurrencia de nuestra generación de beneficios. La combinación de un RoTE creciente, una sólida solvencia y una mejora continuada de la calidad crediticia refuerza nuestra capacidad para sostener una política de remuneración atractiva para nuestros accionistas”.
325M
Dividendo a cuenta en efectivo (Fecha de abono: 29 de diciembre)
331M
Recompra de acciones
Continúa el impulso de la actividad comercial
El elevado dinamismo comercial ha llevado a un incremento del crédito vivo del 4% interanual, hasta los 124.913 millones de euros. En España, el crecimiento es del 3% en lo que va de año, hasta los 106.434 millones de euros, con aumentos en todos los segmentos. En pymes y grandes empresas, la inversión crediticia se ha situado en 45.599 millones de euros, lo que representa un aumento del 3% en el ejercicio.
El crédito vivo en hipotecas también registra una evolución positiva. Aumenta hasta los 40.716 millones de euros (+3,5% interanual), con un crecimiento de la nueva producción del 5% frente al trimestre anterior. El continuado impulso comercial se ha plasmado igualmente en el crédito al consumo, que se ha situado en 5.880 millones de euros (+12,7% interanual), con una nueva producción que se incrementa trimestralmente el 13%.
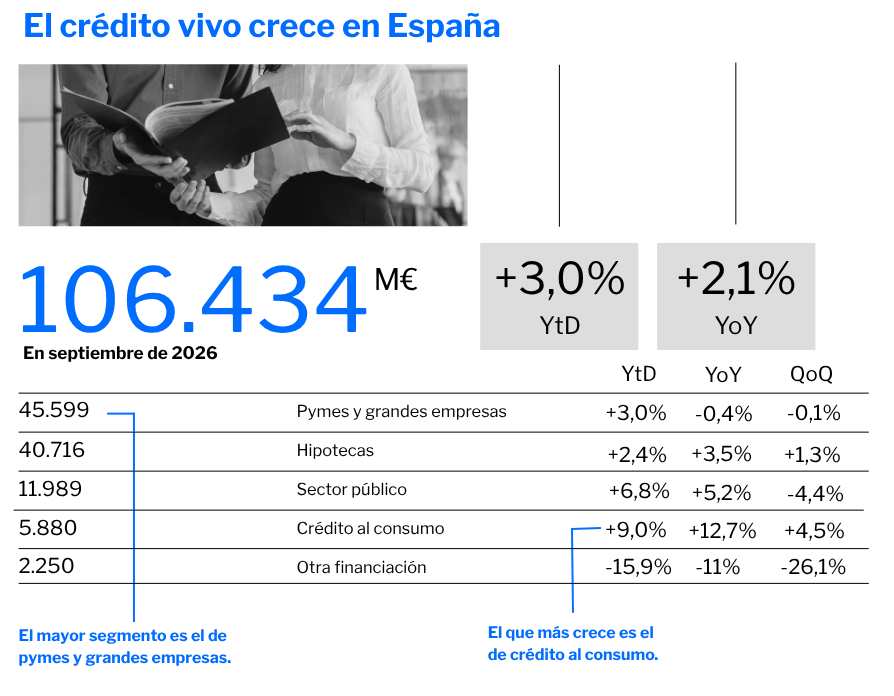
La pujanza del negocio también se ha plasmado en los recursos de clientes, que experimentan un incremento interanual del 5,6% en el Grupo, hasta los 189.449 millones de euros. El crecimiento se ha producido tanto en los recursos en balance (+4,6% interanual) como en los fuera de balance (+8,1% interanual). En estos últimos, destaca especialmente la positiva dinámica de los fondos de inversión, apoyada en las suscripciones netas positivas, y el buen comportamiento de la actividad de gestión de patrimonios.
Ingresos al alza y costes recurrentes contenidos
Sin contar con TSB, Banco Sabadell ha obtenido unos ingresos del negocio bancario (margen de intereses más comisiones) de 3.677 millones de euros entre enero y septiembre, de los que 1.260 millones se han logrado en el tercer trimestre, en el que ha registrado un incremento del 2,4% frente al segundo, y fruto del continuado dinamismo de la actividad comercial. Dichos ingresos han comenzado a crecer interanualmente (+0,1%) y lo harán de forma más pronunciada en los próximos trimestres.
El margen de intereses ha seguido avanzando en la mejora que inició en el segundo trimestre del ejercicio, con un crecimiento trimestral del 2%, hasta los 920 millones de euros, impulsado principalmente por los mayores volúmenes de crédito y acompañado por la gestión disciplinada de los tipos de interés. Tras alcanzar los 2.694 millones de euros entre enero y septiembre, el banco prevé cerrar el año con un alza de en torno al 1% en el conjunto del ejercicio.
En la misma tendencia, los ingresos por comisiones mejoran un 3,7% frente al segundo trimestre, hasta los 340 millones de euros, lo que ha favorecido que hayan comenzado a crecer interanualmente un 2,1%, hasta los 983 millones entre enero y septiembre, fruto de la mayor contribución de las comisiones de gestión de activos en el marco de la ampliación del acuerdo con Amundi. Esta tendencia también continuará en la parte final del año y permitirá cerrar el ejercicio con un alza de en torno al 4%.
Los costes totales se situaron en 1.797 millones de euros entre enero y septiembre e incorporan 88 millones de euros no recurrentes derivados del plan de prejubilaciones puesto en marcha en España. Este plan se completó en el primer semestre y aportará unos ahorros anualizados de 40 millones de euros brutos a partir de 2027, de los que ya se han empezado a recoger parte de los 20 millones que se prevé obtener en el segundo semestre de 2026. Así, los costes recurrentes permanecieron estables en el trimestre (-0,1%) y la previsión es que crezcan en torno al 2% en el conjunto de 2026, mejor de lo esperado hasta ahora.
El resultado entre enero y septiembre recoge varios impactos extraordinarios. Por un lado, la venta de TSB ha generado unas plusvalías netas de impuestos de 322 millones de euros (340 millones brutos). De otra parte, se han registrado otros impactos, como el plan de prejubilaciones en España. El saldo total ha resultado en una aportación positiva de 201 millones de euros netos a la cuenta de resultados. Paralelamente, TSB aportó 79 millones de euros de beneficio en los cuatro meses en que formó parte del Grupo durante el presente ejercicio.
En cuanto a la calidad de los activos, la ratio de morosidad continúa mejorando y se reduce al 2,4% en el tercer trimestre de 2026, frente al 2,47% del trimestre anterior y el 2,75% de doce meses antes, con una cobertura stage 3 con el total de provisiones que se eleva al 70,1%. Esta buena evolución es producto de la aceleración en la reducción de los activos problemáticos, que han bajado en 140 millones de euros en el trimestre y 477 millones de euros en los últimos doce meses, hasta los 3.886 millones de euros. Las provisiones totales se han reducido un 13% en el trimestre, mientras que el coste del riesgo se ha mantenido en los 40 puntos básicos, la cifra prevista para el conjunto del ejercicio.
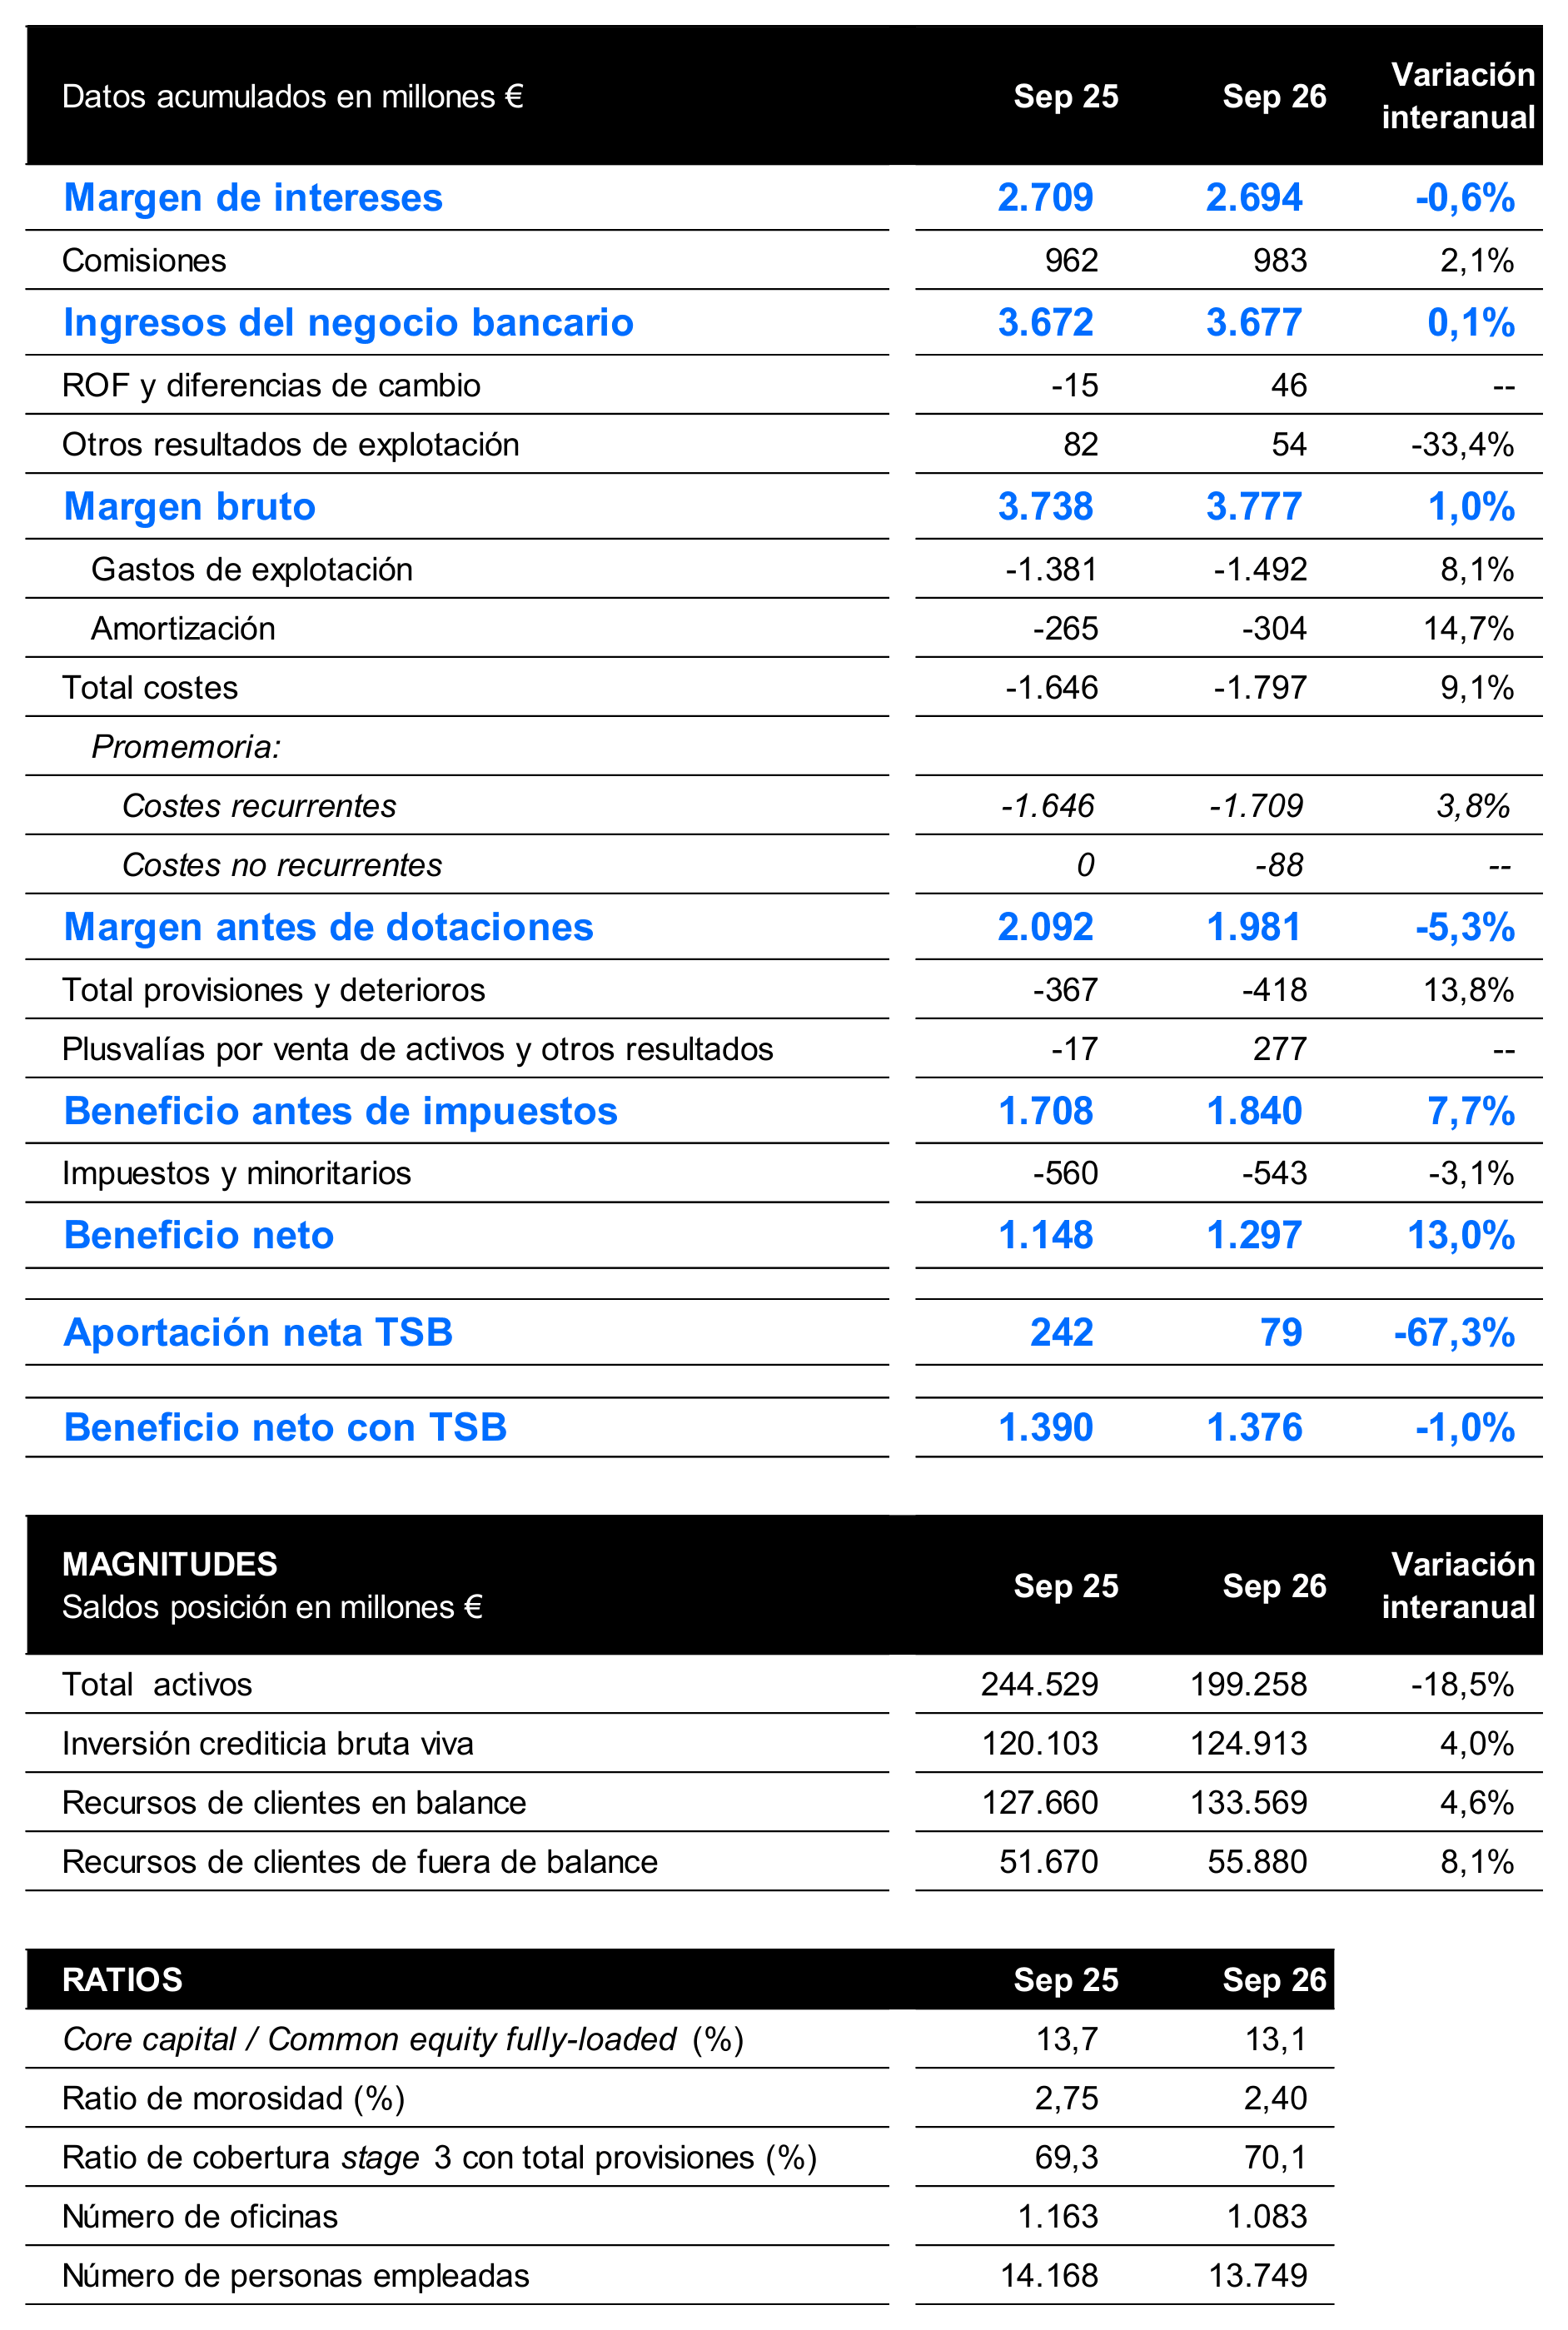
También te puede interesar




Contacto de prensa
Si quieres recibir más información sobre nuestra actualidad, no dudes en contactar con nuestros especialistas.


Banco de Sabadell, S.A., Plaça de Sant Roc, núm. 20, 08201 Sabadell, inscrito en el Registro Mercantil de Barcelona, tomo/I.R.U.S. 1000152932861, folio 873, hoja B-1561, NIF A08000143. Entidad de crédito sujeta a la supervisión del Banco de España e inscrita en el Registro administrativo especial con el número 0081. Para cualquier consulta puedes contactar con nosotros. Banco de Sabadell, S.A., 2022. Todos los derechos reservados.
-
Sala de Prensa
-
Nos entendemos
es
Español
-
Sala de Prensa
-
Nos entendemos
14.10.2026
Banco Sabadell completa su primer pago real con Agent Pay de Mastercard
- La entidad llevó a cabo esta operación permitiendo a los agentes de IA iniciar y ejecutar pagos por cuenta de los clientes dentro de límites y autorizaciones previamente definidos
- Este nuevo hito, basado en estrictos estándares de seguridad, privacidad y protección, ofrece un posicionamiento estratégico en la evolución de pagos impulsados por IA y demuestra la viabilidad de los pagos agénticos
8 d’ octubre de 2026
Banco Sabadell ha completado con éxito su primer pago agéntico real de extremo a extremo realizado por un agente de inteligencia artificial (IA) en un entorno seguro y verificable. La entidad llevó a cabo esta operación a través de Mastercard Agent Pay, permitiendo a los agentes de IA iniciar y ejecutar pagos por cuenta de los clientes dentro de límites y autorizaciones previamente definidos junto con estrictos estándares de seguridad, privacidad y protección.
Para Banco Sabadell, este nuevo hito ofrece un posicionamiento estratégico en la evolución de pagos impulsados por IA y demuestra la viabilidad de los pagos agénticos.
En este caso, se ha conseguido validar una compra real iniciada y ejecutada desde un agente de IA mediante tokenización, passkeys y autenticación biométrica demostrando capacidad para habilitar compras seguras iniciadas por agentes IA. El pago fue realizado con una tarjeta de Banco Sabadell por un agente IA dentro de la plataforma Priceless de Mastercard, mediante la orquestación extremo a extremo de la transacción por parte de PayOS.
“Los pagos agénticos suponen un nuevo salto evolutivo en la forma en que los clientes interactúan con los servicios digitales. A medida que este tipo de operaciones adquieren una mayor autonomía, resulta esencial contar con mecanismos sólidos de protección, autorización por parte del clientes y máxima transparencia”, ha señalado el director de Pagos en Operaciones y Tecnología de Banco Sabadell, Juan Manuel Tabero.
Los pagos agénticos suponen un nuevo salto evolutivo en la forma en que los clientes interactúan con los servicios digitales. A medida que este tipo de operaciones adquieren una mayor autonomía, resulta esencial contar con mecanismos sólidos de protección, autorización por parte del clientes y máxima transparencia
Director de Pagos en Operaciones y Tecnología de Banco Sabadell - Juan Manuel Tabero
Asimismo, el director general de Mastercard en España, Juan Pablo Vivas, ha señalado: “La IA tiene el potencial de simplificar la forma en que las personas gestionan las tareas cotidianas, pero la confianza y la seguridad deben ser siempre la prioridad. Agent Pay de Mastercard ha sido diseñado para garantizar que las transacciones iniciadas por IA sean transparentes, autenticadas y permanezcan en todo momento bajo el control del consumidor. Al colaborar con socios como Banco Sabadell, estamos ayudando a sentar las bases de un sistema de pagos impulsado por IA que sea seguro y de confianza”.
La operación ha contado con la participación de Sabadell Digital, la compañía tecnológica de Banco Sabadell y uno de los principales motores de innovación de la entidad. Con un equipo de más de 1.000 profesionales y la gestión de más de 1.200 proyectos al año, Sabadell Digital ha contribuido al desarrollo y ejecución de este primer pago real con Agent Pay de Mastercard, aportando su capacidad para integrar innovación, seguridad y eficiencia en soluciones que anticipan las necesidades futuras de los clientes. Su participación en este proyecto refleja la apuesta de Banco Sabadell por impulsar tecnologías de vanguardia que permitan avanzar hacia nuevos modelos de interacción financiera basados en inteligencia artificial, garantizando al mismo tiempo los más altos estándares de confianza, privacidad y protección.
-
https://comunicacion.grupbancsabadell.com/sala-de-prensa/banco-sabadell-completa-su-primer-pago-real-con-agent-pay-de-mastercard/ - Vía @BancoSabadell
También te puede interesar
Contacto de prensa
Si quieres recibir más información sobre nuestra actualidad, no dudes en contactar con nuestros especialistas.
Banco de Sabadell, S.A., Plaça de Sant Roc, núm. 20, 08201 Sabadell, inscrito en el Registro Mercantil de Barcelona, tomo/I.R.U.S. 1000152932861, folio 873, hoja B-1561, NIF A08000143. Entidad de crédito sujeta a la supervisión del Banco de España e inscrita en el Registro administrativo especial con el número 0081. Para cualquier consulta puedes contactar con nosotros. Banco de Sabadell, S.A., 2022. Todos los derechos reservados.
-
Sala de Prensa
-
Nos entendemos
es
Español
-
Sala de Prensa
-
Nos entendemos
06.10.2026
BPCE y Banco Sabadell anuncian la adquisición amistosa por BPCE de una participación en Banco Sabadell y su intención de explorar oportunidades de cooperación estratégica
6 de octubre 2026
BPCE ha adquirido una participación equivalente a aproximadamente el 7% del capital social de Banco Sabadell mediante compras en mercado e instrumentos financieros. BPCE y Banco Sabadell desean subrayar el carácter amistoso de esta inversión accionarial, siendo la intención de BPCE convertirse en un accionista estable y de largo plazo, así como estar representado en el Consejo de Administración de Banco Sabadell, el cuarto banco de España y con una posición de liderazgo en financiación a pymes. Además, ambas partes tienen la voluntad de explorar una cooperación estratégica empresarial para poner las capacidades de BPCE a disposición de los clientes de Banco Sabadell y generar valor adicional de forma conjunta.
Estamos muy satisfechos de dar la bienvenida a BPCE como accionista de nuestra entidad. Su decisión de invertir en Banco Sabadell constituye un reconocimiento a la solidez de nuestro proyecto en solitario, al trabajo realizado por nuestros profesionales y a las oportunidades de crecimiento que tenemos por delante. Su presencia refuerza la fortaleza y la estabilidad de nuestra base accionarial
Josep Oliu - Presidente Banco Sabadell
Esta operación refuerza nuestra capacidad para seguir ejecutando nuestro plan estratégico y generar valor sostenible a largo plazo. La entrada de BPCE en nuestro capital nos aporta un socio con visión de largo plazo y una amplia experiencia, que creemos que puede complementar nuestras capacidades y ayudarnos a aprovechar con éxito las oportunidades que ofrece el mercado
Marc Armengol - CEO de Banco Sabadell
La inversión de BPCE en Banco Sabadell encaja plenamente en el plan estratégico Visión 2030. Supone un paso adicional en la estrategia de crecimiento y diversificación de nuestra presencia en Europa. Refleja nuestra confianza en el equipo directivo de Sabadell, en su estrategia y en su potencial de crecimiento a largo plazo. Compartimos la firme convicción de la importancia de estar profundamente arraigados en los territorios y mercados en los que operamos, al servicio de nuestros clientes y en apoyo de la economía real. La posición de liderazgo de Sabadell en España, combinada con la experiencia y las capacidades internacionales de Grupo BPCE, generan prometedoras oportunidades de cooperación y de creación de valor tanto para nuestros clientes como para la economía española
Nicolas Namias - CEO de BPCE
Tras esta operación, BPCE se ha convertido en un accionista estratégico de Banco Sabadell. BPCE, segundo grupo bancario de Francia y cuarto de la zona euro por fondos propios, y Banco Sabadell, cuarto banco de España, son entidades de referencia en sus respectivos mercados.
BPCE respalda plenamente la estrategia y los planes de crecimiento de Banco Sabadell, así como a su equipo directivo, que ha liderado con éxito una destacada transformación de la entidad. BPCE no tiene intención de aumentar su participación en Banco Sabadell por encima del 9,9%. Con el apoyo de Banco Sabadell, BPCE iniciará los trámites y conversaciones necesarios con las autoridades supervisoras españolas y europeas para el nombramiento de un miembro en el Consejo de Administración de Banco Sabadell, sujeto a los procedimientos de gobierno corporativo aplicables y a las autorizaciones requeridas.
BPCE y Banco Sabadell tienen la intención de explorar oportunidades de negocio, en particular en banca corporativa y de inversión, leasing de bienes de equipo, crédito al consumo y negocio internacional de clientes. Estas conversaciones, cuya conclusión se prevé a comienzos de 2027, tendrán como objetivo identificar ámbitos en los que la cooperación pueda apoyar el desarrollo de Banco Sabadell en España y, al mismo tiempo, reforzar la presencia europea de BPCE. BPCE y Banco Sabadell informarán al mercado, de conformidad con la normativa aplicable, de cualquier avance relevante en estas conversaciones.
Sobre Groupe BPCE
Groupe BPCE es el segundo grupo bancario de Francia y el cuarto de la zona euro por capital. Como grupo cooperativo al servicio de la economía real, presta apoyo a 36 millones de clientes en todo el mundo, gracias al compromiso de sus 110.000 empleados.
En Francia, Groupe BPCE se apoya en sus principales redes de banca de proximidad, Banque Populaire y Caisse d’Epargne, ambas profundamente arraigadas en sus territorios, así como en Palatine. El grupo desarrolla actividades en todo el espectro de la banca y los seguros. En Europa, acompaña a sus clientes a través de novobanco, el cuarto banco de Portugal; BPCE Equipment Solutions, líder europeo en leasing de bienes de equipo; y Oney, una de las principales entidades de financiación al consumo en el comercio minorista. A nivel internacional, el Grupo pone en valor su experiencia en banca corporativa y de inversión a través de Natixis CIB y en gestión de activos mediante Natixis IM.
Groupe BPCE se apoya en la diversidad de sus líneas de negocio para ofrecer soluciones cercanas y accesibles para todos y contribuir a generar un impacto positivo y duradero. Su fortaleza financiera es reconocida por cuatro agencias de calificación crediticia: Standard & Poor’s (A+, perspectiva estable), Fitch (A+, perspectiva estable), Moody’s (A2, perspectiva estable) y R&I (A+, perspectiva estable).
Sobre Banco Sabadell
Banco Sabadell es la cuarta entidad financiera de España, con unos activos totales de 200.000 millones de euros. El banco está especializado en banca relacional y presta servicios financieros a empresas, pymes, autónomos y clientes particulares. Con más de 140 años de historia, la entidad desarrolla una estrategia centrada en el crecimiento rentable, la innovación, la transformación digital y el acompañamiento a empresas y familias para ayudarles a alcanzar sus objetivos financieros.
Banco Sabadell atiende a siete millones de clientes y cuenta con una red de 1.116 oficinas en España, respaldada por una plantilla de 13.850 empleados. Al cierre del primer semestre de 2026, el banco obtuvo un beneficio neto atribuido de 971 millones de euros, manteniendo al mismo tiempo una sólida posición de capital y ofreciendo una atractiva remuneración al accionista.
También te puede interesar

14.10.2026
Banco Sabadell completa su primer pago real con Agent Pay de Mastercard
Leer más
Contacto de prensa
Si quieres recibir más información sobre nuestra actualidad, no dudes en contactar con nuestros especialistas.
Banco de Sabadell, S.A., Plaça de Sant Roc, núm. 20, 08201 Sabadell, inscrito en el Registro Mercantil de Barcelona, tomo/I.R.U.S. 1000152932861, folio 873, hoja B-1561, NIF A08000143. Entidad de crédito sujeta a la supervisión del Banco de España e inscrita en el Registro administrativo especial con el número 0081. Para cualquier consulta puedes contactar con nosotros. Banco de Sabadell, S.A., 2022. Todos los derechos reservados.
COMISIÓN NACIONAL DEL MERCADO DE VALORES A los efectos de dar cumplimiento al artículo 226 de la Ley 6/2023, de 17 de marzo, de los Mercados de Valores y de los Servicios de Inversión, Banco de Sabadell, S.A. (Banco Sabadell), pone en conocimiento de la Comisión Nacional del Mercado de Valores la siguiente INFORMACIÓN PRIVILEGIADA Se adjunta nota de prensa conjunta emitida por BPCE y Banco Sabadell en el día de hoy. Gonzalo Barettino Coloma Secretario General Sabadell, a 6 de octubre de 2026
BPCE y Banco Sabadell anuncian la adquisición amistosa por BPCE de una participación en Banco Sabadell y su intención de explorar oportunidades de cooperación estratégica 6 de octubre 2026 BPCE ha adquirido una participación equivalente a aproximadamente el 7% del capital social de Banco Sabadell mediante compras en mercado e instrumentos financieros. BPCE y Banco Sabadell desean subrayar el carácter amistoso de esta inversión accionarial, siendo la intención de BPCE convertirse en un accionista estable y de largo plazo, así como estar representado en el Consejo de Administración de Banco Sabadell, el cuarto banco de España y con una posición de liderazgo en financiación a pymes. Además, ambas partes tienen la voluntad de explorar una cooperación estratégica empresarial para poner las capacidades de BPCE a disposición de los clientes de Banco Sabadell y generar valor adicional de forma conjunta.
“
Estamos muy satisfechos de dar la bienvenida a BPCE como accionista de nuestra entidad. Su decisión Estamos muy satisfechos de dar la bienvenida a BPCE comoaaccionista de invertir en Banco Sabadell constituye un reconocimiento la solidez de nuestra nuestro entidad. proyectoSu endecisión solitario, de invertirrealizado en Bancopor Sabadell constituye un reconocimiento a la solidez nuestro proyecto en solitario al trabajo nuestros profesionales y a las oportunidades de de crecimiento que tenemos por , al trabajoSu realizado porrefuerza nuestroslaprofesionales y a las oportunidades crecimiento que tenemos por delante. presencia fortaleza y la estabilidad de nuestrade base accionarial delante. Su presencia refuerza la fortaleza y la estabilidad de nuestra base accionarial
Josep Josep Oliu Oliu Presidente Banco Presidente Banco Sabadell Sabadell
“
Esta operación refuerza nuestra capacidad para seguir ejecutando nuestro plan estratégico y generar valor sostenible a largo plazo. La entrada de BPCE en nuestro capital nos aporta un socio con visión de largo plazo y una amplia experiencia, que creemos que puede complementar nuestras capacidades y ayudarnos a aprovechar con éxito las oportunidades que ofrece el mercado
Marc Armengol CEO de Banco Sabadell
1
“
La inversión de BPCE en Banco Sabadell encaja plenamente en el plan estratégico Visión 2030. Supone un paso adicional en la estrategia de crecimiento y diversificación de nuestra presencia en Europa. Refleja nuestra confianza en el equipo directivo de Sabadell, en su estrategia y en su potencial de crecimiento a largo plazo. Compartimos la firme convicción de la importancia de estar profundamente arraigados en los territorios y mercados en los que operamos, al servicio de nuestros clientes y en apoyo de la economía real. La posición de liderazgo de Sabadell en España, combinada con la experiencia y las capacidades internacionales de Grupo BPCE, generan prometedoras oportunidades de cooperación y de creación de valor tanto para nuestros clientes como para la economía española
Nicolas Namias CEO de BPCE
Tras esta operación, BPCE se ha convertido en un accionista estratégico de Banco Sabadell. BPCE, segundo grupo bancario de Francia y cuarto de la zona euro por fondos propios, y Banco Sabadell, cuarto banco de España, son entidades de referencia en sus respectivos mercados. BPCE respalda plenamente la estrategia y los planes de crecimiento de Banco Sabadell, así como a su equipo directivo, que ha liderado con éxito una destacada transformación de la entidad. BPCE no tiene intención de aumentar su participación en Banco Sabadell por encima del 9,9%. Con el apoyo de Banco Sabadell, BPCE iniciará los trámites y conversaciones necesarios con las autoridades supervisoras españolas y europeas para el nombramiento de un miembro en el Consejo de Administración de Banco Sabadell, sujeto a los procedimientos de gobierno corporativo aplicables y a las autorizaciones requeridas. BPCE y Banco Sabadell tienen la intención de explorar oportunidades de negocio, en particular en banca corporativa y de inversión, leasing de bienes de equipo, crédito al consumo y negocio internacional de clientes. Estas conversaciones, cuya conclusión se prevé a comienzos de 2027, tendrán como objetivo identificar ámbitos en los que la cooperación pueda apoyar el desarrollo de Banco Sabadell en España y, al mismo tiempo, reforzar la presencia europea de BPCE. BPCE y Banco Sabadell informarán al mercado, de conformidad con la normativa aplicable, de cualquier avance relevante en estas conversaciones.
Sobre Groupe BPCE
Groupe BPCE es el segundo grupo bancario de Francia y el cuarto de la zona euro por capital. Como grupo cooperativo al servicio de la economía real, presta apoyo a 36 millones de clientes en todo el mundo, gracias al compromiso de sus 110.000 empleados. En Francia, Groupe BPCE se apoya en sus principales redes de banca de proximidad, Banque Populaire y Caisse d’Epargne, ambas profundamente arraigadas en sus territorios, así como en Palatine. El grupo desarrolla actividades en todo el espectro de la banca y los seguros. En Europa, acompaña a sus clientes a través de novobanco, el cuarto banco de Portugal; BPCE Equipment Solutions, líder europeo en leasing de bienes de equipo; y Oney, una de las principales entidades de financiación al consumo en el comercio minorista. A nivel internacional, el Grupo pone en valor su experiencia en banca corporativa y de inversión a través de Natixis CIB y en gestión de activos mediante Natixis IM. Groupe BPCE se apoya en la diversidad de sus líneas de negocio para ofrecer soluciones cercanas y accesibles para todos y contribuir a generar un impacto positivo y duradero. Su fortaleza financiera es reconocida por cuatro agencias de calificación crediticia: Standard & Poor’s (A+, perspectiva estable), Fitch (A+, perspectiva estable), Moody’s (A2, perspectiva estable) y R&I (A+, perspectiva estable). 2
Sobre Banco Sabadell
Banco Sabadell es la cuarta entidad financiera de España, con unos activos totales de 200.000 millones de euros. El banco está especializado en banca relacional y presta servicios financieros a empresas, pymes, autónomos y clientes particulares. Con más de 140 años de historia, la entidad desarrolla una estrategia centrada en el crecimiento rentable, la innovación, la transformación digital y el acompañamiento a empresas y familias para ayudarles a alcanzar sus objetivos financieros. Banco Sabadell atiende a siete millones de clientes y cuenta con una red de 1.116 oficinas en España, respaldada por una plantilla de 13.850 empleados. Al cierre del primer semestre de 2026, el banco obtuvo un beneficio neto atribuido de 971 millones de euros, manteniendo al mismo tiempo una sólida posición de capital y ofreciendo una atractiva remuneración al accionista.
Contacto Prensa Grupo BPCE
Contacto Prensa Banco Sabadell
Christophe Gilbert : 33(0)1 40 39 66 00 / 33(0)6 73 Juan Valdés Castelló: +34 691 588 605 76 38 98 [email protected] [email protected] - groupebpce.com [email protected]
3
-
Sala de Prensa
-
Nos entendemos
es
Español
-
Sala de Prensa
-
Nos entendemos
29.09.2026
Banco Sabadell potencia sus centros corporativos de Sant Cugat, Madrid y Alicante y crea un Hub de Proyectos para acelerar su transformación
- La entidad reconfigura las diferentes áreas de los centros corporativos para impulsar un modelo de trabajo que acelere el desarrollo y ejecución de proyectos
- Marc Armengol:“Este proyecto nos va a permitir acelerar la transformación de Banco Sabadell”
- Reacondicionará durante dos años el edificio CBS de Sant Cugat, renovará la sede de Óscar Esplá en Alicante, y reorganizará el edificio de Las Tablas en Madrid
- También construirá un nuevo edificio, que se convertirá en el nuevo Hub de Proyectos en Sant Cugat, donde concentrará el desarrollo de los proyectos clave de la entidad, y pondrá en marcha el próximo 13 de octubre un hub provisional, que iniciará su andadura con 12 desarrollos estratégicos que el banco quiere agilizar
29 de septiembre de 2026
Banco Sabadell ha puesto en marcha un proyecto de transformación de sus principales centros corporativos para impulsar un modelo de trabajo que permita una mayor colaboración entre equipos, agilizar la toma de decisiones y acelerar la ejecución de iniciativas estratégicas. Para ello, remodelará y reconfigurará los espacios de trabajo en Sant Cugat, Madrid y Alicante, y acercará físicamente a los equipos que requieren una mayor interacción entre ellos.

El edificio CBS de Sant Cugat se reformará internamente durante dos años para adecuarlo a un modelo de trabajo más colaborativo, que ya ha sido testado con éxito en una prueba piloto en el banco.
Además, permitirá optimizar los espacios, de manera que a medio plazo pueda integrar a los profesionales que actualmente trabajan en el edificio de la plaza Catalunya de Sabadell.
En el centro corporativo de Banco Sabadell en Madrid (Las Tablas) se reordenará la disposición de los espacios y propiciarán más zonas de colaboración.
Este proyecto nos va a permitir acelerar la transformación de Banco Sabadell, ya que vamos a contar con espacios y modelos de trabajo en los que trabajaremos más conectados y de forma más colaborativa. Podremos desarrollar y poner en funcionamiento los proyectos de una forma más rápida, todo con el objetivo de ofrecer un mejor servicio a nuestros clientes, combinando una relación cercana con familias y empresas, con un potente desarrollo tecnológico
Marc Armengol, CEO
También se renovará la sede del banco en la calle Óscar Esplá en Alicante para adaptarla a formas de organización y de trabajo más ágiles y transversales. Actualmente, trabajan unos 400 profesionales del banco, a los que se sumarán unos 200 más, procedentes del edificio de Agua Amarga que alberga el Centro de Competencias Tecnológicas de Alicante (CCTA).
De esta manera, Alicante contará con un gran centro corporativo en el que prestarán servicio más de 600 personas de los ámbitos de tecnología, negocio de particulares y empresas, organización y personas, entre otros. Alicante es un territorio estratégico para Banco Sabadell, donde cuenta con una cuota de mercado en particulares del 33%, y donde siete de cada diez empresas son clientes de Banco Sabadell.
Por tanto, la entidad concentrará a medio plazo los servicios centrales en las tres grandes sedes que tiene en estas ciudades. Paralelamente, estudiará cuál es la mejor opción futura para los edificios ubicados en Agua Amarga y en la calle San Fernando, ambos en Alicante, así como el de la Plaza Catalunya de Sabadell.
Hub de proyectos
Como parte de este plan, la entidad construirá junto al centro corporativo de Sant Cugat un nuevo Hub de Proyectos destinado al desarrollo de iniciativas estratégicas en ámbitos como inteligencia artificial, banca privada o banca digital. El edificio entrará en funcionamiento en 2030 y contará con espacios flexibles adaptados a diferentes modelos de trabajo.
Mientras tanto, el banco pondrá en marcha a mediados de octubre un hub temporal con una cartera inicial de 12 proyectos, que han sido seleccionados por su relevancia estratégica y capacidad de aceleración.
La entidad está en plena transformación y quiere que los proyectos estratégicos se aborden a una velocidad muy superior a la que lo hacían hasta ahora, siempre con el objetivo de poder ofrecer soluciones a los clientes de una forma muy ágil.

También te puede interesar
Contacto de prensa
Si quieres recibir más información sobre nuestra actualidad, no dudes en contactar con nuestros especialistas.
Banco de Sabadell, S.A., Plaça de Sant Roc, núm. 20, 08201 Sabadell, inscrito en el Registro Mercantil de Barcelona, tomo/I.R.U.S. 1000152932861, folio 873, hoja B-1561, NIF A08000143. Entidad de crédito sujeta a la supervisión del Banco de España e inscrita en el Registro administrativo especial con el número 0081. Para cualquier consulta puedes contactar con nosotros. Banco de Sabadell, S.A., 2022. Todos los derechos reservados.
-
Sala de Prensa
-
Nos entendemos
es
Español
-
Sala de Prensa
-
Nos entendemos
22.09.2026
Una investigación pionera sobre cómo empresas y trabajadores responden a la incertidumbre y se adaptan al cambio, XXV Premio Fundación Banco Sabadell a la Investigación Económica
- Isaac Baley, profesor de Economía de la Universitat Pompeu Fabra, ha sido distinguido por una investigación que conecta las decisiones de empresas y trabajadores con la evolución del conjunto de la economía
- Su trabajo permite analizar cómo la incertidumbre, los costes de ajuste y otras fricciones influyen en decisiones de inversión, empleo y fijación de precios, así como anticipar los efectos de las políticas económicas
- Josep Oliu, presidente de Banco Sabadell y de su fundación, entregará el premio de esta vigesimoquinta edición el 5 de octubre en Oviedo
22 de septiembre de 2026
El economista Isaac Baley, profesor de Economía de la Universitat Pompeu Fabra (UPF), profesor afiliado de la Barcelona School of Economics (BSE), e investigador asociado del Centre de Recerca en Economia Internacional (CREI), ha sido reconocido con el XXV Premio Fundación Banco Sabadell a la Investigación Económica por una trayectoria investigadora centrada en comprender cómo las decisiones de empresas y trabajadores determinan la respuesta de la economía ante las crisis, los cambios tecnológicos y las reformas de política económica.
El jurado, presidido por Teresa García-Milà, ha destacado especialmente la contribución de Baley a la macroeconomía moderna al incorporar de forma detallada la heterogeneidad entre empresas y entre trabajadores. Una idea central de su investigación es que las empresas y los trabajadores no pueden adaptarse de manera inmediata ni sin costes cuando cambia su entorno económico: las empresas disponen de información imperfecta, de modo que ajustar precios o realizar inversiones puede ser costoso y algunas decisiones son difíciles de revertir; los trabajadores necesitan tiempo para encontrar un nuevo empleo y no siempre pueden trasladar sus habilidades de una ocupación a otra. Estas fricciones ayudan a explicar por qué algunos cambios económicos se disipan rápidamente y otros dejan efectos persistentes, y por qué una misma política puede afectar de manera distinta a empresas y trabajadores.
El jurado también ha subrayado que el uso de datos microeconómicos en la investigación de Baley “permite a economistas y a diseñadores de políticas públicas anticipar el impacto de las medidas económicas, mejorar la eficiencia en la asignación del capital y evaluar las disyuntivas que plantean las reformas impositivas.”
Los distintos ámbitos del trabajo de Baley responden a una misma pregunta: cómo las fricciones que afectan a las decisiones individuales se traducen en consecuencias para toda la economía. En el ámbito empresarial, estudia cómo la información imperfecta, los costes de ajuste y la irreversibilidad afectan a la inversión y la fijación de precios. En el mercado laboral, analiza cómo la búsqueda de empleo, la movilidad entre ocupaciones y la transferencia de habilidades condicionan las consecuencias del cambio tecnológico. Y una tercera línea, estudia los datos como recursos económicos: cómo permiten mejorar las predicciones y la productividad, pero también cómo su acumulación y control afectan a la competencia. Esta última agenda es el eje de su libro “The Data Economy: Tools and Applications”, escrito junto con Laura Veldkamp y publicado por Princeton University Press en 2025.
"Me interesa entender qué ocurre cuando la economía cambia más rápido de lo que las empresas y los trabajadores pueden adaptarse, y por qué reaccionan de manera diferente ante un mismo cambio. Estas diferencias ayudan a explicar por qué algunos shocks se absorben rápidamente mientras que otros dejan efectos persistentes, y también por qué una misma política puede afectar de forma distinta a empresas y trabajadores” ha explicado Baley, quién ha añadido que “entender estos mecanismos es fundamental para diseñar y evaluar mejor las políticas económicas.”
La entrega del premio tendrá lugar el próximo 5 de octubre en Oviedo, en un acto que reunirá a autoridades y a destacados directivos del ámbito económico y empresarial. El Premio Fundación Banco Sabadell a la Investigación Económica, creado en 2001, distingue anualmente a investigadores de hasta 42 años cuya labor científica haya contribuido de forma sobresaliente al análisis económico. Este año, el galardón alcanza su vigesimoquinta edición, consolidándose como una de las principales distinciones al talento investigador emergente en España.
Josep Oliu, presidente de Banco Sabadell y de su fundación, ha destacado que "en una edición especialmente significativa, al cumplirse veinticinco años de este galardón, reconocemos una trayectoria investigadora de excelencia con una aportación relevante al conocimiento económico y al análisis de algunos de los principales desafíos que afrontan nuestras sociedades". Oliu también ha puesto en valor la capacidad de la investigación de Baley para conectar el rigor académico con cuestiones de gran relevancia para la toma de decisiones económicas y el diseño de políticas públicas.
Una trayectoria internacional que busca anticipar el impacto de las políticas económicas
Nacido en México, Isaac Baley es doctor en Economía por la Universidad de Nueva York (NYU) y máster en Teoría Económica por el Instituto Tecnológico Autónomo de México (ITAM). Además de profesor de Economía en la Universitat Pompeu Fabra, es investigador asociado del Centre de Recerca en Economia Internacional (CREI), profesor afiliado de la Barcelona School of Economics (BSE) y miembro investigador del Centre for Economic Policy Research (CEPR).
Sus contribuciones científicas han sido publicadas en algunas de las principales revistas académicas internacionales, entre ellas Econometrica, Journal of Political Economy y The Review of Economic Studies, y han sido reconocidas con ayudas altamente competitivas como una Marie Curie Fellowship y un ERC Starting Grant.
Además de su actividad investigadora, Baley mantiene un firme compromiso con la formación de jóvenes economistas. Ha dirigido numerosas tesis doctorales y actualmente es responsable de Innovación Docente del Departamento de Economía y Empresa de la Universitat Pompeu Fabra, donde impulsa nuevas metodologías de aprendizaje y programas de mentoría entre estudiantes. Su labor ha sido reconocida con el Reconocimiento a la Excelencia del Programa de Innovación Docente de la UPF en 2026 y con el Excellence in Teaching Award de la European Economic Association en 2022.

Jurado del XXV Premio Fundación Banco Sabadell a la Investigación Económica
El jurado del Premio está presidido por la Dra. Teresa García-Milà e integrado por el Dr. Javier Andrés, el Dr. Antonio Cabrales, el Dr. Bruno Cassiman, la Dra. Natalia Fabra, la Dra. Nagore Iriberri, la Dra. Núria Mas, el Dr. Diego Puga y la Dra. Marta Reynal-Querol
Sobre Fundación Banco Sabadell
La Fundación Banco Sabadell tiene como misión promover la cultura y las artes, la investigación y la educación. Fue creada en 1994 como expresión del compromiso de Banco Sabadell con el progreso y el bienestar de las personas y con la visión de ser un referente y un actor de cambio e innovación, al servicio del interés general y la cohesión social, mediante la promoción de la excelencia, la creatividad y la innovación, con especial interés en el impulso al talento joven.
También te puede interesar
Contacto de prensa
Si quieres recibir más información sobre nuestra actualidad, no dudes en contactar con nuestros especialistas.
Banco de Sabadell, S.A., Plaça de Sant Roc, núm. 20, 08201 Sabadell, inscrito en el Registro Mercantil de Barcelona, tomo/I.R.U.S. 1000152932861, folio 873, hoja B-1561, NIF A08000143. Entidad de crédito sujeta a la supervisión del Banco de España e inscrita en el Registro administrativo especial con el número 0081. Para cualquier consulta puedes contactar con nosotros. Banco de Sabadell, S.A., 2022. Todos los derechos reservados.
-
Sala de Prensa
-
Nos entendemos
es
Español
-
Sala de Prensa
-
Nos entendemos
18.09.2026
El Fondo Sabadell Inversión Ética y Solidaria, FI destina 383.680 € a proyectos solidarios, un 12% más que en 2025
- Comercializado por Banco Sabadell e impulsado por Sabadell Asset Management – Grupo Amundi, el Fondo ha destinado ayudas a proyectos gestionados por entidades del tercer sector de España, que desarrollan tanto iniciativas en el ámbito nacional como programas de cooperación internacional en República Dominicana - Haití, Uganda, Tanzania, Brasil o India
- Las iniciativas abarcan ámbitos como la inserción laboral y social, la salud, la educación, las infraestructuras, la alimentación y personas en situación de vulnerabilidad
- Desde 2008, el Fondo Sabadell Inversión Ética y Solidaria, FI ha canalizado casi 4 millones de euros hacia 293 proyectos en 35 países
18 de septiembre de 2026
Banco Sabadell y Sabadell Asset Management – Grupo Amundi han destinado en 2026 una parte de la comisión de gestión del Fondo Sabadell Inversión Ética y Solidaria, FI, correspondiente a un importe de 383.680 euros a 21 proyectos solidarios impulsados por entidades del tercer sector de España, que desarrollan tanto iniciativas en el ámbito nacional como programas de cooperación internacional en República Dominicana-Haití, Uganda, Tanzania, Brasil o India. Esta cifra supone un incremento del 12% con respecto a la cantidad destinada en la pasada edición, en la que se concedieron 341.897 euros.
Estos proyectos, que abarcan ámbitos tan diversos como la inserción laboral y social, la salud, la educación, las infraestructuras, la alimentación y personas en situación de vulnerabilidad han sido seleccionados por el Comité Ético del Fondo tras un riguroso proceso de evaluación.
El acto de entrega de la donación, celebrado este jueves en la sede corporativa de Banco Sabadell en Madrid, ha contado con la participación e intervención inicial del director general adjunto y director Territorial Centro de Banco Sabadell, José Manuel Candela.
“Este fondo refleja de manera ejemplar nuestra visión de la inversión responsable, demostrando que es posible generar rentabilidad mientras se impulsa un impacto social positivo y tangible. Su capacidad para convertir recursos financieros en oportunidades reales para lanzar proyectos y ayudar a las personas más vulnerables pone de manifiesto cómo las finanzas pueden contribuir a transformar realidades y construir una sociedad más inclusiva”, ha señalado Candela.
Este fondo refleja de manera ejemplar nuestra visión de la inversión responsable, demostrando que es posible generar rentabilidad mientras se impulsa un impacto social positivo y tangible
Director general adjunto y director Territorial Centro de Banco Sabadell - José Manuel Candela
Asimismo, ha participado el director de Negocio Institucional de Banco Sabadell, José Luis Montesino-Espartero, quien ha indicado que el “Fondo Ético y Solidario de Banco Sabadell permite a sus partícipes ser inversores y solidarios al mismo tiempo. Es decir, participar de una buena rentabilidad ajustada al perfil de riesgo del fondo y a su vez saber que con sus aportaciones colabora en proyectos de acción social y cooperación al desarrollo que mejoran la vida de miles de personas”.
Por su parte, la vicepresidenta de la Asociación Antares, Cristina Laorden, en representación de las entidades que reciben la ayuda por sus proyectos de acción social, ha subrayado que “para quienes trabajamos en el ámbito social, recibir una ayuda económica es mucho más que contar con nuevos recursos. Es saber que hay organizaciones dispuestas a mirar de frente las necesidades de nuestra sociedad y a comprometerse con ellas”. “En Antares entendemos el ocio de las personas con discapacidad intelectual y autismo como un derecho. El ocio es amistad, autonomía, participación y bienestar, y forma parte de una vida plena y con sentido”, ha añadido.
El presidente de Arcores España, Jaazeal Estelou, ha indicado: “En nombre de Arcores, Fontilles, la Fundación Agrónomos Sin Fronteras, Manos Unidas y Rafiki Africa, agradezco a Banco Sabadell que haya reconocido nuestros proyectos de Cooperación y Desarrollo, así como su apoyo inquebrantable a la labor vital que realizan las ONGs en todo el mundo”.
El acto ha sido conducido por el director nacional del segmento de Instituciones Religiosas y Tercer Sector de Banco Sabadell, Santiago Portas. “Vivimos tiempos de grandes avances, pero también de importantes desafíos sociales. Y precisamente por eso el trabajo que desarrolláis es más necesario que nunca. Sois una pieza esencial para construir una sociedad más humana, más cohesionada y justa”, ha precisado Portas.
Iniciativas diversas
Entre las iniciativas beneficiadas destaca el proyecto de la Asociación Antares que brinda apoyo a familias de personas con discapacidad intelectual y graves alteraciones de conducta ofreciendo actividades de ocio, respiro familiar y acompañamiento para mejorar la calidad de vida, fomentar la inclusión y proporcionar un espacio de apoyo y mejora de vida.
Asimismo, de Arcores España cabe señalar su programa para garantizar la continuidad del Lar Santa Mónica, único centro en Fortaleza (Brasil) que acoge a niñas de 7 a 18 años víctimas de violencia sexual, brindándoles protección, educación, atención jurídica, sanitaria y apoyo en un entorno familiar.
También han sido seleccionados los Proyectos de Manos Unidas –República Dominicana - Haití, Cáritas Diocesana de Santiago de Compostela, Asociación Lleidatana para el síndrome de Down, Fundación Balia por la Infancia, Asociación de Familiares de Enfermos de Alzheimer de Astorga y Comarca, Asociación de Daño Cerebral de Navarra – ADACEN, , ASPAYM Madrid (Asociación de Personas con Lesión Medular y otras discapacidades físicas), AFAGA - Asociación de Familiares de enfermos de Alzheimer u otras demencias de Galicia, Hospital San Juan de Dios Pamplona -Tudela, CESAL, Asociación el Arca de Valencia, Fundació Portolà, Fundación Sobre Ruedas de ayuda a las personas con parálisis cerebral, Fundación Agrónomos Sin Fronteras - ASF, RAFIKI África, Fundación Privada Proyecto Aura, Fontilles Fundació de la Comunitat Valenciana, Fundación Raíces y Fundación Grandes Amigos en Acción.

Impulso positivo año tras año
Desde 2006, Banco Sabadell impulsa una iniciativa ética y solidaria que se consolidó en 2008 con la creación del Fondo Sabadell Inversión Ética y Solidaria, FI. Desde entonces, el Fondo ha canalizado cerca de 4 millones de euros a 293 proyectos en más de una treintena de países, con un impacto positivo en la vida de más de 234.000 personas pertenecientes a colectivos especialmente vulnerables: infancia, mujeres, personas en riesgo de exclusión social, mayores y personas afectadas por enfermedades o por desastres naturales.
Este Fondo pionero, creado y comercializado por Banco Sabadell y gestionado por Sabadell Asset Management – Grupo Amundi, se caracteriza por integrar criterios financieros, éticos y medioambientales en sus decisiones de inversión. Una parte de las comisiones de gestión se dona directamente a proyectos solidarios, lo que lo convierte en una fórmula única para canalizar inversión privada hacia causas de alto impacto social.
Gracias a esta filosofía, contribuye de forma directa a la consecución de 10 Objetivos de Desarrollo Sostenible de la ONU: fin de la pobreza (ODS 1), hambre cero (ODS 2), salud y bienestar (ODS 3), educación de calidad (ODS 4), igualdad de género (ODS 5), agua limpia y saneamiento (ODS 6), trabajo decente y crecimiento económico (ODS 8), reducción de las desigualdades (ODS 10), ciudades y comunidades sostenibles (ODS 11) y paz, justicia e instituciones sólidas (ODS 16).
-
https://comunicacion.grupbancsabadell.com/sala-de-prensa/el-fondo-sabadell-inversion-etica-y-solidaria-fi-destina-383-680-e-a-proyectos-solidarios-un-12-mas-que-en-2025/ - Vía @BancoSabadell
También te puede interesar
14.10.2026
Banco Sabadell completa su primer pago real con Agent Pay de Mastercard
Leer más
Contacto de prensa
Si quieres recibir más información sobre nuestra actualidad, no dudes en contactar con nuestros especialistas.
Banco de Sabadell, S.A., Plaça de Sant Roc, núm. 20, 08201 Sabadell, inscrito en el Registro Mercantil de Barcelona, tomo/I.R.U.S. 1000152932861, folio 873, hoja B-1561, NIF A08000143. Entidad de crédito sujeta a la supervisión del Banco de España e inscrita en el Registro administrativo especial con el número 0081. Para cualquier consulta puedes contactar con nosotros. Banco de Sabadell, S.A., 2022. Todos los derechos reservados.
-
Sala de Prensa
-
Nos entendemos
es
Español
-
Sala de Prensa
-
Nos entendemos
11.08.2026
Banco Sabadell y Amundi amplían su acuerdo en gestión de activos hasta 2035
- Los clientes de Banco Sabadell tienen acceso a una amplia gama de soluciones de ahorro e inversión, respaldadas por la experiencia y las capacidades de Amundi en gestión activa, pasiva y mercados privados
- La combinación del conocimiento de Banco Sabadell sobre las necesidades de sus clientes y la experiencia global de Amundi en gestión de activos ha contribuido al crecimiento del negocio
- Más de 200.000 clientes mantienen productos de inversión gestionados a través de la plataforma de Sabadell Asset Management y Amundi
Banco Sabadell, el cuarto grupo bancario más grande de España, que presta servicio a aproximadamente 7 millones de clientes a través de canales digitales y más de 1.000 oficinas, y Amundi, líder europeo en gestión de activos, anuncian hoy la ampliación de su acuerdo para la distribución de las soluciones de inversión de Amundi a través de las redes de Banco Sabadell en España.
El acuerdo, que comenzó en 2020 y cuya vigencia inicial se extendía hasta 2030, se ha ampliado ahora por un periodo adicional de cinco años, hasta 2035.
Desde su creación, esta alianza ha impulsado el desarrollo del negocio de fondos de Banco Sabadell y ha reforzado la posición de Amundi en España, uno de los principales mercados de ahorro de Europa.
La colaboración ha generado beneficios tangibles para ambas partes. Los clientes de Banco Sabadell tienen acceso a una amplia gama de soluciones de ahorro e inversión, respaldadas por la experiencia y las capacidades de Amundi en gestión activa, pasiva y mercados privados, como principal gestor de activos de Europa. Al mismo tiempo, Amundi ha reforzado aún más su presencia en España y ha incrementado su volumen de activos gestionados, pasando de 20.000 millones de euros en 2020 a cerca de 30.000 millones de euros en activos correspondientes a clientes de las redes de Banco Sabadell al cierre de 2025. Actualmente, más de 200.000 clientes mantienen productos de inversión gestionados a través de la plataforma de Sabadell Asset Management y Amundi.
Combinación de conocimiento y experiencia global
Durante estos años, la combinación del conocimiento de Banco Sabadell sobre las necesidades de sus clientes y la experiencia global de Amundi en gestión de activos ha contribuido al crecimiento del negocio y a la mejora continua de la oferta de soluciones de inversión.
Esta renovación también pone de manifiesto la convicción compartida de que esta alianza les permitirá seguir aprovechando el importante potencial de crecimiento del mercado español de ahorro e inversión. Ambas compañías reafirman su compromiso de seguir trabajando conjuntamente para crear valor a largo plazo para clientes, accionistas y empleados, manteniendo al mismo tiempo un firme enfoque en la calidad del servicio, la innovación y el asesoramiento financiero.
-
https://comunicacion.grupbancsabadell.com/sala-de-prensa/banco-sabadell-y-amundi-amplian-su-acuerdo-en-gestion-de-activos-hasta-2035/ - Vía @BancoSabadell
También te puede interesar
14.10.2026
Banco Sabadell completa su primer pago real con Agent Pay de Mastercard
Leer más
Contacto de prensa
Si quieres recibir más información sobre nuestra actualidad, no dudes en contactar con nuestros especialistas.
Banco de Sabadell, S.A., Plaça de Sant Roc, núm. 20, 08201 Sabadell, inscrito en el Registro Mercantil de Barcelona, tomo/I.R.U.S. 1000152932861, folio 873, hoja B-1561, NIF A08000143. Entidad de crédito sujeta a la supervisión del Banco de España e inscrita en el Registro administrativo especial con el número 0081. Para cualquier consulta puedes contactar con nosotros. Banco de Sabadell, S.A., 2022. Todos los derechos reservados.
COMISIÓN NACIONAL DEL MERCADO DE VALORES A los efectos de dar cumplimiento al artículo 227 de la Ley 6/2023, de 17 de marzo, de los Mercados de Valores y de los Servicios de Inversión, Banco de Sabadell, S.A. (Banco Sabadell), pone en conocimiento de la Comisión Nacional del Mercado de Valores (CNMV) la siguiente OTRA INFORMACIÓN RELEVANTE Como continuación de la comunicación de Información Privilegiada de 27 de julio de 2026 (número de registro oficial 3305), relativa a los términos y el inicio de un programa de recompra de acciones propias aprobado por el Consejo de Administración de Banco Sabadell (el “Programa de Recompra”), de conformidad con lo previsto en el artículo 5 del Reglamento (UE) nº 596/2014 del Parlamento Europeo y del Consejo de 16 de abril de 2014 sobre el abuso de mercado (MAR), y en los artículos 2.2 y 2.3 del Reglamento Delegado (UE) nº 2016/1052 de la Comisión de 8 de marzo de 2016, Banco Sabadell informa de que ha realizado las siguientes operaciones sobre acciones propias entre los días 27 de julio y 31 de julio de 2026 (ambos incluidos): Fecha 27/07/2026 27/07/2026 28/07/2026 28/07/2026 29/07/2026 29/07/2026 30/07/2026 30/07/2026 31/07/2026 31/07/2026
Instrumento Financ. SAB SAB SAB SAB SAB SAB SAB SAB SAB SAB
Operación COMPRA COMPRA COMPRA COMPRA COMPRA COMPRA COMPRA COMPRA COMPRA COMPRA
Centro Negociación XMAD CEUX XMAD CEUX XMAD CEUX XMAD CEUX XMAD CEUX Total…
Nº Títulos 755.000 255.000 1.523.792 520.000 1.650.000 550.000 870.000 280.000 845.000 280.000
Precio € 3,4072 3,4048 3,3569 3,3639 3,2471 3,2483 3,2993 3,2926 3,3406 3,3420
7.528.792
El importe satisfecho por las acciones compradas hasta el día 31 de julio de 2026 bajo el Programa de Recompra asciende a 25.000.405,80 euros, lo que representa aproximadamente, el 7,55% del importe monetario máximo del Programa de Recompra, quedando por tanto pendiente de ejecución aproximadamente el 92,45% del citado importe.
El número total de acciones compradas bajo el actual Programa de Recompras asciende a 7.528.792 acciones (que representan el 0,16% del capital social actual). Con estas compras, Banco Sabadell ha recomprado en 2026 aproximadamente el 5,23% de su capital social al inicio del presente ejercicio. Nombre del emisor: Banco de Sabadell S.A. LEI SI5RG2M0WQQLZCXKRM20 Referencia del instrumento financiero: Código ISIN: ES0113860A34 Se acompaña como Anexo I información detallada sobre cada una de las operaciones realizadas durante el periodo indicado.
Gonzalo Barettino Coloma Secretario General Sabadell, a 3 de agosto de 2026
ANEXO I / ANNEX I Información detallada sobre cada una de las operaciones realizadas dentro del Programa de Recompra durante el periodo transcurrido entre las siguientes fechas (ambas inclusive): Detailed information on each of the transactions carried out under the Buyback Programme between the following dates (both included): Fecha inicio / Start date: Fecha final / End date:
27/07/2026 31/07/2026
RESUMEN SEMANAL / WEEKLY RECAP
Fecha / Date 27/07/2026 27/07/2026 28/07/2026 28/07/2026 29/07/2026 29/07/2026 30/07/2026 30/07/2026 31/07/2026 31/07/2026
Instrumento Financ./Security SAB SAB SAB SAB SAB SAB SAB SAB SAB SAB
Operación / Transaction COMPRA / BUY COMPRA / BUY COMPRA / BUY COMPRA / BUY COMPRA / BUY COMPRA / BUY COMPRA / BUY COMPRA / BUY COMPRA / BUY COMPRA / BUY
Centro Negociación / Nº Títulos / Nr. of Trading Venue shares XMAD 755.000 CEUX 255.000 XMAD 1.523.792 CEUX 520.000 XMAD 1.650.000 CEUX 550.000 XMAD 870.000 CEUX 280.000 XMAD 845.000 CEUX 280.000 Total…
Precio € / Price € 3,4072 3,4048 3,3569 3,3639 3,2471 3,2483 3,2993 3,2926 3,3406 3,3420
7.528.792
PROGRAMA DE RECOMPRA / BUYBACK PROGRAMME Importe satisfecho hasta /Consideration paid up to 31/07/2026: € 25.000.405,80 Porcentaje sobre el importe monetario máximo / Percentage of the maximum pecuniary amount: 7,55% Porcentaje pendiente de ejecución /Percentage pending execution: 92,45%
DETALLE DE OPERACIONES / INDIVIDUAL TRANSACTIONS
Fecha / Date
Hora / Trade Time
27/07/2026 27/07/2026 27/07/2026
09:07:14 09:07:14 09:07:14
Instrumento Financ./Security
Operación / Transaction
SAB SAB SAB
COMPRA / BUY COMPRA / BUY COMPRA / BUY
Pag. 1
Centro Negociación / Trading Venue XMAD XMAD XMAD
Nº Títulos / Nr. of Precio € / Price shares € 2.219 2.219 812
3,3850 3,3850 3,3850
Hora / Trade Fecha / Date Time 27/07/2026 27/07/2026 27/07/2026 27/07/2026 27/07/2026 27/07/2026 27/07/2026 27/07/2026 27/07/2026 27/07/2026 27/07/2026 27/07/2026 27/07/2026 27/07/2026 27/07/2026 27/07/2026 27/07/2026 27/07/2026 27/07/2026 27/07/2026 27/07/2026 27/07/2026 27/07/2026 27/07/2026 27/07/2026 27/07/2026 27/07/2026 27/07/2026 27/07/2026 27/07/2026 27/07/2026 27/07/2026 27/07/2026 27/07/2026 27/07/2026 27/07/2026 27/07/2026 27/07/2026 27/07/2026 27/07/2026 27/07/2026 27/07/2026 27/07/2026 27/07/2026 27/07/2026 27/07/2026 27/07/2026 27/07/2026 27/07/2026 27/07/2026 27/07/2026
09:07:14 09:07:14 09:07:14 09:07:16 09:07:16 09:07:16 09:07:16 09:07:16 09:07:16 09:07:35 09:07:35 09:10:20 09:10:20 09:10:20 09:10:20 09:10:20 09:10:20 09:10:20 09:10:20 09:10:20 09:10:20 09:10:20 09:10:20 09:10:20 09:10:20 09:10:20 09:10:20 09:10:20 09:10:20 09:10:20 09:10:20 09:42:49 09:42:49 09:42:49 09:42:49 09:56:25 09:56:25 09:58:00 09:58:00 09:58:39 09:58:39 09:58:39 09:58:39 09:58:39 09:58:39 09:58:39 09:58:39 09:58:40 09:58:40 09:58:40 09:58:40
Instrumento Financ./Security
Operación / Transaction
SAB SAB SAB SAB SAB SAB SAB SAB SAB SAB SAB SAB SAB SAB SAB SAB SAB SAB SAB SAB SAB SAB SAB SAB SAB SAB SAB SAB SAB SAB SAB SAB SAB SAB SAB SAB SAB SAB SAB SAB SAB SAB SAB SAB SAB SAB SAB SAB SAB SAB SAB
COMPRA / BUY COMPRA / BUY COMPRA / BUY COMPRA / BUY COMPRA / BUY COMPRA / BUY COMPRA / BUY COMPRA / BUY COMPRA / BUY COMPRA / BUY COMPRA / BUY COMPRA / BUY COMPRA / BUY COMPRA / BUY COMPRA / BUY COMPRA / BUY COMPRA / BUY COMPRA / BUY COMPRA / BUY COMPRA / BUY COMPRA / BUY COMPRA / BUY COMPRA / BUY COMPRA / BUY COMPRA / BUY COMPRA / BUY COMPRA / BUY COMPRA / BUY COMPRA / BUY COMPRA / BUY COMPRA / BUY COMPRA / BUY COMPRA / BUY COMPRA / BUY COMPRA / BUY COMPRA / BUY COMPRA / BUY COMPRA / BUY COMPRA / BUY COMPRA / BUY COMPRA / BUY COMPRA / BUY COMPRA / BUY COMPRA / BUY COMPRA / BUY COMPRA / BUY COMPRA / BUY COMPRA / BUY COMPRA / BUY COMPRA / BUY COMPRA / BUY
Pag. 2
Centro Negociación / Trading Venue XMAD XMAD XMAD XMAD XMAD XMAD XMAD XMAD XMAD XMAD XMAD CEUX CEUX CEUX CEUX CEUX CEUX CEUX CEUX CEUX CEUX CEUX CEUX CEUX CEUX CEUX CEUX CEUX CEUX CEUX CEUX XMAD XMAD XMAD XMAD XMAD XMAD XMAD XMAD CEUX CEUX CEUX CEUX CEUX CEUX CEUX CEUX CEUX CEUX CEUX CEUX
Nº Títulos / Nr. of Precio € / Price shares € 812 2.219 1.407 1.407 2.219 2.219 2.219 2.219 29 2.500 2.321 1.432 1.432 1.432 1.432 1.432 547 600 285 1.070 285 885 262 23 1.355 77 549 258 813 361 470 2.142 6.817 2.321 3.899 5.810 11.095 896 2.199 1.765 1.765 1.765 1.765 93 761 700 304 1.765 1.765 1.765 787
3,3850 3,3850 3,3850 3,3850 3,3850 3,3850 3,3850 3,3850 3,3850 3,3800 3,3800 3,3830 3,3830 3,3830 3,3830 3,3830 3,3830 3,3830 3,3830 3,3830 3,3830 3,3830 3,3830 3,3830 3,3830 3,3830 3,3830 3,3830 3,3830 3,3830 3,3830 3,3850 3,3850 3,3850 3,3850 3,4050 3,4050 3,4050 3,4050 3,4030 3,4030 3,4030 3,4030 3,4030 3,4030 3,4030 3,4030 3,4030 3,4030 3,4030 3,4030
Hora / Trade Fecha / Date Time 27/07/2026 27/07/2026 27/07/2026 27/07/2026 27/07/2026 27/07/2026 27/07/2026 27/07/2026 27/07/2026 27/07/2026 27/07/2026 27/07/2026 27/07/2026 27/07/2026 27/07/2026 27/07/2026 27/07/2026 27/07/2026 27/07/2026 27/07/2026 27/07/2026 27/07/2026 27/07/2026 27/07/2026 27/07/2026 27/07/2026 27/07/2026 27/07/2026 27/07/2026 27/07/2026 27/07/2026 27/07/2026 27/07/2026 27/07/2026 27/07/2026 27/07/2026 27/07/2026 27/07/2026 27/07/2026 27/07/2026 27/07/2026 27/07/2026 27/07/2026 27/07/2026 27/07/2026 27/07/2026 27/07/2026 27/07/2026 27/07/2026 27/07/2026 27/07/2026
09:58:45 09:58:45 09:58:45 09:58:45 09:59:55 09:59:55 09:59:55 09:59:55 09:59:56 09:59:56 09:59:56 09:59:56 09:59:56 10:00:23 10:00:23 10:00:23 10:00:23 10:00:23 10:00:23 10:00:23 10:00:23 10:00:23 10:01:22 10:01:22 10:01:53 10:01:53 10:01:54 10:01:54 10:01:54 10:01:54 10:01:54 10:01:54 10:01:54 10:01:54 10:01:54 10:01:54 10:01:54 10:02:42 10:02:42 10:02:42 10:04:21 10:04:21 10:04:21 10:04:40 10:05:03 10:05:08 10:05:09 10:05:10 10:05:10 10:05:10 10:05:10
Instrumento Financ./Security
Operación / Transaction
SAB SAB SAB SAB SAB SAB SAB SAB SAB SAB SAB SAB SAB SAB SAB SAB SAB SAB SAB SAB SAB SAB SAB SAB SAB SAB SAB SAB SAB SAB SAB SAB SAB SAB SAB SAB SAB SAB SAB SAB SAB SAB SAB SAB SAB SAB SAB SAB SAB SAB SAB
COMPRA / BUY COMPRA / BUY COMPRA / BUY COMPRA / BUY COMPRA / BUY COMPRA / BUY COMPRA / BUY COMPRA / BUY COMPRA / BUY COMPRA / BUY COMPRA / BUY COMPRA / BUY COMPRA / BUY COMPRA / BUY COMPRA / BUY COMPRA / BUY COMPRA / BUY COMPRA / BUY COMPRA / BUY COMPRA / BUY COMPRA / BUY COMPRA / BUY COMPRA / BUY COMPRA / BUY COMPRA / BUY COMPRA / BUY COMPRA / BUY COMPRA / BUY COMPRA / BUY COMPRA / BUY COMPRA / BUY COMPRA / BUY COMPRA / BUY COMPRA / BUY COMPRA / BUY COMPRA / BUY COMPRA / BUY COMPRA / BUY COMPRA / BUY COMPRA / BUY COMPRA / BUY COMPRA / BUY COMPRA / BUY COMPRA / BUY COMPRA / BUY COMPRA / BUY COMPRA / BUY COMPRA / BUY COMPRA / BUY COMPRA / BUY COMPRA / BUY
Pag. 3
Centro Negociación / Trading Venue XMAD XMAD XMAD XMAD CEUX CEUX CEUX CEUX CEUX CEUX CEUX CEUX CEUX CEUX CEUX CEUX CEUX XMAD XMAD XMAD XMAD XMAD XMAD XMAD CEUX CEUX CEUX CEUX CEUX CEUX CEUX CEUX CEUX CEUX CEUX CEUX CEUX XMAD XMAD XMAD CEUX CEUX CEUX CEUX CEUX CEUX CEUX CEUX CEUX CEUX CEUX
Nº Títulos / Nr. of Precio € / Price shares € 2.432 2.432 2.432 12.704 1.654 357 1.297 231 1.423 661 993 513 1.654 1.654 1.654 1.654 1.255 511 890 4.400 890 7.119 1.576 4.614 1.219 1.219 1.219 1.219 1.219 1.219 1.219 1.219 1.219 1.219 1.219 1.219 372 1.624 574 17.802 1.198 1.198 688 12 149 15 27 191 804 1.198 1.198
3,4000 3,4000 3,4000 3,4000 3,3970 3,3970 3,3970 3,3970 3,3970 3,3970 3,3970 3,3970 3,3970 3,3970 3,3970 3,3970 3,3970 3,3950 3,3950 3,3950 3,3950 3,3950 3,3950 3,3950 3,3930 3,3930 3,3930 3,3930 3,3930 3,3930 3,3930 3,3930 3,3930 3,3930 3,3930 3,3930 3,3930 3,3900 3,3900 3,3900 3,3870 3,3870 3,3870 3,3870 3,3870 3,3870 3,3870 3,3870 3,3870 3,3870 3,3870
Hora / Trade Fecha / Date Time 27/07/2026 27/07/2026 27/07/2026 27/07/2026 27/07/2026 27/07/2026 27/07/2026 27/07/2026 27/07/2026 27/07/2026 27/07/2026 27/07/2026 27/07/2026 27/07/2026 27/07/2026 27/07/2026 27/07/2026 27/07/2026 27/07/2026 27/07/2026 27/07/2026 27/07/2026 27/07/2026 27/07/2026 27/07/2026 27/07/2026 27/07/2026 27/07/2026 27/07/2026 27/07/2026 27/07/2026 27/07/2026 27/07/2026 27/07/2026 27/07/2026 27/07/2026 27/07/2026 27/07/2026 27/07/2026 27/07/2026 27/07/2026 27/07/2026 27/07/2026 27/07/2026 27/07/2026 27/07/2026 27/07/2026 27/07/2026 27/07/2026 27/07/2026 27/07/2026
10:05:10 10:05:10 10:05:10 10:05:10 10:05:10 10:05:10 10:05:10 10:05:10 10:06:36 10:06:36 10:06:36 10:06:36 10:06:36 10:06:36 10:06:36 10:06:36 10:06:36 10:40:39 10:40:39 10:40:51 10:40:51 10:40:51 10:40:51 10:40:51 10:40:51 10:40:51 10:40:51 10:41:03 10:41:03 10:41:03 10:41:11 10:45:41 10:45:43 10:45:43 10:45:43 10:45:43 10:45:59 10:46:00 10:46:24 10:47:45 10:47:45 10:47:45 10:47:45 10:47:45 10:47:45 11:00:31 11:00:31 11:00:31 11:00:31 11:00:31 11:00:31
Instrumento Financ./Security
Operación / Transaction
SAB SAB SAB SAB SAB SAB SAB SAB SAB SAB SAB SAB SAB SAB SAB SAB SAB SAB SAB SAB SAB SAB SAB SAB SAB SAB SAB SAB SAB SAB SAB SAB SAB SAB SAB SAB SAB SAB SAB SAB SAB SAB SAB SAB SAB SAB SAB SAB SAB SAB SAB
COMPRA / BUY COMPRA / BUY COMPRA / BUY COMPRA / BUY COMPRA / BUY COMPRA / BUY COMPRA / BUY COMPRA / BUY COMPRA / BUY COMPRA / BUY COMPRA / BUY COMPRA / BUY COMPRA / BUY COMPRA / BUY COMPRA / BUY COMPRA / BUY COMPRA / BUY COMPRA / BUY COMPRA / BUY COMPRA / BUY COMPRA / BUY COMPRA / BUY COMPRA / BUY COMPRA / BUY COMPRA / BUY COMPRA / BUY COMPRA / BUY COMPRA / BUY COMPRA / BUY COMPRA / BUY COMPRA / BUY COMPRA / BUY COMPRA / BUY COMPRA / BUY COMPRA / BUY COMPRA / BUY COMPRA / BUY COMPRA / BUY COMPRA / BUY COMPRA / BUY COMPRA / BUY COMPRA / BUY COMPRA / BUY COMPRA / BUY COMPRA / BUY COMPRA / BUY COMPRA / BUY COMPRA / BUY COMPRA / BUY COMPRA / BUY COMPRA / BUY
Pag. 4
Centro Negociación / Trading Venue CEUX CEUX CEUX CEUX CEUX CEUX CEUX CEUX XMAD XMAD XMAD XMAD XMAD XMAD XMAD XMAD XMAD XMAD XMAD XMAD XMAD XMAD XMAD XMAD XMAD XMAD XMAD CEUX CEUX CEUX CEUX CEUX CEUX CEUX CEUX CEUX CEUX CEUX CEUX CEUX CEUX CEUX CEUX CEUX CEUX XMAD XMAD XMAD XMAD XMAD XMAD
Nº Títulos / Nr. of Precio € / Price shares € 877 1.198 1.198 1.198 1.198 1.198 1.198 257 2.432 24 3.100 2.875 2.432 2.432 3.917 1.624 1.164 5.294 1.624 2.002 808 808 2.289 1.767 2.432 2.432 544 1.321 1.321 1.321 1.321 164 1.157 1.321 1.321 219 502 109 491 1.321 20 1.301 271 1.321 198 2.198 812 4.872 3.636 3.683 812
3,3870 3,3870 3,3870 3,3870 3,3870 3,3870 3,3870 3,3870 3,3850 3,3850 3,3850 3,3850 3,3850 3,3850 3,3850 3,3850 3,3850 3,3850 3,3850 3,3850 3,3850 3,3850 3,3850 3,3850 3,3850 3,3850 3,3850 3,3830 3,3830 3,3830 3,3830 3,3870 3,3870 3,3870 3,3870 3,3870 3,3870 3,3870 3,3870 3,3870 3,3870 3,3870 3,3870 3,3870 3,3870 3,3950 3,3950 3,3950 3,3950 3,3950 3,3950
Hora / Trade Fecha / Date Time 27/07/2026 27/07/2026 27/07/2026 27/07/2026 27/07/2026 27/07/2026 27/07/2026 27/07/2026 27/07/2026 27/07/2026 27/07/2026 27/07/2026 27/07/2026 27/07/2026 27/07/2026 27/07/2026 27/07/2026 27/07/2026 27/07/2026 27/07/2026 27/07/2026 27/07/2026 27/07/2026 27/07/2026 27/07/2026 27/07/2026 27/07/2026 27/07/2026 27/07/2026 27/07/2026 27/07/2026 27/07/2026 27/07/2026 27/07/2026 27/07/2026 27/07/2026 27/07/2026 27/07/2026 27/07/2026 27/07/2026 27/07/2026 27/07/2026 27/07/2026 27/07/2026 27/07/2026 27/07/2026 27/07/2026 27/07/2026 27/07/2026 27/07/2026 27/07/2026
11:00:31 11:00:31 11:11:29 11:34:17 11:34:17 11:34:17 11:34:17 11:34:17 11:34:17 11:34:17 11:34:17 11:34:17 11:42:28 11:46:23 11:46:23 11:46:23 11:46:29 11:46:50 11:48:32 11:48:32 11:48:32 11:48:32 11:48:32 11:48:32 11:48:32 11:48:32 11:58:44 11:59:39 11:59:39 11:59:39 11:59:39 11:59:39 11:59:39 11:59:39 11:59:40 11:59:40 12:02:19 12:02:21 12:03:13 12:03:13 12:03:13 12:03:13 12:03:13 12:03:13 12:03:13 12:07:55 12:07:55 12:08:52 12:08:52 12:08:52 12:08:52
Instrumento Financ./Security
Operación / Transaction
SAB SAB SAB SAB SAB SAB SAB SAB SAB SAB SAB SAB SAB SAB SAB SAB SAB SAB SAB SAB SAB SAB SAB SAB SAB SAB SAB SAB SAB SAB SAB SAB SAB SAB SAB SAB SAB SAB SAB SAB SAB SAB SAB SAB SAB SAB SAB SAB SAB SAB SAB
COMPRA / BUY COMPRA / BUY COMPRA / BUY COMPRA / BUY COMPRA / BUY COMPRA / BUY COMPRA / BUY COMPRA / BUY COMPRA / BUY COMPRA / BUY COMPRA / BUY COMPRA / BUY COMPRA / BUY COMPRA / BUY COMPRA / BUY COMPRA / BUY COMPRA / BUY COMPRA / BUY COMPRA / BUY COMPRA / BUY COMPRA / BUY COMPRA / BUY COMPRA / BUY COMPRA / BUY COMPRA / BUY COMPRA / BUY COMPRA / BUY COMPRA / BUY COMPRA / BUY COMPRA / BUY COMPRA / BUY COMPRA / BUY COMPRA / BUY COMPRA / BUY COMPRA / BUY COMPRA / BUY COMPRA / BUY COMPRA / BUY COMPRA / BUY COMPRA / BUY COMPRA / BUY COMPRA / BUY COMPRA / BUY COMPRA / BUY COMPRA / BUY COMPRA / BUY COMPRA / BUY COMPRA / BUY COMPRA / BUY COMPRA / BUY COMPRA / BUY
Pag. 5
Centro Negociación / Trading Venue XMAD XMAD XMAD XMAD XMAD XMAD XMAD XMAD XMAD XMAD XMAD XMAD XMAD CEUX CEUX CEUX CEUX CEUX CEUX CEUX CEUX CEUX CEUX CEUX XMAD XMAD XMAD XMAD XMAD XMAD XMAD XMAD XMAD XMAD XMAD XMAD XMAD XMAD XMAD XMAD XMAD XMAD XMAD XMAD XMAD CEUX CEUX CEUX CEUX CEUX CEUX
Nº Títulos / Nr. of Precio € / Price shares € 1.979 2.008 16.118 2.543 4.705 381 3.329 1.757 3.242 611 1.844 1.588 3.882 1.765 1.765 478 1.762 3 1.765 1.765 1.765 1.765 1.765 402 2.543 17.457 900 1.532 2.400 3.528 3.917 2.432 2.432 1 2.314 544 8.087 593 112 3.528 812 3.214 2.068 1.368 218 1.765 1.765 1.765 1.014 751 1.014
3,3950 3,3950 3,3950 3,4040 3,4040 3,4040 3,4040 3,4040 3,4040 3,4040 3,4040 3,4040 3,4050 3,4030 3,4030 3,4030 3,4030 3,4030 3,4030 3,4030 3,4030 3,4030 3,4030 3,4030 3,4000 3,4000 3,4020 3,4020 3,4020 3,4020 3,4020 3,4020 3,4020 3,4020 3,4020 3,4020 3,4050 3,4050 3,4050 3,4050 3,4050 3,4050 3,4050 3,4050 3,4050 3,4030 3,4030 3,4030 3,4030 3,4030 3,4030
Hora / Trade Fecha / Date Time 27/07/2026 27/07/2026 27/07/2026 27/07/2026 27/07/2026 27/07/2026 27/07/2026 27/07/2026 27/07/2026 27/07/2026 27/07/2026 27/07/2026 27/07/2026 27/07/2026 27/07/2026 27/07/2026 27/07/2026 27/07/2026 27/07/2026 27/07/2026 27/07/2026 27/07/2026 27/07/2026 27/07/2026 27/07/2026 27/07/2026 27/07/2026 27/07/2026 27/07/2026 27/07/2026 27/07/2026 27/07/2026 27/07/2026 27/07/2026 27/07/2026 27/07/2026 27/07/2026 27/07/2026 27/07/2026 27/07/2026 27/07/2026 27/07/2026 27/07/2026 27/07/2026 27/07/2026 27/07/2026 27/07/2026 27/07/2026 27/07/2026 27/07/2026 27/07/2026
12:08:52 12:09:04 12:09:46 12:09:46 12:09:46 12:10:10 12:30:03 12:32:23 12:32:23 12:32:23 12:32:23 12:32:23 12:32:23 12:32:23 12:32:23 12:40:58 12:44:09 12:44:09 12:55:47 12:55:47 12:55:47 12:55:47 12:55:47 12:56:10 12:56:14 12:56:14 12:56:14 12:56:14 12:56:14 12:56:14 12:56:14 12:56:14 12:56:14 13:02:21 13:02:21 13:02:21 13:02:21 13:02:21 13:02:21 13:02:21 13:10:54 13:11:15 13:23:25 13:23:25 13:23:25 13:23:25 13:23:25 13:23:25 13:23:25 13:23:25 13:23:25
Instrumento Financ./Security
Operación / Transaction
SAB SAB SAB SAB SAB SAB SAB SAB SAB SAB SAB SAB SAB SAB SAB SAB SAB SAB SAB SAB SAB SAB SAB SAB SAB SAB SAB SAB SAB SAB SAB SAB SAB SAB SAB SAB SAB SAB SAB SAB SAB SAB SAB SAB SAB SAB SAB SAB SAB SAB SAB
COMPRA / BUY COMPRA / BUY COMPRA / BUY COMPRA / BUY COMPRA / BUY COMPRA / BUY COMPRA / BUY COMPRA / BUY COMPRA / BUY COMPRA / BUY COMPRA / BUY COMPRA / BUY COMPRA / BUY COMPRA / BUY COMPRA / BUY COMPRA / BUY COMPRA / BUY COMPRA / BUY COMPRA / BUY COMPRA / BUY COMPRA / BUY COMPRA / BUY COMPRA / BUY COMPRA / BUY COMPRA / BUY COMPRA / BUY COMPRA / BUY COMPRA / BUY COMPRA / BUY COMPRA / BUY COMPRA / BUY COMPRA / BUY COMPRA / BUY COMPRA / BUY COMPRA / BUY COMPRA / BUY COMPRA / BUY COMPRA / BUY COMPRA / BUY COMPRA / BUY COMPRA / BUY COMPRA / BUY COMPRA / BUY COMPRA / BUY COMPRA / BUY COMPRA / BUY COMPRA / BUY COMPRA / BUY COMPRA / BUY COMPRA / BUY COMPRA / BUY
Pag. 6
Centro Negociación / Trading Venue CEUX CEUX CEUX CEUX CEUX CEUX XMAD XMAD XMAD XMAD XMAD XMAD XMAD XMAD XMAD XMAD CEUX CEUX XMAD XMAD XMAD XMAD XMAD CEUX CEUX CEUX CEUX CEUX CEUX CEUX CEUX CEUX CEUX XMAD XMAD XMAD XMAD XMAD XMAD XMAD XMAD XMAD XMAD XMAD XMAD XMAD XMAD XMAD XMAD XMAD XMAD
Nº Títulos / Nr. of Precio € / Price shares € 525 41 1.199 1.765 1.765 1.631 8.709 1.019 2.432 2.432 2.432 2.432 2.432 1.116 1.996 20.000 1.765 177 13 4.348 1.391 2.876 11.372 1.765 1.765 1.765 481 1.284 481 1.765 1.765 1.765 222 2.876 1.624 4.301 4.301 2.300 4.361 237 2.130 302 2.432 1.624 2.432 2.284 890 890 956 2.498 652
3,4030 3,4030 3,4030 3,4030 3,4030 3,4030 3,4000 3,4000 3,4000 3,4000 3,4000 3,4000 3,4000 3,4000 3,4000 3,4000 3,4030 3,4030 3,4150 3,4150 3,4150 3,4150 3,4150 3,4130 3,4130 3,4130 3,4130 3,4130 3,4130 3,4130 3,4130 3,4130 3,4130 3,4150 3,4150 3,4150 3,4150 3,4150 3,4150 3,4150 3,4120 3,4120 3,4180 3,4180 3,4180 3,4180 3,4180 3,4180 3,4180 3,4180 3,4180
Hora / Trade Fecha / Date Time 27/07/2026 27/07/2026 27/07/2026 27/07/2026 27/07/2026 27/07/2026 27/07/2026 27/07/2026 27/07/2026 27/07/2026 27/07/2026 27/07/2026 27/07/2026 27/07/2026 27/07/2026 27/07/2026 27/07/2026 27/07/2026 27/07/2026 27/07/2026 27/07/2026 27/07/2026 27/07/2026 27/07/2026 27/07/2026 27/07/2026 27/07/2026 27/07/2026 27/07/2026 27/07/2026 27/07/2026 27/07/2026 27/07/2026 27/07/2026 27/07/2026 27/07/2026 27/07/2026 27/07/2026 27/07/2026 27/07/2026 27/07/2026 27/07/2026 27/07/2026 27/07/2026 27/07/2026 27/07/2026 27/07/2026 27/07/2026 27/07/2026 27/07/2026 27/07/2026
13:23:26 13:23:26 13:24:37 13:24:37 13:24:37 13:24:37 13:24:37 13:28:02 13:28:02 13:29:58 13:29:58 13:29:58 13:29:58 13:29:59 13:29:59 13:29:59 13:29:59 13:29:59 13:29:59 13:34:27 13:34:27 13:38:45 13:58:55 14:04:36 14:10:24 14:11:18 14:11:18 14:13:23 14:14:10 14:14:10 14:14:10 14:14:10 14:14:10 14:14:10 14:14:10 14:14:10 14:14:10 14:14:10 14:14:10 14:14:10 14:14:28 14:14:28 14:14:28 14:14:28 14:14:28 14:14:28 14:14:31 14:14:31 14:14:31 14:14:31 14:14:31
Instrumento Financ./Security
Operación / Transaction
SAB SAB SAB SAB SAB SAB SAB SAB SAB SAB SAB SAB SAB SAB SAB SAB SAB SAB SAB SAB SAB SAB SAB SAB SAB SAB SAB SAB SAB SAB SAB SAB SAB SAB SAB SAB SAB SAB SAB SAB SAB SAB SAB SAB SAB SAB SAB SAB SAB SAB SAB
COMPRA / BUY COMPRA / BUY COMPRA / BUY COMPRA / BUY COMPRA / BUY COMPRA / BUY COMPRA / BUY COMPRA / BUY COMPRA / BUY COMPRA / BUY COMPRA / BUY COMPRA / BUY COMPRA / BUY COMPRA / BUY COMPRA / BUY COMPRA / BUY COMPRA / BUY COMPRA / BUY COMPRA / BUY COMPRA / BUY COMPRA / BUY COMPRA / BUY COMPRA / BUY COMPRA / BUY COMPRA / BUY COMPRA / BUY COMPRA / BUY COMPRA / BUY COMPRA / BUY COMPRA / BUY COMPRA / BUY COMPRA / BUY COMPRA / BUY COMPRA / BUY COMPRA / BUY COMPRA / BUY COMPRA / BUY COMPRA / BUY COMPRA / BUY COMPRA / BUY COMPRA / BUY COMPRA / BUY COMPRA / BUY COMPRA / BUY COMPRA / BUY COMPRA / BUY COMPRA / BUY COMPRA / BUY COMPRA / BUY COMPRA / BUY COMPRA / BUY
Pag. 7
Centro Negociación / Trading Venue XMAD XMAD CEUX CEUX CEUX CEUX CEUX CEUX CEUX CEUX CEUX CEUX CEUX CEUX CEUX CEUX CEUX CEUX CEUX XMAD XMAD XMAD XMAD XMAD XMAD XMAD XMAD CEUX CEUX CEUX CEUX CEUX CEUX CEUX CEUX CEUX CEUX CEUX CEUX CEUX XMAD XMAD XMAD XMAD XMAD XMAD XMAD XMAD XMAD XMAD XMAD
Nº Títulos / Nr. of Precio € / Price shares € 2.366 544 1.321 33 1.288 428 1.321 1.321 1.151 170 1.321 336 1.321 1.321 1.321 966 355 818 208 2.513 363 2.876 2.876 2.876 2.876 2.876 2.744 1.765 1.765 1.765 1.765 542 273 950 273 430 1.335 1.765 1.765 607 2.876 5.966 558 2.104 5.966 2.530 2.765 2.600 165 2.765 2.436
3,4180 3,4180 3,4170 3,4170 3,4170 3,4170 3,4170 3,4170 3,4170 3,4170 3,4170 3,4170 3,4170 3,4170 3,4170 3,4170 3,4170 3,4170 3,4170 3,4150 3,4150 3,4150 3,4250 3,4250 3,4250 3,4250 3,4250 3,4230 3,4230 3,4230 3,4230 3,4230 3,4230 3,4230 3,4230 3,4230 3,4230 3,4230 3,4230 3,4230 3,4220 3,4220 3,4220 3,4220 3,4220 3,4220 3,4200 3,4200 3,4200 3,4200 3,4200
Hora / Trade Fecha / Date Time 27/07/2026 27/07/2026 27/07/2026 27/07/2026 27/07/2026 27/07/2026 27/07/2026 27/07/2026 27/07/2026 27/07/2026 27/07/2026 27/07/2026 27/07/2026 27/07/2026 27/07/2026 27/07/2026 27/07/2026 27/07/2026 27/07/2026 27/07/2026 27/07/2026 27/07/2026 27/07/2026 27/07/2026 27/07/2026 27/07/2026 27/07/2026 27/07/2026 27/07/2026 27/07/2026 27/07/2026 27/07/2026 27/07/2026 27/07/2026 27/07/2026 27/07/2026 27/07/2026 27/07/2026 27/07/2026 27/07/2026 27/07/2026 27/07/2026 27/07/2026 27/07/2026 27/07/2026 27/07/2026 27/07/2026 27/07/2026 27/07/2026 27/07/2026 27/07/2026
14:14:31 14:14:31 14:14:31 14:14:31 14:14:31 14:15:33 14:15:54 14:15:55 14:15:56 14:15:59 14:15:59 14:15:59 14:15:59 14:45:38 14:46:11 14:49:32 14:49:40 14:49:40 14:49:40 14:49:40 14:49:40 14:49:40 14:49:40 14:52:02 14:52:28 14:52:38 15:06:25 15:06:25 15:06:25 15:06:25 15:06:25 15:06:25 15:06:25 15:06:41 15:06:41 15:06:41 15:06:41 15:06:41 15:06:41 15:06:41 15:06:41 15:06:41 15:06:41 15:06:41 15:06:41 15:06:41 15:06:57 15:06:57 15:06:57 15:06:57 15:43:54
Instrumento Financ./Security
Operación / Transaction
SAB SAB SAB SAB SAB SAB SAB SAB SAB SAB SAB SAB SAB SAB SAB SAB SAB SAB SAB SAB SAB SAB SAB SAB SAB SAB SAB SAB SAB SAB SAB SAB SAB SAB SAB SAB SAB SAB SAB SAB SAB SAB SAB SAB SAB SAB SAB SAB SAB SAB SAB
COMPRA / BUY COMPRA / BUY COMPRA / BUY COMPRA / BUY COMPRA / BUY COMPRA / BUY COMPRA / BUY COMPRA / BUY COMPRA / BUY COMPRA / BUY COMPRA / BUY COMPRA / BUY COMPRA / BUY COMPRA / BUY COMPRA / BUY COMPRA / BUY COMPRA / BUY COMPRA / BUY COMPRA / BUY COMPRA / BUY COMPRA / BUY COMPRA / BUY COMPRA / BUY COMPRA / BUY COMPRA / BUY COMPRA / BUY COMPRA / BUY COMPRA / BUY COMPRA / BUY COMPRA / BUY COMPRA / BUY COMPRA / BUY COMPRA / BUY COMPRA / BUY COMPRA / BUY COMPRA / BUY COMPRA / BUY COMPRA / BUY COMPRA / BUY COMPRA / BUY COMPRA / BUY COMPRA / BUY COMPRA / BUY COMPRA / BUY COMPRA / BUY COMPRA / BUY COMPRA / BUY COMPRA / BUY COMPRA / BUY COMPRA / BUY COMPRA / BUY
Pag. 8
Centro Negociación / Trading Venue XMAD XMAD XMAD XMAD XMAD XMAD XMAD XMAD XMAD XMAD XMAD XMAD XMAD XMAD XMAD XMAD XMAD XMAD XMAD XMAD XMAD XMAD XMAD XMAD XMAD XMAD XMAD XMAD XMAD XMAD XMAD XMAD XMAD CEUX CEUX CEUX CEUX CEUX CEUX CEUX CEUX CEUX CEUX CEUX CEUX CEUX CEUX CEUX CEUX CEUX XMAD
Nº Títulos / Nr. of Precio € / Price shares € 4.250 890 2.617 890 622 2.543 2.543 2.543 2.543 2.543 1.100 5.966 219 1.898 1.542 1.646 2.543 3.354 1.732 2.543 3.217 1.219 306 397 1.427 830 2.654 1.624 1.642 3.354 4.139 2.401 1.532 1.321 1.321 539 782 539 1.321 1.321 1.321 157 1.321 1.084 237 1.084 237 1.321 251 843 2.611
3,4200 3,4200 3,4200 3,4200 3,4200 3,4200 3,4200 3,4200 3,4200 3,4200 3,4200 3,4200 3,4200 3,4200 3,4200 3,4200 3,4200 3,4200 3,4200 3,4200 3,4200 3,4200 3,4200 3,4180 3,4180 3,4180 3,4180 3,4180 3,4180 3,4180 3,4180 3,4180 3,4180 3,4170 3,4170 3,4170 3,4170 3,4170 3,4170 3,4170 3,4170 3,4170 3,4170 3,4170 3,4170 3,4170 3,4170 3,4170 3,4170 3,4170 3,4150
Hora / Trade Fecha / Date Time 27/07/2026 27/07/2026 27/07/2026 27/07/2026 27/07/2026 27/07/2026 27/07/2026 27/07/2026 27/07/2026 27/07/2026 27/07/2026 27/07/2026 27/07/2026 27/07/2026 27/07/2026 27/07/2026 27/07/2026 27/07/2026 27/07/2026 27/07/2026 27/07/2026 27/07/2026 27/07/2026 27/07/2026 27/07/2026 27/07/2026 27/07/2026 27/07/2026 27/07/2026 27/07/2026 27/07/2026 27/07/2026 27/07/2026 27/07/2026 27/07/2026 27/07/2026 27/07/2026 27/07/2026 27/07/2026 27/07/2026 27/07/2026 27/07/2026 27/07/2026 27/07/2026 27/07/2026 27/07/2026 27/07/2026 27/07/2026 27/07/2026 27/07/2026 27/07/2026
16:18:43 16:18:43 16:18:43 16:18:43 16:18:43 16:18:43 16:18:43 16:20:45 16:20:45 16:20:45 16:20:48 16:20:48 16:20:48 16:20:48 16:20:59 16:21:04 16:21:04 16:21:04 16:21:04 16:21:04 16:25:37 16:25:37 16:25:37 16:25:37 16:25:37 16:25:37 16:25:37 16:25:37 16:25:37 16:25:37 16:25:37 16:29:22 16:29:22 16:29:22 16:29:22 16:29:22 16:29:22 16:29:22 16:29:22 16:29:22 16:29:32 16:29:34 16:29:34 16:29:58 16:29:58 16:29:58 16:29:58 16:29:58 16:29:58 16:29:58 16:29:58
Instrumento Financ./Security
Operación / Transaction
SAB SAB SAB SAB SAB SAB SAB SAB SAB SAB SAB SAB SAB SAB SAB SAB SAB SAB SAB SAB SAB SAB SAB SAB SAB SAB SAB SAB SAB SAB SAB SAB SAB SAB SAB SAB SAB SAB SAB SAB SAB SAB SAB SAB SAB SAB SAB SAB SAB SAB SAB
COMPRA / BUY COMPRA / BUY COMPRA / BUY COMPRA / BUY COMPRA / BUY COMPRA / BUY COMPRA / BUY COMPRA / BUY COMPRA / BUY COMPRA / BUY COMPRA / BUY COMPRA / BUY COMPRA / BUY COMPRA / BUY COMPRA / BUY COMPRA / BUY COMPRA / BUY COMPRA / BUY COMPRA / BUY COMPRA / BUY COMPRA / BUY COMPRA / BUY COMPRA / BUY COMPRA / BUY COMPRA / BUY COMPRA / BUY COMPRA / BUY COMPRA / BUY COMPRA / BUY COMPRA / BUY COMPRA / BUY COMPRA / BUY COMPRA / BUY COMPRA / BUY COMPRA / BUY COMPRA / BUY COMPRA / BUY COMPRA / BUY COMPRA / BUY COMPRA / BUY COMPRA / BUY COMPRA / BUY COMPRA / BUY COMPRA / BUY COMPRA / BUY COMPRA / BUY COMPRA / BUY COMPRA / BUY COMPRA / BUY COMPRA / BUY COMPRA / BUY
Pag. 9
Centro Negociación / Trading Venue XMAD XMAD XMAD XMAD XMAD XMAD XMAD CEUX CEUX CEUX CEUX CEUX CEUX CEUX CEUX CEUX CEUX CEUX CEUX CEUX XMAD XMAD XMAD XMAD XMAD XMAD XMAD XMAD XMAD XMAD XMAD XMAD XMAD XMAD XMAD XMAD XMAD XMAD XMAD XMAD XMAD CEUX CEUX CEUX CEUX CEUX CEUX CEUX CEUX CEUX CEUX
Nº Títulos / Nr. of Precio € / Price shares € 265 3.158 102 2.876 3.158 5.752 2.078 794 971 940 825 1.765 1.765 4 1.761 1.765 1.765 1.765 813 67 2.198 1.624 3.158 1.624 1.812 2.386 1.624 960 1.055 1.624 1.935 2.765 3.158 1.624 1.234 2.765 2.372 2.672 1.043 1.722 645 1.654 158 1.654 1.355 299 1.355 2 1.467 185 1.654
3,4150 3,4150 3,4150 3,4150 3,4150 3,4150 3,4150 3,4130 3,4130 3,4130 3,4130 3,4130 3,4130 3,4130 3,4130 3,4130 3,4130 3,4130 3,4130 3,4130 3,4100 3,4100 3,4100 3,4100 3,4100 3,4100 3,4100 3,4100 3,4100 3,4100 3,4100 3,4080 3,4080 3,4080 3,4080 3,4080 3,4080 3,4080 3,4080 3,4080 3,4080 3,4070 3,4070 3,4070 3,4070 3,4070 3,4070 3,4070 3,4070 3,4070 3,4070
Hora / Trade Fecha / Date Time 27/07/2026 27/07/2026 27/07/2026 27/07/2026 27/07/2026 27/07/2026 27/07/2026 27/07/2026 27/07/2026 27/07/2026 27/07/2026 27/07/2026 27/07/2026 27/07/2026 27/07/2026 27/07/2026 27/07/2026 27/07/2026 27/07/2026 27/07/2026 27/07/2026 27/07/2026 27/07/2026 27/07/2026 27/07/2026 27/07/2026 27/07/2026 27/07/2026 27/07/2026 27/07/2026 27/07/2026 27/07/2026 27/07/2026 27/07/2026 27/07/2026 27/07/2026 27/07/2026 27/07/2026 27/07/2026 27/07/2026 27/07/2026 27/07/2026 27/07/2026 27/07/2026 27/07/2026 27/07/2026 27/07/2026 27/07/2026 27/07/2026 27/07/2026 27/07/2026
16:29:58 16:29:59 16:29:59 16:29:59 16:30:33 16:30:33 16:30:33 16:30:40 16:30:56 16:30:56 16:31:08 16:31:08 16:41:22 16:41:22 16:41:22 16:41:22 16:41:22 16:41:22 16:41:22 16:41:22 16:41:22 16:41:24 16:41:24 17:10:13 17:10:13 17:10:13 17:10:13 17:10:13 17:10:13 17:10:13 17:10:13 17:10:13 17:10:13 17:10:13 17:11:38 17:11:38 17:11:38 17:11:38 17:11:38 17:11:38 17:11:38 17:11:38 17:11:38 17:11:38 17:12:45 17:12:45 17:12:45 17:12:45 17:12:45 17:12:45 17:12:45
Instrumento Financ./Security
Operación / Transaction
SAB SAB SAB SAB SAB SAB SAB SAB SAB SAB SAB SAB SAB SAB SAB SAB SAB SAB SAB SAB SAB SAB SAB SAB SAB SAB SAB SAB SAB SAB SAB SAB SAB SAB SAB SAB SAB SAB SAB SAB SAB SAB SAB SAB SAB SAB SAB SAB SAB SAB SAB
COMPRA / BUY COMPRA / BUY COMPRA / BUY COMPRA / BUY COMPRA / BUY COMPRA / BUY COMPRA / BUY COMPRA / BUY COMPRA / BUY COMPRA / BUY COMPRA / BUY COMPRA / BUY COMPRA / BUY COMPRA / BUY COMPRA / BUY COMPRA / BUY COMPRA / BUY COMPRA / BUY COMPRA / BUY COMPRA / BUY COMPRA / BUY COMPRA / BUY COMPRA / BUY COMPRA / BUY COMPRA / BUY COMPRA / BUY COMPRA / BUY COMPRA / BUY COMPRA / BUY COMPRA / BUY COMPRA / BUY COMPRA / BUY COMPRA / BUY COMPRA / BUY COMPRA / BUY COMPRA / BUY COMPRA / BUY COMPRA / BUY COMPRA / BUY COMPRA / BUY COMPRA / BUY COMPRA / BUY COMPRA / BUY COMPRA / BUY COMPRA / BUY COMPRA / BUY COMPRA / BUY COMPRA / BUY COMPRA / BUY COMPRA / BUY COMPRA / BUY
Pag. 10
Centro Negociación / Trading Venue CEUX CEUX CEUX CEUX XMAD XMAD XMAD XMAD XMAD XMAD XMAD XMAD CEUX CEUX CEUX CEUX CEUX CEUX CEUX CEUX CEUX CEUX CEUX XMAD XMAD XMAD XMAD XMAD XMAD XMAD XMAD XMAD XMAD XMAD CEUX CEUX XMAD XMAD XMAD XMAD XMAD XMAD XMAD XMAD XMAD XMAD XMAD XMAD XMAD XMAD XMAD
Nº Títulos / Nr. of Precio € / Price shares € 1.654 1.654 1.654 255 1.624 9.433 1.103 2.432 3.000 329 1.535 544 1.765 1.765 234 1.765 1.765 1.204 2 1.370 393 1.765 1.204 2.198 1.184 2.198 3.212 3.212 3.683 2.198 8.726 812 4.396 3.181 1.765 3 20.000 2.432 4.954 2.432 7.296 4.774 3.112 20.000 5.518 1.624 7.296 154 2.432 2.432 2.432
3,4070 3,4070 3,4070 3,4070 3,4050 3,4050 3,4050 3,4050 3,4050 3,4050 3,4050 3,4050 3,4030 3,4030 3,4030 3,4030 3,4030 3,4030 3,4030 3,4030 3,4030 3,4030 3,4030 3,4180 3,4180 3,4180 3,4180 3,4180 3,4180 3,4180 3,4180 3,4180 3,4180 3,4180 3,4170 3,4170 3,4160 3,4140 3,4140 3,4140 3,4140 3,4140 3,4140 3,4120 3,4160 3,4160 3,4160 3,4160 3,4160 3,4160 3,4160
Hora / Trade Fecha / Date Time 27/07/2026 27/07/2026 27/07/2026 27/07/2026 27/07/2026 27/07/2026 27/07/2026 27/07/2026 27/07/2026 27/07/2026 27/07/2026 27/07/2026 27/07/2026 27/07/2026 27/07/2026 27/07/2026 27/07/2026 27/07/2026 27/07/2026 27/07/2026 27/07/2026 27/07/2026 27/07/2026 27/07/2026 27/07/2026 27/07/2026 27/07/2026 27/07/2026 27/07/2026 27/07/2026 27/07/2026 27/07/2026 27/07/2026 27/07/2026 27/07/2026 27/07/2026 27/07/2026 27/07/2026 27/07/2026 27/07/2026 27/07/2026 27/07/2026 27/07/2026 27/07/2026 27/07/2026 27/07/2026 27/07/2026 27/07/2026 27/07/2026 27/07/2026 27/07/2026
17:12:45 17:12:45 17:12:45 17:12:45 17:18:17 17:18:18 17:18:18 17:18:18 17:18:18 17:18:18 17:18:19 17:18:19 17:18:19 17:18:19 17:18:19 17:18:19 17:18:19 17:18:19 17:18:19 17:18:19 17:18:19 17:18:19 17:18:19 17:18:19 17:18:19 17:18:19 17:18:19 17:18:19 17:18:19 17:18:19 17:18:19 17:18:22 17:18:30 17:18:57 17:18:57 17:19:12 17:19:12 17:19:32 17:19:32 17:19:32 17:19:32 17:19:32 17:19:32 17:19:32 17:19:32 17:19:33 17:19:33 17:22:00 17:22:00 17:22:00 17:22:00
Instrumento Financ./Security
Operación / Transaction
SAB SAB SAB SAB SAB SAB SAB SAB SAB SAB SAB SAB SAB SAB SAB SAB SAB SAB SAB SAB SAB SAB SAB SAB SAB SAB SAB SAB SAB SAB SAB SAB SAB SAB SAB SAB SAB SAB SAB SAB SAB SAB SAB SAB SAB SAB SAB SAB SAB SAB SAB
COMPRA / BUY COMPRA / BUY COMPRA / BUY COMPRA / BUY COMPRA / BUY COMPRA / BUY COMPRA / BUY COMPRA / BUY COMPRA / BUY COMPRA / BUY COMPRA / BUY COMPRA / BUY COMPRA / BUY COMPRA / BUY COMPRA / BUY COMPRA / BUY COMPRA / BUY COMPRA / BUY COMPRA / BUY COMPRA / BUY COMPRA / BUY COMPRA / BUY COMPRA / BUY COMPRA / BUY COMPRA / BUY COMPRA / BUY COMPRA / BUY COMPRA / BUY COMPRA / BUY COMPRA / BUY COMPRA / BUY COMPRA / BUY COMPRA / BUY COMPRA / BUY COMPRA / BUY COMPRA / BUY COMPRA / BUY COMPRA / BUY COMPRA / BUY COMPRA / BUY COMPRA / BUY COMPRA / BUY COMPRA / BUY COMPRA / BUY COMPRA / BUY COMPRA / BUY COMPRA / BUY COMPRA / BUY COMPRA / BUY COMPRA / BUY COMPRA / BUY
Pag. 11
Centro Negociación / Trading Venue XMAD XMAD XMAD XMAD CEUX CEUX CEUX CEUX CEUX CEUX CEUX CEUX CEUX CEUX CEUX CEUX CEUX CEUX CEUX CEUX CEUX CEUX CEUX XMAD XMAD XMAD XMAD XMAD XMAD XMAD CEUX CEUX CEUX CEUX XMAD XMAD XMAD XMAD XMAD XMAD XMAD XMAD XMAD XMAD XMAD CEUX CEUX CEUX CEUX CEUX CEUX
Nº Títulos / Nr. of Precio € / Price shares € 1.067 2.432 1.624 2.989 1.219 1.219 1.219 882 67 1.084 68 1.219 1.219 1.084 86 49 1.022 135 1.084 813 406 813 1.219 2.198 1.624 2.198 4.954 2.772 4.970 1.284 93 1.654 1.353 301 2.876 1.200 1.624 1.648 1.280 812 1.221 2.064 3.549 1.624 2.102 1.654 1.654 1.654 1.190 1.654 1.654
3,4160 3,4160 3,4160 3,4160 3,4170 3,4170 3,4170 3,4170 3,4170 3,4170 3,4170 3,4170 3,4170 3,4170 3,4170 3,4170 3,4170 3,4170 3,4170 3,4170 3,4170 3,4170 3,4170 3,4160 3,4160 3,4160 3,4160 3,4160 3,4160 3,4160 3,4170 3,4150 3,4150 3,4150 3,4150 3,4150 3,4150 3,4150 3,4150 3,4150 3,4150 3,4150 3,4150 3,4150 3,4150 3,4150 3,4150 3,4170 3,4170 3,4170 3,4170
Hora / Trade Fecha / Date Time 27/07/2026 27/07/2026 27/07/2026 27/07/2026 27/07/2026 28/07/2026 28/07/2026 28/07/2026 28/07/2026 28/07/2026 28/07/2026 28/07/2026 28/07/2026 28/07/2026 28/07/2026 28/07/2026 28/07/2026 28/07/2026 28/07/2026 28/07/2026 28/07/2026 28/07/2026 28/07/2026 28/07/2026 28/07/2026 28/07/2026 28/07/2026 28/07/2026 28/07/2026 28/07/2026 28/07/2026 28/07/2026 28/07/2026 28/07/2026 28/07/2026 28/07/2026 28/07/2026 28/07/2026 28/07/2026 28/07/2026 28/07/2026 28/07/2026 28/07/2026 28/07/2026 28/07/2026 28/07/2026 28/07/2026 28/07/2026 28/07/2026 28/07/2026 28/07/2026
17:22:00 17:22:00 17:22:00 17:25:15 17:25:15 09:08:23 09:08:23 09:08:23 09:08:23 09:08:23 09:08:23 09:08:23 09:08:23 09:08:59 09:08:59 09:08:59 09:08:59 09:09:00 09:09:00 09:09:10 09:09:10 09:09:10 09:09:10 09:09:10 09:09:10 09:09:10 09:09:10 09:09:10 09:09:36 09:09:36 09:09:36 09:09:36 09:09:36 09:09:49 09:09:49 09:09:49 09:09:50 09:09:50 09:09:50 09:09:50 09:09:50 09:09:50 09:09:50 09:09:50 09:10:35 09:10:35 09:10:35 09:10:35 09:10:35 09:10:35 09:10:35
Instrumento Financ./Security
Operación / Transaction
SAB SAB SAB SAB SAB SAB SAB SAB SAB SAB SAB SAB SAB SAB SAB SAB SAB SAB SAB SAB SAB SAB SAB SAB SAB SAB SAB SAB SAB SAB SAB SAB SAB SAB SAB SAB SAB SAB SAB SAB SAB SAB SAB SAB SAB SAB SAB SAB SAB SAB SAB
COMPRA / BUY COMPRA / BUY COMPRA / BUY COMPRA / BUY COMPRA / BUY COMPRA / BUY COMPRA / BUY COMPRA / BUY COMPRA / BUY COMPRA / BUY COMPRA / BUY COMPRA / BUY COMPRA / BUY COMPRA / BUY COMPRA / BUY COMPRA / BUY COMPRA / BUY COMPRA / BUY COMPRA / BUY COMPRA / BUY COMPRA / BUY COMPRA / BUY COMPRA / BUY COMPRA / BUY COMPRA / BUY COMPRA / BUY COMPRA / BUY COMPRA / BUY COMPRA / BUY COMPRA / BUY COMPRA / BUY COMPRA / BUY COMPRA / BUY COMPRA / BUY COMPRA / BUY COMPRA / BUY COMPRA / BUY COMPRA / BUY COMPRA / BUY COMPRA / BUY COMPRA / BUY COMPRA / BUY COMPRA / BUY COMPRA / BUY COMPRA / BUY COMPRA / BUY COMPRA / BUY COMPRA / BUY COMPRA / BUY COMPRA / BUY COMPRA / BUY
Pag. 12
Centro Negociación / Trading Venue CEUX CEUX CEUX CEUX CEUX CEUX CEUX CEUX CEUX CEUX CEUX CEUX CEUX CEUX CEUX CEUX CEUX CEUX CEUX XMAD XMAD XMAD XMAD XMAD XMAD XMAD XMAD XMAD CEUX CEUX CEUX CEUX CEUX CEUX CEUX CEUX CEUX CEUX CEUX CEUX XMAD XMAD XMAD XMAD XMAD XMAD XMAD XMAD XMAD XMAD CEUX
Nº Títulos / Nr. of Precio € / Price shares € 486 700 343 611 92 1.987 1.987 261 240 1.145 341 1.987 710 1.277 1.187 800 387 1.987 704 2.219 782 4.331 2.219 878 2.073 878 2.885 3.735 1.012 632 232 632 864 1.012 1.876 1.876 1.876 1.876 1.876 1.236 5.256 718 2.987 2.321 666 1.887 1.100 1.100 1.564 2.401 1.765
3,4170 3,4170 3,4170 3,4170 3,4170 3,4130 3,4130 3,4130 3,4130 3,4130 3,4130 3,4130 3,4130 3,4130 3,4130 3,4130 3,4130 3,4130 3,4130 3,4100 3,4100 3,4100 3,4100 3,4100 3,4100 3,4100 3,4100 3,4100 3,4070 3,4070 3,4070 3,4070 3,4070 3,4070 3,4070 3,4070 3,4070 3,4070 3,4070 3,4070 3,4050 3,4050 3,4050 3,4050 3,4050 3,4050 3,4050 3,4050 3,4050 3,4050 3,4030
Hora / Trade Fecha / Date Time 28/07/2026 28/07/2026 28/07/2026 28/07/2026 28/07/2026 28/07/2026 28/07/2026 28/07/2026 28/07/2026 28/07/2026 28/07/2026 28/07/2026 28/07/2026 28/07/2026 28/07/2026 28/07/2026 28/07/2026 28/07/2026 28/07/2026 28/07/2026 28/07/2026 28/07/2026 28/07/2026 28/07/2026 28/07/2026 28/07/2026 28/07/2026 28/07/2026 28/07/2026 28/07/2026 28/07/2026 28/07/2026 28/07/2026 28/07/2026 28/07/2026 28/07/2026 28/07/2026 28/07/2026 28/07/2026 28/07/2026 28/07/2026 28/07/2026 28/07/2026 28/07/2026 28/07/2026 28/07/2026 28/07/2026 28/07/2026 28/07/2026 28/07/2026 28/07/2026
09:10:35 09:10:35 09:10:35 09:10:35 09:10:35 09:10:35 09:10:35 09:10:35 09:10:35 09:10:35 09:10:35 09:10:35 09:10:35 09:10:35 09:10:35 09:10:35 09:10:35 09:10:35 09:10:35 09:10:35 09:10:35 09:10:35 09:10:35 09:10:35 09:10:35 09:10:35 09:10:35 09:11:55 09:12:38 09:12:38 09:12:38 09:12:38 09:12:38 09:12:38 09:12:38 09:12:38 09:12:56 09:12:56 09:12:56 09:12:56 09:12:56 09:12:56 09:12:56 09:12:56 09:13:03 09:13:03 09:13:06 09:13:06 09:13:06 09:13:06 09:13:06
Instrumento Financ./Security
Operación / Transaction
SAB SAB SAB SAB SAB SAB SAB SAB SAB SAB SAB SAB SAB SAB SAB SAB SAB SAB SAB SAB SAB SAB SAB SAB SAB SAB SAB SAB SAB SAB SAB SAB SAB SAB SAB SAB SAB SAB SAB SAB SAB SAB SAB SAB SAB SAB SAB SAB SAB SAB SAB
COMPRA / BUY COMPRA / BUY COMPRA / BUY COMPRA / BUY COMPRA / BUY COMPRA / BUY COMPRA / BUY COMPRA / BUY COMPRA / BUY COMPRA / BUY COMPRA / BUY COMPRA / BUY COMPRA / BUY COMPRA / BUY COMPRA / BUY COMPRA / BUY COMPRA / BUY COMPRA / BUY COMPRA / BUY COMPRA / BUY COMPRA / BUY COMPRA / BUY COMPRA / BUY COMPRA / BUY COMPRA / BUY COMPRA / BUY COMPRA / BUY COMPRA / BUY COMPRA / BUY COMPRA / BUY COMPRA / BUY COMPRA / BUY COMPRA / BUY COMPRA / BUY COMPRA / BUY COMPRA / BUY COMPRA / BUY COMPRA / BUY COMPRA / BUY COMPRA / BUY COMPRA / BUY COMPRA / BUY COMPRA / BUY COMPRA / BUY COMPRA / BUY COMPRA / BUY COMPRA / BUY COMPRA / BUY COMPRA / BUY COMPRA / BUY COMPRA / BUY
Pag. 13
Centro Negociación / Trading Venue CEUX CEUX CEUX CEUX CEUX CEUX CEUX CEUX CEUX CEUX CEUX XMAD XMAD XMAD XMAD XMAD XMAD XMAD CEUX CEUX CEUX CEUX CEUX CEUX CEUX CEUX CEUX CEUX XMAD XMAD XMAD XMAD XMAD XMAD XMAD XMAD XMAD XMAD XMAD XMAD CEUX CEUX CEUX XMAD XMAD XMAD XMAD XMAD XMAD XMAD CEUX
Nº Títulos / Nr. of Precio € / Price shares € 1 1.764 1.764 1 1.765 1.765 150 1.765 1.765 1.765 730 2.876 2.876 2.876 2.876 2.876 2.876 2.744 1.654 1.654 1.654 1.654 1.654 5 1.385 94 170 1.654 2.198 324 2.052 878 1.874 878 1.142 2.480 5.742 16 1.564 852 1.654 1.654 114 6.060 2.235 2.765 2.765 2.765 2.765 645 1.543
3,4030 3,4030 3,4030 3,4030 3,4030 3,4030 3,4030 3,4030 3,4030 3,4030 3,4030 3,4000 3,4000 3,4000 3,4000 3,4000 3,4000 3,4000 3,3970 3,3970 3,3970 3,3970 3,3970 3,3970 3,3970 3,3970 3,3970 3,3970 3,3980 3,3980 3,3980 3,3980 3,3980 3,3980 3,3980 3,3980 3,3980 3,3980 3,3980 3,3980 3,3970 3,3970 3,3970 3,3950 3,3950 3,3950 3,3950 3,3950 3,3950 3,3950 3,3930
Hora / Trade Fecha / Date Time 28/07/2026 28/07/2026 28/07/2026 28/07/2026 28/07/2026 28/07/2026 28/07/2026 28/07/2026 28/07/2026 28/07/2026 28/07/2026 28/07/2026 28/07/2026 28/07/2026 28/07/2026 28/07/2026 28/07/2026 28/07/2026 28/07/2026 28/07/2026 28/07/2026 28/07/2026 28/07/2026 28/07/2026 28/07/2026 28/07/2026 28/07/2026 28/07/2026 28/07/2026 28/07/2026 28/07/2026 28/07/2026 28/07/2026 28/07/2026 28/07/2026 28/07/2026 28/07/2026 28/07/2026 28/07/2026 28/07/2026 28/07/2026 28/07/2026 28/07/2026 28/07/2026 28/07/2026 28/07/2026 28/07/2026 28/07/2026 28/07/2026 28/07/2026 28/07/2026
09:13:06 09:13:06 09:13:06 09:13:06 09:13:06 09:15:54 09:15:55 09:15:55 09:15:55 09:15:55 09:15:55 09:15:55 09:15:55 09:15:55 09:16:04 09:16:04 09:16:56 09:16:56 09:16:56 09:16:56 09:16:56 09:16:58 09:16:58 09:17:05 09:17:05 09:17:06 09:17:06 09:17:06 09:17:06 09:17:06 09:17:06 09:17:44 09:18:02 09:20:46 09:20:46 09:40:08 09:40:18 09:40:18 09:40:18 09:40:18 09:40:18 09:40:18 09:40:18 09:40:18 09:40:18 09:42:03 09:42:03 10:03:42 10:03:42 10:03:42 10:03:42
Instrumento Financ./Security
Operación / Transaction
SAB SAB SAB SAB SAB SAB SAB SAB SAB SAB SAB SAB SAB SAB SAB SAB SAB SAB SAB SAB SAB SAB SAB SAB SAB SAB SAB SAB SAB SAB SAB SAB SAB SAB SAB SAB SAB SAB SAB SAB SAB SAB SAB SAB SAB SAB SAB SAB SAB SAB SAB
COMPRA / BUY COMPRA / BUY COMPRA / BUY COMPRA / BUY COMPRA / BUY COMPRA / BUY COMPRA / BUY COMPRA / BUY COMPRA / BUY COMPRA / BUY COMPRA / BUY COMPRA / BUY COMPRA / BUY COMPRA / BUY COMPRA / BUY COMPRA / BUY COMPRA / BUY COMPRA / BUY COMPRA / BUY COMPRA / BUY COMPRA / BUY COMPRA / BUY COMPRA / BUY COMPRA / BUY COMPRA / BUY COMPRA / BUY COMPRA / BUY COMPRA / BUY COMPRA / BUY COMPRA / BUY COMPRA / BUY COMPRA / BUY COMPRA / BUY COMPRA / BUY COMPRA / BUY COMPRA / BUY COMPRA / BUY COMPRA / BUY COMPRA / BUY COMPRA / BUY COMPRA / BUY COMPRA / BUY COMPRA / BUY COMPRA / BUY COMPRA / BUY COMPRA / BUY COMPRA / BUY COMPRA / BUY COMPRA / BUY COMPRA / BUY COMPRA / BUY
Pag. 14
Centro Negociación / Trading Venue CEUX CEUX CEUX CEUX CEUX CEUX CEUX CEUX CEUX CEUX CEUX CEUX CEUX XMAD XMAD XMAD XMAD XMAD XMAD XMAD XMAD XMAD XMAD XMAD XMAD XMAD XMAD XMAD XMAD CEUX CEUX CEUX CEUX XMAD XMAD CEUX CEUX CEUX CEUX CEUX CEUX CEUX CEUX CEUX CEUX XMAD XMAD XMAD XMAD XMAD XMAD
Nº Títulos / Nr. of Precio € / Price shares € 670 36 1 836 669 1.543 1.543 1.543 1.543 1.543 1.543 1.543 444 2.147 2.147 1.564 583 1.564 1.289 878 878 1.832 713 1.434 279 1.564 878 1.682 568 1.219 125 1.219 1.219 20.000 20.000 1.219 1.219 1.219 1.219 1.219 1.219 1.219 1.219 1.219 247 2.147 17.853 2.147 10.237 2.147 5.469
3,3930 3,3930 3,3930 3,3930 3,3930 3,3970 3,3970 3,3970 3,3970 3,3970 3,3970 3,3970 3,3970 3,3950 3,3950 3,3950 3,3950 3,3950 3,3950 3,3950 3,3950 3,3950 3,3950 3,3950 3,3950 3,3950 3,3950 3,3950 3,3950 3,3930 3,3930 3,3930 3,3930 3,4000 3,3950 3,3970 3,3970 3,3970 3,3970 3,3970 3,3970 3,3970 3,3970 3,3970 3,3970 3,3950 3,3950 3,3950 3,3950 3,3950 3,3950
Hora / Trade Fecha / Date Time 28/07/2026 28/07/2026 28/07/2026 28/07/2026 28/07/2026 28/07/2026 28/07/2026 28/07/2026 28/07/2026 28/07/2026 28/07/2026 28/07/2026 28/07/2026 28/07/2026 28/07/2026 28/07/2026 28/07/2026 28/07/2026 28/07/2026 28/07/2026 28/07/2026 28/07/2026 28/07/2026 28/07/2026 28/07/2026 28/07/2026 28/07/2026 28/07/2026 28/07/2026 28/07/2026 28/07/2026 28/07/2026 28/07/2026 28/07/2026 28/07/2026 28/07/2026 28/07/2026 28/07/2026 28/07/2026 28/07/2026 28/07/2026 28/07/2026 28/07/2026 28/07/2026 28/07/2026 28/07/2026 28/07/2026 28/07/2026 28/07/2026 28/07/2026 28/07/2026
10:03:42 10:03:42 10:03:42 10:03:42 10:03:42 10:03:42 10:03:42 10:03:42 10:03:42 10:03:42 10:09:00 10:09:00 10:09:00 10:09:00 10:09:00 10:09:00 10:09:00 10:09:00 10:09:00 10:09:00 10:09:00 10:11:51 10:12:02 10:12:02 10:12:02 10:12:02 10:12:02 10:12:02 10:12:02 10:12:02 10:12:02 10:12:02 10:12:02 10:12:02 10:12:02 10:12:16 10:12:16 10:12:16 10:12:17 10:12:17 10:12:27 10:12:28 10:12:28 10:12:28 10:12:28 10:12:28 10:12:29 10:12:29 10:12:29 10:12:29 10:12:31
Instrumento Financ./Security
Operación / Transaction
SAB SAB SAB SAB SAB SAB SAB SAB SAB SAB SAB SAB SAB SAB SAB SAB SAB SAB SAB SAB SAB SAB SAB SAB SAB SAB SAB SAB SAB SAB SAB SAB SAB SAB SAB SAB SAB SAB SAB SAB SAB SAB SAB SAB SAB SAB SAB SAB SAB SAB SAB
COMPRA / BUY COMPRA / BUY COMPRA / BUY COMPRA / BUY COMPRA / BUY COMPRA / BUY COMPRA / BUY COMPRA / BUY COMPRA / BUY COMPRA / BUY COMPRA / BUY COMPRA / BUY COMPRA / BUY COMPRA / BUY COMPRA / BUY COMPRA / BUY COMPRA / BUY COMPRA / BUY COMPRA / BUY COMPRA / BUY COMPRA / BUY COMPRA / BUY COMPRA / BUY COMPRA / BUY COMPRA / BUY COMPRA / BUY COMPRA / BUY COMPRA / BUY COMPRA / BUY COMPRA / BUY COMPRA / BUY COMPRA / BUY COMPRA / BUY COMPRA / BUY COMPRA / BUY COMPRA / BUY COMPRA / BUY COMPRA / BUY COMPRA / BUY COMPRA / BUY COMPRA / BUY COMPRA / BUY COMPRA / BUY COMPRA / BUY COMPRA / BUY COMPRA / BUY COMPRA / BUY COMPRA / BUY COMPRA / BUY COMPRA / BUY COMPRA / BUY
Pag. 15
Centro Negociación / Trading Venue CEUX CEUX CEUX CEUX CEUX CEUX CEUX CEUX CEUX CEUX XMAD XMAD XMAD XMAD XMAD XMAD XMAD XMAD XMAD XMAD XMAD CEUX CEUX CEUX CEUX CEUX CEUX CEUX CEUX CEUX CEUX CEUX CEUX CEUX CEUX CEUX CEUX CEUX XMAD XMAD XMAD XMAD XMAD XMAD XMAD XMAD XMAD XMAD XMAD XMAD CEUX
Nº Títulos / Nr. of Precio € / Price shares € 1.987 1.987 1.987 1.987 1.987 1.987 186 1.801 186 905 2.654 3.910 782 782 4.778 878 878 1.564 782 1.564 1.428 1.432 386 1.046 480 952 94 1.432 1.432 1.432 1 1.431 1 1.432 1.294 138 1.432 585 6.069 1.038 2.369 1.870 2.223 878 878 499 833 2.295 878 170 1.321
3,3930 3,3930 3,3930 3,3930 3,3930 3,3930 3,3930 3,3930 3,3930 3,3930 3,3900 3,3900 3,3900 3,3900 3,3900 3,3900 3,3900 3,3900 3,3900 3,3900 3,3900 3,3870 3,3870 3,3870 3,3870 3,3870 3,3870 3,3870 3,3870 3,3870 3,3870 3,3870 3,3870 3,3870 3,3870 3,3870 3,3870 3,3870 3,3850 3,3850 3,3850 3,3850 3,3850 3,3850 3,3850 3,3850 3,3850 3,3850 3,3850 3,3850 3,3830
Hora / Trade Fecha / Date Time 28/07/2026 28/07/2026 28/07/2026 28/07/2026 28/07/2026 28/07/2026 28/07/2026 28/07/2026 28/07/2026 28/07/2026 28/07/2026 28/07/2026 28/07/2026 28/07/2026 28/07/2026 28/07/2026 28/07/2026 28/07/2026 28/07/2026 28/07/2026 28/07/2026 28/07/2026 28/07/2026 28/07/2026 28/07/2026 28/07/2026 28/07/2026 28/07/2026 28/07/2026 28/07/2026 28/07/2026 28/07/2026 28/07/2026 28/07/2026 28/07/2026 28/07/2026 28/07/2026 28/07/2026 28/07/2026 28/07/2026 28/07/2026 28/07/2026 28/07/2026 28/07/2026 28/07/2026 28/07/2026 28/07/2026 28/07/2026 28/07/2026 28/07/2026 28/07/2026
10:12:31 10:12:31 10:12:31 10:12:31 10:12:31 10:12:31 10:12:31 10:12:33 10:12:33 10:12:33 10:12:33 10:12:33 10:12:55 10:12:55 10:13:03 11:14:10 11:14:13 11:31:48 11:31:56 11:31:56 11:32:03 11:32:22 11:32:22 11:32:22 11:32:22 11:34:05 11:34:05 11:34:05 11:34:05 11:34:05 11:34:05 11:34:05 11:34:05 11:34:05 11:34:05 11:34:05 11:34:05 11:34:05 11:34:05 11:34:06 11:34:26 11:34:26 11:34:26 11:34:26 11:35:36 11:35:36 11:36:46 11:36:46 11:36:46 11:36:46 11:37:48
Instrumento Financ./Security
Operación / Transaction
SAB SAB SAB SAB SAB SAB SAB SAB SAB SAB SAB SAB SAB SAB SAB SAB SAB SAB SAB SAB SAB SAB SAB SAB SAB SAB SAB SAB SAB SAB SAB SAB SAB SAB SAB SAB SAB SAB SAB SAB SAB SAB SAB SAB SAB SAB SAB SAB SAB SAB SAB
COMPRA / BUY COMPRA / BUY COMPRA / BUY COMPRA / BUY COMPRA / BUY COMPRA / BUY COMPRA / BUY COMPRA / BUY COMPRA / BUY COMPRA / BUY COMPRA / BUY COMPRA / BUY COMPRA / BUY COMPRA / BUY COMPRA / BUY COMPRA / BUY COMPRA / BUY COMPRA / BUY COMPRA / BUY COMPRA / BUY COMPRA / BUY COMPRA / BUY COMPRA / BUY COMPRA / BUY COMPRA / BUY COMPRA / BUY COMPRA / BUY COMPRA / BUY COMPRA / BUY COMPRA / BUY COMPRA / BUY COMPRA / BUY COMPRA / BUY COMPRA / BUY COMPRA / BUY COMPRA / BUY COMPRA / BUY COMPRA / BUY COMPRA / BUY COMPRA / BUY COMPRA / BUY COMPRA / BUY COMPRA / BUY COMPRA / BUY COMPRA / BUY COMPRA / BUY COMPRA / BUY COMPRA / BUY COMPRA / BUY COMPRA / BUY COMPRA / BUY
Pag. 16
Centro Negociación / Trading Venue CEUX CEUX CEUX CEUX CEUX CEUX CEUX CEUX CEUX CEUX CEUX CEUX XMAD XMAD XMAD XMAD XMAD XMAD XMAD XMAD XMAD XMAD XMAD XMAD XMAD CEUX CEUX CEUX CEUX CEUX CEUX CEUX CEUX CEUX CEUX CEUX CEUX CEUX CEUX CEUX CEUX CEUX CEUX CEUX XMAD XMAD CEUX CEUX CEUX CEUX CEUX
Nº Títulos / Nr. of Precio € / Price shares € 1.321 1.321 4 1.317 1.321 1.321 1.321 1.321 1.321 1.321 1.321 469 5.630 13.467 903 2.096 211 13.274 6.417 1.692 2.369 1.564 878 878 621 1.321 234 1.087 234 409 912 409 449 872 409 1.321 1.321 1.321 552 684 85 1.321 1.321 738 2.543 17.457 1.198 1.198 1.044 4 150
3,3830 3,3830 3,3830 3,3830 3,3830 3,3830 3,3830 3,3830 3,3830 3,3830 3,3830 3,3830 3,3800 3,3800 3,3800 3,3850 3,3850 3,3850 3,3850 3,3850 3,3850 3,3850 3,3850 3,3850 3,3850 3,3830 3,3830 3,3830 3,3830 3,3830 3,3830 3,3830 3,3830 3,3830 3,3830 3,3830 3,3830 3,3830 3,3830 3,3830 3,3830 3,3830 3,3830 3,3830 3,3800 3,3800 3,3770 3,3770 3,3770 3,3770 3,3770
Hora / Trade Fecha / Date Time 28/07/2026 28/07/2026 28/07/2026 28/07/2026 28/07/2026 28/07/2026 28/07/2026 28/07/2026 28/07/2026 28/07/2026 28/07/2026 28/07/2026 28/07/2026 28/07/2026 28/07/2026 28/07/2026 28/07/2026 28/07/2026 28/07/2026 28/07/2026 28/07/2026 28/07/2026 28/07/2026 28/07/2026 28/07/2026 28/07/2026 28/07/2026 28/07/2026 28/07/2026 28/07/2026 28/07/2026 28/07/2026 28/07/2026 28/07/2026 28/07/2026 28/07/2026 28/07/2026 28/07/2026 28/07/2026 28/07/2026 28/07/2026 28/07/2026 28/07/2026 28/07/2026 28/07/2026 28/07/2026 28/07/2026 28/07/2026 28/07/2026 28/07/2026 28/07/2026
11:37:48 11:37:48 11:37:48 11:37:48 11:37:48 11:37:48 11:37:48 11:37:48 11:37:48 11:37:48 11:37:48 11:37:48 11:37:48 11:37:48 12:21:26 12:23:57 12:23:57 12:26:44 12:26:44 12:26:44 12:26:44 12:26:44 12:28:37 12:28:37 12:28:37 12:28:37 12:28:37 12:33:06 12:33:06 12:33:06 12:33:06 12:33:06 12:33:06 12:33:06 12:33:06 12:33:06 12:33:06 12:33:16 12:34:00 12:34:00 12:34:00 12:34:00 12:40:06 12:40:06 12:42:19 12:45:38 12:45:38 12:45:38 12:45:38 12:45:38 12:45:38
Instrumento Financ./Security
Operación / Transaction
SAB SAB SAB SAB SAB SAB SAB SAB SAB SAB SAB SAB SAB SAB SAB SAB SAB SAB SAB SAB SAB SAB SAB SAB SAB SAB SAB SAB SAB SAB SAB SAB SAB SAB SAB SAB SAB SAB SAB SAB SAB SAB SAB SAB SAB SAB SAB SAB SAB SAB SAB
COMPRA / BUY COMPRA / BUY COMPRA / BUY COMPRA / BUY COMPRA / BUY COMPRA / BUY COMPRA / BUY COMPRA / BUY COMPRA / BUY COMPRA / BUY COMPRA / BUY COMPRA / BUY COMPRA / BUY COMPRA / BUY COMPRA / BUY COMPRA / BUY COMPRA / BUY COMPRA / BUY COMPRA / BUY COMPRA / BUY COMPRA / BUY COMPRA / BUY COMPRA / BUY COMPRA / BUY COMPRA / BUY COMPRA / BUY COMPRA / BUY COMPRA / BUY COMPRA / BUY COMPRA / BUY COMPRA / BUY COMPRA / BUY COMPRA / BUY COMPRA / BUY COMPRA / BUY COMPRA / BUY COMPRA / BUY COMPRA / BUY COMPRA / BUY COMPRA / BUY COMPRA / BUY COMPRA / BUY COMPRA / BUY COMPRA / BUY COMPRA / BUY COMPRA / BUY COMPRA / BUY COMPRA / BUY COMPRA / BUY COMPRA / BUY COMPRA / BUY
Pag. 17
Centro Negociación / Trading Venue CEUX CEUX CEUX CEUX CEUX CEUX CEUX CEUX CEUX CEUX CEUX CEUX CEUX CEUX XMAD XMAD XMAD XMAD XMAD XMAD XMAD XMAD XMAD XMAD XMAD XMAD XMAD XMAD XMAD XMAD XMAD XMAD XMAD XMAD XMAD XMAD XMAD XMAD XMAD XMAD XMAD XMAD XMAD XMAD CEUX CEUX CEUX CEUX CEUX CEUX CEUX
Nº Títulos / Nr. of Precio € / Price shares € 640 558 522 676 1.198 1.198 1.198 1.198 1.198 709 489 1.198 26 598 2.654 4.119 782 407 2.346 878 929 878 277 2.654 2.346 878 852 2.369 2.156 878 878 782 782 1.564 3.888 1.564 1.564 158 1.564 878 878 97 4.879 15.121 1.198 1.198 1.198 1.198 1.198 1.044 154
3,3770 3,3770 3,3770 3,3770 3,3770 3,3770 3,3770 3,3770 3,3770 3,3770 3,3770 3,3770 3,3770 3,3770 3,3900 3,3900 3,3900 3,3900 3,3900 3,3900 3,3900 3,3900 3,3900 3,3900 3,3900 3,3900 3,3900 3,3850 3,3850 3,3850 3,3850 3,3850 3,3850 3,3850 3,3850 3,3850 3,3850 3,3850 3,3850 3,3850 3,3850 3,3850 3,3800 3,3800 3,3770 3,3770 3,3770 3,3770 3,3770 3,3770 3,3770
Hora / Trade Fecha / Date Time 28/07/2026 28/07/2026 28/07/2026 28/07/2026 28/07/2026 28/07/2026 28/07/2026 28/07/2026 28/07/2026 28/07/2026 28/07/2026 28/07/2026 28/07/2026 28/07/2026 28/07/2026 28/07/2026 28/07/2026 28/07/2026 28/07/2026 28/07/2026 28/07/2026 28/07/2026 28/07/2026 28/07/2026 28/07/2026 28/07/2026 28/07/2026 28/07/2026 28/07/2026 28/07/2026 28/07/2026 28/07/2026 28/07/2026 28/07/2026 28/07/2026 28/07/2026 28/07/2026 28/07/2026 28/07/2026 28/07/2026 28/07/2026 28/07/2026 28/07/2026 28/07/2026 28/07/2026 28/07/2026 28/07/2026 28/07/2026 28/07/2026 28/07/2026 28/07/2026
12:45:38 12:45:38 12:45:38 12:45:38 12:45:38 12:45:38 12:45:38 12:45:38 12:45:38 12:45:48 12:45:48 12:45:48 12:45:50 12:45:50 12:45:50 12:45:50 12:45:50 12:45:50 12:45:50 12:45:50 12:45:50 12:45:50 12:45:50 12:45:50 12:45:50 12:45:50 12:45:50 12:45:50 12:45:50 12:45:50 12:45:50 12:45:50 12:45:50 12:45:50 12:45:50 12:46:06 12:46:06 12:46:06 12:47:01 12:47:01 12:47:01 12:47:01 12:47:01 12:47:01 12:47:01 12:47:01 12:47:01 12:47:01 12:47:01 12:47:01 12:47:58
Instrumento Financ./Security
Operación / Transaction
SAB SAB SAB SAB SAB SAB SAB SAB SAB SAB SAB SAB SAB SAB SAB SAB SAB SAB SAB SAB SAB SAB SAB SAB SAB SAB SAB SAB SAB SAB SAB SAB SAB SAB SAB SAB SAB SAB SAB SAB SAB SAB SAB SAB SAB SAB SAB SAB SAB SAB SAB
COMPRA / BUY COMPRA / BUY COMPRA / BUY COMPRA / BUY COMPRA / BUY COMPRA / BUY COMPRA / BUY COMPRA / BUY COMPRA / BUY COMPRA / BUY COMPRA / BUY COMPRA / BUY COMPRA / BUY COMPRA / BUY COMPRA / BUY COMPRA / BUY COMPRA / BUY COMPRA / BUY COMPRA / BUY COMPRA / BUY COMPRA / BUY COMPRA / BUY COMPRA / BUY COMPRA / BUY COMPRA / BUY COMPRA / BUY COMPRA / BUY COMPRA / BUY COMPRA / BUY COMPRA / BUY COMPRA / BUY COMPRA / BUY COMPRA / BUY COMPRA / BUY COMPRA / BUY COMPRA / BUY COMPRA / BUY COMPRA / BUY COMPRA / BUY COMPRA / BUY COMPRA / BUY COMPRA / BUY COMPRA / BUY COMPRA / BUY COMPRA / BUY COMPRA / BUY COMPRA / BUY COMPRA / BUY COMPRA / BUY COMPRA / BUY COMPRA / BUY
Pag. 18
Centro Negociación / Trading Venue CEUX CEUX CEUX CEUX CEUX CEUX CEUX CEUX CEUX XMAD XMAD XMAD XMAD XMAD XMAD XMAD XMAD XMAD CEUX CEUX CEUX CEUX CEUX CEUX CEUX CEUX CEUX CEUX CEUX CEUX CEUX CEUX CEUX CEUX CEUX XMAD XMAD XMAD CEUX CEUX CEUX CEUX CEUX CEUX CEUX CEUX CEUX CEUX CEUX CEUX CEUX
Nº Títulos / Nr. of Precio € / Price shares € 1.044 1.198 1.044 154 898 1.044 154 1.198 1.078 2.432 1.564 479 1.945 876 7.744 3.644 1.055 261 1.258 1.258 1.258 1.258 1.258 1.044 214 737 1.044 214 1.258 1.258 261 997 287 1.258 138 2.321 1.564 16.115 1.987 463 607 607 310 1.987 633 1.987 182 1.805 1.987 1.987 458
3,3770 3,3770 3,3770 3,3770 3,3770 3,3770 3,3770 3,3770 3,3770 3,3750 3,3750 3,3750 3,3750 3,3750 3,3750 3,3750 3,3750 3,3750 3,3730 3,3730 3,3730 3,3730 3,3730 3,3730 3,3730 3,3730 3,3730 3,3730 3,3730 3,3730 3,3730 3,3730 3,3730 3,3730 3,3730 3,3700 3,3700 3,3700 3,3670 3,3670 3,3670 3,3670 3,3670 3,3670 3,3670 3,3670 3,3670 3,3670 3,3670 3,3670 3,3670
Hora / Trade Fecha / Date Time 28/07/2026 28/07/2026 28/07/2026 28/07/2026 28/07/2026 28/07/2026 28/07/2026 28/07/2026 28/07/2026 28/07/2026 28/07/2026 28/07/2026 28/07/2026 28/07/2026 28/07/2026 28/07/2026 28/07/2026 28/07/2026 28/07/2026 28/07/2026 28/07/2026 28/07/2026 28/07/2026 28/07/2026 28/07/2026 28/07/2026 28/07/2026 28/07/2026 28/07/2026 28/07/2026 28/07/2026 28/07/2026 28/07/2026 28/07/2026 28/07/2026 28/07/2026 28/07/2026 28/07/2026 28/07/2026 28/07/2026 28/07/2026 28/07/2026 28/07/2026 28/07/2026 28/07/2026 28/07/2026 28/07/2026 28/07/2026 28/07/2026 28/07/2026 28/07/2026
12:48:08 12:48:58 12:48:58 12:48:58 12:48:58 12:48:58 12:48:58 12:59:56 12:59:56 12:59:56 12:59:56 12:59:56 12:59:56 12:59:56 12:59:56 12:59:56 12:59:56 12:59:56 13:08:07 13:08:07 13:08:07 13:08:07 13:08:07 13:08:07 13:08:07 13:08:07 13:08:07 13:08:07 13:08:07 13:08:07 13:13:02 13:13:34 13:16:03 13:16:03 13:16:07 13:16:07 13:16:07 13:16:07 13:16:07 13:16:07 13:16:07 13:16:07 13:16:07 13:16:07 13:16:07 13:16:07 13:16:07 13:16:07 13:16:47 13:20:34 13:21:15
Instrumento Financ./Security
Operación / Transaction
SAB SAB SAB SAB SAB SAB SAB SAB SAB SAB SAB SAB SAB SAB SAB SAB SAB SAB SAB SAB SAB SAB SAB SAB SAB SAB SAB SAB SAB SAB SAB SAB SAB SAB SAB SAB SAB SAB SAB SAB SAB SAB SAB SAB SAB SAB SAB SAB SAB SAB SAB
COMPRA / BUY COMPRA / BUY COMPRA / BUY COMPRA / BUY COMPRA / BUY COMPRA / BUY COMPRA / BUY COMPRA / BUY COMPRA / BUY COMPRA / BUY COMPRA / BUY COMPRA / BUY COMPRA / BUY COMPRA / BUY COMPRA / BUY COMPRA / BUY COMPRA / BUY COMPRA / BUY COMPRA / BUY COMPRA / BUY COMPRA / BUY COMPRA / BUY COMPRA / BUY COMPRA / BUY COMPRA / BUY COMPRA / BUY COMPRA / BUY COMPRA / BUY COMPRA / BUY COMPRA / BUY COMPRA / BUY COMPRA / BUY COMPRA / BUY COMPRA / BUY COMPRA / BUY COMPRA / BUY COMPRA / BUY COMPRA / BUY COMPRA / BUY COMPRA / BUY COMPRA / BUY COMPRA / BUY COMPRA / BUY COMPRA / BUY COMPRA / BUY COMPRA / BUY COMPRA / BUY COMPRA / BUY COMPRA / BUY COMPRA / BUY COMPRA / BUY
Pag. 19
Centro Negociación / Trading Venue XMAD XMAD XMAD XMAD XMAD XMAD XMAD CEUX CEUX CEUX CEUX CEUX CEUX CEUX CEUX CEUX CEUX CEUX XMAD XMAD XMAD XMAD XMAD XMAD XMAD XMAD XMAD XMAD XMAD XMAD XMAD XMAD CEUX CEUX CEUX CEUX CEUX CEUX CEUX CEUX CEUX CEUX CEUX CEUX CEUX CEUX CEUX CEUX CEUX CEUX XMAD
Nº Títulos / Nr. of Precio € / Price shares € 2.147 2.147 5.758 2.147 6.441 683 677 1.876 1.876 1.876 1.876 1.827 49 1.778 1.827 49 212 1.754 2.258 1.564 5.740 1.564 782 1.640 1.133 878 878 1.355 247 1.961 1.512 700 1.482 261 133 1.825 51 1.776 938 51 887 145 938 363 575 1 1.875 1 1.876 1.822 664
3,3650 3,3650 3,3650 3,3650 3,3650 3,3650 3,3650 3,3630 3,3630 3,3630 3,3630 3,3630 3,3630 3,3630 3,3630 3,3630 3,3630 3,3630 3,3600 3,3600 3,3600 3,3600 3,3600 3,3600 3,3600 3,3600 3,3600 3,3600 3,3600 3,3600 3,3550 3,3550 3,3620 3,3620 3,3620 3,3620 3,3620 3,3620 3,3620 3,3620 3,3620 3,3620 3,3620 3,3620 3,3620 3,3620 3,3620 3,3620 3,3620 3,3620 3,3600
Hora / Trade Fecha / Date Time 28/07/2026 28/07/2026 28/07/2026 28/07/2026 28/07/2026 28/07/2026 28/07/2026 28/07/2026 28/07/2026 28/07/2026 28/07/2026 28/07/2026 28/07/2026 28/07/2026 28/07/2026 28/07/2026 28/07/2026 28/07/2026 28/07/2026 28/07/2026 28/07/2026 28/07/2026 28/07/2026 28/07/2026 28/07/2026 28/07/2026 28/07/2026 28/07/2026 28/07/2026 28/07/2026 28/07/2026 28/07/2026 28/07/2026 28/07/2026 28/07/2026 28/07/2026 28/07/2026 28/07/2026 28/07/2026 28/07/2026 28/07/2026 28/07/2026 28/07/2026 28/07/2026 28/07/2026 28/07/2026 28/07/2026 28/07/2026 28/07/2026 28/07/2026 28/07/2026
13:21:15 13:21:15 13:21:15 13:21:15 13:21:15 13:21:15 13:25:06 13:25:06 13:25:49 13:25:49 13:25:49 13:25:49 13:26:14 13:26:14 13:26:14 13:26:14 13:26:14 13:26:14 13:26:14 13:26:14 13:26:14 13:26:14 13:26:14 13:27:02 13:27:02 13:30:00 13:30:00 13:30:00 13:30:00 13:30:00 13:30:00 13:30:00 13:30:00 13:30:00 13:30:00 13:30:00 13:30:00 13:30:00 13:30:00 13:30:00 13:30:00 13:30:00 13:30:00 13:30:00 13:30:00 13:30:00 13:30:00 13:30:00 13:30:00 13:30:00 13:30:00
Instrumento Financ./Security
Operación / Transaction
SAB SAB SAB SAB SAB SAB SAB SAB SAB SAB SAB SAB SAB SAB SAB SAB SAB SAB SAB SAB SAB SAB SAB SAB SAB SAB SAB SAB SAB SAB SAB SAB SAB SAB SAB SAB SAB SAB SAB SAB SAB SAB SAB SAB SAB SAB SAB SAB SAB SAB SAB
COMPRA / BUY COMPRA / BUY COMPRA / BUY COMPRA / BUY COMPRA / BUY COMPRA / BUY COMPRA / BUY COMPRA / BUY COMPRA / BUY COMPRA / BUY COMPRA / BUY COMPRA / BUY COMPRA / BUY COMPRA / BUY COMPRA / BUY COMPRA / BUY COMPRA / BUY COMPRA / BUY COMPRA / BUY COMPRA / BUY COMPRA / BUY COMPRA / BUY COMPRA / BUY COMPRA / BUY COMPRA / BUY COMPRA / BUY COMPRA / BUY COMPRA / BUY COMPRA / BUY COMPRA / BUY COMPRA / BUY COMPRA / BUY COMPRA / BUY COMPRA / BUY COMPRA / BUY COMPRA / BUY COMPRA / BUY COMPRA / BUY COMPRA / BUY COMPRA / BUY COMPRA / BUY COMPRA / BUY COMPRA / BUY COMPRA / BUY COMPRA / BUY COMPRA / BUY COMPRA / BUY COMPRA / BUY COMPRA / BUY COMPRA / BUY COMPRA / BUY
Pag. 20
Centro Negociación / Trading Venue XMAD XMAD XMAD XMAD XMAD XMAD CEUX CEUX CEUX CEUX CEUX CEUX CEUX CEUX CEUX CEUX CEUX CEUX CEUX CEUX CEUX CEUX CEUX XMAD XMAD XMAD XMAD XMAD XMAD XMAD XMAD XMAD XMAD XMAD XMAD XMAD XMAD XMAD XMAD XMAD XMAD XMAD XMAD XMAD XMAD XMAD XMAD XMAD XMAD XMAD XMAD
Nº Títulos / Nr. of Precio € / Price shares € 5.740 3.128 7.569 2.067 2.876 5.744 255 257 1.305 170 1.158 170 1.817 1.987 1.987 1.987 1.547 422 18 1.969 1.987 1.987 977 2.321 2.321 2.321 2.321 2.100 221 2.100 2.321 1.984 558 1.788 533 1.813 508 1.056 1.265 1.418 878 25 2.296 25 853 1.468 96 2.225 1.361 960 604
3,3600 3,3600 3,3600 3,3600 3,3600 3,3600 3,3570 3,3570 3,3570 3,3570 3,3570 3,3570 3,3570 3,3570 3,3570 3,3570 3,3570 3,3570 3,3570 3,3570 3,3570 3,3570 3,3570 3,3550 3,3550 3,3550 3,3550 3,3550 3,3550 3,3550 3,3550 3,3550 3,3550 3,3550 3,3550 3,3550 3,3550 3,3550 3,3550 3,3550 3,3550 3,3550 3,3550 3,3550 3,3550 3,3550 3,3550 3,3550 3,3550 3,3550 3,3550
Hora / Trade Fecha / Date Time 28/07/2026 28/07/2026 28/07/2026 28/07/2026 28/07/2026 28/07/2026 28/07/2026 28/07/2026 28/07/2026 28/07/2026 28/07/2026 28/07/2026 28/07/2026 28/07/2026 28/07/2026 28/07/2026 28/07/2026 28/07/2026 28/07/2026 28/07/2026 28/07/2026 28/07/2026 28/07/2026 28/07/2026 28/07/2026 28/07/2026 28/07/2026 28/07/2026 28/07/2026 28/07/2026 28/07/2026 28/07/2026 28/07/2026 28/07/2026 28/07/2026 28/07/2026 28/07/2026 28/07/2026 28/07/2026 28/07/2026 28/07/2026 28/07/2026 28/07/2026 28/07/2026 28/07/2026 28/07/2026 28/07/2026 28/07/2026 28/07/2026 28/07/2026 28/07/2026
13:30:00 13:30:00 13:30:00 13:30:00 13:30:00 13:30:00 13:30:00 13:30:00 13:30:00 13:30:00 13:30:00 13:30:00 13:30:34 13:31:26 13:31:26 13:31:26 13:31:26 13:31:26 13:31:26 13:31:26 13:31:26 13:31:26 13:31:32 13:31:32 13:31:32 13:31:32 13:39:15 13:39:15 13:39:15 13:39:15 13:39:15 13:39:15 13:39:15 13:39:15 13:39:15 13:39:15 13:39:15 13:39:15 13:39:15 13:39:29 13:39:44 13:39:44 13:40:49 13:40:49 13:40:49 13:40:49 13:40:49 13:40:49 13:40:50 13:40:50 13:40:50
Instrumento Financ./Security
Operación / Transaction
SAB SAB SAB SAB SAB SAB SAB SAB SAB SAB SAB SAB SAB SAB SAB SAB SAB SAB SAB SAB SAB SAB SAB SAB SAB SAB SAB SAB SAB SAB SAB SAB SAB SAB SAB SAB SAB SAB SAB SAB SAB SAB SAB SAB SAB SAB SAB SAB SAB SAB SAB
COMPRA / BUY COMPRA / BUY COMPRA / BUY COMPRA / BUY COMPRA / BUY COMPRA / BUY COMPRA / BUY COMPRA / BUY COMPRA / BUY COMPRA / BUY COMPRA / BUY COMPRA / BUY COMPRA / BUY COMPRA / BUY COMPRA / BUY COMPRA / BUY COMPRA / BUY COMPRA / BUY COMPRA / BUY COMPRA / BUY COMPRA / BUY COMPRA / BUY COMPRA / BUY COMPRA / BUY COMPRA / BUY COMPRA / BUY COMPRA / BUY COMPRA / BUY COMPRA / BUY COMPRA / BUY COMPRA / BUY COMPRA / BUY COMPRA / BUY COMPRA / BUY COMPRA / BUY COMPRA / BUY COMPRA / BUY COMPRA / BUY COMPRA / BUY COMPRA / BUY COMPRA / BUY COMPRA / BUY COMPRA / BUY COMPRA / BUY COMPRA / BUY COMPRA / BUY COMPRA / BUY COMPRA / BUY COMPRA / BUY COMPRA / BUY COMPRA / BUY
Pag. 21
Centro Negociación / Trading Venue XMAD XMAD XMAD XMAD XMAD XMAD XMAD XMAD XMAD XMAD XMAD XMAD CEUX CEUX CEUX CEUX CEUX CEUX CEUX CEUX CEUX CEUX CEUX CEUX CEUX CEUX XMAD XMAD XMAD XMAD XMAD XMAD XMAD XMAD XMAD XMAD XMAD XMAD XMAD XMAD XMAD XMAD CEUX CEUX CEUX CEUX CEUX CEUX CEUX CEUX CEUX
Nº Títulos / Nr. of Precio € / Price shares € 1.717 604 1.564 2.321 2.321 153 629 1.692 629 2.148 1.865 1.617 1.321 966 355 1.321 223 783 538 783 538 128 261 1.060 115 1.060 1.564 1.281 2.321 2.321 878 878 2.175 2.175 3.910 757 639 639 639 712 2.321 1.790 261 820 501 1.321 407 504 410 261 1.060
3,3550 3,3550 3,3550 3,3550 3,3550 3,3550 3,3550 3,3550 3,3550 3,3550 3,3550 3,3550 3,3530 3,3530 3,3530 3,3530 3,3530 3,3530 3,3530 3,3530 3,3530 3,3530 3,3530 3,3530 3,3530 3,3530 3,3550 3,3550 3,3550 3,3550 3,3550 3,3550 3,3550 3,3550 3,3550 3,3550 3,3550 3,3550 3,3550 3,3550 3,3550 3,3550 3,3530 3,3530 3,3530 3,3530 3,3530 3,3530 3,3530 3,3530 3,3530
Hora / Trade Fecha / Date Time 28/07/2026 28/07/2026 28/07/2026 28/07/2026 28/07/2026 28/07/2026 28/07/2026 28/07/2026 28/07/2026 28/07/2026 28/07/2026 28/07/2026 28/07/2026 28/07/2026 28/07/2026 28/07/2026 28/07/2026 28/07/2026 28/07/2026 28/07/2026 28/07/2026 28/07/2026 28/07/2026 28/07/2026 28/07/2026 28/07/2026 28/07/2026 28/07/2026 28/07/2026 28/07/2026 28/07/2026 28/07/2026 28/07/2026 28/07/2026 28/07/2026 28/07/2026 28/07/2026 28/07/2026 28/07/2026 28/07/2026 28/07/2026 28/07/2026 28/07/2026 28/07/2026 28/07/2026 28/07/2026 28/07/2026 28/07/2026 28/07/2026 28/07/2026 28/07/2026
13:40:50 13:40:50 13:40:50 13:40:50 13:40:50 13:40:50 13:40:50 13:44:55 13:44:55 13:44:55 13:44:55 13:44:55 13:44:55 13:44:55 13:44:55 13:44:55 13:44:55 13:44:55 13:44:55 13:44:55 13:44:55 13:44:55 13:49:29 13:49:29 13:49:29 13:49:29 13:49:29 13:49:29 13:49:29 13:49:30 13:49:30 13:49:30 13:49:30 13:49:30 13:49:30 13:49:30 13:49:30 13:49:30 13:49:30 14:06:45 14:06:45 14:06:50 14:06:50 14:06:50 14:06:50 14:06:50 14:06:50 14:06:52 14:06:52 14:06:52 14:06:52
Instrumento Financ./Security
Operación / Transaction
SAB SAB SAB SAB SAB SAB SAB SAB SAB SAB SAB SAB SAB SAB SAB SAB SAB SAB SAB SAB SAB SAB SAB SAB SAB SAB SAB SAB SAB SAB SAB SAB SAB SAB SAB SAB SAB SAB SAB SAB SAB SAB SAB SAB SAB SAB SAB SAB SAB SAB SAB
COMPRA / BUY COMPRA / BUY COMPRA / BUY COMPRA / BUY COMPRA / BUY COMPRA / BUY COMPRA / BUY COMPRA / BUY COMPRA / BUY COMPRA / BUY COMPRA / BUY COMPRA / BUY COMPRA / BUY COMPRA / BUY COMPRA / BUY COMPRA / BUY COMPRA / BUY COMPRA / BUY COMPRA / BUY COMPRA / BUY COMPRA / BUY COMPRA / BUY COMPRA / BUY COMPRA / BUY COMPRA / BUY COMPRA / BUY COMPRA / BUY COMPRA / BUY COMPRA / BUY COMPRA / BUY COMPRA / BUY COMPRA / BUY COMPRA / BUY COMPRA / BUY COMPRA / BUY COMPRA / BUY COMPRA / BUY COMPRA / BUY COMPRA / BUY COMPRA / BUY COMPRA / BUY COMPRA / BUY COMPRA / BUY COMPRA / BUY COMPRA / BUY COMPRA / BUY COMPRA / BUY COMPRA / BUY COMPRA / BUY COMPRA / BUY COMPRA / BUY
Pag. 22
Centro Negociación / Trading Venue CEUX CEUX CEUX CEUX CEUX CEUX CEUX XMAD XMAD XMAD XMAD XMAD XMAD XMAD XMAD XMAD XMAD XMAD XMAD XMAD XMAD XMAD XMAD XMAD XMAD XMAD XMAD XMAD XMAD XMAD XMAD XMAD XMAD XMAD XMAD XMAD XMAD XMAD XMAD CEUX CEUX CEUX CEUX CEUX CEUX CEUX CEUX CEUX CEUX CEUX CEUX
Nº Títulos / Nr. of Precio € / Price shares € 261 1.321 1.321 1.044 277 120 659 2.321 61 3.360 2.320 1.221 1 2.321 2.321 1.564 2.175 878 878 2.222 1.564 1.793 5.500 1.500 61 1.564 2.604 1.686 1.011 1.564 2.175 878 878 782 782 1.564 661 1.112 678 1.321 1.321 626 695 522 695 104 414 292 568 461 568
3,3530 3,3530 3,3530 3,3530 3,3530 3,3530 3,3530 3,3520 3,3520 3,3520 3,3520 3,3520 3,3520 3,3520 3,3520 3,3520 3,3520 3,3520 3,3520 3,3520 3,3520 3,3520 3,3520 3,3520 3,3520 3,3520 3,3520 3,3520 3,3520 3,3520 3,3520 3,3520 3,3520 3,3520 3,3520 3,3520 3,3520 3,3520 3,3520 3,3530 3,3530 3,3530 3,3530 3,3530 3,3530 3,3530 3,3530 3,3530 3,3530 3,3530 3,3530
Hora / Trade Fecha / Date Time 28/07/2026 28/07/2026 28/07/2026 28/07/2026 28/07/2026 28/07/2026 28/07/2026 28/07/2026 28/07/2026 28/07/2026 28/07/2026 28/07/2026 28/07/2026 28/07/2026 28/07/2026 28/07/2026 28/07/2026 28/07/2026 28/07/2026 28/07/2026 28/07/2026 28/07/2026 28/07/2026 28/07/2026 28/07/2026 28/07/2026 28/07/2026 28/07/2026 28/07/2026 28/07/2026 28/07/2026 28/07/2026 28/07/2026 28/07/2026 28/07/2026 28/07/2026 28/07/2026 28/07/2026 28/07/2026 28/07/2026 28/07/2026 28/07/2026 28/07/2026 28/07/2026 28/07/2026 28/07/2026 28/07/2026 28/07/2026 28/07/2026 28/07/2026 28/07/2026
14:06:52 14:06:52 14:06:52 14:06:52 14:06:52 14:06:52 14:06:52 14:06:52 14:06:53 14:06:53 14:06:58 14:06:58 14:06:58 14:06:58 14:08:34 14:08:52 14:08:52 14:09:40 14:10:20 14:10:20 14:10:20 14:10:20 14:10:20 14:10:20 14:10:20 14:10:20 14:34:08 14:34:08 14:34:08 14:34:08 14:34:08 14:34:08 14:34:08 14:34:08 14:34:08 14:35:03 14:35:03 14:35:03 14:42:36 14:42:36 14:42:36 14:42:36 14:42:36 14:42:36 14:42:36 14:42:36 14:42:36 14:42:36 14:42:36 14:42:47 14:43:37
Instrumento Financ./Security
Operación / Transaction
SAB SAB SAB SAB SAB SAB SAB SAB SAB SAB SAB SAB SAB SAB SAB SAB SAB SAB SAB SAB SAB SAB SAB SAB SAB SAB SAB SAB SAB SAB SAB SAB SAB SAB SAB SAB SAB SAB SAB SAB SAB SAB SAB SAB SAB SAB SAB SAB SAB SAB SAB
COMPRA / BUY COMPRA / BUY COMPRA / BUY COMPRA / BUY COMPRA / BUY COMPRA / BUY COMPRA / BUY COMPRA / BUY COMPRA / BUY COMPRA / BUY COMPRA / BUY COMPRA / BUY COMPRA / BUY COMPRA / BUY COMPRA / BUY COMPRA / BUY COMPRA / BUY COMPRA / BUY COMPRA / BUY COMPRA / BUY COMPRA / BUY COMPRA / BUY COMPRA / BUY COMPRA / BUY COMPRA / BUY COMPRA / BUY COMPRA / BUY COMPRA / BUY COMPRA / BUY COMPRA / BUY COMPRA / BUY COMPRA / BUY COMPRA / BUY COMPRA / BUY COMPRA / BUY COMPRA / BUY COMPRA / BUY COMPRA / BUY COMPRA / BUY COMPRA / BUY COMPRA / BUY COMPRA / BUY COMPRA / BUY COMPRA / BUY COMPRA / BUY COMPRA / BUY COMPRA / BUY COMPRA / BUY COMPRA / BUY COMPRA / BUY COMPRA / BUY
Pag. 23
Centro Negociación / Trading Venue CEUX CEUX CEUX CEUX CEUX CEUX CEUX CEUX CEUX CEUX CEUX CEUX CEUX CEUX XMAD XMAD XMAD XMAD XMAD XMAD XMAD XMAD XMAD XMAD XMAD XMAD XMAD XMAD XMAD XMAD XMAD XMAD XMAD XMAD XMAD XMAD XMAD XMAD CEUX XMAD XMAD XMAD XMAD XMAD XMAD CEUX CEUX CEUX CEUX CEUX CEUX
Nº Títulos / Nr. of Precio € / Price shares € 461 860 461 283 577 744 1.014 307 1.321 1.321 1.321 1.321 1.321 1.101 2.321 99 8.872 5.459 222 878 878 1.671 1.817 1.817 782 184 1.564 8.952 1.564 12.920 5.097 5.680 878 2.293 2.299 2.321 6.278 154 522 2.355 20.919 1.611 5.073 1.564 3.478 799 1.321 1.321 196 1.321 1.321
3,3530 3,3530 3,3530 3,3530 3,3530 3,3530 3,3530 3,3530 3,3530 3,3530 3,3530 3,3530 3,3530 3,3530 3,3520 3,3520 3,3520 3,3520 3,3520 3,3520 3,3520 3,3520 3,3520 3,3520 3,3520 3,3520 3,3520 3,3520 3,3520 3,3520 3,3510 3,3510 3,3510 3,3510 3,3510 3,3510 3,3510 3,3510 3,3490 3,3500 3,3500 3,3500 3,3500 3,3500 3,3500 3,3490 3,3490 3,3490 3,3490 3,3490 3,3490
Hora / Trade Fecha / Date Time 28/07/2026 28/07/2026 28/07/2026 28/07/2026 28/07/2026 28/07/2026 28/07/2026 28/07/2026 28/07/2026 28/07/2026 28/07/2026 28/07/2026 28/07/2026 28/07/2026 28/07/2026 28/07/2026 28/07/2026 28/07/2026 28/07/2026 28/07/2026 28/07/2026 28/07/2026 28/07/2026 28/07/2026 28/07/2026 28/07/2026 28/07/2026 28/07/2026 28/07/2026 28/07/2026 28/07/2026 28/07/2026 28/07/2026 28/07/2026 28/07/2026 28/07/2026 28/07/2026 28/07/2026 28/07/2026 28/07/2026 28/07/2026 28/07/2026 28/07/2026 28/07/2026 28/07/2026 28/07/2026 28/07/2026 28/07/2026 28/07/2026 28/07/2026 28/07/2026
14:43:37 14:43:37 14:43:37 14:43:37 14:43:37 14:43:37 14:43:37 14:43:37 14:43:37 14:43:37 14:43:37 14:43:37 14:43:37 14:43:37 14:43:37 14:43:37 14:43:39 14:43:58 14:43:58 14:44:11 14:44:11 14:44:11 14:44:11 14:44:11 14:44:11 14:44:11 14:44:11 14:44:11 14:44:11 14:44:11 14:44:11 14:44:11 14:44:11 14:44:11 14:44:11 14:44:30 14:44:30 14:44:39 14:44:39 14:44:39 14:44:39 14:44:39 14:44:39 14:44:40 14:44:40 14:44:40 14:44:40 14:44:41 14:44:41 14:44:47 14:45:22
Instrumento Financ./Security
Operación / Transaction
SAB SAB SAB SAB SAB SAB SAB SAB SAB SAB SAB SAB SAB SAB SAB SAB SAB SAB SAB SAB SAB SAB SAB SAB SAB SAB SAB SAB SAB SAB SAB SAB SAB SAB SAB SAB SAB SAB SAB SAB SAB SAB SAB SAB SAB SAB SAB SAB SAB SAB SAB
COMPRA / BUY COMPRA / BUY COMPRA / BUY COMPRA / BUY COMPRA / BUY COMPRA / BUY COMPRA / BUY COMPRA / BUY COMPRA / BUY COMPRA / BUY COMPRA / BUY COMPRA / BUY COMPRA / BUY COMPRA / BUY COMPRA / BUY COMPRA / BUY COMPRA / BUY COMPRA / BUY COMPRA / BUY COMPRA / BUY COMPRA / BUY COMPRA / BUY COMPRA / BUY COMPRA / BUY COMPRA / BUY COMPRA / BUY COMPRA / BUY COMPRA / BUY COMPRA / BUY COMPRA / BUY COMPRA / BUY COMPRA / BUY COMPRA / BUY COMPRA / BUY COMPRA / BUY COMPRA / BUY COMPRA / BUY COMPRA / BUY COMPRA / BUY COMPRA / BUY COMPRA / BUY COMPRA / BUY COMPRA / BUY COMPRA / BUY COMPRA / BUY COMPRA / BUY COMPRA / BUY COMPRA / BUY COMPRA / BUY COMPRA / BUY COMPRA / BUY
Pag. 24
Centro Negociación / Trading Venue CEUX CEUX CEUX CEUX CEUX CEUX CEUX CEUX CEUX CEUX CEUX CEUX CEUX CEUX CEUX CEUX XMAD XMAD XMAD XMAD XMAD XMAD XMAD XMAD XMAD XMAD XMAD XMAD XMAD XMAD XMAD XMAD XMAD XMAD XMAD CEUX CEUX CEUX CEUX CEUX CEUX CEUX CEUX CEUX CEUX CEUX CEUX CEUX CEUX XMAD XMAD
Nº Títulos / Nr. of Precio € / Price shares € 1.321 1.321 1.321 612 709 612 1.321 709 612 709 1.321 709 612 97 612 601 1.909 310 1.564 655 3.448 990 1.112 1.107 782 3.684 1.437 782 2.191 878 878 2.045 1.058 2.219 2.951 187 1.689 1.876 1.876 1.876 1.876 1.876 1.252 624 1.876 1.876 1.109 767 1.240 4.048 1.260
3,3490 3,3490 3,3490 3,3490 3,3490 3,3490 3,3490 3,3490 3,3490 3,3490 3,3490 3,3490 3,3490 3,3490 3,3490 3,3490 3,3480 3,3480 3,3480 3,3480 3,3480 3,3480 3,3480 3,3480 3,3480 3,3480 3,3480 3,3480 3,3480 3,3480 3,3480 3,3480 3,3480 3,3480 3,3480 3,3470 3,3470 3,3470 3,3470 3,3470 3,3470 3,3470 3,3470 3,3470 3,3470 3,3470 3,3470 3,3470 3,3470 3,3460 3,3460
Hora / Trade Fecha / Date Time 28/07/2026 28/07/2026 28/07/2026 28/07/2026 28/07/2026 28/07/2026 28/07/2026 28/07/2026 28/07/2026 28/07/2026 28/07/2026 28/07/2026 28/07/2026 28/07/2026 28/07/2026 28/07/2026 28/07/2026 28/07/2026 28/07/2026 28/07/2026 28/07/2026 28/07/2026 28/07/2026 28/07/2026 28/07/2026 28/07/2026 28/07/2026 28/07/2026 28/07/2026 28/07/2026 28/07/2026 28/07/2026 28/07/2026 28/07/2026 28/07/2026 28/07/2026 28/07/2026 28/07/2026 28/07/2026 28/07/2026 28/07/2026 28/07/2026 28/07/2026 28/07/2026 28/07/2026 28/07/2026 28/07/2026 28/07/2026 28/07/2026 28/07/2026 28/07/2026
14:45:22 14:45:22 14:45:22 14:45:22 14:45:22 14:45:22 14:45:22 14:45:22 14:45:22 14:45:22 14:45:22 14:45:22 14:45:22 14:45:22 14:45:22 14:45:22 14:45:22 14:45:22 14:45:43 14:45:43 14:48:59 14:53:51 14:53:51 14:53:51 14:53:51 15:00:52 15:03:12 15:03:12 15:03:12 15:03:12 15:03:12 15:03:12 15:07:38 15:07:38 15:07:38 15:07:38 15:07:38 15:07:38 15:07:38 15:07:38 15:07:38 15:07:38 15:07:38 15:07:38 15:15:34 15:15:34 15:15:34 15:15:34 15:15:34 15:15:34 15:15:34
Instrumento Financ./Security
Operación / Transaction
SAB SAB SAB SAB SAB SAB SAB SAB SAB SAB SAB SAB SAB SAB SAB SAB SAB SAB SAB SAB SAB SAB SAB SAB SAB SAB SAB SAB SAB SAB SAB SAB SAB SAB SAB SAB SAB SAB SAB SAB SAB SAB SAB SAB SAB SAB SAB SAB SAB SAB SAB
COMPRA / BUY COMPRA / BUY COMPRA / BUY COMPRA / BUY COMPRA / BUY COMPRA / BUY COMPRA / BUY COMPRA / BUY COMPRA / BUY COMPRA / BUY COMPRA / BUY COMPRA / BUY COMPRA / BUY COMPRA / BUY COMPRA / BUY COMPRA / BUY COMPRA / BUY COMPRA / BUY COMPRA / BUY COMPRA / BUY COMPRA / BUY COMPRA / BUY COMPRA / BUY COMPRA / BUY COMPRA / BUY COMPRA / BUY COMPRA / BUY COMPRA / BUY COMPRA / BUY COMPRA / BUY COMPRA / BUY COMPRA / BUY COMPRA / BUY COMPRA / BUY COMPRA / BUY COMPRA / BUY COMPRA / BUY COMPRA / BUY COMPRA / BUY COMPRA / BUY COMPRA / BUY COMPRA / BUY COMPRA / BUY COMPRA / BUY COMPRA / BUY COMPRA / BUY COMPRA / BUY COMPRA / BUY COMPRA / BUY COMPRA / BUY COMPRA / BUY
Pag. 25
Centro Negociación / Trading Venue XMAD XMAD XMAD XMAD XMAD XMAD XMAD XMAD XMAD XMAD XMAD XMAD XMAD XMAD XMAD XMAD XMAD XMAD XMAD XMAD XMAD XMAD XMAD XMAD XMAD XMAD XMAD XMAD XMAD XMAD XMAD XMAD XMAD XMAD XMAD XMAD XMAD XMAD XMAD XMAD XMAD XMAD XMAD XMAD XMAD XMAD XMAD XMAD XMAD XMAD XMAD
Nº Títulos / Nr. of Precio € / Price shares € 2.736 2.572 1.564 2.508 878 878 1.090 782 1.564 1.044 1.352 782 828 1.329 1.325 2.654 782 24 2.198 3.338 200 858 3.375 878 878 8.053 2.569 3.101 2.346 3.910 878 2.418 2.654 2.346 308 2.346 2.654 1.564 2.962 2.962 2.863 1.564 2.038 739 1.564 634 2.296 878 1.564 1.564 4.841
3,3460 3,3460 3,3460 3,3460 3,3460 3,3460 3,3460 3,3460 3,3460 3,3460 3,3460 3,3460 3,3460 3,3460 3,3460 3,3460 3,3460 3,3460 3,3440 3,3440 3,3440 3,3460 3,3460 3,3460 3,3460 3,3460 3,3460 3,3460 3,3460 3,3460 3,3460 3,3460 3,3460 3,3460 3,3460 3,3460 3,3460 3,3460 3,3460 3,3460 3,3460 3,3460 3,3460 3,3460 3,3460 3,3460 3,3460 3,3460 3,3460 3,3460 3,3460
Hora / Trade Fecha / Date Time 28/07/2026 28/07/2026 28/07/2026 28/07/2026 28/07/2026 28/07/2026 28/07/2026 28/07/2026 28/07/2026 28/07/2026 28/07/2026 28/07/2026 28/07/2026 28/07/2026 28/07/2026 28/07/2026 28/07/2026 28/07/2026 28/07/2026 28/07/2026 28/07/2026 28/07/2026 28/07/2026 28/07/2026 28/07/2026 28/07/2026 28/07/2026 28/07/2026 28/07/2026 28/07/2026 28/07/2026 28/07/2026 28/07/2026 28/07/2026 28/07/2026 28/07/2026 28/07/2026 28/07/2026 28/07/2026 28/07/2026 28/07/2026 28/07/2026 28/07/2026 28/07/2026 28/07/2026 28/07/2026 28/07/2026 28/07/2026 28/07/2026 28/07/2026 28/07/2026
15:15:34 15:15:34 15:15:34 15:16:21 15:16:22 15:19:20 15:19:20 15:19:20 15:19:20 15:19:20 15:19:20 15:19:20 15:19:20 15:19:20 15:19:20 15:19:20 15:19:20 15:19:20 15:19:20 15:19:20 15:19:20 15:19:20 15:19:52 15:19:52 15:19:52 15:19:52 15:19:52 15:19:52 15:19:52 15:19:52 15:19:52 15:19:52 15:19:52 15:19:52 15:19:52 15:19:52 15:20:28 15:20:28 15:20:43 15:20:43 15:20:43 15:20:43 15:20:43 15:20:43 15:20:43 15:20:43 15:20:43 15:20:43 15:20:43 15:20:43 15:20:53
Instrumento Financ./Security
Operación / Transaction
SAB SAB SAB SAB SAB SAB SAB SAB SAB SAB SAB SAB SAB SAB SAB SAB SAB SAB SAB SAB SAB SAB SAB SAB SAB SAB SAB SAB SAB SAB SAB SAB SAB SAB SAB SAB SAB SAB SAB SAB SAB SAB SAB SAB SAB SAB SAB SAB SAB SAB SAB
COMPRA / BUY COMPRA / BUY COMPRA / BUY COMPRA / BUY COMPRA / BUY COMPRA / BUY COMPRA / BUY COMPRA / BUY COMPRA / BUY COMPRA / BUY COMPRA / BUY COMPRA / BUY COMPRA / BUY COMPRA / BUY COMPRA / BUY COMPRA / BUY COMPRA / BUY COMPRA / BUY COMPRA / BUY COMPRA / BUY COMPRA / BUY COMPRA / BUY COMPRA / BUY COMPRA / BUY COMPRA / BUY COMPRA / BUY COMPRA / BUY COMPRA / BUY COMPRA / BUY COMPRA / BUY COMPRA / BUY COMPRA / BUY COMPRA / BUY COMPRA / BUY COMPRA / BUY COMPRA / BUY COMPRA / BUY COMPRA / BUY COMPRA / BUY COMPRA / BUY COMPRA / BUY COMPRA / BUY COMPRA / BUY COMPRA / BUY COMPRA / BUY COMPRA / BUY COMPRA / BUY COMPRA / BUY COMPRA / BUY COMPRA / BUY COMPRA / BUY
Pag. 26
Centro Negociación / Trading Venue XMAD XMAD XMAD XMAD XMAD XMAD XMAD XMAD XMAD XMAD XMAD XMAD XMAD XMAD XMAD XMAD XMAD XMAD XMAD XMAD XMAD XMAD CEUX CEUX CEUX CEUX CEUX CEUX CEUX CEUX CEUX CEUX CEUX CEUX CEUX CEUX CEUX CEUX XMAD XMAD XMAD XMAD XMAD XMAD XMAD XMAD XMAD XMAD XMAD XMAD XMAD
Nº Títulos / Nr. of Precio € / Price shares € 1.564 1.586 782 311 7.416 2.532 5.474 2.198 2.346 1.564 638 1.272 954 878 878 606 1.048 1.592 1.118 782 1.080 40 1.765 1.765 1.765 1.765 1.765 1.161 1.765 1.170 595 3 602 1.160 605 1.765 1.765 584 1.564 2.073 878 878 1.564 1.564 7.566 236 1.429 1.564 30 625 500
3,3460 3,3460 3,3460 3,3460 3,3460 3,3440 3,3440 3,3440 3,3440 3,3440 3,3440 3,3440 3,3440 3,3440 3,3440 3,3440 3,3440 3,3440 3,3440 3,3440 3,3440 3,3440 3,3430 3,3430 3,3430 3,3430 3,3430 3,3430 3,3430 3,3430 3,3430 3,3430 3,3430 3,3430 3,3430 3,3430 3,3430 3,3430 3,3420 3,3420 3,3420 3,3420 3,3420 3,3420 3,3420 3,3420 3,3420 3,3420 3,3420 3,3420 3,3420
Hora / Trade Fecha / Date Time 28/07/2026 28/07/2026 28/07/2026 28/07/2026 28/07/2026 28/07/2026 28/07/2026 28/07/2026 28/07/2026 28/07/2026 28/07/2026 28/07/2026 28/07/2026 28/07/2026 28/07/2026 28/07/2026 28/07/2026 28/07/2026 28/07/2026 28/07/2026 28/07/2026 28/07/2026 28/07/2026 28/07/2026 28/07/2026 28/07/2026 28/07/2026 28/07/2026 28/07/2026 28/07/2026 28/07/2026 28/07/2026 28/07/2026 28/07/2026 28/07/2026 28/07/2026 28/07/2026 28/07/2026 28/07/2026 28/07/2026 28/07/2026 28/07/2026 28/07/2026 28/07/2026 28/07/2026 28/07/2026 28/07/2026 28/07/2026 28/07/2026 28/07/2026 28/07/2026
15:20:55 15:21:23 15:21:23 15:21:23 15:21:23 15:21:23 15:21:23 15:21:31 15:25:43 15:25:43 15:25:43 15:25:43 15:25:43 15:25:43 15:25:43 15:25:44 15:25:44 15:25:44 15:25:44 15:30:31 15:30:31 15:30:31 15:30:31 15:31:11 15:31:11 15:31:25 15:31:25 15:31:25 15:32:58 15:32:58 15:32:58 15:32:58 15:32:58 15:33:01 15:33:01 15:33:01 15:33:01 15:35:41 15:35:41 15:35:41 15:35:41 15:35:41 15:35:41 15:38:53 15:38:53 15:38:53 15:38:53 15:38:53 15:39:01 15:39:01 15:39:01
Instrumento Financ./Security
Operación / Transaction
SAB SAB SAB SAB SAB SAB SAB SAB SAB SAB SAB SAB SAB SAB SAB SAB SAB SAB SAB SAB SAB SAB SAB SAB SAB SAB SAB SAB SAB SAB SAB SAB SAB SAB SAB SAB SAB SAB SAB SAB SAB SAB SAB SAB SAB SAB SAB SAB SAB SAB SAB
COMPRA / BUY COMPRA / BUY COMPRA / BUY COMPRA / BUY COMPRA / BUY COMPRA / BUY COMPRA / BUY COMPRA / BUY COMPRA / BUY COMPRA / BUY COMPRA / BUY COMPRA / BUY COMPRA / BUY COMPRA / BUY COMPRA / BUY COMPRA / BUY COMPRA / BUY COMPRA / BUY COMPRA / BUY COMPRA / BUY COMPRA / BUY COMPRA / BUY COMPRA / BUY COMPRA / BUY COMPRA / BUY COMPRA / BUY COMPRA / BUY COMPRA / BUY COMPRA / BUY COMPRA / BUY COMPRA / BUY COMPRA / BUY COMPRA / BUY COMPRA / BUY COMPRA / BUY COMPRA / BUY COMPRA / BUY COMPRA / BUY COMPRA / BUY COMPRA / BUY COMPRA / BUY COMPRA / BUY COMPRA / BUY COMPRA / BUY COMPRA / BUY COMPRA / BUY COMPRA / BUY COMPRA / BUY COMPRA / BUY COMPRA / BUY COMPRA / BUY
Pag. 27
Centro Negociación / Trading Venue XMAD XMAD XMAD XMAD XMAD XMAD XMAD XMAD XMAD XMAD XMAD XMAD XMAD XMAD XMAD XMAD XMAD XMAD XMAD CEUX CEUX CEUX CEUX CEUX CEUX CEUX CEUX CEUX CEUX CEUX CEUX CEUX CEUX CEUX CEUX CEUX CEUX XMAD XMAD XMAD XMAD XMAD XMAD CEUX CEUX CEUX CEUX CEUX XMAD XMAD XMAD
Nº Títulos / Nr. of Precio € / Price shares € 1.719 2.219 4.765 1.892 2.800 1.638 4.496 2.411 132 2.543 12.976 2.282 4.051 1.035 2.500 1.895 2.586 2.586 3 1.876 1.876 907 969 1.027 752 97 600 292 984 1.876 254 1.622 254 1.876 192 579 1.297 2.198 9.076 9.076 1.700 1.914 1.036 1.876 1.876 1.876 1.695 347 2.432 1.564 782
3,3420 3,3420 3,3420 3,3420 3,3420 3,3420 3,3420 3,3400 3,3400 3,3400 3,3400 3,3400 3,3400 3,3400 3,3400 3,3400 3,3400 3,3400 3,3400 3,3370 3,3370 3,3370 3,3370 3,3370 3,3370 3,3370 3,3370 3,3370 3,3370 3,3370 3,3370 3,3370 3,3370 3,3370 3,3370 3,3370 3,3370 3,3380 3,3380 3,3380 3,3380 3,3380 3,3380 3,3370 3,3370 3,3370 3,3370 3,3370 3,3360 3,3360 3,3360
Hora / Trade Fecha / Date Time 28/07/2026 28/07/2026 28/07/2026 28/07/2026 28/07/2026 28/07/2026 28/07/2026 28/07/2026 28/07/2026 28/07/2026 28/07/2026 28/07/2026 28/07/2026 28/07/2026 28/07/2026 28/07/2026 28/07/2026 28/07/2026 28/07/2026 28/07/2026 28/07/2026 28/07/2026 28/07/2026 28/07/2026 28/07/2026 28/07/2026 28/07/2026 28/07/2026 28/07/2026 28/07/2026 28/07/2026 28/07/2026 28/07/2026 28/07/2026 28/07/2026 28/07/2026 28/07/2026 28/07/2026 28/07/2026 28/07/2026 28/07/2026 28/07/2026 28/07/2026 28/07/2026 28/07/2026 28/07/2026 28/07/2026 28/07/2026 28/07/2026 28/07/2026 28/07/2026
15:39:03 15:39:03 15:39:03 15:39:03 15:39:03 15:39:03 15:39:03 15:39:03 15:39:03 15:39:03 15:39:03 15:39:03 15:39:03 15:39:03 15:39:03 15:39:03 15:39:03 15:39:03 15:39:07 15:39:07 15:39:07 15:39:07 15:39:07 15:39:07 15:39:07 15:39:07 15:39:07 15:39:07 15:39:07 15:39:07 15:39:07 15:39:07 15:47:21 15:47:52 15:47:52 15:47:52 15:47:52 15:47:52 15:47:52 15:47:52 15:47:52 15:47:52 15:47:52 15:47:52 15:47:52 15:47:53 15:47:53 15:47:53 15:47:53 16:01:32 16:01:43
Instrumento Financ./Security
Operación / Transaction
SAB SAB SAB SAB SAB SAB SAB SAB SAB SAB SAB SAB SAB SAB SAB SAB SAB SAB SAB SAB SAB SAB SAB SAB SAB SAB SAB SAB SAB SAB SAB SAB SAB SAB SAB SAB SAB SAB SAB SAB SAB SAB SAB SAB SAB SAB SAB SAB SAB SAB SAB
COMPRA / BUY COMPRA / BUY COMPRA / BUY COMPRA / BUY COMPRA / BUY COMPRA / BUY COMPRA / BUY COMPRA / BUY COMPRA / BUY COMPRA / BUY COMPRA / BUY COMPRA / BUY COMPRA / BUY COMPRA / BUY COMPRA / BUY COMPRA / BUY COMPRA / BUY COMPRA / BUY COMPRA / BUY COMPRA / BUY COMPRA / BUY COMPRA / BUY COMPRA / BUY COMPRA / BUY COMPRA / BUY COMPRA / BUY COMPRA / BUY COMPRA / BUY COMPRA / BUY COMPRA / BUY COMPRA / BUY COMPRA / BUY COMPRA / BUY COMPRA / BUY COMPRA / BUY COMPRA / BUY COMPRA / BUY COMPRA / BUY COMPRA / BUY COMPRA / BUY COMPRA / BUY COMPRA / BUY COMPRA / BUY COMPRA / BUY COMPRA / BUY COMPRA / BUY COMPRA / BUY COMPRA / BUY COMPRA / BUY COMPRA / BUY COMPRA / BUY
Pag. 28
Centro Negociación / Trading Venue XMAD XMAD XMAD XMAD XMAD XMAD XMAD XMAD XMAD XMAD XMAD XMAD XMAD XMAD XMAD XMAD XMAD XMAD XMAD XMAD XMAD XMAD XMAD XMAD XMAD XMAD XMAD XMAD XMAD XMAD XMAD XMAD XMAD XMAD XMAD XMAD XMAD XMAD XMAD XMAD XMAD XMAD XMAD XMAD XMAD XMAD XMAD XMAD XMAD XMAD XMAD
Nº Títulos / Nr. of Precio € / Price shares € 86 2.432 2.432 1.564 782 86 2.432 1.564 878 868 2.286 878 3.200 782 1.554 2.486 96 816 2.765 2.765 782 878 878 2.619 373 2.765 2.765 4.230 1.300 4.230 1.300 2.350 2.198 2.198 1.211 782 782 878 2.052 878 987 1.564 1.564 3.409 3.409 68 2.198 325 497 2.219 2.219
3,3360 3,3360 3,3360 3,3360 3,3360 3,3360 3,3360 3,3360 3,3360 3,3360 3,3360 3,3360 3,3360 3,3360 3,3360 3,3360 3,3360 3,3360 3,3340 3,3340 3,3340 3,3340 3,3340 3,3340 3,3340 3,3340 3,3340 3,3340 3,3340 3,3340 3,3340 3,3340 3,3380 3,3380 3,3380 3,3380 3,3380 3,3380 3,3380 3,3380 3,3380 3,3380 3,3380 3,3380 3,3380 3,3380 3,3380 3,3380 3,3380 3,3480 3,3480
Hora / Trade Fecha / Date Time 28/07/2026 28/07/2026 28/07/2026 28/07/2026 28/07/2026 28/07/2026 28/07/2026 28/07/2026 28/07/2026 28/07/2026 28/07/2026 28/07/2026 28/07/2026 28/07/2026 28/07/2026 28/07/2026 28/07/2026 28/07/2026 28/07/2026 28/07/2026 28/07/2026 28/07/2026 28/07/2026 28/07/2026 28/07/2026 28/07/2026 28/07/2026 28/07/2026 28/07/2026 28/07/2026 28/07/2026 28/07/2026 28/07/2026 28/07/2026 28/07/2026 28/07/2026 28/07/2026 28/07/2026 28/07/2026 28/07/2026 28/07/2026 28/07/2026 28/07/2026 28/07/2026 28/07/2026 28/07/2026 28/07/2026 28/07/2026 28/07/2026 28/07/2026 28/07/2026
16:01:43 16:01:54 16:01:54 16:01:54 16:01:54 16:01:54 16:01:54 16:01:54 16:01:54 16:01:54 16:01:54 16:01:54 16:01:54 16:01:54 16:01:54 16:02:37 16:02:37 16:02:37 16:02:37 16:02:37 16:07:23 16:07:52 16:07:52 16:07:52 16:07:52 16:07:52 16:07:55 16:07:55 16:07:55 16:07:55 16:07:55 16:07:55 16:07:55 16:07:55 16:08:04 16:08:04 16:08:04 16:08:04 16:08:04 16:08:04 16:08:04 16:08:04 16:08:04 16:08:04 16:08:04 16:08:04 16:08:04 16:08:04 16:08:04 16:08:04 16:08:05
Instrumento Financ./Security
Operación / Transaction
SAB SAB SAB SAB SAB SAB SAB SAB SAB SAB SAB SAB SAB SAB SAB SAB SAB SAB SAB SAB SAB SAB SAB SAB SAB SAB SAB SAB SAB SAB SAB SAB SAB SAB SAB SAB SAB SAB SAB SAB SAB SAB SAB SAB SAB SAB SAB SAB SAB SAB SAB
COMPRA / BUY COMPRA / BUY COMPRA / BUY COMPRA / BUY COMPRA / BUY COMPRA / BUY COMPRA / BUY COMPRA / BUY COMPRA / BUY COMPRA / BUY COMPRA / BUY COMPRA / BUY COMPRA / BUY COMPRA / BUY COMPRA / BUY COMPRA / BUY COMPRA / BUY COMPRA / BUY COMPRA / BUY COMPRA / BUY COMPRA / BUY COMPRA / BUY COMPRA / BUY COMPRA / BUY COMPRA / BUY COMPRA / BUY COMPRA / BUY COMPRA / BUY COMPRA / BUY COMPRA / BUY COMPRA / BUY COMPRA / BUY COMPRA / BUY COMPRA / BUY COMPRA / BUY COMPRA / BUY COMPRA / BUY COMPRA / BUY COMPRA / BUY COMPRA / BUY COMPRA / BUY COMPRA / BUY COMPRA / BUY COMPRA / BUY COMPRA / BUY COMPRA / BUY COMPRA / BUY COMPRA / BUY COMPRA / BUY COMPRA / BUY COMPRA / BUY
Pag. 29
Centro Negociación / Trading Venue XMAD CEUX CEUX CEUX CEUX CEUX XMAD XMAD XMAD XMAD XMAD CEUX CEUX CEUX CEUX CEUX CEUX CEUX CEUX CEUX XMAD XMAD XMAD XMAD XMAD XMAD XMAD XMAD XMAD XMAD XMAD XMAD CEUX CEUX CEUX CEUX CEUX CEUX CEUX CEUX CEUX CEUX CEUX CEUX CEUX CEUX CEUX CEUX CEUX CEUX CEUX
Nº Títulos / Nr. of Precio € / Price shares € 1.564 1.876 1.876 1.876 385 1.538 18.113 294 1.564 2.219 1.808 338 1.876 1.876 508 1.876 1.876 1.549 1.876 674 2.198 687 1.511 4.521 2.073 2.198 2.198 2.198 1.564 2.198 878 2.776 902 863 1.765 1.655 110 1.655 1.765 1.765 864 901 901 864 901 639 550 576 1.189 49 1.716
3,3480 3,3470 3,3470 3,3470 3,3470 3,3470 3,3480 3,3480 3,3480 3,3480 3,3480 3,3470 3,3470 3,3470 3,3470 3,3470 3,3470 3,3470 3,3470 3,3470 3,3440 3,3440 3,3440 3,3440 3,3440 3,3440 3,3440 3,3440 3,3440 3,3440 3,3440 3,3440 3,3430 3,3430 3,3430 3,3430 3,3430 3,3430 3,3430 3,3430 3,3430 3,3430 3,3430 3,3430 3,3430 3,3430 3,3430 3,3430 3,3430 3,3430 3,3430
Hora / Trade Fecha / Date Time 28/07/2026 28/07/2026 28/07/2026 28/07/2026 28/07/2026 28/07/2026 28/07/2026 28/07/2026 28/07/2026 28/07/2026 28/07/2026 28/07/2026 28/07/2026 28/07/2026 28/07/2026 28/07/2026 28/07/2026 28/07/2026 28/07/2026 28/07/2026 28/07/2026 28/07/2026 28/07/2026 28/07/2026 28/07/2026 28/07/2026 28/07/2026 28/07/2026 28/07/2026 28/07/2026 28/07/2026 28/07/2026 28/07/2026 28/07/2026 28/07/2026 28/07/2026 28/07/2026 28/07/2026 28/07/2026 28/07/2026 28/07/2026 28/07/2026 28/07/2026 28/07/2026 28/07/2026 28/07/2026 28/07/2026 28/07/2026 28/07/2026 28/07/2026 28/07/2026
16:08:05 16:18:18 16:18:18 16:18:18 16:18:18 16:18:18 16:18:18 16:18:18 16:18:18 16:18:18 16:18:18 16:18:18 16:18:18 16:18:18 16:18:18 16:18:18 16:18:18 16:19:58 16:20:31 16:20:31 16:20:31 16:20:31 16:20:31 16:20:31 16:20:31 16:20:31 16:20:31 16:20:31 16:20:31 16:20:31 16:20:31 16:20:31 16:20:31 16:20:31 16:20:31 16:20:33 16:47:16 16:47:16 16:47:16 16:47:16 16:47:16 16:49:41 16:49:41 16:49:41 16:49:41 16:49:41 16:49:41 16:49:41 16:49:41 16:49:41 16:49:41
Instrumento Financ./Security
Operación / Transaction
SAB SAB SAB SAB SAB SAB SAB SAB SAB SAB SAB SAB SAB SAB SAB SAB SAB SAB SAB SAB SAB SAB SAB SAB SAB SAB SAB SAB SAB SAB SAB SAB SAB SAB SAB SAB SAB SAB SAB SAB SAB SAB SAB SAB SAB SAB SAB SAB SAB SAB SAB
COMPRA / BUY COMPRA / BUY COMPRA / BUY COMPRA / BUY COMPRA / BUY COMPRA / BUY COMPRA / BUY COMPRA / BUY COMPRA / BUY COMPRA / BUY COMPRA / BUY COMPRA / BUY COMPRA / BUY COMPRA / BUY COMPRA / BUY COMPRA / BUY COMPRA / BUY COMPRA / BUY COMPRA / BUY COMPRA / BUY COMPRA / BUY COMPRA / BUY COMPRA / BUY COMPRA / BUY COMPRA / BUY COMPRA / BUY COMPRA / BUY COMPRA / BUY COMPRA / BUY COMPRA / BUY COMPRA / BUY COMPRA / BUY COMPRA / BUY COMPRA / BUY COMPRA / BUY COMPRA / BUY COMPRA / BUY COMPRA / BUY COMPRA / BUY COMPRA / BUY COMPRA / BUY COMPRA / BUY COMPRA / BUY COMPRA / BUY COMPRA / BUY COMPRA / BUY COMPRA / BUY COMPRA / BUY COMPRA / BUY COMPRA / BUY COMPRA / BUY
Pag. 30
Centro Negociación / Trading Venue CEUX CEUX CEUX CEUX CEUX CEUX CEUX CEUX CEUX CEUX CEUX CEUX CEUX CEUX CEUX CEUX CEUX XMAD XMAD XMAD XMAD XMAD XMAD XMAD XMAD XMAD XMAD XMAD XMAD XMAD XMAD XMAD XMAD XMAD XMAD XMAD XMAD XMAD XMAD XMAD XMAD XMAD XMAD XMAD XMAD XMAD XMAD XMAD XMAD XMAD XMAD
Nº Títulos / Nr. of Precio € / Price shares € 370 1.765 1.034 731 912 1.765 1.765 907 1.161 604 1.765 1.765 1.765 110 1.655 1.765 531 5.184 1.473 2.982 878 878 1.564 1.564 782 1.010 782 1.437 878 1.291 878 782 1.564 1.437 1.456 3.180 2.543 7.488 13.164 1.564 10.241 2.543 2.346 197 2.346 878 878 2.397 197 1.564 1.862
3,3430 3,3430 3,3430 3,3430 3,3430 3,3430 3,3430 3,3430 3,3430 3,3430 3,3430 3,3430 3,3430 3,3430 3,3430 3,3430 3,3430 3,3420 3,3420 3,3420 3,3420 3,3420 3,3420 3,3420 3,3420 3,3420 3,3420 3,3420 3,3420 3,3420 3,3420 3,3420 3,3420 3,3420 3,3420 3,3420 3,3400 3,3400 3,3400 3,3400 3,3400 3,3400 3,3400 3,3400 3,3400 3,3400 3,3400 3,3400 3,3400 3,3400 3,3400
Hora / Trade Fecha / Date Time 28/07/2026 28/07/2026 28/07/2026 28/07/2026 28/07/2026 28/07/2026 28/07/2026 28/07/2026 28/07/2026 28/07/2026 28/07/2026 28/07/2026 28/07/2026 28/07/2026 28/07/2026 28/07/2026 28/07/2026 28/07/2026 28/07/2026 28/07/2026 28/07/2026 28/07/2026 28/07/2026 28/07/2026 28/07/2026 28/07/2026 28/07/2026 28/07/2026 28/07/2026 28/07/2026 28/07/2026 28/07/2026 28/07/2026 28/07/2026 28/07/2026 28/07/2026 28/07/2026 28/07/2026 28/07/2026 28/07/2026 28/07/2026 28/07/2026 28/07/2026 28/07/2026 28/07/2026 28/07/2026 28/07/2026 28/07/2026 28/07/2026 28/07/2026 28/07/2026
16:49:41 16:49:41 16:49:43 16:49:43 16:49:43 16:49:43 16:49:43 16:49:52 16:49:52 16:50:22 16:50:22 16:50:22 16:50:22 16:50:22 16:50:22 16:50:22 16:50:22 16:51:15 16:52:13 16:52:13 16:52:13 16:52:16 16:52:17 16:52:19 16:55:38 16:55:38 16:55:38 16:55:38 16:55:41 16:55:41 16:56:38 16:56:53 16:56:53 16:56:53 16:57:03 16:57:03 16:57:03 16:57:08 16:57:08 16:57:08 16:57:08 16:57:08 16:57:08 16:57:08 16:57:08 16:57:08 16:57:08 16:57:08 16:57:08 16:57:08 16:57:08
Instrumento Financ./Security
Operación / Transaction
SAB SAB SAB SAB SAB SAB SAB SAB SAB SAB SAB SAB SAB SAB SAB SAB SAB SAB SAB SAB SAB SAB SAB SAB SAB SAB SAB SAB SAB SAB SAB SAB SAB SAB SAB SAB SAB SAB SAB SAB SAB SAB SAB SAB SAB SAB SAB SAB SAB SAB SAB
COMPRA / BUY COMPRA / BUY COMPRA / BUY COMPRA / BUY COMPRA / BUY COMPRA / BUY COMPRA / BUY COMPRA / BUY COMPRA / BUY COMPRA / BUY COMPRA / BUY COMPRA / BUY COMPRA / BUY COMPRA / BUY COMPRA / BUY COMPRA / BUY COMPRA / BUY COMPRA / BUY COMPRA / BUY COMPRA / BUY COMPRA / BUY COMPRA / BUY COMPRA / BUY COMPRA / BUY COMPRA / BUY COMPRA / BUY COMPRA / BUY COMPRA / BUY COMPRA / BUY COMPRA / BUY COMPRA / BUY COMPRA / BUY COMPRA / BUY COMPRA / BUY COMPRA / BUY COMPRA / BUY COMPRA / BUY COMPRA / BUY COMPRA / BUY COMPRA / BUY COMPRA / BUY COMPRA / BUY COMPRA / BUY COMPRA / BUY COMPRA / BUY COMPRA / BUY COMPRA / BUY COMPRA / BUY COMPRA / BUY COMPRA / BUY COMPRA / BUY
Pag. 31
Centro Negociación / Trading Venue XMAD XMAD XMAD XMAD XMAD XMAD XMAD XMAD XMAD XMAD XMAD XMAD XMAD XMAD XMAD XMAD XMAD XMAD XMAD XMAD XMAD XMAD XMAD XMAD XMAD XMAD XMAD XMAD XMAD XMAD CEUX CEUX CEUX CEUX XMAD XMAD XMAD XMAD XMAD XMAD XMAD XMAD XMAD XMAD XMAD XMAD XMAD XMAD XMAD XMAD XMAD
Nº Títulos / Nr. of Precio € / Price shares € 1.564 782 247 794 878 2.397 878 2.929 931 1.365 1.339 878 878 894 1.204 782 1.052 2.543 3.949 1.137 2.602 2.484 2.543 2.543 2.543 5.818 3.128 782 444 4.484 1.543 1.543 800 1.114 2.477 3.282 1.817 1.012 2.147 1.012 878 782 878 2.001 1.722 1.622 2.346 1.564 1.840 384 1.058
3,3400 3,3400 3,3400 3,3400 3,3400 3,3400 3,3400 3,3400 3,3400 3,3400 3,3400 3,3400 3,3400 3,3400 3,3400 3,3400 3,3400 3,3380 3,3380 3,3380 3,3380 3,3380 3,3380 3,3380 3,3400 3,3400 3,3400 3,3400 3,3400 3,3400 3,3390 3,3390 3,3390 3,3390 3,3380 3,3380 3,3380 3,3380 3,3380 3,3380 3,3380 3,3380 3,3380 3,3380 3,3380 3,3380 3,3380 3,3380 3,3380 3,3380 3,3380
Hora / Trade Fecha / Date Time 28/07/2026 28/07/2026 28/07/2026 28/07/2026 28/07/2026 28/07/2026 28/07/2026 28/07/2026 28/07/2026 28/07/2026 28/07/2026 28/07/2026 28/07/2026 28/07/2026 28/07/2026 28/07/2026 28/07/2026 28/07/2026 28/07/2026 28/07/2026 28/07/2026 28/07/2026 28/07/2026 28/07/2026 28/07/2026 28/07/2026 28/07/2026 28/07/2026 28/07/2026 28/07/2026 28/07/2026 28/07/2026 28/07/2026 28/07/2026 28/07/2026 28/07/2026 28/07/2026 28/07/2026 28/07/2026 28/07/2026 28/07/2026 28/07/2026 28/07/2026 28/07/2026 28/07/2026 28/07/2026 28/07/2026 28/07/2026 28/07/2026 28/07/2026 28/07/2026
16:57:08 16:57:08 16:57:08 16:57:14 16:57:14 16:57:14 16:57:14 16:57:15 16:57:15 16:57:15 16:57:15 16:57:15 16:57:15 16:57:15 16:57:15 16:57:15 16:57:15 16:57:15 16:57:15 16:57:15 16:57:15 16:57:15 16:57:15 16:57:15 16:57:15 16:57:21 16:58:07 16:58:07 16:58:14 16:58:14 16:58:14 16:58:14 16:58:14 16:58:14 16:58:14 16:58:14 16:58:14 16:58:14 16:58:14 16:58:14 16:58:14 16:58:14 16:58:14 16:58:14 16:58:15 16:58:15 16:58:15 16:58:15 16:58:15 16:58:15 16:58:15
Instrumento Financ./Security
Operación / Transaction
SAB SAB SAB SAB SAB SAB SAB SAB SAB SAB SAB SAB SAB SAB SAB SAB SAB SAB SAB SAB SAB SAB SAB SAB SAB SAB SAB SAB SAB SAB SAB SAB SAB SAB SAB SAB SAB SAB SAB SAB SAB SAB SAB SAB SAB SAB SAB SAB SAB SAB SAB
COMPRA / BUY COMPRA / BUY COMPRA / BUY COMPRA / BUY COMPRA / BUY COMPRA / BUY COMPRA / BUY COMPRA / BUY COMPRA / BUY COMPRA / BUY COMPRA / BUY COMPRA / BUY COMPRA / BUY COMPRA / BUY COMPRA / BUY COMPRA / BUY COMPRA / BUY COMPRA / BUY COMPRA / BUY COMPRA / BUY COMPRA / BUY COMPRA / BUY COMPRA / BUY COMPRA / BUY COMPRA / BUY COMPRA / BUY COMPRA / BUY COMPRA / BUY COMPRA / BUY COMPRA / BUY COMPRA / BUY COMPRA / BUY COMPRA / BUY COMPRA / BUY COMPRA / BUY COMPRA / BUY COMPRA / BUY COMPRA / BUY COMPRA / BUY COMPRA / BUY COMPRA / BUY COMPRA / BUY COMPRA / BUY COMPRA / BUY COMPRA / BUY COMPRA / BUY COMPRA / BUY COMPRA / BUY COMPRA / BUY COMPRA / BUY COMPRA / BUY
Pag. 32
Centro Negociación / Trading Venue XMAD XMAD XMAD CEUX CEUX CEUX CEUX CEUX CEUX CEUX CEUX CEUX CEUX CEUX CEUX CEUX CEUX CEUX CEUX CEUX CEUX CEUX CEUX CEUX CEUX CEUX XMAD XMAD XMAD XMAD XMAD XMAD XMAD XMAD XMAD XMAD XMAD XMAD XMAD XMAD XMAD XMAD XMAD XMAD XMAD XMAD XMAD XMAD XMAD XMAD XMAD
Nº Títulos / Nr. of Precio € / Price shares € 782 1.089 1.307 296 1.071 327 1 181 1.263 613 1.876 513 1.363 367 1.876 1.876 1.827 49 1.876 1.876 1.402 1.827 49 746 1.876 1.849 2.432 3.897 782 821 821 821 782 1.564 967 1.564 11 967 782 878 878 1.449 130 2.342 1.368 878 878 2.286 186 878 878
3,3380 3,3380 3,3380 3,3370 3,3370 3,3370 3,3370 3,3370 3,3370 3,3370 3,3370 3,3370 3,3370 3,3370 3,3370 3,3370 3,3370 3,3370 3,3370 3,3370 3,3370 3,3370 3,3370 3,3370 3,3370 3,3370 3,3360 3,3360 3,3360 3,3360 3,3360 3,3360 3,3360 3,3360 3,3360 3,3360 3,3360 3,3360 3,3360 3,3360 3,3360 3,3360 3,3360 3,3360 3,3360 3,3360 3,3360 3,3360 3,3360 3,3360 3,3360
Hora / Trade Fecha / Date Time 28/07/2026 28/07/2026 28/07/2026 28/07/2026 28/07/2026 28/07/2026 28/07/2026 28/07/2026 28/07/2026 28/07/2026 28/07/2026 28/07/2026 28/07/2026 28/07/2026 28/07/2026 28/07/2026 28/07/2026 28/07/2026 28/07/2026 28/07/2026 28/07/2026 28/07/2026 28/07/2026 28/07/2026 28/07/2026 28/07/2026 28/07/2026 28/07/2026 28/07/2026 28/07/2026 28/07/2026 28/07/2026 28/07/2026 28/07/2026 28/07/2026 28/07/2026 28/07/2026 28/07/2026 28/07/2026 28/07/2026 28/07/2026 28/07/2026 28/07/2026 28/07/2026 28/07/2026 28/07/2026 28/07/2026 28/07/2026 28/07/2026 28/07/2026 28/07/2026
16:58:15 17:04:25 17:04:25 17:04:25 17:04:25 17:04:25 17:04:25 17:04:25 17:04:25 17:04:25 17:04:25 17:04:25 17:04:25 17:04:25 17:04:25 17:04:25 17:04:25 17:04:25 17:04:25 17:04:25 17:04:25 17:04:25 17:04:25 17:07:38 17:09:55 17:14:19 17:14:19 17:17:11 17:17:11 17:17:11 17:17:11 17:17:11 17:17:11 17:17:11 17:17:12 17:17:12 17:17:12 17:17:12 17:17:12 17:17:12 17:17:12 17:17:13 17:23:27 17:23:27 17:23:27 17:23:27 17:23:27 17:23:27 17:23:27 17:23:27 17:23:27
Instrumento Financ./Security
Operación / Transaction
SAB SAB SAB SAB SAB SAB SAB SAB SAB SAB SAB SAB SAB SAB SAB SAB SAB SAB SAB SAB SAB SAB SAB SAB SAB SAB SAB SAB SAB SAB SAB SAB SAB SAB SAB SAB SAB SAB SAB SAB SAB SAB SAB SAB SAB SAB SAB SAB SAB SAB SAB
COMPRA / BUY COMPRA / BUY COMPRA / BUY COMPRA / BUY COMPRA / BUY COMPRA / BUY COMPRA / BUY COMPRA / BUY COMPRA / BUY COMPRA / BUY COMPRA / BUY COMPRA / BUY COMPRA / BUY COMPRA / BUY COMPRA / BUY COMPRA / BUY COMPRA / BUY COMPRA / BUY COMPRA / BUY COMPRA / BUY COMPRA / BUY COMPRA / BUY COMPRA / BUY COMPRA / BUY COMPRA / BUY COMPRA / BUY COMPRA / BUY COMPRA / BUY COMPRA / BUY COMPRA / BUY COMPRA / BUY COMPRA / BUY COMPRA / BUY COMPRA / BUY COMPRA / BUY COMPRA / BUY COMPRA / BUY COMPRA / BUY COMPRA / BUY COMPRA / BUY COMPRA / BUY COMPRA / BUY COMPRA / BUY COMPRA / BUY COMPRA / BUY COMPRA / BUY COMPRA / BUY COMPRA / BUY COMPRA / BUY COMPRA / BUY COMPRA / BUY
Pag. 33
Centro Negociación / Trading Venue XMAD XMAD XMAD XMAD XMAD XMAD XMAD XMAD XMAD XMAD XMAD XMAD XMAD XMAD XMAD XMAD XMAD XMAD XMAD XMAD XMAD XMAD XMAD XMAD XMAD XMAD XMAD XMAD XMAD XMAD XMAD XMAD XMAD XMAD XMAD XMAD XMAD XMAD XMAD XMAD XMAD XMAD XMAD XMAD XMAD XMAD XMAD XMAD XMAD XMAD XMAD
Nº Títulos / Nr. of Precio € / Price shares € 760 2.258 1.564 122 394 2.258 178 1.564 878 2.112 878 1.564 1.564 511 2.346 2.219 1.564 1.564 1.564 1.564 430 1.564 1.340 25.000 2.765 6.189 21.046 2.483 2.508 878 878 171 1.991 2.654 1.707 2.654 1.156 878 2.508 878 3.128 528 2.321 4.693 2.270 1.564 757 2.222 7.014 7.062 48
3,3360 3,3360 3,3360 3,3360 3,3360 3,3360 3,3360 3,3360 3,3360 3,3360 3,3360 3,3360 3,3360 3,3360 3,3360 3,3360 3,3360 3,3360 3,3360 3,3360 3,3360 3,3360 3,3360 3,3350 3,3340 3,3360 3,3360 3,3400 3,3400 3,3400 3,3400 3,3400 3,3400 3,3400 3,3400 3,3400 3,3400 3,3400 3,3400 3,3400 3,3400 3,3400 3,3440 3,3440 3,3440 3,3440 3,3440 3,3440 3,3440 3,3440 3,3440
Hora / Trade Fecha / Date Time 28/07/2026 28/07/2026 28/07/2026 28/07/2026 28/07/2026 28/07/2026 28/07/2026 28/07/2026 28/07/2026 28/07/2026 28/07/2026 28/07/2026 28/07/2026 28/07/2026 28/07/2026 28/07/2026 28/07/2026 28/07/2026 28/07/2026 28/07/2026 28/07/2026 28/07/2026 28/07/2026 28/07/2026 28/07/2026 28/07/2026 28/07/2026 28/07/2026 28/07/2026 28/07/2026 28/07/2026 28/07/2026 28/07/2026 28/07/2026 28/07/2026 28/07/2026 28/07/2026 28/07/2026 28/07/2026 28/07/2026 28/07/2026 28/07/2026 28/07/2026 28/07/2026 28/07/2026 28/07/2026 28/07/2026 28/07/2026 28/07/2026 28/07/2026 28/07/2026
17:23:34 17:23:41 17:23:41 17:24:46 17:24:46 17:24:46 17:24:46 17:24:46 17:24:46 17:24:46 17:24:46 17:24:46 17:24:46 17:24:46 17:24:46 17:24:47 17:25:20 17:25:21 17:25:21 17:25:21 17:25:21 17:25:21 17:25:21 17:25:21 17:25:21 17:25:21 17:25:21 17:25:21 17:25:21 17:25:21 17:25:53 17:25:54 17:25:54 17:25:54 17:25:54 17:25:54 17:25:54 17:25:55 17:27:34 17:27:34 17:27:34 17:27:34 17:27:34 17:28:01 17:28:01 17:28:01 17:28:01 17:28:01 17:28:01 17:28:01 17:28:01
Instrumento Financ./Security
Operación / Transaction
SAB SAB SAB SAB SAB SAB SAB SAB SAB SAB SAB SAB SAB SAB SAB SAB SAB SAB SAB SAB SAB SAB SAB SAB SAB SAB SAB SAB SAB SAB SAB SAB SAB SAB SAB SAB SAB SAB SAB SAB SAB SAB SAB SAB SAB SAB SAB SAB SAB SAB SAB
COMPRA / BUY COMPRA / BUY COMPRA / BUY COMPRA / BUY COMPRA / BUY COMPRA / BUY COMPRA / BUY COMPRA / BUY COMPRA / BUY COMPRA / BUY COMPRA / BUY COMPRA / BUY COMPRA / BUY COMPRA / BUY COMPRA / BUY COMPRA / BUY COMPRA / BUY COMPRA / BUY COMPRA / BUY COMPRA / BUY COMPRA / BUY COMPRA / BUY COMPRA / BUY COMPRA / BUY COMPRA / BUY COMPRA / BUY COMPRA / BUY COMPRA / BUY COMPRA / BUY COMPRA / BUY COMPRA / BUY COMPRA / BUY COMPRA / BUY COMPRA / BUY COMPRA / BUY COMPRA / BUY COMPRA / BUY COMPRA / BUY COMPRA / BUY COMPRA / BUY COMPRA / BUY COMPRA / BUY COMPRA / BUY COMPRA / BUY COMPRA / BUY COMPRA / BUY COMPRA / BUY COMPRA / BUY COMPRA / BUY COMPRA / BUY COMPRA / BUY
Pag. 34
Centro Negociación / Trading Venue XMAD CEUX CEUX CEUX CEUX CEUX CEUX CEUX CEUX CEUX CEUX CEUX CEUX CEUX CEUX CEUX XMAD XMAD XMAD XMAD XMAD XMAD XMAD XMAD XMAD XMAD XMAD XMAD XMAD XMAD XMAD XMAD XMAD XMAD XMAD XMAD XMAD XMAD CEUX CEUX CEUX CEUX CEUX XMAD CEUX CEUX CEUX CEUX CEUX CEUX CEUX
Nº Títulos / Nr. of Precio € / Price shares € 2.049 1.654 1.654 1.654 1.654 1.654 1.654 1.563 1.654 1.654 1.301 1.628 26 1.654 170 426 4.547 761 708 782 710 1.564 1.564 782 782 1.564 1.564 856 2.394 6.422 2.654 2.654 2.654 5.785 2.177 2.654 3.478 2.944 1.198 816 1.198 512 255 828 943 1.198 1.198 1.198 1.198 1.198 1.198
3,3440 3,3430 3,3430 3,3430 3,3430 3,3430 3,3430 3,3430 3,3430 3,3430 3,3430 3,3430 3,3430 3,3430 3,3430 3,3430 3,3420 3,3420 3,3420 3,3420 3,3420 3,3420 3,3420 3,3420 3,3420 3,3420 3,3420 3,3420 3,3420 3,3420 3,3400 3,3400 3,3400 3,3400 3,3400 3,3400 3,3400 3,3400 3,3390 3,3390 3,3390 3,3390 3,3390 3,3380 3,3390 3,3390 3,3390 3,3390 3,3390 3,3390 3,3390
Hora / Trade Fecha / Date Time 28/07/2026 28/07/2026 28/07/2026 28/07/2026 28/07/2026 28/07/2026 28/07/2026 28/07/2026 28/07/2026 28/07/2026 28/07/2026 28/07/2026 28/07/2026 28/07/2026 28/07/2026 28/07/2026 28/07/2026 28/07/2026 28/07/2026 28/07/2026 28/07/2026 29/07/2026 29/07/2026 29/07/2026 29/07/2026 29/07/2026 29/07/2026 29/07/2026 29/07/2026 29/07/2026 29/07/2026 29/07/2026 29/07/2026 29/07/2026 29/07/2026 29/07/2026 29/07/2026 29/07/2026 29/07/2026 29/07/2026 29/07/2026 29/07/2026 29/07/2026 29/07/2026 29/07/2026 29/07/2026 29/07/2026 29/07/2026 29/07/2026 29/07/2026 29/07/2026
17:28:01 17:28:01 17:28:01 17:28:01 17:28:01 17:28:01 17:28:01 17:28:06 17:28:06 17:28:06 17:28:06 17:28:06 17:28:06 17:28:06 17:28:08 17:28:08 17:28:31 17:28:53 17:28:59 17:28:59 17:29:07 09:03:37 09:03:37 09:03:49 09:03:49 09:03:49 09:03:49 09:03:53 09:03:53 09:03:53 09:03:53 09:03:53 09:03:53 09:03:53 09:03:53 09:03:53 09:03:53 09:04:07 09:04:07 09:04:07 09:04:07 09:04:07 09:04:07 09:04:07 09:04:07 09:04:07 09:04:07 09:04:07 09:04:07 09:04:43 09:04:43
Instrumento Financ./Security
Operación / Transaction
SAB SAB SAB SAB SAB SAB SAB SAB SAB SAB SAB SAB SAB SAB SAB SAB SAB SAB SAB SAB SAB SAB SAB SAB SAB SAB SAB SAB SAB SAB SAB SAB SAB SAB SAB SAB SAB SAB SAB SAB SAB SAB SAB SAB SAB SAB SAB SAB SAB SAB SAB
COMPRA / BUY COMPRA / BUY COMPRA / BUY COMPRA / BUY COMPRA / BUY COMPRA / BUY COMPRA / BUY COMPRA / BUY COMPRA / BUY COMPRA / BUY COMPRA / BUY COMPRA / BUY COMPRA / BUY COMPRA / BUY COMPRA / BUY COMPRA / BUY COMPRA / BUY COMPRA / BUY COMPRA / BUY COMPRA / BUY COMPRA / BUY COMPRA / BUY COMPRA / BUY COMPRA / BUY COMPRA / BUY COMPRA / BUY COMPRA / BUY COMPRA / BUY COMPRA / BUY COMPRA / BUY COMPRA / BUY COMPRA / BUY COMPRA / BUY COMPRA / BUY COMPRA / BUY COMPRA / BUY COMPRA / BUY COMPRA / BUY COMPRA / BUY COMPRA / BUY COMPRA / BUY COMPRA / BUY COMPRA / BUY COMPRA / BUY COMPRA / BUY COMPRA / BUY COMPRA / BUY COMPRA / BUY COMPRA / BUY COMPRA / BUY COMPRA / BUY
Pag. 35
Centro Negociación / Trading Venue CEUX CEUX CEUX CEUX CEUX CEUX CEUX CEUX CEUX CEUX CEUX CEUX CEUX CEUX XMAD XMAD XMAD XMAD XMAD XMAD XMAD XMAD XMAD XMAD XMAD XMAD XMAD XMAD XMAD XMAD XMAD XMAD XMAD XMAD XMAD XMAD XMAD XMAD XMAD XMAD XMAD XMAD XMAD XMAD XMAD XMAD XMAD XMAD XMAD XMAD XMAD
Nº Títulos / Nr. of Precio € / Price shares € 1.198 644 1.198 700 1.198 1.198 1.007 1.198 1.000 198 854 1.198 1.198 101 1.370 1.921 277 1.828 441 2.094 33 2.987 2.987 2.987 4.236 5.825 978 2.876 4.375 1.544 1.377 2.709 2.560 899 899 1.143 1.618 1.117 2.765 1.544 2.616 3.147 1.648 899 899 1.648 2.869 772 76 3.461 899
3,3390 3,3390 3,3390 3,3390 3,3390 3,3390 3,3390 3,3390 3,3390 3,3390 3,3390 3,3390 3,3390 3,3390 3,3380 3,3380 3,3380 3,3380 3,3380 3,3380 3,3380 3,3050 3,3050 3,3050 3,3050 3,3050 3,3050 3,3000 3,3000 3,3000 3,3000 3,3000 3,3000 3,3000 3,3000 3,3000 3,3000 3,2950 3,2950 3,2950 3,2950 3,2950 3,2950 3,2950 3,2950 3,2950 3,2950 3,2950 3,2950 3,2900 3,2900
Hora / Trade Fecha / Date Time 29/07/2026 29/07/2026 29/07/2026 29/07/2026 29/07/2026 29/07/2026 29/07/2026 29/07/2026 29/07/2026 29/07/2026 29/07/2026 29/07/2026 29/07/2026 29/07/2026 29/07/2026 29/07/2026 29/07/2026 29/07/2026 29/07/2026 29/07/2026 29/07/2026 29/07/2026 29/07/2026 29/07/2026 29/07/2026 29/07/2026 29/07/2026 29/07/2026 29/07/2026 29/07/2026 29/07/2026 29/07/2026 29/07/2026 29/07/2026 29/07/2026 29/07/2026 29/07/2026 29/07/2026 29/07/2026 29/07/2026 29/07/2026 29/07/2026 29/07/2026 29/07/2026 29/07/2026 29/07/2026 29/07/2026 29/07/2026 29/07/2026 29/07/2026 29/07/2026
09:04:43 09:04:43 09:04:43 09:04:43 09:04:43 09:04:44 09:04:44 09:04:44 09:04:48 09:04:48 09:04:48 09:04:48 09:04:48 09:04:48 09:04:48 09:04:48 09:04:48 09:04:48 09:04:49 09:04:49 09:04:51 09:04:54 09:04:54 09:04:54 09:04:54 09:04:54 09:05:02 09:05:13 09:11:15 09:11:15 09:11:15 09:11:15 09:11:15 09:11:15 09:11:32 09:11:32 09:11:32 09:11:32 09:11:32 09:11:32 09:11:44 09:11:44 09:11:44 09:11:44 09:11:44 09:11:44 09:11:44 09:11:44 09:11:44 09:11:45 09:11:45
Instrumento Financ./Security
Operación / Transaction
SAB SAB SAB SAB SAB SAB SAB SAB SAB SAB SAB SAB SAB SAB SAB SAB SAB SAB SAB SAB SAB SAB SAB SAB SAB SAB SAB SAB SAB SAB SAB SAB SAB SAB SAB SAB SAB SAB SAB SAB SAB SAB SAB SAB SAB SAB SAB SAB SAB SAB SAB
COMPRA / BUY COMPRA / BUY COMPRA / BUY COMPRA / BUY COMPRA / BUY COMPRA / BUY COMPRA / BUY COMPRA / BUY COMPRA / BUY COMPRA / BUY COMPRA / BUY COMPRA / BUY COMPRA / BUY COMPRA / BUY COMPRA / BUY COMPRA / BUY COMPRA / BUY COMPRA / BUY COMPRA / BUY COMPRA / BUY COMPRA / BUY COMPRA / BUY COMPRA / BUY COMPRA / BUY COMPRA / BUY COMPRA / BUY COMPRA / BUY COMPRA / BUY COMPRA / BUY COMPRA / BUY COMPRA / BUY COMPRA / BUY COMPRA / BUY COMPRA / BUY COMPRA / BUY COMPRA / BUY COMPRA / BUY COMPRA / BUY COMPRA / BUY COMPRA / BUY COMPRA / BUY COMPRA / BUY COMPRA / BUY COMPRA / BUY COMPRA / BUY COMPRA / BUY COMPRA / BUY COMPRA / BUY COMPRA / BUY COMPRA / BUY COMPRA / BUY
Pag. 36
Centro Negociación / Trading Venue XMAD XMAD XMAD XMAD XMAD XMAD XMAD XMAD CEUX CEUX CEUX CEUX CEUX CEUX CEUX CEUX XMAD XMAD XMAD XMAD XMAD XMAD XMAD XMAD XMAD XMAD XMAD CEUX CEUX CEUX CEUX CEUX CEUX CEUX CEUX CEUX CEUX CEUX CEUX CEUX XMAD XMAD XMAD XMAD XMAD XMAD XMAD XMAD XMAD CEUX CEUX
Nº Títulos / Nr. of Precio € / Price shares € 899 4.198 1.544 1.159 1.110 3.981 1.327 1.422 1.987 1.987 1.987 1.987 1.987 1.987 1.987 1.091 2.543 4.197 388 501 2.543 2.543 95 1.872 886 2.233 2.199 1.876 1.876 1.729 147 1.729 147 1.399 330 1.876 1.422 454 484 1.531 2.432 7.317 1.544 772 867 1.660 2.477 2.387 544 1.765 1.765
3,2900 3,2900 3,2900 3,2900 3,2900 3,2900 3,2900 3,2900 3,2870 3,2870 3,2870 3,2870 3,2870 3,2870 3,2870 3,2870 3,2850 3,2850 3,2850 3,2850 3,2850 3,2850 3,2850 3,2850 3,2850 3,2850 3,2850 3,2830 3,2830 3,2830 3,2830 3,2830 3,2830 3,2830 3,2830 3,2830 3,2830 3,2830 3,2830 3,2830 3,2800 3,2800 3,2800 3,2800 3,2800 3,2800 3,2800 3,2800 3,2800 3,2770 3,2770
Hora / Trade Fecha / Date Time 29/07/2026 29/07/2026 29/07/2026 29/07/2026 29/07/2026 29/07/2026 29/07/2026 29/07/2026 29/07/2026 29/07/2026 29/07/2026 29/07/2026 29/07/2026 29/07/2026 29/07/2026 29/07/2026 29/07/2026 29/07/2026 29/07/2026 29/07/2026 29/07/2026 29/07/2026 29/07/2026 29/07/2026 29/07/2026 29/07/2026 29/07/2026 29/07/2026 29/07/2026 29/07/2026 29/07/2026 29/07/2026 29/07/2026 29/07/2026 29/07/2026 29/07/2026 29/07/2026 29/07/2026 29/07/2026 29/07/2026 29/07/2026 29/07/2026 29/07/2026 29/07/2026 29/07/2026 29/07/2026 29/07/2026 29/07/2026 29/07/2026 29/07/2026 29/07/2026
09:11:46 09:11:46 09:11:46 09:11:46 09:11:46 09:11:46 09:11:46 09:11:46 09:11:46 09:11:46 09:11:46 09:12:26 09:12:30 09:12:30 09:12:30 09:12:30 09:12:30 09:12:30 09:12:30 09:12:30 09:12:30 09:12:30 09:12:30 09:14:22 09:14:22 09:14:22 09:14:22 09:14:22 09:14:22 09:14:22 09:14:38 09:14:38 09:14:38 09:14:38 09:14:38 09:14:46 09:14:46 09:14:46 09:14:46 09:14:46 09:14:46 09:14:46 09:14:46 09:14:46 09:14:46 09:14:50 09:16:50 09:16:50 09:16:50 09:16:50 09:16:50
Instrumento Financ./Security
Operación / Transaction
SAB SAB SAB SAB SAB SAB SAB SAB SAB SAB SAB SAB SAB SAB SAB SAB SAB SAB SAB SAB SAB SAB SAB SAB SAB SAB SAB SAB SAB SAB SAB SAB SAB SAB SAB SAB SAB SAB SAB SAB SAB SAB SAB SAB SAB SAB SAB SAB SAB SAB SAB
COMPRA / BUY COMPRA / BUY COMPRA / BUY COMPRA / BUY COMPRA / BUY COMPRA / BUY COMPRA / BUY COMPRA / BUY COMPRA / BUY COMPRA / BUY COMPRA / BUY COMPRA / BUY COMPRA / BUY COMPRA / BUY COMPRA / BUY COMPRA / BUY COMPRA / BUY COMPRA / BUY COMPRA / BUY COMPRA / BUY COMPRA / BUY COMPRA / BUY COMPRA / BUY COMPRA / BUY COMPRA / BUY COMPRA / BUY COMPRA / BUY COMPRA / BUY COMPRA / BUY COMPRA / BUY COMPRA / BUY COMPRA / BUY COMPRA / BUY COMPRA / BUY COMPRA / BUY COMPRA / BUY COMPRA / BUY COMPRA / BUY COMPRA / BUY COMPRA / BUY COMPRA / BUY COMPRA / BUY COMPRA / BUY COMPRA / BUY COMPRA / BUY COMPRA / BUY COMPRA / BUY COMPRA / BUY COMPRA / BUY COMPRA / BUY COMPRA / BUY
Pag. 37
Centro Negociación / Trading Venue CEUX CEUX CEUX CEUX CEUX CEUX CEUX CEUX CEUX CEUX CEUX XMAD XMAD XMAD XMAD XMAD XMAD XMAD XMAD XMAD XMAD XMAD XMAD XMAD XMAD XMAD XMAD XMAD XMAD XMAD XMAD XMAD XMAD XMAD XMAD CEUX CEUX CEUX CEUX CEUX CEUX CEUX CEUX CEUX CEUX CEUX CEUX CEUX CEUX CEUX CEUX
Nº Títulos / Nr. of Precio € / Price shares € 1.765 223 1.542 1.616 149 1.393 1.122 643 1.122 1.765 130 2.321 2.321 772 1.065 2.172 1.544 1.741 899 899 2.954 1.880 1.432 2.321 772 3.088 1.544 772 787 2.316 985 1.341 2.321 2.321 1.432 955 699 699 516 272 167 272 258 1.396 1.548 3 1.654 1.654 1.654 1.654 339
3,2770 3,2770 3,2770 3,2770 3,2770 3,2770 3,2770 3,2770 3,2770 3,2770 3,2770 3,2750 3,2750 3,2750 3,2750 3,2750 3,2750 3,2750 3,2750 3,2750 3,2750 3,2750 3,2750 3,2750 3,2750 3,2750 3,2750 3,2750 3,2750 3,2750 3,2750 3,2750 3,2750 3,2750 3,2750 3,2730 3,2730 3,2730 3,2730 3,2730 3,2730 3,2730 3,2730 3,2730 3,2730 3,2730 3,2810 3,2810 3,2810 3,2810 3,2810
Hora / Trade Fecha / Date Time 29/07/2026 29/07/2026 29/07/2026 29/07/2026 29/07/2026 29/07/2026 29/07/2026 29/07/2026 29/07/2026 29/07/2026 29/07/2026 29/07/2026 29/07/2026 29/07/2026 29/07/2026 29/07/2026 29/07/2026 29/07/2026 29/07/2026 29/07/2026 29/07/2026 29/07/2026 29/07/2026 29/07/2026 29/07/2026 29/07/2026 29/07/2026 29/07/2026 29/07/2026 29/07/2026 29/07/2026 29/07/2026 29/07/2026 29/07/2026 29/07/2026 29/07/2026 29/07/2026 29/07/2026 29/07/2026 29/07/2026 29/07/2026 29/07/2026 29/07/2026 29/07/2026 29/07/2026 29/07/2026 29/07/2026 29/07/2026 29/07/2026 29/07/2026 29/07/2026
09:18:11 09:18:11 09:18:11 09:18:11 09:18:11 09:18:11 09:18:13 09:18:13 09:18:42 09:18:42 09:18:42 09:18:42 09:19:03 09:19:03 09:19:04 09:19:18 09:19:18 09:19:18 09:19:18 09:19:18 09:19:18 09:21:14 09:21:27 09:21:27 09:21:27 09:21:27 09:21:27 09:21:27 09:21:27 09:21:27 09:21:27 09:21:27 09:21:27 09:23:03 09:23:03 09:23:03 09:23:03 09:23:03 09:23:03 09:23:03 09:23:03 09:23:03 09:23:03 09:23:03 09:23:03 09:23:03 09:23:03 09:23:03 09:24:54 09:24:54 09:24:54
Instrumento Financ./Security
Operación / Transaction
SAB SAB SAB SAB SAB SAB SAB SAB SAB SAB SAB SAB SAB SAB SAB SAB SAB SAB SAB SAB SAB SAB SAB SAB SAB SAB SAB SAB SAB SAB SAB SAB SAB SAB SAB SAB SAB SAB SAB SAB SAB SAB SAB SAB SAB SAB SAB SAB SAB SAB SAB
COMPRA / BUY COMPRA / BUY COMPRA / BUY COMPRA / BUY COMPRA / BUY COMPRA / BUY COMPRA / BUY COMPRA / BUY COMPRA / BUY COMPRA / BUY COMPRA / BUY COMPRA / BUY COMPRA / BUY COMPRA / BUY COMPRA / BUY COMPRA / BUY COMPRA / BUY COMPRA / BUY COMPRA / BUY COMPRA / BUY COMPRA / BUY COMPRA / BUY COMPRA / BUY COMPRA / BUY COMPRA / BUY COMPRA / BUY COMPRA / BUY COMPRA / BUY COMPRA / BUY COMPRA / BUY COMPRA / BUY COMPRA / BUY COMPRA / BUY COMPRA / BUY COMPRA / BUY COMPRA / BUY COMPRA / BUY COMPRA / BUY COMPRA / BUY COMPRA / BUY COMPRA / BUY COMPRA / BUY COMPRA / BUY COMPRA / BUY COMPRA / BUY COMPRA / BUY COMPRA / BUY COMPRA / BUY COMPRA / BUY COMPRA / BUY COMPRA / BUY
Pag. 38
Centro Negociación / Trading Venue CEUX XMAD XMAD XMAD XMAD XMAD XMAD XMAD CEUX CEUX CEUX CEUX CEUX CEUX CEUX CEUX CEUX CEUX CEUX CEUX CEUX XMAD XMAD XMAD XMAD XMAD XMAD XMAD XMAD XMAD XMAD XMAD XMAD CEUX CEUX CEUX CEUX CEUX CEUX CEUX CEUX CEUX CEUX CEUX CEUX CEUX CEUX CEUX XMAD XMAD XMAD
Nº Títulos / Nr. of Precio € / Price shares € 1.260 2.432 1.544 428 772 11.868 2.412 544 1.765 916 849 1.765 1.765 1.765 688 1.077 1.765 1.573 192 192 688 2.321 2.321 1.544 2.321 777 899 2.172 899 1.422 2.993 899 1.432 1.219 1.219 1.219 287 1.219 1.219 1.219 1.219 1.219 14 1.219 1.219 1.219 1.219 71 2.219 546 1.544
3,2810 3,2800 3,2800 3,2800 3,2800 3,2800 3,2800 3,2800 3,2770 3,2770 3,2770 3,2770 3,2770 3,2770 3,2770 3,2770 3,2770 3,2770 3,2770 3,2770 3,2770 3,2750 3,2750 3,2750 3,2750 3,2750 3,2750 3,2750 3,2750 3,2750 3,2750 3,2750 3,2750 3,2730 3,2730 3,2730 3,2730 3,2730 3,2730 3,2730 3,2730 3,2730 3,2730 3,2730 3,2730 3,2730 3,2730 3,2730 3,2700 3,2700 3,2700
Hora / Trade Fecha / Date Time 29/07/2026 29/07/2026 29/07/2026 29/07/2026 29/07/2026 29/07/2026 29/07/2026 29/07/2026 29/07/2026 29/07/2026 29/07/2026 29/07/2026 29/07/2026 29/07/2026 29/07/2026 29/07/2026 29/07/2026 29/07/2026 29/07/2026 29/07/2026 29/07/2026 29/07/2026 29/07/2026 29/07/2026 29/07/2026 29/07/2026 29/07/2026 29/07/2026 29/07/2026 29/07/2026 29/07/2026 29/07/2026 29/07/2026 29/07/2026 29/07/2026 29/07/2026 29/07/2026 29/07/2026 29/07/2026 29/07/2026 29/07/2026 29/07/2026 29/07/2026 29/07/2026 29/07/2026 29/07/2026 29/07/2026 29/07/2026 29/07/2026 29/07/2026 29/07/2026
09:24:54 09:25:08 09:25:08 09:25:08 09:25:14 09:25:14 09:25:14 09:25:14 09:25:14 09:25:14 09:25:14 09:25:14 09:25:14 09:25:14 09:25:14 09:25:20 09:25:20 09:28:16 09:28:16 09:28:16 09:28:16 09:28:16 09:28:16 09:28:27 09:28:27 09:28:27 09:28:27 09:31:10 09:31:10 09:31:10 09:31:10 09:31:10 09:31:10 09:33:15 09:33:15 09:33:15 09:33:15 09:33:15 09:33:15 09:33:15 09:33:15 09:33:15 09:33:32 09:33:53 09:36:18 09:36:18 09:36:18 09:36:18 09:36:18 09:36:18 09:36:18
Instrumento Financ./Security
Operación / Transaction
SAB SAB SAB SAB SAB SAB SAB SAB SAB SAB SAB SAB SAB SAB SAB SAB SAB SAB SAB SAB SAB SAB SAB SAB SAB SAB SAB SAB SAB SAB SAB SAB SAB SAB SAB SAB SAB SAB SAB SAB SAB SAB SAB SAB SAB SAB SAB SAB SAB SAB SAB
COMPRA / BUY COMPRA / BUY COMPRA / BUY COMPRA / BUY COMPRA / BUY COMPRA / BUY COMPRA / BUY COMPRA / BUY COMPRA / BUY COMPRA / BUY COMPRA / BUY COMPRA / BUY COMPRA / BUY COMPRA / BUY COMPRA / BUY COMPRA / BUY COMPRA / BUY COMPRA / BUY COMPRA / BUY COMPRA / BUY COMPRA / BUY COMPRA / BUY COMPRA / BUY COMPRA / BUY COMPRA / BUY COMPRA / BUY COMPRA / BUY COMPRA / BUY COMPRA / BUY COMPRA / BUY COMPRA / BUY COMPRA / BUY COMPRA / BUY COMPRA / BUY COMPRA / BUY COMPRA / BUY COMPRA / BUY COMPRA / BUY COMPRA / BUY COMPRA / BUY COMPRA / BUY COMPRA / BUY COMPRA / BUY COMPRA / BUY COMPRA / BUY COMPRA / BUY COMPRA / BUY COMPRA / BUY COMPRA / BUY COMPRA / BUY COMPRA / BUY
Pag. 39
Centro Negociación / Trading Venue XMAD CEUX CEUX CEUX CEUX CEUX CEUX CEUX CEUX CEUX CEUX CEUX CEUX CEUX CEUX CEUX CEUX XMAD XMAD XMAD XMAD XMAD XMAD XMAD XMAD XMAD XMAD CEUX CEUX CEUX CEUX CEUX CEUX CEUX CEUX CEUX CEUX CEUX CEUX CEUX CEUX CEUX XMAD CEUX XMAD XMAD XMAD XMAD XMAD XMAD XMAD
Nº Títulos / Nr. of Precio € / Price shares € 15.691 329 1.214 1.543 165 998 380 575 1.543 1.543 1.543 1.445 23 5 1.515 1.543 636 2.198 1.929 1.544 269 772 7.592 1.082 2.198 2.198 218 1.543 159 1.384 797 3 281 462 1.543 484 1.543 1.543 1.543 1.543 1.543 629 20.000 13 2.147 1.544 4.465 603 14 1.544 899
3,2700 3,2670 3,2670 3,2670 3,2670 3,2670 3,2670 3,2670 3,2670 3,2670 3,2670 3,2670 3,2670 3,2670 3,2670 3,2670 3,2670 3,2650 3,2650 3,2650 3,2650 3,2650 3,2650 3,2650 3,2650 3,2650 3,2650 3,2630 3,2630 3,2630 3,2630 3,2630 3,2630 3,2630 3,2630 3,2630 3,2630 3,2630 3,2630 3,2630 3,2630 3,2630 3,2600 3,2570 3,2580 3,2580 3,2580 3,2580 3,2580 3,2580 3,2580
Hora / Trade Fecha / Date Time 29/07/2026 29/07/2026 29/07/2026 29/07/2026 29/07/2026 29/07/2026 29/07/2026 29/07/2026 29/07/2026 29/07/2026 29/07/2026 29/07/2026 29/07/2026 29/07/2026 29/07/2026 29/07/2026 29/07/2026 29/07/2026 29/07/2026 29/07/2026 29/07/2026 29/07/2026 29/07/2026 29/07/2026 29/07/2026 29/07/2026 29/07/2026 29/07/2026 29/07/2026 29/07/2026 29/07/2026 29/07/2026 29/07/2026 29/07/2026 29/07/2026 29/07/2026 29/07/2026 29/07/2026 29/07/2026 29/07/2026 29/07/2026 29/07/2026 29/07/2026 29/07/2026 29/07/2026 29/07/2026 29/07/2026 29/07/2026 29/07/2026 29/07/2026 29/07/2026
09:36:18 09:36:18 09:36:18 09:36:18 09:36:18 09:36:18 09:36:18 09:36:18 09:36:18 09:36:18 09:36:18 09:38:26 09:38:26 09:38:26 09:38:26 09:38:26 09:38:26 09:38:26 09:38:26 09:38:26 09:38:26 09:38:26 09:38:26 09:38:26 09:38:26 09:38:26 09:38:26 09:38:26 09:38:26 09:38:26 09:38:26 09:38:26 09:38:26 09:38:26 09:38:36 09:38:36 09:38:36 09:38:36 09:38:36 09:38:36 09:38:36 09:38:36 09:38:36 09:38:36 09:38:36 09:38:56 09:38:56 09:45:58 09:45:58 09:45:58 09:45:58
Instrumento Financ./Security
Operación / Transaction
SAB SAB SAB SAB SAB SAB SAB SAB SAB SAB SAB SAB SAB SAB SAB SAB SAB SAB SAB SAB SAB SAB SAB SAB SAB SAB SAB SAB SAB SAB SAB SAB SAB SAB SAB SAB SAB SAB SAB SAB SAB SAB SAB SAB SAB SAB SAB SAB SAB SAB SAB
COMPRA / BUY COMPRA / BUY COMPRA / BUY COMPRA / BUY COMPRA / BUY COMPRA / BUY COMPRA / BUY COMPRA / BUY COMPRA / BUY COMPRA / BUY COMPRA / BUY COMPRA / BUY COMPRA / BUY COMPRA / BUY COMPRA / BUY COMPRA / BUY COMPRA / BUY COMPRA / BUY COMPRA / BUY COMPRA / BUY COMPRA / BUY COMPRA / BUY COMPRA / BUY COMPRA / BUY COMPRA / BUY COMPRA / BUY COMPRA / BUY COMPRA / BUY COMPRA / BUY COMPRA / BUY COMPRA / BUY COMPRA / BUY COMPRA / BUY COMPRA / BUY COMPRA / BUY COMPRA / BUY COMPRA / BUY COMPRA / BUY COMPRA / BUY COMPRA / BUY COMPRA / BUY COMPRA / BUY COMPRA / BUY COMPRA / BUY COMPRA / BUY COMPRA / BUY COMPRA / BUY COMPRA / BUY COMPRA / BUY COMPRA / BUY COMPRA / BUY
Pag. 40
Centro Negociación / Trading Venue XMAD XMAD XMAD XMAD XMAD XMAD XMAD XMAD XMAD XMAD XMAD CEUX CEUX CEUX CEUX CEUX CEUX CEUX CEUX CEUX CEUX CEUX CEUX CEUX CEUX CEUX CEUX CEUX CEUX CEUX CEUX CEUX CEUX CEUX XMAD XMAD XMAD XMAD XMAD XMAD XMAD XMAD XMAD XMAD XMAD XMAD XMAD CEUX CEUX CEUX CEUX
Nº Títulos / Nr. of Precio € / Price shares € 1.813 899 418 1.544 1.286 1.544 603 2.102 772 2.192 611 1.432 127 1.305 127 1.432 127 1.432 1.432 1.432 3 1.429 3 181 68 1.183 68 1.432 1.432 1.432 1.432 1.432 1.032 14 2.258 2.226 54 1.190 2.258 1.046 1.544 714 2.213 45 4.202 955 1.295 1.432 1.432 1.432 1.432
3,2580 3,2580 3,2580 3,2580 3,2580 3,2580 3,2580 3,2580 3,2580 3,2580 3,2580 3,2570 3,2570 3,2570 3,2570 3,2570 3,2570 3,2570 3,2570 3,2570 3,2570 3,2570 3,2570 3,2570 3,2570 3,2570 3,2570 3,2570 3,2570 3,2570 3,2570 3,2570 3,2570 3,2570 3,2550 3,2550 3,2550 3,2550 3,2550 3,2550 3,2550 3,2550 3,2550 3,2550 3,2550 3,2550 3,2550 3,2570 3,2570 3,2570 3,2570
Hora / Trade Fecha / Date Time 29/07/2026 29/07/2026 29/07/2026 29/07/2026 29/07/2026 29/07/2026 29/07/2026 29/07/2026 29/07/2026 29/07/2026 29/07/2026 29/07/2026 29/07/2026 29/07/2026 29/07/2026 29/07/2026 29/07/2026 29/07/2026 29/07/2026 29/07/2026 29/07/2026 29/07/2026 29/07/2026 29/07/2026 29/07/2026 29/07/2026 29/07/2026 29/07/2026 29/07/2026 29/07/2026 29/07/2026 29/07/2026 29/07/2026 29/07/2026 29/07/2026 29/07/2026 29/07/2026 29/07/2026 29/07/2026 29/07/2026 29/07/2026 29/07/2026 29/07/2026 29/07/2026 29/07/2026 29/07/2026 29/07/2026 29/07/2026 29/07/2026 29/07/2026 29/07/2026
09:45:58 09:45:58 09:45:58 09:45:58 09:45:58 09:45:58 09:45:58 09:45:58 09:45:58 09:45:58 09:46:03 09:46:03 09:46:03 09:46:03 09:46:03 09:46:03 09:46:03 09:46:03 09:46:03 09:46:03 09:46:23 09:46:23 09:46:23 09:46:23 09:46:23 09:46:23 09:46:23 09:46:23 09:46:27 09:46:27 09:46:27 09:46:27 09:46:27 09:46:27 09:46:27 09:46:27 09:46:27 09:46:27 09:49:35 09:49:35 09:49:35 09:49:46 09:49:46 09:49:46 09:49:46 09:49:46 09:49:46 09:49:46 09:49:46 09:49:46 09:49:58
Instrumento Financ./Security
Operación / Transaction
SAB SAB SAB SAB SAB SAB SAB SAB SAB SAB SAB SAB SAB SAB SAB SAB SAB SAB SAB SAB SAB SAB SAB SAB SAB SAB SAB SAB SAB SAB SAB SAB SAB SAB SAB SAB SAB SAB SAB SAB SAB SAB SAB SAB SAB SAB SAB SAB SAB SAB SAB
COMPRA / BUY COMPRA / BUY COMPRA / BUY COMPRA / BUY COMPRA / BUY COMPRA / BUY COMPRA / BUY COMPRA / BUY COMPRA / BUY COMPRA / BUY COMPRA / BUY COMPRA / BUY COMPRA / BUY COMPRA / BUY COMPRA / BUY COMPRA / BUY COMPRA / BUY COMPRA / BUY COMPRA / BUY COMPRA / BUY COMPRA / BUY COMPRA / BUY COMPRA / BUY COMPRA / BUY COMPRA / BUY COMPRA / BUY COMPRA / BUY COMPRA / BUY COMPRA / BUY COMPRA / BUY COMPRA / BUY COMPRA / BUY COMPRA / BUY COMPRA / BUY COMPRA / BUY COMPRA / BUY COMPRA / BUY COMPRA / BUY COMPRA / BUY COMPRA / BUY COMPRA / BUY COMPRA / BUY COMPRA / BUY COMPRA / BUY COMPRA / BUY COMPRA / BUY COMPRA / BUY COMPRA / BUY COMPRA / BUY COMPRA / BUY COMPRA / BUY
Pag. 41
Centro Negociación / Trading Venue CEUX CEUX CEUX CEUX CEUX CEUX CEUX CEUX CEUX CEUX XMAD XMAD XMAD XMAD XMAD XMAD XMAD XMAD XMAD XMAD CEUX CEUX CEUX CEUX CEUX CEUX CEUX CEUX XMAD CEUX CEUX CEUX CEUX CEUX CEUX CEUX XMAD XMAD XMAD XMAD XMAD XMAD XMAD XMAD XMAD XMAD XMAD XMAD XMAD XMAD CEUX
Nº Títulos / Nr. of Precio € / Price shares € 1.432 1.432 1.432 604 828 455 1.188 244 1.069 588 2.258 2.258 3.300 772 1.216 2.715 1.486 2.702 2.985 308 1.321 429 1.321 1.321 529 792 3 1.318 10.660 1.321 1.321 1.321 1.321 1.321 1.321 40 1.185 8.155 2.258 2.316 1.544 656 3.757 759 1.544 714 1.544 3.757 714 437 955
3,2570 3,2570 3,2570 3,2570 3,2570 3,2570 3,2570 3,2570 3,2570 3,2570 3,2550 3,2550 3,2550 3,2550 3,2550 3,2550 3,2550 3,2550 3,2550 3,2550 3,2530 3,2530 3,2530 3,2530 3,2530 3,2530 3,2530 3,2530 3,2500 3,2530 3,2530 3,2530 3,2530 3,2530 3,2530 3,2530 3,2500 3,2500 3,2550 3,2550 3,2550 3,2550 3,2550 3,2550 3,2550 3,2550 3,2550 3,2550 3,2550 3,2550 3,2530
Hora / Trade Fecha / Date Time 29/07/2026 29/07/2026 29/07/2026 29/07/2026 29/07/2026 29/07/2026 29/07/2026 29/07/2026 29/07/2026 29/07/2026 29/07/2026 29/07/2026 29/07/2026 29/07/2026 29/07/2026 29/07/2026 29/07/2026 29/07/2026 29/07/2026 29/07/2026 29/07/2026 29/07/2026 29/07/2026 29/07/2026 29/07/2026 29/07/2026 29/07/2026 29/07/2026 29/07/2026 29/07/2026 29/07/2026 29/07/2026 29/07/2026 29/07/2026 29/07/2026 29/07/2026 29/07/2026 29/07/2026 29/07/2026 29/07/2026 29/07/2026 29/07/2026 29/07/2026 29/07/2026 29/07/2026 29/07/2026 29/07/2026 29/07/2026 29/07/2026 29/07/2026 29/07/2026
09:50:00 09:50:00 09:50:00 09:50:00 09:50:00 09:50:00 09:50:00 09:50:00 09:50:00 09:50:00 09:50:00 09:50:00 09:50:00 09:50:00 09:50:18 09:50:18 09:50:18 09:50:18 09:50:18 09:50:18 09:50:18 09:50:18 09:50:18 09:50:18 09:50:18 09:50:18 09:50:47 09:50:47 09:50:47 09:50:47 09:50:47 09:50:47 09:50:47 09:50:47 09:50:47 09:50:47 09:50:47 09:50:47 09:50:47 09:50:49 09:50:49 09:50:49 09:50:49 09:50:49 09:51:06 09:51:06 09:51:06 09:51:06 09:51:06 09:51:07 09:51:07
Instrumento Financ./Security
Operación / Transaction
SAB SAB SAB SAB SAB SAB SAB SAB SAB SAB SAB SAB SAB SAB SAB SAB SAB SAB SAB SAB SAB SAB SAB SAB SAB SAB SAB SAB SAB SAB SAB SAB SAB SAB SAB SAB SAB SAB SAB SAB SAB SAB SAB SAB SAB SAB SAB SAB SAB SAB SAB
COMPRA / BUY COMPRA / BUY COMPRA / BUY COMPRA / BUY COMPRA / BUY COMPRA / BUY COMPRA / BUY COMPRA / BUY COMPRA / BUY COMPRA / BUY COMPRA / BUY COMPRA / BUY COMPRA / BUY COMPRA / BUY COMPRA / BUY COMPRA / BUY COMPRA / BUY COMPRA / BUY COMPRA / BUY COMPRA / BUY COMPRA / BUY COMPRA / BUY COMPRA / BUY COMPRA / BUY COMPRA / BUY COMPRA / BUY COMPRA / BUY COMPRA / BUY COMPRA / BUY COMPRA / BUY COMPRA / BUY COMPRA / BUY COMPRA / BUY COMPRA / BUY COMPRA / BUY COMPRA / BUY COMPRA / BUY COMPRA / BUY COMPRA / BUY COMPRA / BUY COMPRA / BUY COMPRA / BUY COMPRA / BUY COMPRA / BUY COMPRA / BUY COMPRA / BUY COMPRA / BUY COMPRA / BUY COMPRA / BUY COMPRA / BUY COMPRA / BUY
Pag. 42
Centro Negociación / Trading Venue CEUX CEUX CEUX CEUX CEUX CEUX CEUX CEUX CEUX CEUX CEUX CEUX CEUX CEUX XMAD XMAD XMAD XMAD XMAD XMAD XMAD XMAD XMAD XMAD XMAD XMAD CEUX CEUX CEUX CEUX CEUX CEUX CEUX CEUX CEUX CEUX CEUX CEUX CEUX XMAD XMAD XMAD XMAD XMAD XMAD XMAD XMAD XMAD XMAD XMAD XMAD
Nº Títulos / Nr. of Precio € / Price shares € 586 1.541 1.541 506 1.035 1.541 1.541 1.541 174 1.367 174 1.541 418 539 2.369 91 2.300 3.846 955 1.544 2.369 899 2.135 899 1.545 1.048 1.219 1.219 1.219 1.219 1.219 1.219 1.219 1.219 1.219 1.219 1.219 1.219 372 2.159 2.200 121 3.658 498 1.544 615 891 1.268 1.183 4.326 1.537
3,2530 3,2530 3,2530 3,2530 3,2530 3,2530 3,2530 3,2530 3,2530 3,2530 3,2530 3,2530 3,2530 3,2530 3,2500 3,2500 3,2500 3,2500 3,2500 3,2500 3,2500 3,2500 3,2500 3,2500 3,2500 3,2500 3,2470 3,2470 3,2470 3,2470 3,2470 3,2470 3,2470 3,2470 3,2470 3,2470 3,2470 3,2470 3,2470 3,2450 3,2450 3,2450 3,2450 3,2450 3,2450 3,2450 3,2450 3,2450 3,2450 3,2450 3,2450
Hora / Trade Fecha / Date Time 29/07/2026 29/07/2026 29/07/2026 29/07/2026 29/07/2026 29/07/2026 29/07/2026 29/07/2026 29/07/2026 29/07/2026 29/07/2026 29/07/2026 29/07/2026 29/07/2026 29/07/2026 29/07/2026 29/07/2026 29/07/2026 29/07/2026 29/07/2026 29/07/2026 29/07/2026 29/07/2026 29/07/2026 29/07/2026 29/07/2026 29/07/2026 29/07/2026 29/07/2026 29/07/2026 29/07/2026 29/07/2026 29/07/2026 29/07/2026 29/07/2026 29/07/2026 29/07/2026 29/07/2026 29/07/2026 29/07/2026 29/07/2026 29/07/2026 29/07/2026 29/07/2026 29/07/2026 29/07/2026 29/07/2026 29/07/2026 29/07/2026 29/07/2026 29/07/2026
09:51:11 09:51:11 09:51:30 09:51:35 09:51:35 09:51:35 09:51:35 09:51:35 09:51:35 09:51:35 09:51:35 09:51:35 09:51:35 09:51:35 09:51:35 09:51:39 09:51:39 09:51:39 09:51:39 09:51:49 09:51:49 09:51:49 09:51:49 09:51:49 09:51:49 09:51:49 09:51:59 09:51:59 09:51:59 09:51:59 09:51:59 09:51:59 09:51:59 09:51:59 09:52:06 09:52:06 09:52:06 09:52:06 09:52:06 09:52:06 09:52:06 09:52:06 09:52:14 09:52:14 09:52:14 09:52:15 09:52:15 09:52:15 09:52:15 09:52:15 09:54:48
Instrumento Financ./Security
Operación / Transaction
SAB SAB SAB SAB SAB SAB SAB SAB SAB SAB SAB SAB SAB SAB SAB SAB SAB SAB SAB SAB SAB SAB SAB SAB SAB SAB SAB SAB SAB SAB SAB SAB SAB SAB SAB SAB SAB SAB SAB SAB SAB SAB SAB SAB SAB SAB SAB SAB SAB SAB SAB
COMPRA / BUY COMPRA / BUY COMPRA / BUY COMPRA / BUY COMPRA / BUY COMPRA / BUY COMPRA / BUY COMPRA / BUY COMPRA / BUY COMPRA / BUY COMPRA / BUY COMPRA / BUY COMPRA / BUY COMPRA / BUY COMPRA / BUY COMPRA / BUY COMPRA / BUY COMPRA / BUY COMPRA / BUY COMPRA / BUY COMPRA / BUY COMPRA / BUY COMPRA / BUY COMPRA / BUY COMPRA / BUY COMPRA / BUY COMPRA / BUY COMPRA / BUY COMPRA / BUY COMPRA / BUY COMPRA / BUY COMPRA / BUY COMPRA / BUY COMPRA / BUY COMPRA / BUY COMPRA / BUY COMPRA / BUY COMPRA / BUY COMPRA / BUY COMPRA / BUY COMPRA / BUY COMPRA / BUY COMPRA / BUY COMPRA / BUY COMPRA / BUY COMPRA / BUY COMPRA / BUY COMPRA / BUY COMPRA / BUY COMPRA / BUY COMPRA / BUY
Pag. 43
Centro Negociación / Trading Venue CEUX CEUX CEUX CEUX CEUX CEUX CEUX CEUX CEUX CEUX CEUX CEUX CEUX CEUX CEUX XMAD XMAD XMAD XMAD CEUX CEUX CEUX CEUX CEUX CEUX CEUX CEUX CEUX CEUX CEUX CEUX CEUX CEUX CEUX XMAD XMAD XMAD XMAD XMAD XMAD XMAD XMAD CEUX CEUX CEUX CEUX CEUX CEUX CEUX CEUX CEUX
Nº Títulos / Nr. of Precio € / Price shares € 297 8 893 1.198 1.198 1.198 1.198 1.198 1.198 1.198 1.198 1.198 1.198 1.198 624 2.357 65 17.040 538 855 107 352 68 605 68 11 1.070 906 1.987 1.987 1.987 1.987 1.987 1.023 2.987 4.386 4.386 51 1.544 3.987 2.600 59 1.166 40 4 666 955 921 806 162 384
3,2430 3,2430 3,2430 3,2430 3,2430 3,2430 3,2430 3,2430 3,2430 3,2430 3,2430 3,2430 3,2430 3,2430 3,2430 3,2400 3,2400 3,2400 3,2400 3,2370 3,2370 3,2370 3,2370 3,2370 3,2370 3,2370 3,2370 3,2370 3,2370 3,2370 3,2370 3,2370 3,2370 3,2370 3,2350 3,2350 3,2350 3,2350 3,2350 3,2350 3,2350 3,2350 3,2330 3,2330 3,2330 3,2330 3,2330 3,2330 3,2330 3,2330 3,2330
Hora / Trade Fecha / Date Time 29/07/2026 29/07/2026 29/07/2026 29/07/2026 29/07/2026 29/07/2026 29/07/2026 29/07/2026 29/07/2026 29/07/2026 29/07/2026 29/07/2026 29/07/2026 29/07/2026 29/07/2026 29/07/2026 29/07/2026 29/07/2026 29/07/2026 29/07/2026 29/07/2026 29/07/2026 29/07/2026 29/07/2026 29/07/2026 29/07/2026 29/07/2026 29/07/2026 29/07/2026 29/07/2026 29/07/2026 29/07/2026 29/07/2026 29/07/2026 29/07/2026 29/07/2026 29/07/2026 29/07/2026 29/07/2026 29/07/2026 29/07/2026 29/07/2026 29/07/2026 29/07/2026 29/07/2026 29/07/2026 29/07/2026 29/07/2026 29/07/2026 29/07/2026 29/07/2026
09:54:48 09:54:48 09:54:48 09:54:48 09:54:48 09:54:49 09:54:52 09:54:52 09:54:52 09:54:52 09:54:52 10:26:31 10:26:31 10:27:13 10:27:13 10:53:47 10:53:47 10:53:47 10:53:47 10:53:47 10:53:51 10:53:51 10:54:03 10:54:03 10:54:03 10:54:03 10:54:03 10:54:03 10:54:20 10:54:20 10:54:25 10:57:16 10:57:16 10:57:16 10:57:16 10:57:16 10:57:16 10:57:16 10:57:16 10:57:16 10:57:16 10:57:16 10:57:16 10:57:16 10:57:16 10:57:16 10:57:16 10:57:16 10:57:16 10:57:16 10:57:16
Instrumento Financ./Security
Operación / Transaction
SAB SAB SAB SAB SAB SAB SAB SAB SAB SAB SAB SAB SAB SAB SAB SAB SAB SAB SAB SAB SAB SAB SAB SAB SAB SAB SAB SAB SAB SAB SAB SAB SAB SAB SAB SAB SAB SAB SAB SAB SAB SAB SAB SAB SAB SAB SAB SAB SAB SAB SAB
COMPRA / BUY COMPRA / BUY COMPRA / BUY COMPRA / BUY COMPRA / BUY COMPRA / BUY COMPRA / BUY COMPRA / BUY COMPRA / BUY COMPRA / BUY COMPRA / BUY COMPRA / BUY COMPRA / BUY COMPRA / BUY COMPRA / BUY COMPRA / BUY COMPRA / BUY COMPRA / BUY COMPRA / BUY COMPRA / BUY COMPRA / BUY COMPRA / BUY COMPRA / BUY COMPRA / BUY COMPRA / BUY COMPRA / BUY COMPRA / BUY COMPRA / BUY COMPRA / BUY COMPRA / BUY COMPRA / BUY COMPRA / BUY COMPRA / BUY COMPRA / BUY COMPRA / BUY COMPRA / BUY COMPRA / BUY COMPRA / BUY COMPRA / BUY COMPRA / BUY COMPRA / BUY COMPRA / BUY COMPRA / BUY COMPRA / BUY COMPRA / BUY COMPRA / BUY COMPRA / BUY COMPRA / BUY COMPRA / BUY COMPRA / BUY COMPRA / BUY
Pag. 44
Centro Negociación / Trading Venue CEUX CEUX CEUX CEUX CEUX CEUX CEUX CEUX CEUX CEUX CEUX XMAD XMAD XMAD XMAD XMAD XMAD XMAD XMAD XMAD XMAD XMAD XMAD XMAD XMAD XMAD XMAD XMAD XMAD XMAD CEUX CEUX CEUX CEUX CEUX CEUX CEUX CEUX CEUX CEUX CEUX CEUX CEUX CEUX CEUX CEUX CEUX CEUX CEUX CEUX CEUX
Nº Títulos / Nr. of Precio € / Price shares € 946 366 3 15 232 1.644 1.876 1.876 1.876 291 771 883 1.276 2.159 15.682 2.159 1.544 2.159 1.544 772 458 2.159 1.544 615 2.159 1.544 1.544 615 615 569 1.198 36 1.162 36 1.198 956 242 424 774 424 350 516 332 516 1.198 1.198 401 797 1.198 1.198 846
3,2330 3,2330 3,2330 3,2330 3,2330 3,2330 3,2330 3,2330 3,2330 3,2330 3,2330 3,2450 3,2450 3,2450 3,2450 3,2450 3,2450 3,2450 3,2450 3,2450 3,2450 3,2450 3,2450 3,2450 3,2450 3,2450 3,2450 3,2450 3,2450 3,2450 3,2430 3,2430 3,2430 3,2430 3,2430 3,2430 3,2430 3,2430 3,2430 3,2430 3,2430 3,2430 3,2430 3,2430 3,2430 3,2430 3,2430 3,2430 3,2430 3,2430 3,2430
Hora / Trade Fecha / Date Time 29/07/2026 29/07/2026 29/07/2026 29/07/2026 29/07/2026 29/07/2026 29/07/2026 29/07/2026 29/07/2026 29/07/2026 29/07/2026 29/07/2026 29/07/2026 29/07/2026 29/07/2026 29/07/2026 29/07/2026 29/07/2026 29/07/2026 29/07/2026 29/07/2026 29/07/2026 29/07/2026 29/07/2026 29/07/2026 29/07/2026 29/07/2026 29/07/2026 29/07/2026 29/07/2026 29/07/2026 29/07/2026 29/07/2026 29/07/2026 29/07/2026 29/07/2026 29/07/2026 29/07/2026 29/07/2026 29/07/2026 29/07/2026 29/07/2026 29/07/2026 29/07/2026 29/07/2026 29/07/2026 29/07/2026 29/07/2026 29/07/2026 29/07/2026 29/07/2026
11:11:12 11:11:12 11:11:12 11:11:12 11:11:12 11:11:12 11:11:12 11:11:12 11:11:12 11:11:12 11:11:12 11:11:13 11:11:13 11:11:13 11:13:55 11:13:55 11:13:55 11:13:55 11:13:55 11:13:55 11:15:08 11:15:08 11:15:08 11:15:08 11:15:08 11:15:08 11:15:21 11:15:21 11:15:21 11:15:21 11:31:50 11:31:50 11:31:50 11:31:50 11:31:50 11:31:50 11:31:50 11:31:50 11:31:50 11:31:50 11:31:50 11:31:50 11:37:06 11:37:06 11:37:06 11:56:55 11:56:55 11:56:55 11:56:55 11:57:01 11:57:04
Instrumento Financ./Security
Operación / Transaction
SAB SAB SAB SAB SAB SAB SAB SAB SAB SAB SAB SAB SAB SAB SAB SAB SAB SAB SAB SAB SAB SAB SAB SAB SAB SAB SAB SAB SAB SAB SAB SAB SAB SAB SAB SAB SAB SAB SAB SAB SAB SAB SAB SAB SAB SAB SAB SAB SAB SAB SAB
COMPRA / BUY COMPRA / BUY COMPRA / BUY COMPRA / BUY COMPRA / BUY COMPRA / BUY COMPRA / BUY COMPRA / BUY COMPRA / BUY COMPRA / BUY COMPRA / BUY COMPRA / BUY COMPRA / BUY COMPRA / BUY COMPRA / BUY COMPRA / BUY COMPRA / BUY COMPRA / BUY COMPRA / BUY COMPRA / BUY COMPRA / BUY COMPRA / BUY COMPRA / BUY COMPRA / BUY COMPRA / BUY COMPRA / BUY COMPRA / BUY COMPRA / BUY COMPRA / BUY COMPRA / BUY COMPRA / BUY COMPRA / BUY COMPRA / BUY COMPRA / BUY COMPRA / BUY COMPRA / BUY COMPRA / BUY COMPRA / BUY COMPRA / BUY COMPRA / BUY COMPRA / BUY COMPRA / BUY COMPRA / BUY COMPRA / BUY COMPRA / BUY COMPRA / BUY COMPRA / BUY COMPRA / BUY COMPRA / BUY COMPRA / BUY COMPRA / BUY
Pag. 45
Centro Negociación / Trading Venue XMAD XMAD XMAD XMAD XMAD XMAD XMAD XMAD XMAD XMAD XMAD XMAD XMAD XMAD CEUX CEUX CEUX CEUX CEUX CEUX CEUX CEUX CEUX CEUX CEUX CEUX CEUX CEUX CEUX CEUX XMAD XMAD XMAD XMAD XMAD XMAD XMAD XMAD XMAD XMAD XMAD XMAD XMAD XMAD XMAD XMAD XMAD XMAD XMAD XMAD XMAD
Nº Títulos / Nr. of Precio € / Price shares € 2.357 1.383 1.544 1.544 1.544 1.544 974 895 8 2.349 1.891 466 2.357 1.144 14 1.973 1.987 1.987 5 1.982 573 841 573 501 1.486 848 1.139 519 519 53 340 2.029 2.369 2.369 2.369 1.544 2.369 899 899 2.220 2.369 224 2.143 844 17.013 2.159 2.598 79 1.720 6 4.316
3,2400 3,2400 3,2400 3,2400 3,2400 3,2400 3,2400 3,2400 3,2400 3,2400 3,2400 3,2400 3,2400 3,2400 3,2370 3,2370 3,2370 3,2370 3,2370 3,2370 3,2370 3,2370 3,2370 3,2370 3,2370 3,2370 3,2370 3,2370 3,2370 3,2370 3,2400 3,2400 3,2400 3,2400 3,2400 3,2400 3,2400 3,2400 3,2400 3,2400 3,2400 3,2400 3,2350 3,2350 3,2350 3,2450 3,2450 3,2450 3,2450 3,2450 3,2450
Hora / Trade Fecha / Date Time 29/07/2026 29/07/2026 29/07/2026 29/07/2026 29/07/2026 29/07/2026 29/07/2026 29/07/2026 29/07/2026 29/07/2026 29/07/2026 29/07/2026 29/07/2026 29/07/2026 29/07/2026 29/07/2026 29/07/2026 29/07/2026 29/07/2026 29/07/2026 29/07/2026 29/07/2026 29/07/2026 29/07/2026 29/07/2026 29/07/2026 29/07/2026 29/07/2026 29/07/2026 29/07/2026 29/07/2026 29/07/2026 29/07/2026 29/07/2026 29/07/2026 29/07/2026 29/07/2026 29/07/2026 29/07/2026 29/07/2026 29/07/2026 29/07/2026 29/07/2026 29/07/2026 29/07/2026 29/07/2026 29/07/2026 29/07/2026 29/07/2026 29/07/2026 29/07/2026
11:57:04 11:57:04 11:57:04 11:57:04 11:57:04 11:58:10 11:58:10 11:58:10 11:58:10 11:58:10 11:58:10 11:58:10 11:58:10 11:58:10 11:58:10 11:58:10 11:58:10 11:58:14 11:58:14 11:58:14 12:05:06 12:05:43 12:05:43 12:05:43 12:05:52 12:05:52 12:05:52 12:05:52 12:05:53 12:05:53 12:05:53 12:05:53 12:06:47 12:06:48 12:06:48 12:06:48 12:06:48 12:06:48 12:24:00 12:24:00 12:31:14 12:31:14 12:31:14 12:31:24 12:31:24 12:31:24 12:32:52 12:32:52 12:32:52 12:32:52 12:32:52
Instrumento Financ./Security
Operación / Transaction
SAB SAB SAB SAB SAB SAB SAB SAB SAB SAB SAB SAB SAB SAB SAB SAB SAB SAB SAB SAB SAB SAB SAB SAB SAB SAB SAB SAB SAB SAB SAB SAB SAB SAB SAB SAB SAB SAB SAB SAB SAB SAB SAB SAB SAB SAB SAB SAB SAB SAB SAB
COMPRA / BUY COMPRA / BUY COMPRA / BUY COMPRA / BUY COMPRA / BUY COMPRA / BUY COMPRA / BUY COMPRA / BUY COMPRA / BUY COMPRA / BUY COMPRA / BUY COMPRA / BUY COMPRA / BUY COMPRA / BUY COMPRA / BUY COMPRA / BUY COMPRA / BUY COMPRA / BUY COMPRA / BUY COMPRA / BUY COMPRA / BUY COMPRA / BUY COMPRA / BUY COMPRA / BUY COMPRA / BUY COMPRA / BUY COMPRA / BUY COMPRA / BUY COMPRA / BUY COMPRA / BUY COMPRA / BUY COMPRA / BUY COMPRA / BUY COMPRA / BUY COMPRA / BUY COMPRA / BUY COMPRA / BUY COMPRA / BUY COMPRA / BUY COMPRA / BUY COMPRA / BUY COMPRA / BUY COMPRA / BUY COMPRA / BUY COMPRA / BUY COMPRA / BUY COMPRA / BUY COMPRA / BUY COMPRA / BUY COMPRA / BUY COMPRA / BUY
Pag. 46
Centro Negociación / Trading Venue XMAD XMAD XMAD XMAD XMAD CEUX CEUX CEUX CEUX CEUX CEUX CEUX CEUX CEUX CEUX CEUX CEUX CEUX CEUX CEUX XMAD XMAD XMAD XMAD XMAD XMAD XMAD XMAD XMAD XMAD XMAD XMAD XMAD XMAD XMAD XMAD XMAD XMAD XMAD XMAD XMAD XMAD XMAD XMAD XMAD XMAD XMAD XMAD XMAD XMAD XMAD
Nº Títulos / Nr. of Precio € / Price shares € 2.076 1.889 899 3.408 850 1.198 1.198 1.198 1.198 1.198 1.198 1.198 1.198 1.198 1.198 62 87 1.049 1.198 624 2.369 2.369 3.100 1.638 2.365 4 2.800 1.856 82 1.544 772 1.101 2.357 5.823 1.544 899 899 8.478 4.434 7.529 991 2.216 2.159 2.102 102 467 2.159 2.700 2.159 1.618 1.618
3,2450 3,2450 3,2450 3,2450 3,2450 3,2430 3,2430 3,2430 3,2430 3,2430 3,2430 3,2430 3,2430 3,2430 3,2430 3,2430 3,2430 3,2430 3,2430 3,2430 3,2420 3,2420 3,2420 3,2420 3,2420 3,2420 3,2420 3,2420 3,2420 3,2420 3,2420 3,2420 3,2400 3,2400 3,2400 3,2400 3,2400 3,2400 3,2450 3,2450 3,2500 3,2500 3,2500 3,2500 3,2500 3,2500 3,2480 3,2480 3,2480 3,2480 3,2480
Hora / Trade Fecha / Date Time 29/07/2026 29/07/2026 29/07/2026 29/07/2026 29/07/2026 29/07/2026 29/07/2026 29/07/2026 29/07/2026 29/07/2026 29/07/2026 29/07/2026 29/07/2026 29/07/2026 29/07/2026 29/07/2026 29/07/2026 29/07/2026 29/07/2026 29/07/2026 29/07/2026 29/07/2026 29/07/2026 29/07/2026 29/07/2026 29/07/2026 29/07/2026 29/07/2026 29/07/2026 29/07/2026 29/07/2026 29/07/2026 29/07/2026 29/07/2026 29/07/2026 29/07/2026 29/07/2026 29/07/2026 29/07/2026 29/07/2026 29/07/2026 29/07/2026 29/07/2026 29/07/2026 29/07/2026 29/07/2026 29/07/2026 29/07/2026 29/07/2026 29/07/2026 29/07/2026
12:32:52 12:32:52 12:32:52 12:32:52 12:32:52 12:43:29 12:43:29 12:43:29 12:43:29 12:43:29 12:43:29 12:46:37 12:46:37 12:46:37 12:48:25 12:48:25 12:48:25 12:48:25 12:48:25 12:49:36 12:49:36 12:49:36 12:49:36 12:49:36 12:49:36 12:49:36 12:49:36 12:52:35 12:53:03 12:53:03 12:53:03 12:53:03 12:53:03 12:53:03 12:53:03 12:53:03 12:53:03 12:53:30 12:53:30 12:53:30 13:15:01 13:15:01 13:15:01 13:15:42 13:15:42 13:15:51 13:15:53 13:15:53 13:15:53 13:15:53 13:15:53
Instrumento Financ./Security
Operación / Transaction
SAB SAB SAB SAB SAB SAB SAB SAB SAB SAB SAB SAB SAB SAB SAB SAB SAB SAB SAB SAB SAB SAB SAB SAB SAB SAB SAB SAB SAB SAB SAB SAB SAB SAB SAB SAB SAB SAB SAB SAB SAB SAB SAB SAB SAB SAB SAB SAB SAB SAB SAB
COMPRA / BUY COMPRA / BUY COMPRA / BUY COMPRA / BUY COMPRA / BUY COMPRA / BUY COMPRA / BUY COMPRA / BUY COMPRA / BUY COMPRA / BUY COMPRA / BUY COMPRA / BUY COMPRA / BUY COMPRA / BUY COMPRA / BUY COMPRA / BUY COMPRA / BUY COMPRA / BUY COMPRA / BUY COMPRA / BUY COMPRA / BUY COMPRA / BUY COMPRA / BUY COMPRA / BUY COMPRA / BUY COMPRA / BUY COMPRA / BUY COMPRA / BUY COMPRA / BUY COMPRA / BUY COMPRA / BUY COMPRA / BUY COMPRA / BUY COMPRA / BUY COMPRA / BUY COMPRA / BUY COMPRA / BUY COMPRA / BUY COMPRA / BUY COMPRA / BUY COMPRA / BUY COMPRA / BUY COMPRA / BUY COMPRA / BUY COMPRA / BUY COMPRA / BUY COMPRA / BUY COMPRA / BUY COMPRA / BUY COMPRA / BUY COMPRA / BUY
Pag. 47
Centro Negociación / Trading Venue XMAD XMAD XMAD XMAD XMAD XMAD XMAD XMAD XMAD XMAD XMAD XMAD XMAD XMAD XMAD XMAD XMAD XMAD XMAD XMAD XMAD XMAD XMAD XMAD XMAD XMAD XMAD XMAD XMAD XMAD XMAD XMAD XMAD XMAD XMAD XMAD XMAD XMAD XMAD XMAD XMAD XMAD XMAD XMAD XMAD XMAD XMAD XMAD XMAD XMAD XMAD
Nº Títulos / Nr. of Precio € / Price shares € 306 4.461 1.591 2.251 1.137 2.159 2.100 3.288 2.159 5.602 1.964 2.159 392 177 2.432 2.432 2.432 2.316 1.068 672 772 808 1.484 1.484 1.484 1.660 956 2.369 2.369 2.328 41 3.625 1.113 2.369 1.458 2.316 2.012 2.357 14.446 3.197 2.369 2.369 2.369 2.369 1.544 825 2.369 2.369 2.369 110 938
3,2480 3,2480 3,2480 3,2480 3,2480 3,2500 3,2500 3,2500 3,2500 3,2500 3,2500 3,2500 3,2500 3,2500 3,2450 3,2450 3,2450 3,2450 3,2450 3,2450 3,2450 3,2450 3,2450 3,2450 3,2450 3,2450 3,2450 3,2420 3,2420 3,2420 3,2420 3,2420 3,2420 3,2420 3,2420 3,2420 3,2420 3,2400 3,2400 3,2400 3,2420 3,2420 3,2420 3,2420 3,2420 3,2420 3,2420 3,2420 3,2420 3,2420 3,2420
Hora / Trade Fecha / Date Time 29/07/2026 29/07/2026 29/07/2026 29/07/2026 29/07/2026 29/07/2026 29/07/2026 29/07/2026 29/07/2026 29/07/2026 29/07/2026 29/07/2026 29/07/2026 29/07/2026 29/07/2026 29/07/2026 29/07/2026 29/07/2026 29/07/2026 29/07/2026 29/07/2026 29/07/2026 29/07/2026 29/07/2026 29/07/2026 29/07/2026 29/07/2026 29/07/2026 29/07/2026 29/07/2026 29/07/2026 29/07/2026 29/07/2026 29/07/2026 29/07/2026 29/07/2026 29/07/2026 29/07/2026 29/07/2026 29/07/2026 29/07/2026 29/07/2026 29/07/2026 29/07/2026 29/07/2026 29/07/2026 29/07/2026 29/07/2026 29/07/2026 29/07/2026 29/07/2026
13:17:35 13:17:35 13:17:35 13:20:28 13:37:46 13:37:46 13:37:46 13:37:46 13:37:46 13:37:46 13:37:46 13:37:46 13:37:46 13:37:46 13:37:46 13:37:46 13:37:46 13:37:46 13:37:46 13:37:46 13:37:46 13:37:46 13:37:46 13:37:46 13:37:46 13:37:46 13:37:46 13:37:46 13:37:46 13:37:46 13:37:46 13:37:55 13:37:55 13:37:55 13:37:55 13:37:55 13:37:55 13:37:55 13:37:55 13:37:55 13:37:55 14:05:47 14:06:45 14:06:45 14:06:45 14:06:45 14:06:45 14:06:45 14:06:45 14:06:45 14:06:45
Instrumento Financ./Security
Operación / Transaction
SAB SAB SAB SAB SAB SAB SAB SAB SAB SAB SAB SAB SAB SAB SAB SAB SAB SAB SAB SAB SAB SAB SAB SAB SAB SAB SAB SAB SAB SAB SAB SAB SAB SAB SAB SAB SAB SAB SAB SAB SAB SAB SAB SAB SAB SAB SAB SAB SAB SAB SAB
COMPRA / BUY COMPRA / BUY COMPRA / BUY COMPRA / BUY COMPRA / BUY COMPRA / BUY COMPRA / BUY COMPRA / BUY COMPRA / BUY COMPRA / BUY COMPRA / BUY COMPRA / BUY COMPRA / BUY COMPRA / BUY COMPRA / BUY COMPRA / BUY COMPRA / BUY COMPRA / BUY COMPRA / BUY COMPRA / BUY COMPRA / BUY COMPRA / BUY COMPRA / BUY COMPRA / BUY COMPRA / BUY COMPRA / BUY COMPRA / BUY COMPRA / BUY COMPRA / BUY COMPRA / BUY COMPRA / BUY COMPRA / BUY COMPRA / BUY COMPRA / BUY COMPRA / BUY COMPRA / BUY COMPRA / BUY COMPRA / BUY COMPRA / BUY COMPRA / BUY COMPRA / BUY COMPRA / BUY COMPRA / BUY COMPRA / BUY COMPRA / BUY COMPRA / BUY COMPRA / BUY COMPRA / BUY COMPRA / BUY COMPRA / BUY COMPRA / BUY
Pag. 48
Centro Negociación / Trading Venue XMAD XMAD XMAD XMAD XMAD XMAD XMAD XMAD XMAD XMAD XMAD XMAD XMAD XMAD XMAD XMAD XMAD XMAD XMAD XMAD XMAD XMAD XMAD XMAD XMAD XMAD XMAD XMAD XMAD XMAD XMAD CEUX CEUX CEUX CEUX CEUX CEUX CEUX CEUX CEUX CEUX XMAD XMAD XMAD XMAD XMAD XMAD XMAD XMAD XMAD XMAD
Nº Títulos / Nr. of Precio € / Price shares € 770 1.587 17.643 25.000 2.147 914 2.147 2.869 4.294 3.759 899 704 195 1.443 101 2.441 4.217 1.853 1.858 2.147 301 2.159 2.147 12 2.147 2.147 12 1.590 557 569 1.371 1.987 1.987 1.987 1.987 1.987 359 1.987 79 1.987 653 3.703 615 360 2.886 3.864 2.400 2.159 1.285 1.285 2.159
3,2400 3,2400 3,2400 3,2380 3,2380 3,2380 3,2380 3,2380 3,2380 3,2380 3,2380 3,2380 3,2380 3,2380 3,2380 3,2380 3,2380 3,2380 3,2380 3,2380 3,2380 3,2380 3,2380 3,2380 3,2380 3,2380 3,2380 3,2380 3,2380 3,2380 3,2380 3,2370 3,2370 3,2370 3,2370 3,2370 3,2370 3,2370 3,2370 3,2370 3,2370 3,2480 3,2480 3,2480 3,2480 3,2480 3,2480 3,2480 3,2480 3,2480 3,2480
Hora / Trade Fecha / Date Time 29/07/2026 29/07/2026 29/07/2026 29/07/2026 29/07/2026 29/07/2026 29/07/2026 29/07/2026 29/07/2026 29/07/2026 29/07/2026 29/07/2026 29/07/2026 29/07/2026 29/07/2026 29/07/2026 29/07/2026 29/07/2026 29/07/2026 29/07/2026 29/07/2026 29/07/2026 29/07/2026 29/07/2026 29/07/2026 29/07/2026 29/07/2026 29/07/2026 29/07/2026 29/07/2026 29/07/2026 29/07/2026 29/07/2026 29/07/2026 29/07/2026 29/07/2026 29/07/2026 29/07/2026 29/07/2026 29/07/2026 29/07/2026 29/07/2026 29/07/2026 29/07/2026 29/07/2026 29/07/2026 29/07/2026 29/07/2026 29/07/2026 29/07/2026 29/07/2026
14:06:45 14:06:45 14:06:45 14:06:55 14:06:55 14:06:55 14:06:55 14:06:55 14:06:55 14:06:55 14:06:55 14:06:55 14:06:55 14:06:55 14:06:55 14:06:55 14:06:55 14:06:55 14:06:55 14:06:55 14:07:13 14:07:13 14:07:39 14:07:39 14:09:30 14:09:30 14:09:30 14:09:30 14:09:30 14:09:30 14:09:30 14:14:32 14:14:32 14:14:32 14:14:32 14:14:32 14:14:32 14:14:32 14:16:22 14:16:22 14:16:22 14:16:22 14:16:26 14:16:26 14:16:26 14:16:26 14:16:26 14:16:26 14:16:26 14:16:26 14:16:26
Instrumento Financ./Security
Operación / Transaction
SAB SAB SAB SAB SAB SAB SAB SAB SAB SAB SAB SAB SAB SAB SAB SAB SAB SAB SAB SAB SAB SAB SAB SAB SAB SAB SAB SAB SAB SAB SAB SAB SAB SAB SAB SAB SAB SAB SAB SAB SAB SAB SAB SAB SAB SAB SAB SAB SAB SAB SAB
COMPRA / BUY COMPRA / BUY COMPRA / BUY COMPRA / BUY COMPRA / BUY COMPRA / BUY COMPRA / BUY COMPRA / BUY COMPRA / BUY COMPRA / BUY COMPRA / BUY COMPRA / BUY COMPRA / BUY COMPRA / BUY COMPRA / BUY COMPRA / BUY COMPRA / BUY COMPRA / BUY COMPRA / BUY COMPRA / BUY COMPRA / BUY COMPRA / BUY COMPRA / BUY COMPRA / BUY COMPRA / BUY COMPRA / BUY COMPRA / BUY COMPRA / BUY COMPRA / BUY COMPRA / BUY COMPRA / BUY COMPRA / BUY COMPRA / BUY COMPRA / BUY COMPRA / BUY COMPRA / BUY COMPRA / BUY COMPRA / BUY COMPRA / BUY COMPRA / BUY COMPRA / BUY COMPRA / BUY COMPRA / BUY COMPRA / BUY COMPRA / BUY COMPRA / BUY COMPRA / BUY COMPRA / BUY COMPRA / BUY COMPRA / BUY COMPRA / BUY
Pag. 49
Centro Negociación / Trading Venue XMAD XMAD XMAD CEUX CEUX CEUX CEUX CEUX CEUX CEUX CEUX CEUX CEUX CEUX CEUX CEUX CEUX CEUX CEUX CEUX XMAD XMAD XMAD XMAD XMAD XMAD XMAD XMAD XMAD XMAD XMAD XMAD XMAD XMAD XMAD XMAD XMAD XMAD CEUX CEUX CEUX CEUX CEUX CEUX CEUX CEUX CEUX CEUX CEUX CEUX CEUX
Nº Títulos / Nr. of Precio € / Price shares € 2.373 1.283 628 1.219 17 1.202 1.219 1.219 1.219 167 1.219 976 1.219 1.219 1.219 1.219 1.032 187 219 229 2.151 8 1.344 815 2.159 978 3.864 2.159 899 10.237 386 2.159 5.382 3.519 899 899 8.609 3.533 1.198 1.198 571 1.198 1.198 1.198 1.198 592 1.198 1.198 1.032 166 853
3,2480 3,2480 3,2480 3,2470 3,2470 3,2470 3,2470 3,2470 3,2470 3,2470 3,2470 3,2470 3,2470 3,2470 3,2470 3,2470 3,2470 3,2470 3,2470 3,2470 3,2450 3,2450 3,2450 3,2450 3,2450 3,2450 3,2450 3,2450 3,2450 3,2450 3,2450 3,2450 3,2450 3,2450 3,2450 3,2450 3,2450 3,2450 3,2430 3,2430 3,2430 3,2430 3,2430 3,2430 3,2430 3,2430 3,2430 3,2430 3,2430 3,2430 3,2430
Hora / Trade Fecha / Date Time 29/07/2026 29/07/2026 29/07/2026 29/07/2026 29/07/2026 29/07/2026 29/07/2026 29/07/2026 29/07/2026 29/07/2026 29/07/2026 29/07/2026 29/07/2026 29/07/2026 29/07/2026 29/07/2026 29/07/2026 29/07/2026 29/07/2026 29/07/2026 29/07/2026 29/07/2026 29/07/2026 29/07/2026 29/07/2026 29/07/2026 29/07/2026 29/07/2026 29/07/2026 29/07/2026 29/07/2026 29/07/2026 29/07/2026 29/07/2026 29/07/2026 29/07/2026 29/07/2026 29/07/2026 29/07/2026 29/07/2026 29/07/2026 29/07/2026 29/07/2026 29/07/2026 29/07/2026 29/07/2026 29/07/2026 29/07/2026 29/07/2026 29/07/2026 29/07/2026
14:16:26 14:16:26 14:16:26 14:16:26 14:16:26 14:16:26 14:16:26 14:16:26 14:16:26 14:16:26 14:16:32 14:16:32 14:16:32 14:16:32 14:16:32 14:16:32 14:16:32 14:16:32 14:16:32 14:16:32 14:16:32 14:16:32 14:17:03 14:17:03 14:17:32 14:17:32 14:17:32 14:17:32 14:17:32 14:17:32 14:17:32 14:17:32 14:17:32 14:17:32 14:17:32 14:17:32 14:17:32 14:17:32 14:17:32 14:17:32 14:17:32 14:17:32 14:17:32 14:17:32 14:17:32 14:17:32 14:17:33 14:17:33 14:30:08 14:30:08 14:30:08
Instrumento Financ./Security
Operación / Transaction
SAB SAB SAB SAB SAB SAB SAB SAB SAB SAB SAB SAB SAB SAB SAB SAB SAB SAB SAB SAB SAB SAB SAB SAB SAB SAB SAB SAB SAB SAB SAB SAB SAB SAB SAB SAB SAB SAB SAB SAB SAB SAB SAB SAB SAB SAB SAB SAB SAB SAB SAB
COMPRA / BUY COMPRA / BUY COMPRA / BUY COMPRA / BUY COMPRA / BUY COMPRA / BUY COMPRA / BUY COMPRA / BUY COMPRA / BUY COMPRA / BUY COMPRA / BUY COMPRA / BUY COMPRA / BUY COMPRA / BUY COMPRA / BUY COMPRA / BUY COMPRA / BUY COMPRA / BUY COMPRA / BUY COMPRA / BUY COMPRA / BUY COMPRA / BUY COMPRA / BUY COMPRA / BUY COMPRA / BUY COMPRA / BUY COMPRA / BUY COMPRA / BUY COMPRA / BUY COMPRA / BUY COMPRA / BUY COMPRA / BUY COMPRA / BUY COMPRA / BUY COMPRA / BUY COMPRA / BUY COMPRA / BUY COMPRA / BUY COMPRA / BUY COMPRA / BUY COMPRA / BUY COMPRA / BUY COMPRA / BUY COMPRA / BUY COMPRA / BUY COMPRA / BUY COMPRA / BUY COMPRA / BUY COMPRA / BUY COMPRA / BUY COMPRA / BUY
Pag. 50
Centro Negociación / Trading Venue CEUX CEUX CEUX XMAD XMAD XMAD XMAD XMAD XMAD XMAD XMAD XMAD XMAD XMAD XMAD XMAD XMAD XMAD XMAD XMAD XMAD XMAD XMAD XMAD XMAD XMAD XMAD XMAD XMAD XMAD XMAD XMAD XMAD XMAD XMAD XMAD XMAD XMAD XMAD XMAD XMAD XMAD XMAD XMAD XMAD XMAD XMAD XMAD XMAD XMAD XMAD
Nº Títulos / Nr. of Precio € / Price shares € 1.032 166 1.004 1.883 733 2.248 899 899 152 2.122 540 2.340 48 899 899 552 1.544 1.422 899 899 825 197 2.357 27.643 734 1.425 1.012 1.544 2.159 1.147 1.544 1.544 1.544 610 1.850 1.850 899 899 1.296 772 2.260 772 301 899 1.898 899 209 1.933 2.357 4.632 5.000
3,2430 3,2430 3,2430 3,2420 3,2420 3,2420 3,2420 3,2420 3,2420 3,2420 3,2420 3,2420 3,2420 3,2420 3,2420 3,2420 3,2420 3,2420 3,2420 3,2420 3,2420 3,2420 3,2400 3,2400 3,2380 3,2380 3,2380 3,2380 3,2380 3,2380 3,2380 3,2380 3,2380 3,2380 3,2380 3,2380 3,2380 3,2380 3,2380 3,2380 3,2380 3,2380 3,2380 3,2380 3,2380 3,2380 3,2380 3,2380 3,2400 3,2400 3,2400
Hora / Trade Fecha / Date Time 29/07/2026 29/07/2026 29/07/2026 29/07/2026 29/07/2026 29/07/2026 29/07/2026 29/07/2026 29/07/2026 29/07/2026 29/07/2026 29/07/2026 29/07/2026 29/07/2026 29/07/2026 29/07/2026 29/07/2026 29/07/2026 29/07/2026 29/07/2026 29/07/2026 29/07/2026 29/07/2026 29/07/2026 29/07/2026 29/07/2026 29/07/2026 29/07/2026 29/07/2026 29/07/2026 29/07/2026 29/07/2026 29/07/2026 29/07/2026 29/07/2026 29/07/2026 29/07/2026 29/07/2026 29/07/2026 29/07/2026 29/07/2026 29/07/2026 29/07/2026 29/07/2026 29/07/2026 29/07/2026 29/07/2026 29/07/2026 29/07/2026 29/07/2026 29/07/2026
14:30:08 14:30:08 14:30:08 14:30:08 14:30:08 14:32:14 14:32:14 14:32:14 14:32:14 14:32:14 14:32:14 14:32:14 14:32:21 14:43:15 14:43:15 14:43:15 14:43:15 14:43:15 14:43:15 14:43:15 14:43:15 14:43:15 14:43:15 14:43:15 14:43:15 14:43:15 14:43:15 14:44:13 14:44:13 14:44:13 14:44:13 14:44:13 14:44:13 14:44:13 14:44:13 14:44:13 14:44:18 14:44:18 14:44:18 14:46:38 14:46:38 14:46:38 14:46:38 14:46:38 14:46:38 14:46:49 14:46:49 14:46:49 14:46:49 14:46:49 15:00:22
Instrumento Financ./Security
Operación / Transaction
SAB SAB SAB SAB SAB SAB SAB SAB SAB SAB SAB SAB SAB SAB SAB SAB SAB SAB SAB SAB SAB SAB SAB SAB SAB SAB SAB SAB SAB SAB SAB SAB SAB SAB SAB SAB SAB SAB SAB SAB SAB SAB SAB SAB SAB SAB SAB SAB SAB SAB SAB
COMPRA / BUY COMPRA / BUY COMPRA / BUY COMPRA / BUY COMPRA / BUY COMPRA / BUY COMPRA / BUY COMPRA / BUY COMPRA / BUY COMPRA / BUY COMPRA / BUY COMPRA / BUY COMPRA / BUY COMPRA / BUY COMPRA / BUY COMPRA / BUY COMPRA / BUY COMPRA / BUY COMPRA / BUY COMPRA / BUY COMPRA / BUY COMPRA / BUY COMPRA / BUY COMPRA / BUY COMPRA / BUY COMPRA / BUY COMPRA / BUY COMPRA / BUY COMPRA / BUY COMPRA / BUY COMPRA / BUY COMPRA / BUY COMPRA / BUY COMPRA / BUY COMPRA / BUY COMPRA / BUY COMPRA / BUY COMPRA / BUY COMPRA / BUY COMPRA / BUY COMPRA / BUY COMPRA / BUY COMPRA / BUY COMPRA / BUY COMPRA / BUY COMPRA / BUY COMPRA / BUY COMPRA / BUY COMPRA / BUY COMPRA / BUY COMPRA / BUY
Pag. 51
Centro Negociación / Trading Venue XMAD XMAD XMAD XMAD XMAD XMAD XMAD XMAD XMAD XMAD XMAD XMAD XMAD XMAD XMAD XMAD XMAD XMAD XMAD XMAD XMAD XMAD XMAD XMAD CEUX CEUX CEUX CEUX CEUX CEUX CEUX CEUX CEUX CEUX CEUX CEUX CEUX CEUX CEUX XMAD XMAD XMAD XMAD XMAD XMAD XMAD XMAD XMAD XMAD XMAD XMAD
Nº Títulos / Nr. of Precio € / Price shares € 672 2.357 2.357 2.357 5.268 734 2.159 2.010 1.425 772 1 2.159 1.535 2.159 1.544 2.159 1.296 1.544 615 1.478 1.478 681 772 479 3 1.984 1.987 1.987 776 1.211 627 435 1.309 243 606 40 1.341 1.987 464 2.987 11.518 3.088 133 1.544 1.639 2.987 2.987 2.844 143 130 2.159
3,2400 3,2400 3,2400 3,2400 3,2400 3,2380 3,2380 3,2380 3,2380 3,2380 3,2380 3,2380 3,2380 3,2380 3,2380 3,2380 3,2380 3,2380 3,2380 3,2380 3,2380 3,2380 3,2380 3,2380 3,2370 3,2370 3,2370 3,2370 3,2370 3,2370 3,2370 3,2370 3,2370 3,2370 3,2370 3,2370 3,2370 3,2370 3,2370 3,2350 3,2350 3,2350 3,2350 3,2350 3,2350 3,2350 3,2350 3,2350 3,2350 3,2350 3,2380
Hora / Trade Fecha / Date Time 29/07/2026 29/07/2026 29/07/2026 29/07/2026 29/07/2026 29/07/2026 29/07/2026 29/07/2026 29/07/2026 29/07/2026 29/07/2026 29/07/2026 29/07/2026 29/07/2026 29/07/2026 29/07/2026 29/07/2026 29/07/2026 29/07/2026 29/07/2026 29/07/2026 29/07/2026 29/07/2026 29/07/2026 29/07/2026 29/07/2026 29/07/2026 29/07/2026 29/07/2026 29/07/2026 29/07/2026 29/07/2026 29/07/2026 29/07/2026 29/07/2026 29/07/2026 29/07/2026 29/07/2026 29/07/2026 29/07/2026 29/07/2026 29/07/2026 29/07/2026 29/07/2026 29/07/2026 29/07/2026 29/07/2026 29/07/2026 29/07/2026 29/07/2026 29/07/2026
15:00:22 15:00:22 15:00:22 15:00:22 15:00:22 15:00:22 15:00:24 15:00:24 15:00:24 15:00:24 15:00:24 15:00:24 15:00:24 15:00:24 15:00:24 15:00:24 15:00:25 15:00:25 15:00:25 15:00:25 15:00:25 15:00:25 15:00:25 15:00:25 15:00:25 15:00:25 15:02:02 15:02:02 15:02:02 15:02:02 15:02:02 15:02:02 15:02:02 15:02:52 15:02:52 15:02:52 15:02:52 15:03:13 15:03:13 15:03:15 15:03:15 15:03:15 15:03:15 15:03:15 15:03:15 15:03:15 15:03:15 15:03:15 15:03:41 15:04:16 15:04:16
Instrumento Financ./Security
Operación / Transaction
SAB SAB SAB SAB SAB SAB SAB SAB SAB SAB SAB SAB SAB SAB SAB SAB SAB SAB SAB SAB SAB SAB SAB SAB SAB SAB SAB SAB SAB SAB SAB SAB SAB SAB SAB SAB SAB SAB SAB SAB SAB SAB SAB SAB SAB SAB SAB SAB SAB SAB SAB
COMPRA / BUY COMPRA / BUY COMPRA / BUY COMPRA / BUY COMPRA / BUY COMPRA / BUY COMPRA / BUY COMPRA / BUY COMPRA / BUY COMPRA / BUY COMPRA / BUY COMPRA / BUY COMPRA / BUY COMPRA / BUY COMPRA / BUY COMPRA / BUY COMPRA / BUY COMPRA / BUY COMPRA / BUY COMPRA / BUY COMPRA / BUY COMPRA / BUY COMPRA / BUY COMPRA / BUY COMPRA / BUY COMPRA / BUY COMPRA / BUY COMPRA / BUY COMPRA / BUY COMPRA / BUY COMPRA / BUY COMPRA / BUY COMPRA / BUY COMPRA / BUY COMPRA / BUY COMPRA / BUY COMPRA / BUY COMPRA / BUY COMPRA / BUY COMPRA / BUY COMPRA / BUY COMPRA / BUY COMPRA / BUY COMPRA / BUY COMPRA / BUY COMPRA / BUY COMPRA / BUY COMPRA / BUY COMPRA / BUY COMPRA / BUY COMPRA / BUY
Pag. 52
Centro Negociación / Trading Venue XMAD XMAD XMAD XMAD XMAD XMAD XMAD XMAD XMAD XMAD XMAD XMAD XMAD XMAD XMAD XMAD CEUX CEUX CEUX CEUX CEUX CEUX CEUX CEUX CEUX CEUX XMAD XMAD XMAD XMAD XMAD XMAD XMAD XMAD XMAD XMAD XMAD CEUX CEUX CEUX CEUX CEUX CEUX CEUX CEUX CEUX CEUX CEUX XMAD CEUX CEUX
Nº Títulos / Nr. of Precio € / Price shares € 1.544 756 615 1.544 615 772 631 2.159 2.159 2.159 1.544 2.159 2.159 1.544 899 1.582 1.987 1.987 1.987 1.987 1.806 181 1.806 1.311 676 1.272 2.987 1.658 899 899 4.290 1.215 245 2.742 43 2.944 2.078 1.876 63 1.813 1.876 1.876 556 353 1.523 1.876 1.876 1.312 30.000 1.432 1.432
3,2380 3,2380 3,2380 3,2380 3,2380 3,2380 3,2380 3,2380 3,2380 3,2380 3,2380 3,2380 3,2380 3,2380 3,2380 3,2380 3,2370 3,2370 3,2370 3,2370 3,2370 3,2370 3,2370 3,2370 3,2370 3,2370 3,2350 3,2350 3,2350 3,2350 3,2350 3,2350 3,2350 3,2350 3,2350 3,2350 3,2350 3,2330 3,2330 3,2330 3,2330 3,2330 3,2330 3,2330 3,2330 3,2330 3,2330 3,2330 3,2300 3,2270 3,2270
Hora / Trade Fecha / Date Time 29/07/2026 29/07/2026 29/07/2026 29/07/2026 29/07/2026 29/07/2026 29/07/2026 29/07/2026 29/07/2026 29/07/2026 29/07/2026 29/07/2026 29/07/2026 29/07/2026 29/07/2026 29/07/2026 29/07/2026 29/07/2026 29/07/2026 29/07/2026 29/07/2026 29/07/2026 29/07/2026 29/07/2026 29/07/2026 29/07/2026 29/07/2026 29/07/2026 29/07/2026 29/07/2026 29/07/2026 29/07/2026 29/07/2026 29/07/2026 29/07/2026 29/07/2026 29/07/2026 29/07/2026 29/07/2026 29/07/2026 29/07/2026 29/07/2026 29/07/2026 29/07/2026 29/07/2026 29/07/2026 29/07/2026 29/07/2026 29/07/2026 29/07/2026 29/07/2026
15:04:16 15:04:16 15:04:16 15:04:16 15:04:16 15:04:16 15:04:16 15:04:16 15:04:16 15:04:16 15:04:16 15:04:16 15:04:16 15:04:16 15:04:16 15:04:16 15:04:16 15:08:04 15:08:04 15:08:04 15:08:04 15:08:04 15:08:04 15:08:04 15:08:04 15:08:04 15:08:04 15:08:04 15:08:04 15:11:57 15:11:57 15:11:57 15:11:57 15:11:57 15:11:57 15:11:57 15:11:57 15:11:57 15:11:57 15:11:57 15:12:00 15:12:00 15:12:00 15:12:00 15:12:00 15:12:00 15:17:20 15:17:20 15:17:20 15:17:20 15:17:20
Instrumento Financ./Security
Operación / Transaction
SAB SAB SAB SAB SAB SAB SAB SAB SAB SAB SAB SAB SAB SAB SAB SAB SAB SAB SAB SAB SAB SAB SAB SAB SAB SAB SAB SAB SAB SAB SAB SAB SAB SAB SAB SAB SAB SAB SAB SAB SAB SAB SAB SAB SAB SAB SAB SAB SAB SAB SAB
COMPRA / BUY COMPRA / BUY COMPRA / BUY COMPRA / BUY COMPRA / BUY COMPRA / BUY COMPRA / BUY COMPRA / BUY COMPRA / BUY COMPRA / BUY COMPRA / BUY COMPRA / BUY COMPRA / BUY COMPRA / BUY COMPRA / BUY COMPRA / BUY COMPRA / BUY COMPRA / BUY COMPRA / BUY COMPRA / BUY COMPRA / BUY COMPRA / BUY COMPRA / BUY COMPRA / BUY COMPRA / BUY COMPRA / BUY COMPRA / BUY COMPRA / BUY COMPRA / BUY COMPRA / BUY COMPRA / BUY COMPRA / BUY COMPRA / BUY COMPRA / BUY COMPRA / BUY COMPRA / BUY COMPRA / BUY COMPRA / BUY COMPRA / BUY COMPRA / BUY COMPRA / BUY COMPRA / BUY COMPRA / BUY COMPRA / BUY COMPRA / BUY COMPRA / BUY COMPRA / BUY COMPRA / BUY COMPRA / BUY COMPRA / BUY COMPRA / BUY
Pag. 53
Centro Negociación / Trading Venue CEUX CEUX CEUX CEUX CEUX CEUX CEUX CEUX CEUX CEUX CEUX CEUX CEUX CEUX CEUX CEUX CEUX XMAD XMAD XMAD XMAD XMAD XMAD XMAD XMAD XMAD XMAD XMAD XMAD CEUX CEUX CEUX CEUX CEUX CEUX CEUX CEUX CEUX CEUX CEUX CEUX CEUX CEUX CEUX CEUX CEUX XMAD XMAD XMAD XMAD XMAD
Nº Títulos / Nr. of Precio € / Price shares € 1.290 142 1.290 1.432 142 1.290 142 1.076 356 934 356 1.076 356 218 1.076 138 822 1.080 1.987 2.611 2.900 3.626 2.900 341 1.827 1.827 1.827 3.626 448 623 809 95 1.432 1.140 631 801 1.110 558 874 558 1.432 1.432 316 1.432 1.432 325 1.902 1.085 968 1.545 8.755
3,2270 3,2270 3,2270 3,2270 3,2270 3,2270 3,2270 3,2270 3,2270 3,2270 3,2270 3,2270 3,2270 3,2270 3,2270 3,2270 3,2270 3,2280 3,2280 3,2280 3,2280 3,2280 3,2280 3,2280 3,2280 3,2280 3,2280 3,2280 3,2280 3,2270 3,2270 3,2270 3,2270 3,2270 3,2270 3,2270 3,2270 3,2270 3,2270 3,2270 3,2270 3,2270 3,2270 3,2270 3,2270 3,2270 3,2250 3,2250 3,2250 3,2250 3,2250
Hora / Trade Fecha / Date Time 29/07/2026 29/07/2026 29/07/2026 29/07/2026 29/07/2026 29/07/2026 29/07/2026 29/07/2026 29/07/2026 29/07/2026 29/07/2026 29/07/2026 29/07/2026 29/07/2026 29/07/2026 29/07/2026 29/07/2026 29/07/2026 29/07/2026 29/07/2026 29/07/2026 29/07/2026 29/07/2026 29/07/2026 29/07/2026 29/07/2026 29/07/2026 29/07/2026 29/07/2026 29/07/2026 29/07/2026 29/07/2026 29/07/2026 29/07/2026 29/07/2026 29/07/2026 29/07/2026 29/07/2026 29/07/2026 29/07/2026 29/07/2026 29/07/2026 29/07/2026 29/07/2026 29/07/2026 29/07/2026 29/07/2026 29/07/2026 29/07/2026 29/07/2026 29/07/2026
15:17:20 15:17:20 15:17:20 15:17:20 15:17:20 15:17:20 15:17:20 15:17:20 15:17:20 15:17:20 15:17:20 15:31:37 15:31:37 15:31:37 15:31:37 15:31:40 15:31:43 15:31:43 15:31:47 15:31:47 15:31:47 15:31:47 15:37:02 15:37:14 15:37:14 15:40:11 15:40:11 15:40:11 15:40:17 15:40:17 15:40:17 15:40:27 15:40:27 15:40:27 15:40:27 15:40:31 15:40:41 15:40:41 15:40:41 15:40:41 15:40:41 15:40:41 15:40:41 15:40:41 15:40:41 15:40:41 15:40:41 15:44:39 15:44:39 15:44:39 15:44:39
Instrumento Financ./Security
Operación / Transaction
SAB SAB SAB SAB SAB SAB SAB SAB SAB SAB SAB SAB SAB SAB SAB SAB SAB SAB SAB SAB SAB SAB SAB SAB SAB SAB SAB SAB SAB SAB SAB SAB SAB SAB SAB SAB SAB SAB SAB SAB SAB SAB SAB SAB SAB SAB SAB SAB SAB SAB SAB
COMPRA / BUY COMPRA / BUY COMPRA / BUY COMPRA / BUY COMPRA / BUY COMPRA / BUY COMPRA / BUY COMPRA / BUY COMPRA / BUY COMPRA / BUY COMPRA / BUY COMPRA / BUY COMPRA / BUY COMPRA / BUY COMPRA / BUY COMPRA / BUY COMPRA / BUY COMPRA / BUY COMPRA / BUY COMPRA / BUY COMPRA / BUY COMPRA / BUY COMPRA / BUY COMPRA / BUY COMPRA / BUY COMPRA / BUY COMPRA / BUY COMPRA / BUY COMPRA / BUY COMPRA / BUY COMPRA / BUY COMPRA / BUY COMPRA / BUY COMPRA / BUY COMPRA / BUY COMPRA / BUY COMPRA / BUY COMPRA / BUY COMPRA / BUY COMPRA / BUY COMPRA / BUY COMPRA / BUY COMPRA / BUY COMPRA / BUY COMPRA / BUY COMPRA / BUY COMPRA / BUY COMPRA / BUY COMPRA / BUY COMPRA / BUY COMPRA / BUY
Pag. 54
Centro Negociación / Trading Venue XMAD XMAD XMAD XMAD XMAD XMAD XMAD XMAD XMAD XMAD XMAD XMAD XMAD XMAD XMAD XMAD XMAD XMAD XMAD XMAD XMAD XMAD CEUX CEUX CEUX XMAD XMAD XMAD XMAD XMAD XMAD XMAD XMAD XMAD XMAD XMAD XMAD XMAD XMAD XMAD XMAD XMAD XMAD XMAD XMAD XMAD XMAD XMAD XMAD XMAD XMAD
Nº Títulos / Nr. of Precio € / Price shares € 124 1.221 1.544 2.019 1.746 1.544 2.942 772 772 2.987 74 4.480 974 1.494 1.222 791 5.863 4 107 2.987 2 2.076 776 1.211 858 709 2.159 496 4.580 5.272 6.784 3.238 36 1.080 1.283 840 2.159 1.544 2.159 1.620 899 899 1.620 1.154 346 554 569 2.159 31 2.128 2.159
3,2250 3,2250 3,2250 3,2250 3,2250 3,2250 3,2250 3,2250 3,2250 3,2250 3,2250 3,2350 3,2350 3,2350 3,2350 3,2350 3,2350 3,2350 3,2350 3,2350 3,2350 3,2350 3,2370 3,2370 3,2370 3,2500 3,2500 3,2500 3,2500 3,2500 3,2500 3,2480 3,2480 3,2480 3,2480 3,2480 3,2480 3,2480 3,2480 3,2480 3,2480 3,2480 3,2480 3,2480 3,2480 3,2480 3,2480 3,2450 3,2450 3,2450 3,2450
Hora / Trade Fecha / Date Time 29/07/2026 29/07/2026 29/07/2026 29/07/2026 29/07/2026 29/07/2026 29/07/2026 29/07/2026 29/07/2026 29/07/2026 29/07/2026 29/07/2026 29/07/2026 29/07/2026 29/07/2026 29/07/2026 29/07/2026 29/07/2026 29/07/2026 29/07/2026 29/07/2026 29/07/2026 29/07/2026 29/07/2026 29/07/2026 29/07/2026 29/07/2026 29/07/2026 29/07/2026 29/07/2026 29/07/2026 29/07/2026 29/07/2026 29/07/2026 29/07/2026 29/07/2026 29/07/2026 29/07/2026 29/07/2026 29/07/2026 29/07/2026 29/07/2026 29/07/2026 29/07/2026 29/07/2026 29/07/2026 29/07/2026 29/07/2026 29/07/2026 29/07/2026 29/07/2026
15:44:39 15:44:39 15:44:39 15:44:39 15:44:39 15:44:39 15:44:39 15:44:39 15:44:39 15:44:39 15:44:39 15:44:39 15:44:45 15:44:45 15:45:15 15:45:15 15:45:15 15:45:15 15:45:15 15:45:15 15:45:15 15:45:15 15:45:15 15:45:15 15:45:15 15:45:15 15:45:15 15:45:15 15:45:32 15:45:32 15:45:41 15:45:41 15:45:41 15:45:46 15:45:46 15:45:46 15:51:10 15:51:59 15:51:59 15:51:59 15:51:59 15:51:59 15:52:00 15:52:06 15:52:06 15:52:06 15:52:06 15:52:06 15:52:30 15:52:31 15:52:31
Instrumento Financ./Security
Operación / Transaction
SAB SAB SAB SAB SAB SAB SAB SAB SAB SAB SAB SAB SAB SAB SAB SAB SAB SAB SAB SAB SAB SAB SAB SAB SAB SAB SAB SAB SAB SAB SAB SAB SAB SAB SAB SAB SAB SAB SAB SAB SAB SAB SAB SAB SAB SAB SAB SAB SAB SAB SAB
COMPRA / BUY COMPRA / BUY COMPRA / BUY COMPRA / BUY COMPRA / BUY COMPRA / BUY COMPRA / BUY COMPRA / BUY COMPRA / BUY COMPRA / BUY COMPRA / BUY COMPRA / BUY COMPRA / BUY COMPRA / BUY COMPRA / BUY COMPRA / BUY COMPRA / BUY COMPRA / BUY COMPRA / BUY COMPRA / BUY COMPRA / BUY COMPRA / BUY COMPRA / BUY COMPRA / BUY COMPRA / BUY COMPRA / BUY COMPRA / BUY COMPRA / BUY COMPRA / BUY COMPRA / BUY COMPRA / BUY COMPRA / BUY COMPRA / BUY COMPRA / BUY COMPRA / BUY COMPRA / BUY COMPRA / BUY COMPRA / BUY COMPRA / BUY COMPRA / BUY COMPRA / BUY COMPRA / BUY COMPRA / BUY COMPRA / BUY COMPRA / BUY COMPRA / BUY COMPRA / BUY COMPRA / BUY COMPRA / BUY COMPRA / BUY COMPRA / BUY
Pag. 55
Centro Negociación / Trading Venue XMAD XMAD XMAD XMAD XMAD XMAD XMAD XMAD XMAD XMAD XMAD XMAD XMAD XMAD XMAD XMAD XMAD XMAD XMAD XMAD XMAD XMAD XMAD XMAD XMAD XMAD XMAD XMAD XMAD XMAD XMAD XMAD XMAD XMAD XMAD XMAD XMAD XMAD XMAD XMAD XMAD XMAD XMAD XMAD XMAD XMAD XMAD XMAD XMAD XMAD XMAD
Nº Títulos / Nr. of Precio € / Price shares € 1.283 899 899 876 1.944 2.010 876 1.860 576 3.507 148 383 2.011 1.251 3.822 26 470 2.159 2.159 1.544 2.159 2.159 2.159 2.010 899 899 263 862 2.159 1.251 1.911 446 746 1.611 1.544 772 41 481 1.876 1.106 772 3.507 1.686 2.357 2.357 2.357 1.544 772 916 1.482 1.716
3,2450 3,2450 3,2450 3,2450 3,2450 3,2450 3,2450 3,2450 3,2450 3,2450 3,2450 3,2450 3,2450 3,2450 3,2420 3,2420 3,2420 3,2420 3,2420 3,2420 3,2420 3,2420 3,2420 3,2420 3,2420 3,2420 3,2420 3,2420 3,2420 3,2420 3,2400 3,2400 3,2400 3,2400 3,2400 3,2400 3,2400 3,2400 3,2400 3,2400 3,2400 3,2400 3,2400 3,2400 3,2400 3,2400 3,2400 3,2400 3,2400 3,2400 3,2400
Hora / Trade Fecha / Date Time 29/07/2026 29/07/2026 29/07/2026 29/07/2026 29/07/2026 29/07/2026 29/07/2026 29/07/2026 29/07/2026 29/07/2026 29/07/2026 29/07/2026 29/07/2026 29/07/2026 29/07/2026 29/07/2026 29/07/2026 29/07/2026 29/07/2026 29/07/2026 29/07/2026 29/07/2026 29/07/2026 29/07/2026 29/07/2026 29/07/2026 29/07/2026 29/07/2026 29/07/2026 29/07/2026 29/07/2026 29/07/2026 29/07/2026 29/07/2026 29/07/2026 29/07/2026 29/07/2026 29/07/2026 29/07/2026 29/07/2026 29/07/2026 29/07/2026 29/07/2026 29/07/2026 29/07/2026 29/07/2026 29/07/2026 29/07/2026 29/07/2026 29/07/2026 29/07/2026
15:52:53 15:52:53 15:52:53 15:52:53 15:52:53 15:52:53 15:52:53 15:52:53 15:52:53 15:52:53 15:55:01 15:55:01 15:55:03 15:55:03 15:55:03 15:55:03 15:55:03 15:55:03 15:55:03 15:55:03 15:55:03 15:55:03 15:55:03 15:55:03 15:55:10 15:55:10 15:55:10 15:55:12 15:55:12 15:55:12 15:55:12 15:55:16 15:55:16 15:55:16 15:55:16 15:55:22 15:55:22 15:55:24 15:55:24 15:55:24 15:55:39 15:59:25 16:03:01 16:03:01 16:03:01 16:03:01 16:03:01 16:03:01 16:03:01 16:03:01 16:03:01
Instrumento Financ./Security
Operación / Transaction
SAB SAB SAB SAB SAB SAB SAB SAB SAB SAB SAB SAB SAB SAB SAB SAB SAB SAB SAB SAB SAB SAB SAB SAB SAB SAB SAB SAB SAB SAB SAB SAB SAB SAB SAB SAB SAB SAB SAB SAB SAB SAB SAB SAB SAB SAB SAB SAB SAB SAB SAB
COMPRA / BUY COMPRA / BUY COMPRA / BUY COMPRA / BUY COMPRA / BUY COMPRA / BUY COMPRA / BUY COMPRA / BUY COMPRA / BUY COMPRA / BUY COMPRA / BUY COMPRA / BUY COMPRA / BUY COMPRA / BUY COMPRA / BUY COMPRA / BUY COMPRA / BUY COMPRA / BUY COMPRA / BUY COMPRA / BUY COMPRA / BUY COMPRA / BUY COMPRA / BUY COMPRA / BUY COMPRA / BUY COMPRA / BUY COMPRA / BUY COMPRA / BUY COMPRA / BUY COMPRA / BUY COMPRA / BUY COMPRA / BUY COMPRA / BUY COMPRA / BUY COMPRA / BUY COMPRA / BUY COMPRA / BUY COMPRA / BUY COMPRA / BUY COMPRA / BUY COMPRA / BUY COMPRA / BUY COMPRA / BUY COMPRA / BUY COMPRA / BUY COMPRA / BUY COMPRA / BUY COMPRA / BUY COMPRA / BUY COMPRA / BUY COMPRA / BUY
Pag. 56
Centro Negociación / Trading Venue CEUX CEUX CEUX CEUX CEUX CEUX CEUX CEUX CEUX CEUX XMAD XMAD XMAD XMAD XMAD XMAD XMAD XMAD XMAD XMAD XMAD XMAD XMAD XMAD CEUX CEUX CEUX CEUX CEUX CEUX CEUX CEUX CEUX CEUX CEUX CEUX CEUX CEUX CEUX CEUX CEUX XMAD XMAD XMAD XMAD XMAD XMAD XMAD XMAD XMAD XMAD
Nº Títulos / Nr. of Precio € / Price shares € 1.423 564 1.987 474 1.987 587 1.987 1.987 670 489 2.159 2.159 2.159 2.159 1.544 2.010 899 899 2.114 1.544 764 2.624 1.785 2.181 1.987 1.987 1.987 547 794 646 1.341 1.987 1.987 1.514 258 215 1.987 1.987 372 258 146 2.987 6.127 4.285 1.536 1.536 2.838 1.451 1.451 899 899
3,2390 3,2390 3,2390 3,2390 3,2390 3,2390 3,2390 3,2390 3,2390 3,2390 3,2380 3,2380 3,2380 3,2380 3,2380 3,2380 3,2380 3,2380 3,2380 3,2380 3,2380 3,2380 3,2380 3,2380 3,2370 3,2370 3,2370 3,2370 3,2370 3,2370 3,2370 3,2370 3,2370 3,2370 3,2370 3,2370 3,2370 3,2370 3,2370 3,2370 3,2370 3,2350 3,2400 3,2400 3,2400 3,2400 3,2400 3,2400 3,2400 3,2400 3,2400
Hora / Trade Fecha / Date Time 29/07/2026 29/07/2026 29/07/2026 29/07/2026 29/07/2026 29/07/2026 29/07/2026 29/07/2026 29/07/2026 29/07/2026 29/07/2026 29/07/2026 29/07/2026 29/07/2026 29/07/2026 29/07/2026 29/07/2026 29/07/2026 29/07/2026 29/07/2026 29/07/2026 29/07/2026 29/07/2026 29/07/2026 29/07/2026 29/07/2026 29/07/2026 29/07/2026 29/07/2026 29/07/2026 29/07/2026 29/07/2026 29/07/2026 29/07/2026 29/07/2026 29/07/2026 29/07/2026 29/07/2026 29/07/2026 29/07/2026 29/07/2026 29/07/2026 29/07/2026 29/07/2026 29/07/2026 29/07/2026 29/07/2026 29/07/2026 29/07/2026 29/07/2026 29/07/2026
16:03:01 16:03:01 16:03:01 16:04:13 16:04:13 16:04:13 16:04:13 16:04:35 16:04:35 16:04:35 16:04:35 16:04:35 16:04:35 16:04:35 16:04:35 16:04:37 16:04:37 16:04:37 16:04:37 16:04:37 16:04:37 16:04:37 16:04:37 16:04:37 16:04:37 16:04:37 16:08:59 16:08:59 16:08:59 16:08:59 16:08:59 16:08:59 16:08:59 16:14:50 16:14:50 16:14:50 16:14:50 16:14:50 16:14:50 16:24:45 16:24:45 16:24:45 16:24:45 16:24:45 16:25:59 16:25:59 16:25:59 16:25:59 16:25:59 16:25:59 16:25:59
Instrumento Financ./Security
Operación / Transaction
SAB SAB SAB SAB SAB SAB SAB SAB SAB SAB SAB SAB SAB SAB SAB SAB SAB SAB SAB SAB SAB SAB SAB SAB SAB SAB SAB SAB SAB SAB SAB SAB SAB SAB SAB SAB SAB SAB SAB SAB SAB SAB SAB SAB SAB SAB SAB SAB SAB SAB SAB
COMPRA / BUY COMPRA / BUY COMPRA / BUY COMPRA / BUY COMPRA / BUY COMPRA / BUY COMPRA / BUY COMPRA / BUY COMPRA / BUY COMPRA / BUY COMPRA / BUY COMPRA / BUY COMPRA / BUY COMPRA / BUY COMPRA / BUY COMPRA / BUY COMPRA / BUY COMPRA / BUY COMPRA / BUY COMPRA / BUY COMPRA / BUY COMPRA / BUY COMPRA / BUY COMPRA / BUY COMPRA / BUY COMPRA / BUY COMPRA / BUY COMPRA / BUY COMPRA / BUY COMPRA / BUY COMPRA / BUY COMPRA / BUY COMPRA / BUY COMPRA / BUY COMPRA / BUY COMPRA / BUY COMPRA / BUY COMPRA / BUY COMPRA / BUY COMPRA / BUY COMPRA / BUY COMPRA / BUY COMPRA / BUY COMPRA / BUY COMPRA / BUY COMPRA / BUY COMPRA / BUY COMPRA / BUY COMPRA / BUY COMPRA / BUY COMPRA / BUY
Pag. 57
Centro Negociación / Trading Venue XMAD XMAD XMAD CEUX CEUX CEUX CEUX CEUX CEUX CEUX CEUX CEUX CEUX CEUX CEUX CEUX CEUX CEUX CEUX CEUX CEUX CEUX CEUX CEUX CEUX CEUX XMAD XMAD XMAD XMAD XMAD XMAD XMAD XMAD XMAD XMAD XMAD XMAD XMAD XMAD XMAD XMAD XMAD XMAD CEUX CEUX CEUX CEUX CEUX CEUX CEUX
Nº Títulos / Nr. of Precio € / Price shares € 3.099 1.600 1.292 1.198 154 154 154 230 506 1.198 1.198 1.198 130 1.032 166 1.198 1.198 1.032 166 883 166 1.032 166 1.198 516 127 2.159 1.544 899 899 2.010 2.774 24 486 6.052 2.508 1.544 1.544 425 1.382 1.658 1.658 1.544 890 1.198 1.198 771 1.198 1.198 958 1.198
3,2400 3,2400 3,2400 3,2370 3,2370 3,2370 3,2370 3,2370 3,2370 3,2370 3,2370 3,2370 3,2370 3,2370 3,2370 3,2370 3,2370 3,2370 3,2370 3,2370 3,2370 3,2370 3,2370 3,2370 3,2370 3,2370 3,2380 3,2380 3,2380 3,2380 3,2380 3,2380 3,2380 3,2400 3,2400 3,2400 3,2400 3,2400 3,2400 3,2450 3,2450 3,2450 3,2450 3,2450 3,2430 3,2430 3,2430 3,2430 3,2430 3,2430 3,2430
Hora / Trade Fecha / Date Time 29/07/2026 29/07/2026 29/07/2026 29/07/2026 29/07/2026 29/07/2026 29/07/2026 29/07/2026 29/07/2026 29/07/2026 29/07/2026 29/07/2026 29/07/2026 29/07/2026 29/07/2026 29/07/2026 29/07/2026 29/07/2026 29/07/2026 29/07/2026 29/07/2026 29/07/2026 29/07/2026 29/07/2026 29/07/2026 29/07/2026 29/07/2026 29/07/2026 29/07/2026 29/07/2026 29/07/2026 29/07/2026 29/07/2026 29/07/2026 29/07/2026 29/07/2026 29/07/2026 29/07/2026 29/07/2026 29/07/2026 29/07/2026 29/07/2026 29/07/2026 29/07/2026 29/07/2026 29/07/2026 29/07/2026 29/07/2026 29/07/2026 29/07/2026 29/07/2026
16:25:59 16:25:59 16:25:59 16:25:59 16:25:59 16:25:59 16:26:09 16:26:12 16:26:12 16:26:12 16:38:41 16:38:41 16:38:41 16:39:19 16:39:24 16:39:24 16:39:24 16:39:24 16:39:24 16:39:24 16:40:27 16:40:27 16:40:27 16:40:27 16:40:27 16:40:27 16:40:27 16:40:27 16:40:50 16:40:50 16:40:50 16:40:50 16:40:50 16:40:50 16:40:50 16:40:50 16:40:50 16:40:50 16:40:50 16:40:50 16:40:50 16:40:50 16:40:52 16:42:06 16:42:06 16:42:06 16:42:06 16:42:06 16:42:06 16:42:06 16:42:06
Instrumento Financ./Security
Operación / Transaction
SAB SAB SAB SAB SAB SAB SAB SAB SAB SAB SAB SAB SAB SAB SAB SAB SAB SAB SAB SAB SAB SAB SAB SAB SAB SAB SAB SAB SAB SAB SAB SAB SAB SAB SAB SAB SAB SAB SAB SAB SAB SAB SAB SAB SAB SAB SAB SAB SAB SAB SAB
COMPRA / BUY COMPRA / BUY COMPRA / BUY COMPRA / BUY COMPRA / BUY COMPRA / BUY COMPRA / BUY COMPRA / BUY COMPRA / BUY COMPRA / BUY COMPRA / BUY COMPRA / BUY COMPRA / BUY COMPRA / BUY COMPRA / BUY COMPRA / BUY COMPRA / BUY COMPRA / BUY COMPRA / BUY COMPRA / BUY COMPRA / BUY COMPRA / BUY COMPRA / BUY COMPRA / BUY COMPRA / BUY COMPRA / BUY COMPRA / BUY COMPRA / BUY COMPRA / BUY COMPRA / BUY COMPRA / BUY COMPRA / BUY COMPRA / BUY COMPRA / BUY COMPRA / BUY COMPRA / BUY COMPRA / BUY COMPRA / BUY COMPRA / BUY COMPRA / BUY COMPRA / BUY COMPRA / BUY COMPRA / BUY COMPRA / BUY COMPRA / BUY COMPRA / BUY COMPRA / BUY COMPRA / BUY COMPRA / BUY COMPRA / BUY COMPRA / BUY
Pag. 58
Centro Negociación / Trading Venue CEUX CEUX CEUX CEUX CEUX CEUX CEUX CEUX CEUX CEUX XMAD XMAD XMAD XMAD XMAD XMAD XMAD XMAD XMAD XMAD XMAD XMAD XMAD XMAD XMAD XMAD XMAD XMAD CEUX CEUX CEUX CEUX CEUX CEUX CEUX CEUX CEUX CEUX CEUX CEUX CEUX CEUX CEUX XMAD XMAD XMAD XMAD XMAD XMAD XMAD XMAD
Nº Títulos / Nr. of Precio € / Price shares € 516 682 266 184 748 450 1.198 1.198 1.198 841 2.357 2.357 2.357 2.357 1.544 2.357 67 825 813 2.357 1.465 2.247 2.316 2.467 1.613 785 41 1.675 1.543 1.543 1.543 1.543 1.543 1.338 205 626 1.543 1.056 487 285 830 713 202 2.159 160 8.941 8.941 1.544 1.544 460 1.251
3,2430 3,2430 3,2430 3,2430 3,2430 3,2430 3,2430 3,2430 3,2430 3,2430 3,2450 3,2450 3,2450 3,2450 3,2450 3,2450 3,2450 3,2450 3,2450 3,2450 3,2450 3,2450 3,2450 3,2450 3,2450 3,2450 3,2450 3,2450 3,2430 3,2430 3,2430 3,2430 3,2430 3,2430 3,2430 3,2430 3,2430 3,2430 3,2430 3,2430 3,2430 3,2430 3,2430 3,2400 3,2400 3,2400 3,2400 3,2400 3,2400 3,2400 3,2400
Hora / Trade Fecha / Date Time 29/07/2026 29/07/2026 29/07/2026 29/07/2026 29/07/2026 29/07/2026 29/07/2026 29/07/2026 29/07/2026 29/07/2026 29/07/2026 29/07/2026 29/07/2026 29/07/2026 29/07/2026 29/07/2026 29/07/2026 29/07/2026 29/07/2026 29/07/2026 29/07/2026 29/07/2026 29/07/2026 29/07/2026 29/07/2026 29/07/2026 29/07/2026 29/07/2026 29/07/2026 29/07/2026 29/07/2026 29/07/2026 29/07/2026 29/07/2026 29/07/2026 29/07/2026 29/07/2026 29/07/2026 29/07/2026 29/07/2026 29/07/2026 29/07/2026 29/07/2026 29/07/2026 29/07/2026 29/07/2026 29/07/2026 29/07/2026 29/07/2026 29/07/2026 29/07/2026
16:43:47 16:43:47 16:43:47 16:43:48 16:43:48 16:43:48 16:43:48 16:43:48 16:43:48 16:43:48 16:43:49 16:43:49 16:43:49 16:43:57 16:43:57 16:43:57 16:43:57 16:45:01 16:45:01 16:45:01 16:45:01 16:45:01 16:45:01 16:45:01 16:45:01 16:48:04 16:48:04 16:48:04 16:48:04 16:48:04 16:48:04 16:48:04 16:48:04 16:48:04 16:48:04 16:48:32 16:48:32 16:48:32 16:48:32 16:48:32 16:48:33 16:48:33 16:48:33 17:00:02 17:00:02 17:00:31 17:00:31 17:00:31 17:00:31 17:00:31 17:00:31
Instrumento Financ./Security
Operación / Transaction
SAB SAB SAB SAB SAB SAB SAB SAB SAB SAB SAB SAB SAB SAB SAB SAB SAB SAB SAB SAB SAB SAB SAB SAB SAB SAB SAB SAB SAB SAB SAB SAB SAB SAB SAB SAB SAB SAB SAB SAB SAB SAB SAB SAB SAB SAB SAB SAB SAB SAB SAB
COMPRA / BUY COMPRA / BUY COMPRA / BUY COMPRA / BUY COMPRA / BUY COMPRA / BUY COMPRA / BUY COMPRA / BUY COMPRA / BUY COMPRA / BUY COMPRA / BUY COMPRA / BUY COMPRA / BUY COMPRA / BUY COMPRA / BUY COMPRA / BUY COMPRA / BUY COMPRA / BUY COMPRA / BUY COMPRA / BUY COMPRA / BUY COMPRA / BUY COMPRA / BUY COMPRA / BUY COMPRA / BUY COMPRA / BUY COMPRA / BUY COMPRA / BUY COMPRA / BUY COMPRA / BUY COMPRA / BUY COMPRA / BUY COMPRA / BUY COMPRA / BUY COMPRA / BUY COMPRA / BUY COMPRA / BUY COMPRA / BUY COMPRA / BUY COMPRA / BUY COMPRA / BUY COMPRA / BUY COMPRA / BUY COMPRA / BUY COMPRA / BUY COMPRA / BUY COMPRA / BUY COMPRA / BUY COMPRA / BUY COMPRA / BUY COMPRA / BUY
Pag. 59
Centro Negociación / Trading Venue CEUX CEUX CEUX CEUX CEUX CEUX CEUX CEUX CEUX CEUX CEUX CEUX CEUX CEUX CEUX CEUX CEUX XMAD XMAD XMAD XMAD XMAD XMAD XMAD XMAD CEUX CEUX CEUX CEUX CEUX CEUX CEUX CEUX CEUX CEUX CEUX CEUX CEUX CEUX CEUX CEUX CEUX CEUX XMAD XMAD XMAD XMAD XMAD XMAD XMAD XMAD
Nº Títulos / Nr. of Precio € / Price shares € 440 1.547 291 1.987 214 1.773 65 75 1.912 1.912 75 698 966 323 599 1.388 735 2.643 344 3.626 3.626 1.709 1.165 1.544 5.343 799 522 799 1.321 1.321 1.226 1.321 320 1.001 320 1.321 486 64 771 401 1.321 1.321 365 1.493 1.161 2.765 2.849 5.308 2.681 407 1.588
3,2370 3,2370 3,2370 3,2370 3,2370 3,2370 3,2370 3,2370 3,2370 3,2370 3,2370 3,2370 3,2370 3,2370 3,2370 3,2370 3,2370 3,2350 3,2350 3,2350 3,2350 3,2350 3,2350 3,2350 3,2350 3,2370 3,2370 3,2370 3,2370 3,2370 3,2370 3,2370 3,2370 3,2370 3,2370 3,2370 3,2370 3,2370 3,2370 3,2370 3,2370 3,2370 3,2370 3,2400 3,2400 3,2400 3,2400 3,2400 3,2400 3,2400 3,2400
Hora / Trade Fecha / Date Time 29/07/2026 29/07/2026 29/07/2026 29/07/2026 29/07/2026 29/07/2026 29/07/2026 29/07/2026 29/07/2026 29/07/2026 29/07/2026 29/07/2026 29/07/2026 29/07/2026 29/07/2026 29/07/2026 29/07/2026 29/07/2026 29/07/2026 29/07/2026 29/07/2026 29/07/2026 29/07/2026 29/07/2026 29/07/2026 29/07/2026 29/07/2026 29/07/2026 29/07/2026 29/07/2026 29/07/2026 29/07/2026 29/07/2026 29/07/2026 29/07/2026 29/07/2026 29/07/2026 29/07/2026 29/07/2026 29/07/2026 29/07/2026 29/07/2026 29/07/2026 29/07/2026 29/07/2026 29/07/2026 29/07/2026 29/07/2026 29/07/2026 29/07/2026 29/07/2026
17:00:31 17:00:31 17:00:31 17:00:31 17:00:31 17:00:31 17:00:31 17:00:31 17:00:31 17:00:31 17:00:31 17:00:31 17:00:31 17:00:46 17:00:46 17:00:51 17:00:51 17:00:51 17:00:51 17:06:24 17:06:24 17:06:54 17:06:54 17:06:54 17:06:54 17:06:54 17:08:35 17:08:35 17:08:35 17:08:35 17:08:35 17:08:35 17:08:35 17:08:35 17:08:35 17:08:35 17:08:35 17:08:35 17:08:35 17:08:47 17:08:47 17:08:50 17:08:50 17:08:50 17:08:50 17:08:50 17:08:50 17:08:50 17:08:50 17:08:50 17:08:50
Instrumento Financ./Security
Operación / Transaction
SAB SAB SAB SAB SAB SAB SAB SAB SAB SAB SAB SAB SAB SAB SAB SAB SAB SAB SAB SAB SAB SAB SAB SAB SAB SAB SAB SAB SAB SAB SAB SAB SAB SAB SAB SAB SAB SAB SAB SAB SAB SAB SAB SAB SAB SAB SAB SAB SAB SAB SAB
COMPRA / BUY COMPRA / BUY COMPRA / BUY COMPRA / BUY COMPRA / BUY COMPRA / BUY COMPRA / BUY COMPRA / BUY COMPRA / BUY COMPRA / BUY COMPRA / BUY COMPRA / BUY COMPRA / BUY COMPRA / BUY COMPRA / BUY COMPRA / BUY COMPRA / BUY COMPRA / BUY COMPRA / BUY COMPRA / BUY COMPRA / BUY COMPRA / BUY COMPRA / BUY COMPRA / BUY COMPRA / BUY COMPRA / BUY COMPRA / BUY COMPRA / BUY COMPRA / BUY COMPRA / BUY COMPRA / BUY COMPRA / BUY COMPRA / BUY COMPRA / BUY COMPRA / BUY COMPRA / BUY COMPRA / BUY COMPRA / BUY COMPRA / BUY COMPRA / BUY COMPRA / BUY COMPRA / BUY COMPRA / BUY COMPRA / BUY COMPRA / BUY COMPRA / BUY COMPRA / BUY COMPRA / BUY COMPRA / BUY COMPRA / BUY COMPRA / BUY
Pag. 60
Centro Negociación / Trading Venue XMAD XMAD XMAD XMAD XMAD XMAD XMAD XMAD XMAD XMAD XMAD XMAD XMAD XMAD XMAD XMAD XMAD XMAD XMAD XMAD XMAD XMAD XMAD XMAD XMAD XMAD CEUX CEUX CEUX CEUX CEUX CEUX CEUX CEUX CEUX CEUX CEUX CEUX CEUX XMAD XMAD XMAD XMAD XMAD XMAD XMAD XMAD XMAD XMAD XMAD XMAD
Nº Títulos / Nr. of Precio € / Price shares € 2.247 899 171 107 1.437 327 1.217 1.544 894 650 1.544 2.194 460 571 2.654 2.765 2.654 2.765 2.654 2.765 2.654 2.765 2.654 2.350 738 68 1.432 1.432 116 1.432 1.432 1.432 1.432 1.432 1.432 1.432 1.432 250 314 7.582 7.629 47 2.543 1.591 899 899 1.526 1.697 1.544 2.016 2.027
3,2400 3,2400 3,2400 3,2400 3,2400 3,2400 3,2400 3,2400 3,2400 3,2400 3,2400 3,2400 3,2400 3,2400 3,2400 3,2400 3,2400 3,2400 3,2400 3,2400 3,2400 3,2400 3,2400 3,2400 3,2400 3,2400 3,2370 3,2370 3,2370 3,2370 3,2370 3,2370 3,2370 3,2370 3,2370 3,2370 3,2370 3,2370 3,2370 3,2350 3,2350 3,2350 3,2350 3,2350 3,2350 3,2350 3,2350 3,2350 3,2350 3,2350 3,2350
Hora / Trade Fecha / Date Time 29/07/2026 29/07/2026 29/07/2026 29/07/2026 29/07/2026 29/07/2026 29/07/2026 29/07/2026 29/07/2026 29/07/2026 29/07/2026 29/07/2026 29/07/2026 29/07/2026 29/07/2026 29/07/2026 29/07/2026 29/07/2026 29/07/2026 29/07/2026 29/07/2026 29/07/2026 29/07/2026 29/07/2026 29/07/2026 29/07/2026 29/07/2026 29/07/2026 29/07/2026 29/07/2026 29/07/2026 29/07/2026 29/07/2026 29/07/2026 29/07/2026 30/07/2026 30/07/2026 30/07/2026 30/07/2026 30/07/2026 30/07/2026 30/07/2026 30/07/2026 30/07/2026 30/07/2026 30/07/2026 30/07/2026 30/07/2026 30/07/2026 30/07/2026 30/07/2026
17:09:20 17:09:20 17:09:20 17:09:22 17:11:27 17:11:27 17:11:27 17:11:28 17:11:28 17:11:28 17:11:28 17:11:28 17:11:28 17:11:28 17:13:42 17:13:42 17:13:42 17:13:42 17:13:42 17:13:42 17:13:42 17:13:42 17:13:42 17:13:42 17:18:04 17:18:04 17:18:04 17:18:04 17:18:04 17:18:04 17:18:04 17:18:04 17:18:04 17:18:04 17:18:04 09:10:30 09:10:30 09:10:30 09:10:30 09:10:30 09:10:41 09:10:41 09:10:41 09:10:41 09:10:41 09:10:41 09:10:41 09:10:41 09:10:41 09:10:41 09:10:41
Instrumento Financ./Security
Operación / Transaction
SAB SAB SAB SAB SAB SAB SAB SAB SAB SAB SAB SAB SAB SAB SAB SAB SAB SAB SAB SAB SAB SAB SAB SAB SAB SAB SAB SAB SAB SAB SAB SAB SAB SAB SAB SAB SAB SAB SAB SAB SAB SAB SAB SAB SAB SAB SAB SAB SAB SAB SAB
COMPRA / BUY COMPRA / BUY COMPRA / BUY COMPRA / BUY COMPRA / BUY COMPRA / BUY COMPRA / BUY COMPRA / BUY COMPRA / BUY COMPRA / BUY COMPRA / BUY COMPRA / BUY COMPRA / BUY COMPRA / BUY COMPRA / BUY COMPRA / BUY COMPRA / BUY COMPRA / BUY COMPRA / BUY COMPRA / BUY COMPRA / BUY COMPRA / BUY COMPRA / BUY COMPRA / BUY COMPRA / BUY COMPRA / BUY COMPRA / BUY COMPRA / BUY COMPRA / BUY COMPRA / BUY COMPRA / BUY COMPRA / BUY COMPRA / BUY COMPRA / BUY COMPRA / BUY COMPRA / BUY COMPRA / BUY COMPRA / BUY COMPRA / BUY COMPRA / BUY COMPRA / BUY COMPRA / BUY COMPRA / BUY COMPRA / BUY COMPRA / BUY COMPRA / BUY COMPRA / BUY COMPRA / BUY COMPRA / BUY COMPRA / BUY COMPRA / BUY
Pag. 61
Centro Negociación / Trading Venue CEUX CEUX CEUX CEUX CEUX CEUX CEUX CEUX CEUX CEUX CEUX CEUX CEUX CEUX XMAD XMAD XMAD XMAD XMAD XMAD XMAD XMAD XMAD XMAD XMAD XMAD XMAD XMAD XMAD XMAD XMAD XMAD XMAD XMAD XMAD CEUX CEUX CEUX CEUX CEUX CEUX CEUX CEUX CEUX CEUX CEUX CEUX CEUX CEUX CEUX CEUX
Nº Títulos / Nr. of Precio € / Price shares € 1.747 129 1.747 1.876 343 1.533 339 1.537 1.876 1.876 180 405 529 883 2.876 17.424 1.544 1.544 1.544 772 772 2.284 1.117 123 2.987 2.987 13.396 772 899 1.390 899 1.544 2.065 1.544 1.517 1.321 74 1.321 1.321 1.222 167 253 901 266 734 587 465 1.154 167 420 725
3,2330 3,2330 3,2330 3,2330 3,2330 3,2330 3,2330 3,2330 3,2330 3,2330 3,2330 3,2330 3,2330 3,2330 3,2300 3,2300 3,2300 3,2300 3,2300 3,2300 3,2300 3,2300 3,2300 3,2300 3,2250 3,2250 3,2250 3,2250 3,2250 3,2250 3,2250 3,2250 3,2250 3,2250 3,2250 3,2570 3,2570 3,2570 3,2570 3,2570 3,2570 3,2570 3,2570 3,2570 3,2570 3,2570 3,2570 3,2570 3,2570 3,2570 3,2570
Hora / Trade Fecha / Date Time 30/07/2026 30/07/2026 30/07/2026 30/07/2026 30/07/2026 30/07/2026 30/07/2026 30/07/2026 30/07/2026 30/07/2026 30/07/2026 30/07/2026 30/07/2026 30/07/2026 30/07/2026 30/07/2026 30/07/2026 30/07/2026 30/07/2026 30/07/2026 30/07/2026 30/07/2026 30/07/2026 30/07/2026 30/07/2026 30/07/2026 30/07/2026 30/07/2026 30/07/2026 30/07/2026 30/07/2026 30/07/2026 30/07/2026 30/07/2026 30/07/2026 30/07/2026 30/07/2026 30/07/2026 30/07/2026 30/07/2026 30/07/2026 30/07/2026 30/07/2026 30/07/2026 30/07/2026 30/07/2026 30/07/2026 30/07/2026 30/07/2026 30/07/2026 30/07/2026
09:10:41 09:10:41 09:10:41 09:10:41 09:10:41 09:14:10 09:14:10 09:14:10 09:14:10 09:14:10 09:14:10 09:14:10 09:14:10 09:16:14 09:17:56 09:17:56 09:17:56 09:17:56 09:17:56 09:17:56 09:17:56 09:20:33 09:20:33 09:20:33 09:20:33 09:20:33 09:20:33 09:20:33 09:20:33 09:20:34 09:20:34 09:20:34 09:20:34 09:20:34 09:20:34 09:20:36 09:20:38 09:20:38 09:20:38 09:21:06 09:21:06 09:21:10 09:21:17 09:21:17 09:21:17 09:21:17 09:21:17 09:21:17 09:21:33 09:21:33 09:21:33
Instrumento Financ./Security
Operación / Transaction
SAB SAB SAB SAB SAB SAB SAB SAB SAB SAB SAB SAB SAB SAB SAB SAB SAB SAB SAB SAB SAB SAB SAB SAB SAB SAB SAB SAB SAB SAB SAB SAB SAB SAB SAB SAB SAB SAB SAB SAB SAB SAB SAB SAB SAB SAB SAB SAB SAB SAB SAB
COMPRA / BUY COMPRA / BUY COMPRA / BUY COMPRA / BUY COMPRA / BUY COMPRA / BUY COMPRA / BUY COMPRA / BUY COMPRA / BUY COMPRA / BUY COMPRA / BUY COMPRA / BUY COMPRA / BUY COMPRA / BUY COMPRA / BUY COMPRA / BUY COMPRA / BUY COMPRA / BUY COMPRA / BUY COMPRA / BUY COMPRA / BUY COMPRA / BUY COMPRA / BUY COMPRA / BUY COMPRA / BUY COMPRA / BUY COMPRA / BUY COMPRA / BUY COMPRA / BUY COMPRA / BUY COMPRA / BUY COMPRA / BUY COMPRA / BUY COMPRA / BUY COMPRA / BUY COMPRA / BUY COMPRA / BUY COMPRA / BUY COMPRA / BUY COMPRA / BUY COMPRA / BUY COMPRA / BUY COMPRA / BUY COMPRA / BUY COMPRA / BUY COMPRA / BUY COMPRA / BUY COMPRA / BUY COMPRA / BUY COMPRA / BUY COMPRA / BUY
Pag. 62
Centro Negociación / Trading Venue CEUX CEUX CEUX CEUX CEUX XMAD XMAD XMAD XMAD XMAD XMAD XMAD XMAD XMAD XMAD XMAD XMAD XMAD XMAD XMAD XMAD CEUX CEUX CEUX CEUX CEUX CEUX CEUX CEUX CEUX CEUX CEUX CEUX CEUX CEUX CEUX CEUX CEUX CEUX XMAD XMAD XMAD XMAD XMAD XMAD XMAD XMAD XMAD CEUX CEUX CEUX
Nº Títulos / Nr. of Precio € / Price shares € 176 978 1.321 1.321 106 2.159 1.079 927 927 3.494 4.419 3.494 3.501 2.357 2.357 1.900 1.460 5.848 2.357 2.357 1.364 558 874 1.278 154 1.432 1.432 74 1.432 1.111 321 957 1.432 1.432 228 1.432 24 24 805 2.369 2.369 2.369 2.369 2.369 2.369 2.369 2.369 1.048 351 1.192 746
3,2570 3,2570 3,2570 3,2570 3,2570 3,2600 3,2600 3,2600 3,2600 3,2600 3,2600 3,2600 3,2600 3,2550 3,2550 3,2550 3,2550 3,2550 3,2550 3,2550 3,2550 3,2530 3,2530 3,2530 3,2530 3,2530 3,2530 3,2530 3,2530 3,2530 3,2530 3,2530 3,2530 3,2530 3,2530 3,2530 3,2530 3,2530 3,2530 3,2500 3,2500 3,2500 3,2500 3,2500 3,2500 3,2500 3,2500 3,2500 3,2470 3,2470 3,2470
Hora / Trade Fecha / Date Time 30/07/2026 30/07/2026 30/07/2026 30/07/2026 30/07/2026 30/07/2026 30/07/2026 30/07/2026 30/07/2026 30/07/2026 30/07/2026 30/07/2026 30/07/2026 30/07/2026 30/07/2026 30/07/2026 30/07/2026 30/07/2026 30/07/2026 30/07/2026 30/07/2026 30/07/2026 30/07/2026 30/07/2026 30/07/2026 30/07/2026 30/07/2026 30/07/2026 30/07/2026 30/07/2026 30/07/2026 30/07/2026 30/07/2026 30/07/2026 30/07/2026 30/07/2026 30/07/2026 30/07/2026 30/07/2026 30/07/2026 30/07/2026 30/07/2026 30/07/2026 30/07/2026 30/07/2026 30/07/2026 30/07/2026 30/07/2026 30/07/2026 30/07/2026 30/07/2026
09:21:33 09:21:33 09:46:48 09:46:48 09:46:48 09:47:32 09:47:32 09:47:32 09:47:32 09:47:32 09:47:32 09:47:32 09:47:32 09:47:32 09:47:32 09:47:32 09:47:32 09:47:32 09:47:32 09:47:32 09:47:32 09:47:32 09:47:32 09:47:32 09:47:32 09:47:32 09:47:32 09:47:32 09:47:32 09:47:32 09:47:32 09:49:48 09:49:48 09:49:48 09:49:48 09:49:48 09:49:48 09:49:48 09:49:48 09:49:48 09:49:48 09:49:48 09:49:48 09:49:48 09:49:48 09:49:48 09:49:48 09:49:48 09:49:48 09:49:48 09:49:48
Instrumento Financ./Security
Operación / Transaction
SAB SAB SAB SAB SAB SAB SAB SAB SAB SAB SAB SAB SAB SAB SAB SAB SAB SAB SAB SAB SAB SAB SAB SAB SAB SAB SAB SAB SAB SAB SAB SAB SAB SAB SAB SAB SAB SAB SAB SAB SAB SAB SAB SAB SAB SAB SAB SAB SAB SAB SAB
COMPRA / BUY COMPRA / BUY COMPRA / BUY COMPRA / BUY COMPRA / BUY COMPRA / BUY COMPRA / BUY COMPRA / BUY COMPRA / BUY COMPRA / BUY COMPRA / BUY COMPRA / BUY COMPRA / BUY COMPRA / BUY COMPRA / BUY COMPRA / BUY COMPRA / BUY COMPRA / BUY COMPRA / BUY COMPRA / BUY COMPRA / BUY COMPRA / BUY COMPRA / BUY COMPRA / BUY COMPRA / BUY COMPRA / BUY COMPRA / BUY COMPRA / BUY COMPRA / BUY COMPRA / BUY COMPRA / BUY COMPRA / BUY COMPRA / BUY COMPRA / BUY COMPRA / BUY COMPRA / BUY COMPRA / BUY COMPRA / BUY COMPRA / BUY COMPRA / BUY COMPRA / BUY COMPRA / BUY COMPRA / BUY COMPRA / BUY COMPRA / BUY COMPRA / BUY COMPRA / BUY COMPRA / BUY COMPRA / BUY COMPRA / BUY COMPRA / BUY
Pag. 63
Centro Negociación / Trading Venue CEUX CEUX XMAD XMAD XMAD XMAD XMAD XMAD XMAD XMAD XMAD XMAD XMAD CEUX CEUX CEUX CEUX CEUX CEUX CEUX CEUX CEUX CEUX XMAD XMAD XMAD XMAD XMAD XMAD XMAD XMAD CEUX CEUX CEUX CEUX CEUX CEUX CEUX CEUX CEUX CEUX CEUX CEUX CEUX CEUX CEUX CEUX CEUX CEUX CEUX CEUX
Nº Títulos / Nr. of Precio € / Price shares € 1.173 370 2.219 2.219 2.219 3.224 1.214 1.214 1.005 2.219 1.214 2.219 1.034 1.543 796 1.543 1.543 1.543 1.543 833 526 184 1.114 2.432 2.432 2.432 3.978 1.578 3.978 2.432 738 1.198 76 1 203 715 203 995 133 70 56 1.198 1.198 1.198 1.052 146 1.052 1.198 1.052 146 1.198
3,2470 3,2470 3,2900 3,2900 3,2900 3,2900 3,2900 3,2900 3,2900 3,2900 3,2900 3,2900 3,2900 3,2870 3,2870 3,2870 3,2870 3,2870 3,2870 3,2870 3,2870 3,2870 3,2870 3,2850 3,2850 3,2850 3,2850 3,2850 3,2850 3,2850 3,2850 3,2830 3,2830 3,2830 3,2830 3,2830 3,2830 3,2830 3,2830 3,2830 3,2830 3,2830 3,2830 3,2830 3,2830 3,2830 3,2830 3,2830 3,2830 3,2830 3,2830
Hora / Trade Fecha / Date Time 30/07/2026 30/07/2026 30/07/2026 30/07/2026 30/07/2026 30/07/2026 30/07/2026 30/07/2026 30/07/2026 30/07/2026 30/07/2026 30/07/2026 30/07/2026 30/07/2026 30/07/2026 30/07/2026 30/07/2026 30/07/2026 30/07/2026 30/07/2026 30/07/2026 30/07/2026 30/07/2026 30/07/2026 30/07/2026 30/07/2026 30/07/2026 30/07/2026 30/07/2026 30/07/2026 30/07/2026 30/07/2026 30/07/2026 30/07/2026 30/07/2026 30/07/2026 30/07/2026 30/07/2026 30/07/2026 30/07/2026 30/07/2026 30/07/2026 30/07/2026 30/07/2026 30/07/2026 30/07/2026 30/07/2026 30/07/2026 30/07/2026 30/07/2026 30/07/2026
09:49:48 09:49:48 09:49:48 09:49:48 09:50:15 09:50:15 09:50:15 09:50:15 09:50:15 09:50:15 09:50:15 09:50:15 09:50:15 09:55:02 09:55:02 09:55:02 09:55:02 09:55:02 09:55:02 09:55:02 09:55:02 09:55:02 09:55:02 09:55:02 09:55:02 09:56:09 09:56:09 09:56:09 09:56:09 09:56:09 09:56:09 09:56:24 09:56:28 09:56:28 09:56:28 09:56:28 09:56:28 09:56:28 09:56:28 09:56:28 09:56:28 09:56:28 09:56:28 09:58:19 09:58:19 09:58:19 09:58:19 09:58:19 09:58:19 09:58:19 09:58:19
Instrumento Financ./Security
Operación / Transaction
SAB SAB SAB SAB SAB SAB SAB SAB SAB SAB SAB SAB SAB SAB SAB SAB SAB SAB SAB SAB SAB SAB SAB SAB SAB SAB SAB SAB SAB SAB SAB SAB SAB SAB SAB SAB SAB SAB SAB SAB SAB SAB SAB SAB SAB SAB SAB SAB SAB SAB SAB
COMPRA / BUY COMPRA / BUY COMPRA / BUY COMPRA / BUY COMPRA / BUY COMPRA / BUY COMPRA / BUY COMPRA / BUY COMPRA / BUY COMPRA / BUY COMPRA / BUY COMPRA / BUY COMPRA / BUY COMPRA / BUY COMPRA / BUY COMPRA / BUY COMPRA / BUY COMPRA / BUY COMPRA / BUY COMPRA / BUY COMPRA / BUY COMPRA / BUY COMPRA / BUY COMPRA / BUY COMPRA / BUY COMPRA / BUY COMPRA / BUY COMPRA / BUY COMPRA / BUY COMPRA / BUY COMPRA / BUY COMPRA / BUY COMPRA / BUY COMPRA / BUY COMPRA / BUY COMPRA / BUY COMPRA / BUY COMPRA / BUY COMPRA / BUY COMPRA / BUY COMPRA / BUY COMPRA / BUY COMPRA / BUY COMPRA / BUY COMPRA / BUY COMPRA / BUY COMPRA / BUY COMPRA / BUY COMPRA / BUY COMPRA / BUY COMPRA / BUY
Pag. 64
Centro Negociación / Trading Venue CEUX CEUX CEUX CEUX XMAD XMAD XMAD XMAD XMAD XMAD XMAD XMAD XMAD XMAD XMAD XMAD XMAD XMAD XMAD XMAD XMAD XMAD XMAD XMAD XMAD CEUX CEUX CEUX CEUX CEUX CEUX CEUX CEUX CEUX CEUX CEUX CEUX CEUX CEUX CEUX CEUX CEUX CEUX XMAD XMAD XMAD XMAD XMAD XMAD XMAD XMAD
Nº Títulos / Nr. of Precio € / Price shares € 1.052 146 526 188 2.219 336 2.219 2.800 2.219 1.578 1.883 4.102 2.644 2.543 530 789 2.543 2.543 915 2.543 927 2.389 927 1.224 2.127 1.198 1.198 1.171 1.168 30 1.014 16 1.182 420 286 492 34 1.198 1.198 1.198 1.198 1.198 801 2.654 1.578 2.083 1.086 2.654 927 789 2.508
3,2830 3,2830 3,2830 3,2830 3,2800 3,2800 3,2800 3,2800 3,2800 3,2800 3,2800 3,2800 3,2800 3,2850 3,2850 3,2850 3,2850 3,2850 3,2850 3,2850 3,2850 3,2850 3,2850 3,2850 3,2850 3,2830 3,2830 3,2830 3,2830 3,2830 3,2830 3,2830 3,2830 3,2830 3,2830 3,2830 3,2830 3,2830 3,2830 3,2830 3,2830 3,2830 3,2830 3,2800 3,2800 3,2800 3,2800 3,2800 3,2800 3,2800 3,2800
Hora / Trade Fecha / Date Time 30/07/2026 30/07/2026 30/07/2026 30/07/2026 30/07/2026 30/07/2026 30/07/2026 30/07/2026 30/07/2026 30/07/2026 30/07/2026 30/07/2026 30/07/2026 30/07/2026 30/07/2026 30/07/2026 30/07/2026 30/07/2026 30/07/2026 30/07/2026 30/07/2026 30/07/2026 30/07/2026 30/07/2026 30/07/2026 30/07/2026 30/07/2026 30/07/2026 30/07/2026 30/07/2026 30/07/2026 30/07/2026 30/07/2026 30/07/2026 30/07/2026 30/07/2026 30/07/2026 30/07/2026 30/07/2026 30/07/2026 30/07/2026 30/07/2026 30/07/2026 30/07/2026 30/07/2026 30/07/2026 30/07/2026 30/07/2026 30/07/2026 30/07/2026 30/07/2026
09:58:19 09:58:19 09:58:19 09:59:47 09:59:47 09:59:47 09:59:47 09:59:47 09:59:48 09:59:48 09:59:48 09:59:48 09:59:48 09:59:59 10:00:06 10:00:06 10:00:13 10:00:13 10:00:13 10:00:13 10:00:13 10:00:13 10:00:13 10:00:13 10:00:13 10:00:13 10:00:53 10:00:53 10:01:27 10:01:27 10:01:27 10:01:27 10:01:27 10:01:27 10:01:27 10:01:27 10:01:27 10:01:27 10:01:27 10:01:27 10:01:27 10:01:27 10:01:28 10:01:28 10:01:28 10:39:42 10:39:42 10:39:42 10:39:42 10:39:42 10:39:42
Instrumento Financ./Security
Operación / Transaction
SAB SAB SAB SAB SAB SAB SAB SAB SAB SAB SAB SAB SAB SAB SAB SAB SAB SAB SAB SAB SAB SAB SAB SAB SAB SAB SAB SAB SAB SAB SAB SAB SAB SAB SAB SAB SAB SAB SAB SAB SAB SAB SAB SAB SAB SAB SAB SAB SAB SAB SAB
COMPRA / BUY COMPRA / BUY COMPRA / BUY COMPRA / BUY COMPRA / BUY COMPRA / BUY COMPRA / BUY COMPRA / BUY COMPRA / BUY COMPRA / BUY COMPRA / BUY COMPRA / BUY COMPRA / BUY COMPRA / BUY COMPRA / BUY COMPRA / BUY COMPRA / BUY COMPRA / BUY COMPRA / BUY COMPRA / BUY COMPRA / BUY COMPRA / BUY COMPRA / BUY COMPRA / BUY COMPRA / BUY COMPRA / BUY COMPRA / BUY COMPRA / BUY COMPRA / BUY COMPRA / BUY COMPRA / BUY COMPRA / BUY COMPRA / BUY COMPRA / BUY COMPRA / BUY COMPRA / BUY COMPRA / BUY COMPRA / BUY COMPRA / BUY COMPRA / BUY COMPRA / BUY COMPRA / BUY COMPRA / BUY COMPRA / BUY COMPRA / BUY COMPRA / BUY COMPRA / BUY COMPRA / BUY COMPRA / BUY COMPRA / BUY COMPRA / BUY
Pag. 65
Centro Negociación / Trading Venue XMAD XMAD XMAD CEUX CEUX CEUX CEUX CEUX CEUX CEUX CEUX CEUX CEUX CEUX CEUX CEUX XMAD XMAD XMAD XMAD XMAD XMAD XMAD XMAD XMAD XMAD XMAD XMAD CEUX CEUX CEUX CEUX CEUX CEUX CEUX CEUX CEUX CEUX CEUX CEUX CEUX CEUX CEUX CEUX CEUX XMAD XMAD XMAD XMAD XMAD XMAD
Nº Títulos / Nr. of Precio € / Price shares € 927 2.654 2.140 485 1.502 216 1.771 1.987 1.987 1.178 1.987 1.577 242 5 163 1.900 1.578 2.065 927 1.337 927 1.578 3.014 2.087 2.894 2.227 1.337 29 1.219 1.219 1.219 1.219 1.219 828 391 828 169 1.050 1.219 355 1.219 3 1.216 1.219 408 2.219 69 2.219 2.150 4.369 2.219
3,2800 3,2800 3,2800 3,2770 3,2770 3,2770 3,2770 3,2770 3,2770 3,2770 3,2770 3,2770 3,2770 3,2770 3,2770 3,2770 3,2750 3,2750 3,2750 3,2750 3,2750 3,2750 3,2750 3,2750 3,2750 3,2750 3,2750 3,2750 3,2730 3,2730 3,2730 3,2730 3,2730 3,2730 3,2730 3,2730 3,2730 3,2730 3,2730 3,2730 3,2730 3,2730 3,2730 3,2730 3,2730 3,2750 3,2750 3,2750 3,2750 3,2750 3,2750
Hora / Trade Fecha / Date Time 30/07/2026 30/07/2026 30/07/2026 30/07/2026 30/07/2026 30/07/2026 30/07/2026 30/07/2026 30/07/2026 30/07/2026 30/07/2026 30/07/2026 30/07/2026 30/07/2026 30/07/2026 30/07/2026 30/07/2026 30/07/2026 30/07/2026 30/07/2026 30/07/2026 30/07/2026 30/07/2026 30/07/2026 30/07/2026 30/07/2026 30/07/2026 30/07/2026 30/07/2026 30/07/2026 30/07/2026 30/07/2026 30/07/2026 30/07/2026 30/07/2026 30/07/2026 30/07/2026 30/07/2026 30/07/2026 30/07/2026 30/07/2026 30/07/2026 30/07/2026 30/07/2026 30/07/2026 30/07/2026 30/07/2026 30/07/2026 30/07/2026 30/07/2026 30/07/2026
10:39:42 10:39:42 10:39:42 10:43:46 10:43:46 10:43:51 10:43:51 10:43:51 10:43:51 10:43:51 10:43:51 10:43:51 10:43:51 10:43:51 10:43:51 10:54:25 10:54:25 10:55:01 10:55:01 10:55:02 10:55:07 10:55:07 10:55:08 10:55:08 10:56:21 10:56:33 10:56:33 10:56:33 10:56:33 10:56:33 10:56:33 10:56:33 11:19:06 11:19:06 11:30:20 11:30:20 11:30:20 11:30:20 11:30:20 11:30:20 11:30:20 11:30:20 11:30:20 11:30:20 11:40:23 11:40:23 11:40:23 11:40:23 11:40:23 11:40:23 11:40:23
Instrumento Financ./Security
Operación / Transaction
SAB SAB SAB SAB SAB SAB SAB SAB SAB SAB SAB SAB SAB SAB SAB SAB SAB SAB SAB SAB SAB SAB SAB SAB SAB SAB SAB SAB SAB SAB SAB SAB SAB SAB SAB SAB SAB SAB SAB SAB SAB SAB SAB SAB SAB SAB SAB SAB SAB SAB SAB
COMPRA / BUY COMPRA / BUY COMPRA / BUY COMPRA / BUY COMPRA / BUY COMPRA / BUY COMPRA / BUY COMPRA / BUY COMPRA / BUY COMPRA / BUY COMPRA / BUY COMPRA / BUY COMPRA / BUY COMPRA / BUY COMPRA / BUY COMPRA / BUY COMPRA / BUY COMPRA / BUY COMPRA / BUY COMPRA / BUY COMPRA / BUY COMPRA / BUY COMPRA / BUY COMPRA / BUY COMPRA / BUY COMPRA / BUY COMPRA / BUY COMPRA / BUY COMPRA / BUY COMPRA / BUY COMPRA / BUY COMPRA / BUY COMPRA / BUY COMPRA / BUY COMPRA / BUY COMPRA / BUY COMPRA / BUY COMPRA / BUY COMPRA / BUY COMPRA / BUY COMPRA / BUY COMPRA / BUY COMPRA / BUY COMPRA / BUY COMPRA / BUY COMPRA / BUY COMPRA / BUY COMPRA / BUY COMPRA / BUY COMPRA / BUY COMPRA / BUY
Pag. 66
Centro Negociación / Trading Venue XMAD XMAD XMAD CEUX CEUX CEUX CEUX CEUX CEUX CEUX CEUX CEUX CEUX CEUX CEUX CEUX CEUX CEUX CEUX CEUX CEUX CEUX CEUX CEUX XMAD XMAD XMAD XMAD XMAD XMAD XMAD XMAD XMAD XMAD XMAD XMAD XMAD XMAD XMAD XMAD XMAD XMAD XMAD XMAD XMAD XMAD XMAD XMAD XMAD XMAD XMAD
Nº Títulos / Nr. of Precio € / Price shares € 1.615 4.438 702 1.219 1.219 298 66 855 210 789 253 12 165 1.219 752 1.219 1.219 1.219 76 256 963 1.219 1.219 553 2.876 2.876 6.551 1.578 2.077 1.247 51 2.744 2.219 1.578 641 2.219 2.219 2.219 1.578 2.219 2.065 927 927 1.189 2.432 2.432 1.578 2.432 927 20 2.400
3,2750 3,2750 3,2750 3,2730 3,2730 3,2730 3,2730 3,2730 3,2730 3,2730 3,2730 3,2730 3,2730 3,2730 3,2730 3,2730 3,2730 3,2730 3,2730 3,2730 3,2730 3,2730 3,2730 3,2730 3,2720 3,2720 3,2720 3,2720 3,2720 3,2720 3,2720 3,2720 3,2800 3,2800 3,2840 3,2840 3,2840 3,2840 3,2840 3,2840 3,2840 3,2840 3,2840 3,2840 3,2850 3,2850 3,2850 3,2850 3,2850 3,2850 3,2850
Hora / Trade Fecha / Date Time 30/07/2026 30/07/2026 30/07/2026 30/07/2026 30/07/2026 30/07/2026 30/07/2026 30/07/2026 30/07/2026 30/07/2026 30/07/2026 30/07/2026 30/07/2026 30/07/2026 30/07/2026 30/07/2026 30/07/2026 30/07/2026 30/07/2026 30/07/2026 30/07/2026 30/07/2026 30/07/2026 30/07/2026 30/07/2026 30/07/2026 30/07/2026 30/07/2026 30/07/2026 30/07/2026 30/07/2026 30/07/2026 30/07/2026 30/07/2026 30/07/2026 30/07/2026 30/07/2026 30/07/2026 30/07/2026 30/07/2026 30/07/2026 30/07/2026 30/07/2026 30/07/2026 30/07/2026 30/07/2026 30/07/2026 30/07/2026 30/07/2026 30/07/2026 30/07/2026
11:40:23 11:40:23 11:40:23 11:40:23 11:54:25 11:54:25 11:54:25 11:54:25 11:54:25 11:54:25 11:54:25 11:54:25 11:54:25 11:56:10 11:56:10 11:56:27 11:56:27 11:56:27 11:56:32 11:56:32 11:56:32 11:56:32 11:56:32 11:56:32 11:56:53 11:56:53 11:56:53 11:56:53 11:56:53 12:30:59 12:30:59 12:30:59 12:30:59 12:30:59 12:30:59 12:39:02 12:39:02 12:39:02 12:39:02 12:39:02 12:39:02 12:39:02 12:39:02 12:39:02 12:39:02 12:56:25 12:56:25 12:56:25 12:56:25 12:56:25 13:26:37
Instrumento Financ./Security
Operación / Transaction
SAB SAB SAB SAB SAB SAB SAB SAB SAB SAB SAB SAB SAB SAB SAB SAB SAB SAB SAB SAB SAB SAB SAB SAB SAB SAB SAB SAB SAB SAB SAB SAB SAB SAB SAB SAB SAB SAB SAB SAB SAB SAB SAB SAB SAB SAB SAB SAB SAB SAB SAB
COMPRA / BUY COMPRA / BUY COMPRA / BUY COMPRA / BUY COMPRA / BUY COMPRA / BUY COMPRA / BUY COMPRA / BUY COMPRA / BUY COMPRA / BUY COMPRA / BUY COMPRA / BUY COMPRA / BUY COMPRA / BUY COMPRA / BUY COMPRA / BUY COMPRA / BUY COMPRA / BUY COMPRA / BUY COMPRA / BUY COMPRA / BUY COMPRA / BUY COMPRA / BUY COMPRA / BUY COMPRA / BUY COMPRA / BUY COMPRA / BUY COMPRA / BUY COMPRA / BUY COMPRA / BUY COMPRA / BUY COMPRA / BUY COMPRA / BUY COMPRA / BUY COMPRA / BUY COMPRA / BUY COMPRA / BUY COMPRA / BUY COMPRA / BUY COMPRA / BUY COMPRA / BUY COMPRA / BUY COMPRA / BUY COMPRA / BUY COMPRA / BUY COMPRA / BUY COMPRA / BUY COMPRA / BUY COMPRA / BUY COMPRA / BUY COMPRA / BUY
Pag. 67
Centro Negociación / Trading Venue XMAD XMAD XMAD XMAD XMAD XMAD XMAD XMAD XMAD XMAD XMAD XMAD XMAD CEUX CEUX CEUX CEUX CEUX CEUX CEUX CEUX CEUX CEUX CEUX CEUX CEUX CEUX CEUX CEUX XMAD XMAD XMAD XMAD XMAD XMAD XMAD XMAD XMAD XMAD XMAD XMAD XMAD XMAD XMAD XMAD XMAD XMAD XMAD XMAD CEUX XMAD
Nº Títulos / Nr. of Precio € / Price shares € 2.278 927 2.600 1.974 2.432 1.578 2.432 2.432 3.286 3.286 3.286 1.159 109 884 9 305 1.198 330 1.198 1.198 1.198 1.198 1.198 431 1.198 1.198 1.198 1.198 1.061 2.219 4.734 2.219 2.219 6.657 1.952 2.987 2.987 2.987 1.578 2.987 789 2.833 927 927 998 2.432 2.053 927 14.588 1.876 1.271
3,2850 3,2850 3,2850 3,2850 3,2850 3,2850 3,2850 3,2850 3,2850 3,2850 3,2850 3,2850 3,2850 3,2830 3,2830 3,2830 3,2830 3,2830 3,2830 3,2830 3,2830 3,2830 3,2830 3,2830 3,2830 3,2830 3,2830 3,2830 3,2830 3,2900 3,2900 3,2900 3,2900 3,2900 3,2900 3,2950 3,2950 3,2950 3,2950 3,2950 3,2950 3,2950 3,2950 3,2950 3,2950 3,2950 3,2950 3,2950 3,2950 3,2930 3,2970
Hora / Trade Fecha / Date Time 30/07/2026 30/07/2026 30/07/2026 30/07/2026 30/07/2026 30/07/2026 30/07/2026 30/07/2026 30/07/2026 30/07/2026 30/07/2026 30/07/2026 30/07/2026 30/07/2026 30/07/2026 30/07/2026 30/07/2026 30/07/2026 30/07/2026 30/07/2026 30/07/2026 30/07/2026 30/07/2026 30/07/2026 30/07/2026 30/07/2026 30/07/2026 30/07/2026 30/07/2026 30/07/2026 30/07/2026 30/07/2026 30/07/2026 30/07/2026 30/07/2026 30/07/2026 30/07/2026 30/07/2026 30/07/2026 30/07/2026 30/07/2026 30/07/2026 30/07/2026 30/07/2026 30/07/2026 30/07/2026 30/07/2026 30/07/2026 30/07/2026 30/07/2026 30/07/2026
13:26:37 13:26:37 13:26:37 13:26:37 13:26:37 13:32:15 13:33:46 13:33:46 13:34:29 13:34:29 13:34:29 13:34:29 13:34:29 13:34:29 13:34:29 13:40:17 13:40:17 13:40:17 13:40:17 13:40:21 13:40:21 13:40:21 13:40:21 13:40:28 13:42:03 13:42:43 13:48:38 14:03:48 14:03:48 14:03:48 14:03:48 14:03:48 14:03:48 14:03:48 14:06:34 14:06:34 14:06:34 14:06:34 14:06:34 14:06:34 14:06:34 14:06:34 14:06:34 14:06:34 14:06:34 14:06:34 14:06:34 14:06:34 14:06:34 14:06:34 14:06:34
Instrumento Financ./Security
Operación / Transaction
SAB SAB SAB SAB SAB SAB SAB SAB SAB SAB SAB SAB SAB SAB SAB SAB SAB SAB SAB SAB SAB SAB SAB SAB SAB SAB SAB SAB SAB SAB SAB SAB SAB SAB SAB SAB SAB SAB SAB SAB SAB SAB SAB SAB SAB SAB SAB SAB SAB SAB SAB
COMPRA / BUY COMPRA / BUY COMPRA / BUY COMPRA / BUY COMPRA / BUY COMPRA / BUY COMPRA / BUY COMPRA / BUY COMPRA / BUY COMPRA / BUY COMPRA / BUY COMPRA / BUY COMPRA / BUY COMPRA / BUY COMPRA / BUY COMPRA / BUY COMPRA / BUY COMPRA / BUY COMPRA / BUY COMPRA / BUY COMPRA / BUY COMPRA / BUY COMPRA / BUY COMPRA / BUY COMPRA / BUY COMPRA / BUY COMPRA / BUY COMPRA / BUY COMPRA / BUY COMPRA / BUY COMPRA / BUY COMPRA / BUY COMPRA / BUY COMPRA / BUY COMPRA / BUY COMPRA / BUY COMPRA / BUY COMPRA / BUY COMPRA / BUY COMPRA / BUY COMPRA / BUY COMPRA / BUY COMPRA / BUY COMPRA / BUY COMPRA / BUY COMPRA / BUY COMPRA / BUY COMPRA / BUY COMPRA / BUY COMPRA / BUY COMPRA / BUY
Pag. 68
Centro Negociación / Trading Venue XMAD XMAD XMAD XMAD XMAD XMAD XMAD XMAD XMAD XMAD XMAD XMAD XMAD XMAD XMAD CEUX CEUX CEUX CEUX CEUX CEUX CEUX CEUX CEUX XMAD XMAD XMAD XMAD XMAD XMAD XMAD XMAD XMAD XMAD CEUX CEUX CEUX CEUX CEUX CEUX XMAD XMAD XMAD XMAD XMAD XMAD XMAD XMAD XMAD XMAD XMAD
Nº Títulos / Nr. of Precio € / Price shares € 927 5.922 3.528 927 2.639 1.810 2.432 544 2.321 1.578 6.875 2.900 2.321 3.867 138 1.876 1.804 72 866 1.876 1.876 1.876 1.593 1.285 1.043 1.756 188 2.987 2.987 2.987 4.533 2.987 5.974 4.558 1.987 1.987 1.562 400 327 889 1.578 194 2.065 327 927 927 6.040 1.578 601 2.445 1.070
3,2970 3,2970 3,2970 3,2970 3,2970 3,3000 3,3000 3,3000 3,2980 3,2980 3,2980 3,2980 3,2980 3,2980 3,2980 3,2970 3,2970 3,2970 3,2970 3,2970 3,2970 3,2970 3,2970 3,2970 3,2950 3,2950 3,2950 3,2950 3,2950 3,2950 3,2950 3,2950 3,2950 3,2950 3,2930 3,2930 3,2930 3,2930 3,2930 3,2930 3,2930 3,2930 3,2930 3,2930 3,2930 3,2930 3,2930 3,2930 3,2930 3,2930 3,2930
Hora / Trade Fecha / Date Time 30/07/2026 30/07/2026 30/07/2026 30/07/2026 30/07/2026 30/07/2026 30/07/2026 30/07/2026 30/07/2026 30/07/2026 30/07/2026 30/07/2026 30/07/2026 30/07/2026 30/07/2026 30/07/2026 30/07/2026 30/07/2026 30/07/2026 30/07/2026 30/07/2026 30/07/2026 30/07/2026 30/07/2026 30/07/2026 30/07/2026 30/07/2026 30/07/2026 30/07/2026 30/07/2026 30/07/2026 30/07/2026 30/07/2026 30/07/2026 30/07/2026 30/07/2026 30/07/2026 30/07/2026 30/07/2026 30/07/2026 30/07/2026 30/07/2026 30/07/2026 30/07/2026 30/07/2026 30/07/2026 30/07/2026 30/07/2026 30/07/2026 30/07/2026 30/07/2026
14:06:34 14:06:39 14:07:46 14:08:14 14:08:14 14:08:14 14:08:14 14:08:14 14:29:55 14:29:55 14:29:55 14:30:02 14:30:02 14:30:02 14:30:07 14:30:07 14:30:07 14:30:15 14:30:15 14:31:05 14:31:05 14:31:05 14:31:05 14:31:05 14:31:05 14:31:05 14:31:05 14:31:05 14:31:06 14:31:26 14:31:26 14:32:30 14:32:30 14:39:30 14:39:30 14:39:30 14:39:30 14:39:30 14:39:30 14:40:07 14:40:07 14:40:07 14:40:07 14:40:07 14:40:07 14:58:46 14:58:46 14:58:46 14:58:46 15:00:03 15:02:08
Instrumento Financ./Security
Operación / Transaction
SAB SAB SAB SAB SAB SAB SAB SAB SAB SAB SAB SAB SAB SAB SAB SAB SAB SAB SAB SAB SAB SAB SAB SAB SAB SAB SAB SAB SAB SAB SAB SAB SAB SAB SAB SAB SAB SAB SAB SAB SAB SAB SAB SAB SAB SAB SAB SAB SAB SAB SAB
COMPRA / BUY COMPRA / BUY COMPRA / BUY COMPRA / BUY COMPRA / BUY COMPRA / BUY COMPRA / BUY COMPRA / BUY COMPRA / BUY COMPRA / BUY COMPRA / BUY COMPRA / BUY COMPRA / BUY COMPRA / BUY COMPRA / BUY COMPRA / BUY COMPRA / BUY COMPRA / BUY COMPRA / BUY COMPRA / BUY COMPRA / BUY COMPRA / BUY COMPRA / BUY COMPRA / BUY COMPRA / BUY COMPRA / BUY COMPRA / BUY COMPRA / BUY COMPRA / BUY COMPRA / BUY COMPRA / BUY COMPRA / BUY COMPRA / BUY COMPRA / BUY COMPRA / BUY COMPRA / BUY COMPRA / BUY COMPRA / BUY COMPRA / BUY COMPRA / BUY COMPRA / BUY COMPRA / BUY COMPRA / BUY COMPRA / BUY COMPRA / BUY COMPRA / BUY COMPRA / BUY COMPRA / BUY COMPRA / BUY COMPRA / BUY COMPRA / BUY
Pag. 69
Centro Negociación / Trading Venue CEUX XMAD CEUX CEUX CEUX CEUX CEUX XMAD XMAD XMAD XMAD XMAD XMAD XMAD XMAD XMAD XMAD XMAD XMAD CEUX CEUX CEUX CEUX CEUX CEUX CEUX CEUX CEUX CEUX CEUX CEUX XMAD XMAD XMAD XMAD XMAD XMAD XMAD XMAD XMAD XMAD XMAD XMAD XMAD XMAD XMAD XMAD XMAD XMAD XMAD CEUX
Nº Títulos / Nr. of Precio € / Price shares € 3 2.219 368 1.987 1.987 1.987 1.516 29 2.321 2.778 3.974 211 1.578 743 2.321 1.578 2.289 775 1.432 1.876 145 1.876 1.876 1.876 1.618 155 1.721 1.876 1.876 73 32 1.000 1.432 2.432 6.145 1.888 3.300 2.432 1.371 2.432 1.578 8.363 2.432 2.200 2.995 2.219 2.061 301 4.103 192 1.198
3,2930 3,2930 3,2930 3,2930 3,2930 3,2930 3,2930 3,2930 3,2980 3,2980 3,2980 3,2980 3,2980 3,2980 3,2980 3,2980 3,2980 3,2980 3,2980 3,2970 3,2970 3,2970 3,2970 3,2970 3,2970 3,2970 3,2970 3,2970 3,2970 3,2970 3,2970 3,2950 3,2950 3,3020 3,3020 3,3020 3,3020 3,3020 3,3020 3,3000 3,3000 3,3000 3,3000 3,3000 3,3000 3,3050 3,3050 3,3050 3,3050 3,3090 3,3130
Hora / Trade Fecha / Date Time 30/07/2026 30/07/2026 30/07/2026 30/07/2026 30/07/2026 30/07/2026 30/07/2026 30/07/2026 30/07/2026 30/07/2026 30/07/2026 30/07/2026 30/07/2026 30/07/2026 30/07/2026 30/07/2026 30/07/2026 30/07/2026 30/07/2026 30/07/2026 30/07/2026 30/07/2026 30/07/2026 30/07/2026 30/07/2026 30/07/2026 30/07/2026 30/07/2026 30/07/2026 30/07/2026 30/07/2026 30/07/2026 30/07/2026 30/07/2026 30/07/2026 30/07/2026 30/07/2026 30/07/2026 30/07/2026 30/07/2026 30/07/2026 30/07/2026 30/07/2026 30/07/2026 30/07/2026 30/07/2026 30/07/2026 30/07/2026 30/07/2026 30/07/2026 30/07/2026
15:02:08 15:02:08 15:02:08 15:02:10 15:03:52 15:03:56 15:03:56 15:03:56 15:03:56 15:03:56 15:03:56 15:03:56 15:03:56 15:03:56 15:03:56 15:03:56 15:04:14 15:04:14 15:04:14 15:19:19 15:19:19 15:19:19 15:19:19 15:19:19 15:19:19 15:19:19 15:19:19 15:19:19 15:19:19 15:19:19 15:19:51 15:19:51 15:19:51 15:20:13 15:20:24 15:20:24 15:20:24 15:20:24 15:20:24 15:20:24 15:20:24 15:20:24 15:20:35 15:20:35 15:20:35 15:20:35 15:20:35 15:20:48 15:20:48 15:20:48 15:20:48
Instrumento Financ./Security
Operación / Transaction
SAB SAB SAB SAB SAB SAB SAB SAB SAB SAB SAB SAB SAB SAB SAB SAB SAB SAB SAB SAB SAB SAB SAB SAB SAB SAB SAB SAB SAB SAB SAB SAB SAB SAB SAB SAB SAB SAB SAB SAB SAB SAB SAB SAB SAB SAB SAB SAB SAB SAB SAB
COMPRA / BUY COMPRA / BUY COMPRA / BUY COMPRA / BUY COMPRA / BUY COMPRA / BUY COMPRA / BUY COMPRA / BUY COMPRA / BUY COMPRA / BUY COMPRA / BUY COMPRA / BUY COMPRA / BUY COMPRA / BUY COMPRA / BUY COMPRA / BUY COMPRA / BUY COMPRA / BUY COMPRA / BUY COMPRA / BUY COMPRA / BUY COMPRA / BUY COMPRA / BUY COMPRA / BUY COMPRA / BUY COMPRA / BUY COMPRA / BUY COMPRA / BUY COMPRA / BUY COMPRA / BUY COMPRA / BUY COMPRA / BUY COMPRA / BUY COMPRA / BUY COMPRA / BUY COMPRA / BUY COMPRA / BUY COMPRA / BUY COMPRA / BUY COMPRA / BUY COMPRA / BUY COMPRA / BUY COMPRA / BUY COMPRA / BUY COMPRA / BUY COMPRA / BUY COMPRA / BUY COMPRA / BUY COMPRA / BUY COMPRA / BUY COMPRA / BUY
Pag. 70
Centro Negociación / Trading Venue CEUX CEUX CEUX CEUX CEUX CEUX CEUX CEUX CEUX CEUX CEUX CEUX CEUX CEUX CEUX CEUX XMAD XMAD XMAD XMAD XMAD XMAD XMAD XMAD XMAD XMAD XMAD XMAD XMAD XMAD CEUX CEUX CEUX CEUX CEUX CEUX CEUX CEUX CEUX CEUX CEUX CEUX CEUX CEUX CEUX CEUX CEUX CEUX CEUX CEUX CEUX
Nº Títulos / Nr. of Precio € / Price shares € 1.198 11 1.198 1.198 862 336 728 263 207 837 1.198 1.198 1.198 1.198 1.198 974 2.219 5.291 3.614 2.258 1.578 2.258 927 927 2.104 680 2.226 1.578 2.900 2.564 59 1.139 641 140 417 463 1.198 85 413 700 259 462 736 758 440 1.198 587 611 1.198 523 1.198
3,3130 3,3130 3,3130 3,3130 3,3130 3,3130 3,3130 3,3130 3,3130 3,3130 3,3130 3,3130 3,3130 3,3130 3,3130 3,3130 3,3120 3,3120 3,3120 3,3150 3,3150 3,3150 3,3150 3,3150 3,3150 3,3150 3,3150 3,3150 3,3150 3,3150 3,3130 3,3130 3,3130 3,3130 3,3130 3,3130 3,3130 3,3130 3,3130 3,3130 3,3130 3,3130 3,3130 3,3130 3,3130 3,3130 3,3130 3,3130 3,3130 3,3130 3,3130
Hora / Trade Fecha / Date Time 30/07/2026 30/07/2026 30/07/2026 30/07/2026 30/07/2026 30/07/2026 30/07/2026 30/07/2026 30/07/2026 30/07/2026 30/07/2026 30/07/2026 30/07/2026 30/07/2026 30/07/2026 30/07/2026 30/07/2026 30/07/2026 30/07/2026 30/07/2026 30/07/2026 30/07/2026 30/07/2026 30/07/2026 30/07/2026 30/07/2026 30/07/2026 30/07/2026 30/07/2026 30/07/2026 30/07/2026 30/07/2026 30/07/2026 30/07/2026 30/07/2026 30/07/2026 30/07/2026 30/07/2026 30/07/2026 30/07/2026 30/07/2026 30/07/2026 30/07/2026 30/07/2026 30/07/2026 30/07/2026 30/07/2026 30/07/2026 30/07/2026 30/07/2026 30/07/2026
15:20:48 15:20:48 15:40:41 15:42:07 15:43:08 15:43:08 15:57:24 15:57:24 15:57:24 15:58:33 15:58:33 16:01:34 16:01:34 16:01:34 16:01:34 16:01:34 16:01:46 16:01:52 16:01:52 16:01:52 16:01:52 16:01:52 16:01:52 16:01:52 16:01:52 16:04:03 16:04:03 16:04:03 16:04:32 16:04:32 16:04:32 16:05:05 16:05:05 16:10:22 16:10:22 16:10:22 16:10:22 16:10:22 16:10:22 16:21:45 16:21:45 16:22:47 16:22:47 16:22:47 16:22:47 16:22:58 16:23:25 16:24:03 16:24:26 16:24:26 16:24:26
Instrumento Financ./Security
Operación / Transaction
SAB SAB SAB SAB SAB SAB SAB SAB SAB SAB SAB SAB SAB SAB SAB SAB SAB SAB SAB SAB SAB SAB SAB SAB SAB SAB SAB SAB SAB SAB SAB SAB SAB SAB SAB SAB SAB SAB SAB SAB SAB SAB SAB SAB SAB SAB SAB SAB SAB SAB SAB
COMPRA / BUY COMPRA / BUY COMPRA / BUY COMPRA / BUY COMPRA / BUY COMPRA / BUY COMPRA / BUY COMPRA / BUY COMPRA / BUY COMPRA / BUY COMPRA / BUY COMPRA / BUY COMPRA / BUY COMPRA / BUY COMPRA / BUY COMPRA / BUY COMPRA / BUY COMPRA / BUY COMPRA / BUY COMPRA / BUY COMPRA / BUY COMPRA / BUY COMPRA / BUY COMPRA / BUY COMPRA / BUY COMPRA / BUY COMPRA / BUY COMPRA / BUY COMPRA / BUY COMPRA / BUY COMPRA / BUY COMPRA / BUY COMPRA / BUY COMPRA / BUY COMPRA / BUY COMPRA / BUY COMPRA / BUY COMPRA / BUY COMPRA / BUY COMPRA / BUY COMPRA / BUY COMPRA / BUY COMPRA / BUY COMPRA / BUY COMPRA / BUY COMPRA / BUY COMPRA / BUY COMPRA / BUY COMPRA / BUY COMPRA / BUY COMPRA / BUY
Pag. 71
Centro Negociación / Trading Venue CEUX CEUX XMAD XMAD XMAD XMAD XMAD XMAD XMAD XMAD XMAD CEUX CEUX CEUX CEUX CEUX CEUX CEUX CEUX CEUX CEUX CEUX CEUX CEUX CEUX XMAD XMAD XMAD XMAD XMAD XMAD XMAD XMAD XMAD XMAD XMAD XMAD XMAD XMAD XMAD XMAD XMAD XMAD XMAD XMAD XMAD XMAD XMAD XMAD XMAD XMAD
Nº Títulos / Nr. of Precio € / Price shares € 1.198 577 2.369 2.369 2.369 4.848 2.259 3.945 1.841 2.159 17.841 1.876 1.876 1.876 613 794 1.082 857 1.019 292 253 313 1.018 1.876 1.255 2.543 1.578 15.879 2.357 13.282 860 2.357 1.144 2.357 3.156 1.642 6.461 4.848 1.536 11.104 8.896 1.695 452 2.367 1.578 940 1.556 2.147 1.578 1.832 2.147
3,3130 3,3130 3,3170 3,3170 3,3170 3,3170 3,3260 3,3260 3,3260 3,3250 3,3250 3,3230 3,3230 3,3230 3,3230 3,3230 3,3230 3,3230 3,3230 3,3230 3,3230 3,3230 3,3230 3,3230 3,3230 3,3220 3,3220 3,3220 3,3200 3,3200 3,3200 3,3200 3,3200 3,3200 3,3200 3,3200 3,3200 3,3200 3,3200 3,3200 3,3200 3,3180 3,3180 3,3180 3,3180 3,3180 3,3180 3,3180 3,3180 3,3180 3,3180
Hora / Trade Fecha / Date Time 30/07/2026 30/07/2026 30/07/2026 30/07/2026 30/07/2026 30/07/2026 30/07/2026 30/07/2026 30/07/2026 30/07/2026 30/07/2026 30/07/2026 30/07/2026 30/07/2026 30/07/2026 30/07/2026 30/07/2026 30/07/2026 30/07/2026 30/07/2026 30/07/2026 30/07/2026 30/07/2026 30/07/2026 30/07/2026 30/07/2026 30/07/2026 30/07/2026 30/07/2026 30/07/2026 30/07/2026 30/07/2026 30/07/2026 30/07/2026 30/07/2026 30/07/2026 30/07/2026 30/07/2026 30/07/2026 30/07/2026 30/07/2026 30/07/2026 30/07/2026 30/07/2026 30/07/2026 30/07/2026 30/07/2026 30/07/2026 30/07/2026 30/07/2026 30/07/2026
16:24:26 16:24:26 16:24:26 16:24:26 16:29:34 16:29:42 16:38:04 16:38:04 16:38:04 16:38:04 16:38:04 16:38:04 16:42:36 16:42:36 16:42:36 16:42:36 16:42:36 16:42:37 16:42:37 16:42:37 16:42:37 16:42:37 16:42:37 16:42:37 16:42:37 16:42:37 16:42:37 16:42:37 16:42:37 16:42:37 16:42:37 16:42:37 16:42:37 16:42:37 16:42:37 16:42:37 16:44:49 16:44:49 16:44:49 16:44:49 16:44:49 16:44:49 16:44:49 16:44:49 16:44:49 16:44:49 16:44:56 16:44:56 16:44:56 16:44:56 16:44:56
Instrumento Financ./Security
Operación / Transaction
SAB SAB SAB SAB SAB SAB SAB SAB SAB SAB SAB SAB SAB SAB SAB SAB SAB SAB SAB SAB SAB SAB SAB SAB SAB SAB SAB SAB SAB SAB SAB SAB SAB SAB SAB SAB SAB SAB SAB SAB SAB SAB SAB SAB SAB SAB SAB SAB SAB SAB SAB
COMPRA / BUY COMPRA / BUY COMPRA / BUY COMPRA / BUY COMPRA / BUY COMPRA / BUY COMPRA / BUY COMPRA / BUY COMPRA / BUY COMPRA / BUY COMPRA / BUY COMPRA / BUY COMPRA / BUY COMPRA / BUY COMPRA / BUY COMPRA / BUY COMPRA / BUY COMPRA / BUY COMPRA / BUY COMPRA / BUY COMPRA / BUY COMPRA / BUY COMPRA / BUY COMPRA / BUY COMPRA / BUY COMPRA / BUY COMPRA / BUY COMPRA / BUY COMPRA / BUY COMPRA / BUY COMPRA / BUY COMPRA / BUY COMPRA / BUY COMPRA / BUY COMPRA / BUY COMPRA / BUY COMPRA / BUY COMPRA / BUY COMPRA / BUY COMPRA / BUY COMPRA / BUY COMPRA / BUY COMPRA / BUY COMPRA / BUY COMPRA / BUY COMPRA / BUY COMPRA / BUY COMPRA / BUY COMPRA / BUY COMPRA / BUY COMPRA / BUY
Pag. 72
Centro Negociación / Trading Venue XMAD XMAD XMAD XMAD XMAD XMAD XMAD XMAD XMAD XMAD XMAD XMAD CEUX CEUX CEUX CEUX CEUX XMAD XMAD XMAD XMAD XMAD XMAD XMAD CEUX CEUX CEUX CEUX CEUX CEUX CEUX CEUX CEUX CEUX CEUX CEUX XMAD XMAD XMAD XMAD XMAD XMAD XMAD XMAD XMAD XMAD XMAD XMAD XMAD XMAD XMAD
Nº Títulos / Nr. of Precio € / Price shares € 752 752 752 1.452 3.764 1.811 1.082 7.822 70 2.219 1.054 2.178 1.684 303 263 303 1.315 2.876 3.945 4.276 3.945 2.214 1.578 1.166 1 105 1.987 1.987 549 1.438 549 636 1.351 490 1.987 52 2.219 2.219 2.219 2.219 1.578 2.219 1.578 2.860 641 2.248 2.765 75 4.848 2.765 4.848
3,3180 3,3180 3,3180 3,3180 3,3200 3,3200 3,3200 3,3200 3,3200 3,3200 3,3200 3,3200 3,3200 3,3200 3,3200 3,3200 3,3200 3,3200 3,3200 3,3200 3,3200 3,3200 3,3200 3,3200 3,3200 3,3200 3,3200 3,3200 3,3200 3,3200 3,3200 3,3200 3,3200 3,3200 3,3200 3,3200 3,3200 3,3200 3,3200 3,3200 3,3200 3,3200 3,3200 3,3200 3,3200 3,3200 3,3180 3,3180 3,3180 3,3180 3,3180
Hora / Trade Fecha / Date Time 30/07/2026 30/07/2026 30/07/2026 30/07/2026 30/07/2026 30/07/2026 30/07/2026 30/07/2026 30/07/2026 30/07/2026 30/07/2026 30/07/2026 30/07/2026 30/07/2026 30/07/2026 30/07/2026 30/07/2026 30/07/2026 30/07/2026 30/07/2026 30/07/2026 30/07/2026 30/07/2026 30/07/2026 30/07/2026 30/07/2026 30/07/2026 30/07/2026 30/07/2026 30/07/2026 30/07/2026 30/07/2026 30/07/2026 30/07/2026 30/07/2026 30/07/2026 30/07/2026 30/07/2026 30/07/2026 30/07/2026 30/07/2026 30/07/2026 30/07/2026 30/07/2026 30/07/2026 30/07/2026 30/07/2026 30/07/2026 30/07/2026 30/07/2026 30/07/2026
16:44:56 16:48:52 16:48:52 16:48:54 16:48:54 16:48:54 16:48:54 16:48:54 16:48:54 16:48:54 16:50:03 16:50:03 16:50:03 16:50:03 16:50:03 16:50:03 16:50:03 16:50:03 16:50:14 17:01:59 17:02:06 17:02:06 17:02:06 17:02:06 17:02:06 17:02:06 17:02:06 17:02:06 17:02:07 17:02:07 17:02:07 17:02:07 17:02:09 17:02:09 17:02:09 17:02:09 17:02:09 17:02:09 17:02:09 17:08:46 17:08:46 17:08:46 17:08:46 17:08:46 17:08:46 17:08:46 17:08:46 17:08:46 17:08:46 17:08:46 17:08:46
Instrumento Financ./Security
Operación / Transaction
SAB SAB SAB SAB SAB SAB SAB SAB SAB SAB SAB SAB SAB SAB SAB SAB SAB SAB SAB SAB SAB SAB SAB SAB SAB SAB SAB SAB SAB SAB SAB SAB SAB SAB SAB SAB SAB SAB SAB SAB SAB SAB SAB SAB SAB SAB SAB SAB SAB SAB SAB
COMPRA / BUY COMPRA / BUY COMPRA / BUY COMPRA / BUY COMPRA / BUY COMPRA / BUY COMPRA / BUY COMPRA / BUY COMPRA / BUY COMPRA / BUY COMPRA / BUY COMPRA / BUY COMPRA / BUY COMPRA / BUY COMPRA / BUY COMPRA / BUY COMPRA / BUY COMPRA / BUY COMPRA / BUY COMPRA / BUY COMPRA / BUY COMPRA / BUY COMPRA / BUY COMPRA / BUY COMPRA / BUY COMPRA / BUY COMPRA / BUY COMPRA / BUY COMPRA / BUY COMPRA / BUY COMPRA / BUY COMPRA / BUY COMPRA / BUY COMPRA / BUY COMPRA / BUY COMPRA / BUY COMPRA / BUY COMPRA / BUY COMPRA / BUY COMPRA / BUY COMPRA / BUY COMPRA / BUY COMPRA / BUY COMPRA / BUY COMPRA / BUY COMPRA / BUY COMPRA / BUY COMPRA / BUY COMPRA / BUY COMPRA / BUY COMPRA / BUY
Pag. 73
Centro Negociación / Trading Venue XMAD CEUX CEUX CEUX CEUX CEUX CEUX CEUX CEUX CEUX XMAD XMAD XMAD XMAD XMAD XMAD XMAD XMAD XMAD CEUX CEUX CEUX CEUX CEUX CEUX CEUX CEUX CEUX CEUX CEUX CEUX CEUX CEUX CEUX CEUX CEUX CEUX CEUX CEUX XMAD XMAD XMAD XMAD XMAD XMAD XMAD XMAD CEUX CEUX CEUX CEUX
Nº Títulos / Nr. of Precio € / Price shares € 4.699 361 1.837 2.198 2.198 2.198 606 2.198 2.198 1.206 2.258 3.945 4.084 1.578 2.258 1.578 1.578 1.578 1.143 796 1.080 1.876 1.876 1.340 6 1.870 133 1.876 350 342 188 345 85 566 85 566 168 1.142 310 2.321 2.321 3.867 1.578 2.321 2.321 4.642 629 1.198 413 2 783
3,3180 3,3170 3,3170 3,3170 3,3170 3,3170 3,3170 3,3170 3,3170 3,3170 3,3150 3,3150 3,3150 3,3150 3,3150 3,3150 3,3150 3,3150 3,3150 3,3190 3,3190 3,3190 3,3190 3,3190 3,3190 3,3190 3,3190 3,3190 3,3190 3,3190 3,3190 3,3190 3,3190 3,3190 3,3190 3,3190 3,3190 3,3190 3,3190 3,3180 3,3180 3,3180 3,3180 3,3180 3,3180 3,3180 3,3180 3,3170 3,3170 3,3170 3,3170
Hora / Trade Fecha / Date Time 30/07/2026 30/07/2026 30/07/2026 30/07/2026 30/07/2026 30/07/2026 30/07/2026 30/07/2026 30/07/2026 30/07/2026 30/07/2026 30/07/2026 30/07/2026 30/07/2026 30/07/2026 30/07/2026 30/07/2026 30/07/2026 30/07/2026 30/07/2026 30/07/2026 30/07/2026 30/07/2026 30/07/2026 30/07/2026 30/07/2026 30/07/2026 30/07/2026 30/07/2026 30/07/2026 30/07/2026 30/07/2026 30/07/2026 30/07/2026 31/07/2026 31/07/2026 31/07/2026 31/07/2026 31/07/2026 31/07/2026 31/07/2026 31/07/2026 31/07/2026 31/07/2026 31/07/2026 31/07/2026 31/07/2026 31/07/2026 31/07/2026 31/07/2026 31/07/2026
17:08:46 17:08:46 17:08:46 17:08:46 17:08:46 17:08:46 17:10:29 17:10:29 17:11:22 17:11:22 17:11:22 17:11:22 17:11:22 17:11:22 17:11:22 17:11:22 17:12:03 17:12:03 17:12:03 17:13:48 17:13:48 17:13:48 17:13:48 17:13:48 17:13:48 17:13:48 17:18:30 17:18:30 17:18:30 17:18:30 17:18:30 17:18:30 17:18:30 17:18:30 09:05:23 09:05:23 09:09:05 09:26:58 09:27:05 09:27:05 09:27:05 09:27:05 09:27:05 09:27:05 09:27:05 09:27:05 09:27:05 09:27:05 09:27:05 09:27:05 09:27:05
Instrumento Financ./Security
Operación / Transaction
SAB SAB SAB SAB SAB SAB SAB SAB SAB SAB SAB SAB SAB SAB SAB SAB SAB SAB SAB SAB SAB SAB SAB SAB SAB SAB SAB SAB SAB SAB SAB SAB SAB SAB SAB SAB SAB SAB SAB SAB SAB SAB SAB SAB SAB SAB SAB SAB SAB SAB SAB
COMPRA / BUY COMPRA / BUY COMPRA / BUY COMPRA / BUY COMPRA / BUY COMPRA / BUY COMPRA / BUY COMPRA / BUY COMPRA / BUY COMPRA / BUY COMPRA / BUY COMPRA / BUY COMPRA / BUY COMPRA / BUY COMPRA / BUY COMPRA / BUY COMPRA / BUY COMPRA / BUY COMPRA / BUY COMPRA / BUY COMPRA / BUY COMPRA / BUY COMPRA / BUY COMPRA / BUY COMPRA / BUY COMPRA / BUY COMPRA / BUY COMPRA / BUY COMPRA / BUY COMPRA / BUY COMPRA / BUY COMPRA / BUY COMPRA / BUY COMPRA / BUY COMPRA / BUY COMPRA / BUY COMPRA / BUY COMPRA / BUY COMPRA / BUY COMPRA / BUY COMPRA / BUY COMPRA / BUY COMPRA / BUY COMPRA / BUY COMPRA / BUY COMPRA / BUY COMPRA / BUY COMPRA / BUY COMPRA / BUY COMPRA / BUY COMPRA / BUY
Pag. 74
Centro Negociación / Trading Venue CEUX CEUX CEUX CEUX CEUX CEUX CEUX CEUX XMAD XMAD XMAD XMAD XMAD XMAD XMAD XMAD XMAD XMAD XMAD XMAD XMAD XMAD XMAD XMAD XMAD XMAD XMAD XMAD XMAD XMAD XMAD XMAD XMAD XMAD CEUX CEUX XMAD XMAD XMAD XMAD XMAD XMAD XMAD XMAD XMAD XMAD CEUX CEUX CEUX CEUX CEUX
Nº Títulos / Nr. of Precio € / Price shares € 1.198 1.198 1.198 1.198 1.198 98 1.198 318 2.198 2.198 1.094 2.198 2.650 3.302 3.302 3.058 2.432 6.064 11.504 2.219 1.578 6.064 2.219 3.765 1.234 2.921 2.432 2.432 3.156 2.432 1.209 2.432 4.864 1.043 377 1.610 2.432 563 4.841 1.892 1.632 800 800 2.432 3.934 674 1.987 1.987 1.987 1.987 250
3,3170 3,3170 3,3170 3,3170 3,3170 3,3170 3,3190 3,3190 3,3180 3,3180 3,3180 3,3180 3,3180 3,3180 3,3180 3,3180 3,3160 3,3160 3,3160 3,3180 3,3180 3,3180 3,3180 3,3180 3,3180 3,3180 3,3180 3,3180 3,3180 3,3180 3,3180 3,3180 3,3180 3,3180 3,3430 3,3430 3,3450 3,3600 3,3600 3,3600 3,3600 3,3600 3,3600 3,3600 3,3600 3,3600 3,3570 3,3570 3,3570 3,3570 3,3570
Hora / Trade Fecha / Date Time 31/07/2026 31/07/2026 31/07/2026 31/07/2026 31/07/2026 31/07/2026 31/07/2026 31/07/2026 31/07/2026 31/07/2026 31/07/2026 31/07/2026 31/07/2026 31/07/2026 31/07/2026 31/07/2026 31/07/2026 31/07/2026 31/07/2026 31/07/2026 31/07/2026 31/07/2026 31/07/2026 31/07/2026 31/07/2026 31/07/2026 31/07/2026 31/07/2026 31/07/2026 31/07/2026 31/07/2026 31/07/2026 31/07/2026 31/07/2026 31/07/2026 31/07/2026 31/07/2026 31/07/2026 31/07/2026 31/07/2026 31/07/2026 31/07/2026 31/07/2026 31/07/2026 31/07/2026 31/07/2026 31/07/2026 31/07/2026 31/07/2026 31/07/2026 31/07/2026
09:27:05 09:27:05 09:27:05 09:27:05 09:27:05 09:27:06 09:27:06 09:27:06 09:27:06 09:27:06 09:29:33 09:29:41 09:29:41 09:29:41 09:29:41 09:29:41 09:30:26 09:30:26 09:30:26 09:30:26 09:30:26 09:30:26 09:30:26 09:30:26 09:30:26 09:30:42 09:30:46 09:30:46 09:30:46 09:30:46 09:30:46 09:30:46 09:30:46 09:30:46 09:30:46 09:31:47 09:31:47 09:31:47 09:31:47 09:31:47 09:31:47 09:31:47 09:31:47 09:31:47 09:31:47 09:31:47 09:40:08 09:40:30 09:40:30 09:40:30 09:40:30
Instrumento Financ./Security
Operación / Transaction
SAB SAB SAB SAB SAB SAB SAB SAB SAB SAB SAB SAB SAB SAB SAB SAB SAB SAB SAB SAB SAB SAB SAB SAB SAB SAB SAB SAB SAB SAB SAB SAB SAB SAB SAB SAB SAB SAB SAB SAB SAB SAB SAB SAB SAB SAB SAB SAB SAB SAB SAB
COMPRA / BUY COMPRA / BUY COMPRA / BUY COMPRA / BUY COMPRA / BUY COMPRA / BUY COMPRA / BUY COMPRA / BUY COMPRA / BUY COMPRA / BUY COMPRA / BUY COMPRA / BUY COMPRA / BUY COMPRA / BUY COMPRA / BUY COMPRA / BUY COMPRA / BUY COMPRA / BUY COMPRA / BUY COMPRA / BUY COMPRA / BUY COMPRA / BUY COMPRA / BUY COMPRA / BUY COMPRA / BUY COMPRA / BUY COMPRA / BUY COMPRA / BUY COMPRA / BUY COMPRA / BUY COMPRA / BUY COMPRA / BUY COMPRA / BUY COMPRA / BUY COMPRA / BUY COMPRA / BUY COMPRA / BUY COMPRA / BUY COMPRA / BUY COMPRA / BUY COMPRA / BUY COMPRA / BUY COMPRA / BUY COMPRA / BUY COMPRA / BUY COMPRA / BUY COMPRA / BUY COMPRA / BUY COMPRA / BUY COMPRA / BUY COMPRA / BUY
Pag. 75
Centro Negociación / Trading Venue CEUX CEUX CEUX CEUX CEUX XMAD XMAD XMAD XMAD XMAD XMAD XMAD XMAD XMAD XMAD XMAD CEUX CEUX CEUX CEUX CEUX CEUX CEUX CEUX CEUX CEUX CEUX CEUX CEUX CEUX CEUX CEUX CEUX CEUX CEUX XMAD XMAD XMAD XMAD XMAD XMAD XMAD XMAD XMAD XMAD XMAD CEUX CEUX CEUX CEUX CEUX
Nº Títulos / Nr. of Precio € / Price shares € 1.737 250 1.293 694 841 1.725 422 2.147 1.495 652 2.147 2.147 1.632 3.649 2.147 1.837 489 730 268 1.219 49 165 1.054 1.219 1.219 1.219 1.219 1.219 1.219 1.219 1.219 639 44 536 55 2.198 1.632 2.198 2.600 2.448 2.468 1.632 1.632 1.692 901 599 1.321 1.040 281 890 272
3,3570 3,3570 3,3570 3,3570 3,3570 3,3550 3,3550 3,3550 3,3550 3,3550 3,3550 3,3550 3,3550 3,3550 3,3550 3,3550 3,3530 3,3530 3,3530 3,3530 3,3530 3,3530 3,3530 3,3530 3,3530 3,3530 3,3530 3,3530 3,3530 3,3530 3,3530 3,3530 3,3530 3,3530 3,3530 3,3500 3,3500 3,3500 3,3500 3,3500 3,3500 3,3500 3,3500 3,3500 3,3500 3,3500 3,3470 3,3470 3,3470 3,3470 3,3470
Hora / Trade Fecha / Date Time 31/07/2026 31/07/2026 31/07/2026 31/07/2026 31/07/2026 31/07/2026 31/07/2026 31/07/2026 31/07/2026 31/07/2026 31/07/2026 31/07/2026 31/07/2026 31/07/2026 31/07/2026 31/07/2026 31/07/2026 31/07/2026 31/07/2026 31/07/2026 31/07/2026 31/07/2026 31/07/2026 31/07/2026 31/07/2026 31/07/2026 31/07/2026 31/07/2026 31/07/2026 31/07/2026 31/07/2026 31/07/2026 31/07/2026 31/07/2026 31/07/2026 31/07/2026 31/07/2026 31/07/2026 31/07/2026 31/07/2026 31/07/2026 31/07/2026 31/07/2026 31/07/2026 31/07/2026 31/07/2026 31/07/2026 31/07/2026 31/07/2026 31/07/2026 31/07/2026
09:40:41 09:40:51 09:41:04 09:41:04 09:41:04 09:41:04 09:41:04 09:41:04 09:41:04 09:41:04 09:41:04 09:41:04 09:49:12 09:49:12 09:49:12 09:49:12 09:49:12 09:49:13 09:49:13 09:49:13 09:49:13 09:49:13 09:49:13 09:49:13 09:49:13 09:51:14 09:51:14 09:51:14 09:51:14 09:51:14 09:51:14 09:51:14 09:51:14 09:51:14 09:51:14 09:51:28 09:51:28 09:51:28 09:51:28 09:51:28 09:51:28 09:57:53 09:57:53 09:57:53 09:57:53 09:57:53 09:57:59 09:57:59 09:57:59 09:57:59 09:57:59
Instrumento Financ./Security
Operación / Transaction
SAB SAB SAB SAB SAB SAB SAB SAB SAB SAB SAB SAB SAB SAB SAB SAB SAB SAB SAB SAB SAB SAB SAB SAB SAB SAB SAB SAB SAB SAB SAB SAB SAB SAB SAB SAB SAB SAB SAB SAB SAB SAB SAB SAB SAB SAB SAB SAB SAB SAB SAB
COMPRA / BUY COMPRA / BUY COMPRA / BUY COMPRA / BUY COMPRA / BUY COMPRA / BUY COMPRA / BUY COMPRA / BUY COMPRA / BUY COMPRA / BUY COMPRA / BUY COMPRA / BUY COMPRA / BUY COMPRA / BUY COMPRA / BUY COMPRA / BUY COMPRA / BUY COMPRA / BUY COMPRA / BUY COMPRA / BUY COMPRA / BUY COMPRA / BUY COMPRA / BUY COMPRA / BUY COMPRA / BUY COMPRA / BUY COMPRA / BUY COMPRA / BUY COMPRA / BUY COMPRA / BUY COMPRA / BUY COMPRA / BUY COMPRA / BUY COMPRA / BUY COMPRA / BUY COMPRA / BUY COMPRA / BUY COMPRA / BUY COMPRA / BUY COMPRA / BUY COMPRA / BUY COMPRA / BUY COMPRA / BUY COMPRA / BUY COMPRA / BUY COMPRA / BUY COMPRA / BUY COMPRA / BUY COMPRA / BUY COMPRA / BUY COMPRA / BUY
Pag. 76
Centro Negociación / Trading Venue CEUX CEUX CEUX CEUX CEUX CEUX CEUX CEUX CEUX CEUX CEUX CEUX XMAD XMAD XMAD XMAD XMAD XMAD XMAD XMAD XMAD XMAD XMAD XMAD XMAD CEUX CEUX CEUX CEUX CEUX CEUX CEUX CEUX CEUX CEUX CEUX CEUX CEUX CEUX CEUX CEUX CEUX CEUX CEUX CEUX CEUX CEUX CEUX CEUX CEUX CEUX
Nº Títulos / Nr. of Precio € / Price shares € 1.049 1.321 1.321 1.321 892 1.321 744 642 679 642 1.088 176 2.219 1.421 2.900 117 2.219 2.219 2.784 816 2.219 2.219 2.219 4.438 4.210 1.432 1.432 1.394 510 922 1.432 622 816 4 574 38 1.432 1.432 1.432 1.432 96 1.432 1.432 30 1.402 1.432 1.432 1.432 1.432 1.432 1.432
3,3470 3,3470 3,3470 3,3470 3,3470 3,3470 3,3470 3,3470 3,3470 3,3470 3,3470 3,3470 3,3450 3,3450 3,3450 3,3450 3,3450 3,3450 3,3450 3,3450 3,3450 3,3450 3,3450 3,3450 3,3450 3,3430 3,3430 3,3430 3,3430 3,3430 3,3430 3,3430 3,3430 3,3430 3,3430 3,3430 3,3430 3,3430 3,3430 3,3430 3,3430 3,3430 3,3430 3,3430 3,3430 3,3430 3,3430 3,3430 3,3430 3,3430 3,3430
Hora / Trade Fecha / Date Time 31/07/2026 31/07/2026 31/07/2026 31/07/2026 31/07/2026 31/07/2026 31/07/2026 31/07/2026 31/07/2026 31/07/2026 31/07/2026 31/07/2026 31/07/2026 31/07/2026 31/07/2026 31/07/2026 31/07/2026 31/07/2026 31/07/2026 31/07/2026 31/07/2026 31/07/2026 31/07/2026 31/07/2026 31/07/2026 31/07/2026 31/07/2026 31/07/2026 31/07/2026 31/07/2026 31/07/2026 31/07/2026 31/07/2026 31/07/2026 31/07/2026 31/07/2026 31/07/2026 31/07/2026 31/07/2026 31/07/2026 31/07/2026 31/07/2026 31/07/2026 31/07/2026 31/07/2026 31/07/2026 31/07/2026 31/07/2026 31/07/2026 31/07/2026 31/07/2026
09:57:59 09:57:59 09:58:07 09:58:07 09:58:15 09:58:15 09:58:15 09:58:15 09:58:15 09:58:15 09:58:15 09:58:15 09:58:15 10:01:26 10:01:26 10:01:26 10:01:26 10:01:26 10:16:32 10:16:32 10:16:32 10:16:32 10:16:32 10:16:32 10:16:32 10:16:32 10:16:32 10:16:32 10:16:32 10:17:40 10:17:40 10:17:40 10:17:40 10:17:40 10:17:40 10:17:40 10:17:40 10:17:43 10:17:53 10:17:53 10:17:53 10:17:53 10:19:02 10:19:02 10:29:34 10:29:34 10:29:34 10:29:47 10:29:47 10:29:47 10:29:47
Instrumento Financ./Security
Operación / Transaction
SAB SAB SAB SAB SAB SAB SAB SAB SAB SAB SAB SAB SAB SAB SAB SAB SAB SAB SAB SAB SAB SAB SAB SAB SAB SAB SAB SAB SAB SAB SAB SAB SAB SAB SAB SAB SAB SAB SAB SAB SAB SAB SAB SAB SAB SAB SAB SAB SAB SAB SAB
COMPRA / BUY COMPRA / BUY COMPRA / BUY COMPRA / BUY COMPRA / BUY COMPRA / BUY COMPRA / BUY COMPRA / BUY COMPRA / BUY COMPRA / BUY COMPRA / BUY COMPRA / BUY COMPRA / BUY COMPRA / BUY COMPRA / BUY COMPRA / BUY COMPRA / BUY COMPRA / BUY COMPRA / BUY COMPRA / BUY COMPRA / BUY COMPRA / BUY COMPRA / BUY COMPRA / BUY COMPRA / BUY COMPRA / BUY COMPRA / BUY COMPRA / BUY COMPRA / BUY COMPRA / BUY COMPRA / BUY COMPRA / BUY COMPRA / BUY COMPRA / BUY COMPRA / BUY COMPRA / BUY COMPRA / BUY COMPRA / BUY COMPRA / BUY COMPRA / BUY COMPRA / BUY COMPRA / BUY COMPRA / BUY COMPRA / BUY COMPRA / BUY COMPRA / BUY COMPRA / BUY COMPRA / BUY COMPRA / BUY COMPRA / BUY COMPRA / BUY
Pag. 77
Centro Negociación / Trading Venue CEUX CEUX XMAD XMAD XMAD XMAD XMAD XMAD XMAD XMAD XMAD XMAD XMAD XMAD XMAD XMAD XMAD XMAD CEUX CEUX CEUX CEUX CEUX CEUX CEUX CEUX CEUX CEUX CEUX XMAD XMAD XMAD XMAD XMAD XMAD XMAD XMAD XMAD XMAD XMAD XMAD XMAD XMAD XMAD XMAD XMAD XMAD XMAD XMAD XMAD XMAD
Nº Títulos / Nr. of Precio € / Price shares € 1.432 680 2.765 2.973 2.557 2.765 2.765 2.448 2.765 3.082 3.082 2.448 2.350 1.900 865 8.602 901 17.732 1.432 1.432 1.300 1.432 1.432 1.432 1.432 1.432 1.432 1.107 1.137 2.765 3.407 2.107 2.107 1.900 2.615 2.781 1.673 2.765 701 901 2.615 901 412 2.350 2.765 2.765 2.765 2.765 2.765 2.765 1.132
3,3430 3,3430 3,3420 3,3420 3,3420 3,3420 3,3420 3,3420 3,3420 3,3420 3,3420 3,3420 3,3420 3,3400 3,3400 3,3400 3,3400 3,3400 3,3410 3,3410 3,3410 3,3410 3,3410 3,3410 3,3410 3,3410 3,3410 3,3410 3,3410 3,3400 3,3400 3,3400 3,3400 3,3400 3,3400 3,3400 3,3400 3,3400 3,3400 3,3400 3,3400 3,3400 3,3400 3,3400 3,3440 3,3440 3,3440 3,3440 3,3440 3,3440 3,3440
Hora / Trade Fecha / Date Time 31/07/2026 31/07/2026 31/07/2026 31/07/2026 31/07/2026 31/07/2026 31/07/2026 31/07/2026 31/07/2026 31/07/2026 31/07/2026 31/07/2026 31/07/2026 31/07/2026 31/07/2026 31/07/2026 31/07/2026 31/07/2026 31/07/2026 31/07/2026 31/07/2026 31/07/2026 31/07/2026 31/07/2026 31/07/2026 31/07/2026 31/07/2026 31/07/2026 31/07/2026 31/07/2026 31/07/2026 31/07/2026 31/07/2026 31/07/2026 31/07/2026 31/07/2026 31/07/2026 31/07/2026 31/07/2026 31/07/2026 31/07/2026 31/07/2026 31/07/2026 31/07/2026 31/07/2026 31/07/2026 31/07/2026 31/07/2026 31/07/2026 31/07/2026 31/07/2026
10:29:47 10:29:47 10:59:00 10:59:00 10:59:02 10:59:23 10:59:23 10:59:23 10:59:23 10:59:23 10:59:23 10:59:23 10:59:23 10:59:23 10:59:23 10:59:59 11:00:11 11:00:11 11:00:11 11:00:11 11:00:11 11:00:11 11:00:26 11:00:26 11:00:26 11:00:55 11:00:55 11:00:55 11:00:55 11:01:43 11:01:43 11:01:47 11:01:47 11:01:47 11:01:47 11:01:47 11:01:47 11:01:47 11:01:47 11:01:59 11:01:59 11:01:59 11:01:59 11:01:59 11:01:59 11:01:59 11:01:59 11:01:59 11:02:03 11:02:03 11:02:04
Instrumento Financ./Security
Operación / Transaction
SAB SAB SAB SAB SAB SAB SAB SAB SAB SAB SAB SAB SAB SAB SAB SAB SAB SAB SAB SAB SAB SAB SAB SAB SAB SAB SAB SAB SAB SAB SAB SAB SAB SAB SAB SAB SAB SAB SAB SAB SAB SAB SAB SAB SAB SAB SAB SAB SAB SAB SAB
COMPRA / BUY COMPRA / BUY COMPRA / BUY COMPRA / BUY COMPRA / BUY COMPRA / BUY COMPRA / BUY COMPRA / BUY COMPRA / BUY COMPRA / BUY COMPRA / BUY COMPRA / BUY COMPRA / BUY COMPRA / BUY COMPRA / BUY COMPRA / BUY COMPRA / BUY COMPRA / BUY COMPRA / BUY COMPRA / BUY COMPRA / BUY COMPRA / BUY COMPRA / BUY COMPRA / BUY COMPRA / BUY COMPRA / BUY COMPRA / BUY COMPRA / BUY COMPRA / BUY COMPRA / BUY COMPRA / BUY COMPRA / BUY COMPRA / BUY COMPRA / BUY COMPRA / BUY COMPRA / BUY COMPRA / BUY COMPRA / BUY COMPRA / BUY COMPRA / BUY COMPRA / BUY COMPRA / BUY COMPRA / BUY COMPRA / BUY COMPRA / BUY COMPRA / BUY COMPRA / BUY COMPRA / BUY COMPRA / BUY COMPRA / BUY COMPRA / BUY
Pag. 78
Centro Negociación / Trading Venue XMAD XMAD CEUX CEUX CEUX CEUX CEUX CEUX CEUX CEUX CEUX CEUX CEUX CEUX CEUX XMAD XMAD XMAD XMAD XMAD XMAD XMAD XMAD XMAD XMAD XMAD XMAD XMAD XMAD CEUX CEUX CEUX CEUX CEUX CEUX CEUX CEUX CEUX CEUX CEUX CEUX CEUX CEUX CEUX CEUX CEUX CEUX CEUX CEUX CEUX CEUX
Nº Títulos / Nr. of Precio € / Price shares € 1.633 645 1.987 164 1 1.822 1.987 1.987 1.876 111 1.726 125 1.862 883 469 2.147 2.147 590 1.557 2.240 45 2.009 2.147 2.147 258 1.889 1.288 816 720 1.219 49 1.170 119 1.100 1.219 3 503 713 506 1.219 349 870 23 1.196 1.219 816 403 666 1.219 64 355
3,3440 3,3440 3,3570 3,3570 3,3570 3,3570 3,3570 3,3570 3,3570 3,3570 3,3570 3,3570 3,3570 3,3570 3,3570 3,3550 3,3550 3,3550 3,3550 3,3550 3,3550 3,3550 3,3550 3,3550 3,3550 3,3550 3,3550 3,3550 3,3550 3,3530 3,3530 3,3530 3,3530 3,3530 3,3530 3,3530 3,3530 3,3530 3,3530 3,3530 3,3530 3,3530 3,3530 3,3530 3,3530 3,3530 3,3530 3,3530 3,3530 3,3530 3,3530
Hora / Trade Fecha / Date Time 31/07/2026 31/07/2026 31/07/2026 31/07/2026 31/07/2026 31/07/2026 31/07/2026 31/07/2026 31/07/2026 31/07/2026 31/07/2026 31/07/2026 31/07/2026 31/07/2026 31/07/2026 31/07/2026 31/07/2026 31/07/2026 31/07/2026 31/07/2026 31/07/2026 31/07/2026 31/07/2026 31/07/2026 31/07/2026 31/07/2026 31/07/2026 31/07/2026 31/07/2026 31/07/2026 31/07/2026 31/07/2026 31/07/2026 31/07/2026 31/07/2026 31/07/2026 31/07/2026 31/07/2026 31/07/2026 31/07/2026 31/07/2026 31/07/2026 31/07/2026 31/07/2026 31/07/2026 31/07/2026 31/07/2026 31/07/2026 31/07/2026 31/07/2026 31/07/2026
11:04:50 11:04:54 11:04:54 11:04:54 11:04:54 11:04:54 11:04:54 11:04:54 11:04:54 11:04:54 11:04:54 11:04:54 11:13:00 11:14:00 11:14:00 11:14:00 11:16:04 11:16:04 11:16:04 11:16:04 11:16:04 11:16:04 11:16:04 11:16:04 11:16:04 11:39:33 11:39:41 11:39:41 11:40:28 11:40:28 11:40:28 11:40:28 11:40:28 11:40:28 11:40:41 11:41:18 11:59:48 11:59:48 11:59:48 11:59:48 11:59:48 11:59:48 12:02:35 12:02:37 12:02:37 12:02:37 12:02:37 12:02:37 12:02:37 12:02:37 12:02:37
Instrumento Financ./Security
Operación / Transaction
SAB SAB SAB SAB SAB SAB SAB SAB SAB SAB SAB SAB SAB SAB SAB SAB SAB SAB SAB SAB SAB SAB SAB SAB SAB SAB SAB SAB SAB SAB SAB SAB SAB SAB SAB SAB SAB SAB SAB SAB SAB SAB SAB SAB SAB SAB SAB SAB SAB SAB SAB
COMPRA / BUY COMPRA / BUY COMPRA / BUY COMPRA / BUY COMPRA / BUY COMPRA / BUY COMPRA / BUY COMPRA / BUY COMPRA / BUY COMPRA / BUY COMPRA / BUY COMPRA / BUY COMPRA / BUY COMPRA / BUY COMPRA / BUY COMPRA / BUY COMPRA / BUY COMPRA / BUY COMPRA / BUY COMPRA / BUY COMPRA / BUY COMPRA / BUY COMPRA / BUY COMPRA / BUY COMPRA / BUY COMPRA / BUY COMPRA / BUY COMPRA / BUY COMPRA / BUY COMPRA / BUY COMPRA / BUY COMPRA / BUY COMPRA / BUY COMPRA / BUY COMPRA / BUY COMPRA / BUY COMPRA / BUY COMPRA / BUY COMPRA / BUY COMPRA / BUY COMPRA / BUY COMPRA / BUY COMPRA / BUY COMPRA / BUY COMPRA / BUY COMPRA / BUY COMPRA / BUY COMPRA / BUY COMPRA / BUY COMPRA / BUY COMPRA / BUY
Pag. 79
Centro Negociación / Trading Venue XMAD XMAD XMAD XMAD XMAD XMAD XMAD XMAD XMAD XMAD XMAD XMAD CEUX XMAD XMAD XMAD XMAD XMAD XMAD XMAD XMAD XMAD XMAD XMAD XMAD XMAD XMAD XMAD XMAD XMAD XMAD XMAD XMAD XMAD XMAD XMAD XMAD XMAD XMAD XMAD XMAD XMAD CEUX CEUX CEUX CEUX CEUX CEUX CEUX CEUX CEUX
Nº Títulos / Nr. of Precio € / Price shares € 1.578 620 1.632 1.628 3.700 901 2.048 901 566 2.764 2.764 898 1.321 2.198 1.632 2.198 566 2.198 806 2.048 901 901 3.044 3.440 68 350 1.797 3.264 1.030 5.099 4.052 1.632 816 510 773 677 2.147 2.637 2.147 4.294 3.804 4.971 1.088 233 1.321 1.321 1.321 1.321 2 1.319 2
3,3500 3,3500 3,3500 3,3500 3,3500 3,3500 3,3500 3,3500 3,3500 3,3500 3,3500 3,3500 3,3470 3,3500 3,3500 3,3500 3,3500 3,3500 3,3500 3,3500 3,3500 3,3500 3,3500 3,3500 3,3500 3,3550 3,3550 3,3550 3,3550 3,3550 3,3550 3,3550 3,3550 3,3550 3,3550 3,3550 3,3550 3,3550 3,3550 3,3550 3,3550 3,3550 3,3530 3,3530 3,3530 3,3530 3,3530 3,3530 3,3530 3,3530 3,3530
Hora / Trade Fecha / Date Time 31/07/2026 31/07/2026 31/07/2026 31/07/2026 31/07/2026 31/07/2026 31/07/2026 31/07/2026 31/07/2026 31/07/2026 31/07/2026 31/07/2026 31/07/2026 31/07/2026 31/07/2026 31/07/2026 31/07/2026 31/07/2026 31/07/2026 31/07/2026 31/07/2026 31/07/2026 31/07/2026 31/07/2026 31/07/2026 31/07/2026 31/07/2026 31/07/2026 31/07/2026 31/07/2026 31/07/2026 31/07/2026 31/07/2026 31/07/2026 31/07/2026 31/07/2026 31/07/2026 31/07/2026 31/07/2026 31/07/2026 31/07/2026 31/07/2026 31/07/2026 31/07/2026 31/07/2026 31/07/2026 31/07/2026 31/07/2026 31/07/2026 31/07/2026 31/07/2026
12:02:37 12:02:37 12:02:37 12:02:37 12:02:37 12:02:37 12:02:37 12:02:37 12:06:33 12:06:33 12:06:33 12:06:33 12:06:33 12:06:33 12:10:47 12:10:48 12:11:38 12:12:05 12:12:05 12:12:05 12:29:20 12:30:36 12:37:59 12:37:59 12:37:59 12:37:59 12:37:59 12:37:59 12:37:59 12:37:59 12:37:59 12:42:06 12:42:06 12:44:47 12:44:47 12:44:47 12:44:47 12:45:01 12:45:01 12:45:01 12:45:01 12:45:01 12:45:01 12:45:01 12:45:01 12:48:06 12:48:06 12:48:11 12:48:11 12:48:11 12:48:11
Instrumento Financ./Security
Operación / Transaction
SAB SAB SAB SAB SAB SAB SAB SAB SAB SAB SAB SAB SAB SAB SAB SAB SAB SAB SAB SAB SAB SAB SAB SAB SAB SAB SAB SAB SAB SAB SAB SAB SAB SAB SAB SAB SAB SAB SAB SAB SAB SAB SAB SAB SAB SAB SAB SAB SAB SAB SAB
COMPRA / BUY COMPRA / BUY COMPRA / BUY COMPRA / BUY COMPRA / BUY COMPRA / BUY COMPRA / BUY COMPRA / BUY COMPRA / BUY COMPRA / BUY COMPRA / BUY COMPRA / BUY COMPRA / BUY COMPRA / BUY COMPRA / BUY COMPRA / BUY COMPRA / BUY COMPRA / BUY COMPRA / BUY COMPRA / BUY COMPRA / BUY COMPRA / BUY COMPRA / BUY COMPRA / BUY COMPRA / BUY COMPRA / BUY COMPRA / BUY COMPRA / BUY COMPRA / BUY COMPRA / BUY COMPRA / BUY COMPRA / BUY COMPRA / BUY COMPRA / BUY COMPRA / BUY COMPRA / BUY COMPRA / BUY COMPRA / BUY COMPRA / BUY COMPRA / BUY COMPRA / BUY COMPRA / BUY COMPRA / BUY COMPRA / BUY COMPRA / BUY COMPRA / BUY COMPRA / BUY COMPRA / BUY COMPRA / BUY COMPRA / BUY COMPRA / BUY
Pag. 80
Centro Negociación / Trading Venue CEUX CEUX CEUX CEUX CEUX CEUX CEUX CEUX XMAD XMAD XMAD XMAD XMAD XMAD XMAD XMAD XMAD XMAD XMAD XMAD XMAD XMAD XMAD XMAD XMAD XMAD XMAD XMAD XMAD XMAD XMAD XMAD XMAD XMAD XMAD XMAD XMAD XMAD XMAD XMAD XMAD XMAD XMAD XMAD XMAD CEUX CEUX CEUX CEUX CEUX CEUX
Nº Títulos / Nr. of Precio € / Price shares € 91 1.230 91 1.321 1.321 1.088 233 376 2.198 58 901 18.759 1.632 1.239 1.589 983 786 429 772 654 1.292 906 973 1.225 1.408 5.444 901 2.381 901 4.198 371 11.805 8.195 2.198 2.527 2.198 1.869 2.198 706 2.198 2.048 901 901 1.492 764 1.321 1.321 1.321 1.321 511 810
3,3530 3,3530 3,3530 3,3530 3,3530 3,3530 3,3530 3,3530 3,3500 3,3500 3,3500 3,3500 3,3500 3,3500 3,3500 3,3500 3,3500 3,3500 3,3500 3,3500 3,3500 3,3500 3,3530 3,3530 3,3530 3,3530 3,3530 3,3530 3,3530 3,3530 3,3530 3,3500 3,3500 3,3500 3,3500 3,3500 3,3500 3,3500 3,3500 3,3500 3,3500 3,3500 3,3500 3,3500 3,3500 3,3470 3,3470 3,3470 3,3470 3,3470 3,3470
Hora / Trade Fecha / Date Time 31/07/2026 31/07/2026 31/07/2026 31/07/2026 31/07/2026 31/07/2026 31/07/2026 31/07/2026 31/07/2026 31/07/2026 31/07/2026 31/07/2026 31/07/2026 31/07/2026 31/07/2026 31/07/2026 31/07/2026 31/07/2026 31/07/2026 31/07/2026 31/07/2026 31/07/2026 31/07/2026 31/07/2026 31/07/2026 31/07/2026 31/07/2026 31/07/2026 31/07/2026 31/07/2026 31/07/2026 31/07/2026 31/07/2026 31/07/2026 31/07/2026 31/07/2026 31/07/2026 31/07/2026 31/07/2026 31/07/2026 31/07/2026 31/07/2026 31/07/2026 31/07/2026 31/07/2026 31/07/2026 31/07/2026 31/07/2026 31/07/2026 31/07/2026 31/07/2026
12:48:11 12:48:11 12:48:11 12:48:11 12:48:11 12:48:11 12:48:11 12:48:11 12:48:11 12:48:11 12:48:11 12:48:11 12:48:11 12:48:11 12:49:53 12:49:53 12:49:53 12:52:03 12:53:12 12:53:13 12:53:13 12:53:13 12:53:13 12:53:13 12:53:13 12:53:13 12:53:13 12:53:13 12:53:16 12:53:16 12:53:16 12:53:16 12:53:16 12:53:16 12:53:16 12:53:16 12:53:16 12:53:16 12:53:33 12:58:27 13:01:04 13:01:04 13:01:04 13:01:04 13:01:04 13:01:04 13:01:04 13:01:04 13:01:04 13:01:04 13:01:04
Instrumento Financ./Security
Operación / Transaction
SAB SAB SAB SAB SAB SAB SAB SAB SAB SAB SAB SAB SAB SAB SAB SAB SAB SAB SAB SAB SAB SAB SAB SAB SAB SAB SAB SAB SAB SAB SAB SAB SAB SAB SAB SAB SAB SAB SAB SAB SAB SAB SAB SAB SAB SAB SAB SAB SAB SAB SAB
COMPRA / BUY COMPRA / BUY COMPRA / BUY COMPRA / BUY COMPRA / BUY COMPRA / BUY COMPRA / BUY COMPRA / BUY COMPRA / BUY COMPRA / BUY COMPRA / BUY COMPRA / BUY COMPRA / BUY COMPRA / BUY COMPRA / BUY COMPRA / BUY COMPRA / BUY COMPRA / BUY COMPRA / BUY COMPRA / BUY COMPRA / BUY COMPRA / BUY COMPRA / BUY COMPRA / BUY COMPRA / BUY COMPRA / BUY COMPRA / BUY COMPRA / BUY COMPRA / BUY COMPRA / BUY COMPRA / BUY COMPRA / BUY COMPRA / BUY COMPRA / BUY COMPRA / BUY COMPRA / BUY COMPRA / BUY COMPRA / BUY COMPRA / BUY COMPRA / BUY COMPRA / BUY COMPRA / BUY COMPRA / BUY COMPRA / BUY COMPRA / BUY COMPRA / BUY COMPRA / BUY COMPRA / BUY COMPRA / BUY COMPRA / BUY COMPRA / BUY
Pag. 81
Centro Negociación / Trading Venue CEUX CEUX CEUX CEUX CEUX CEUX CEUX CEUX CEUX CEUX CEUX CEUX CEUX CEUX XMAD XMAD XMAD XMAD CEUX CEUX CEUX CEUX CEUX CEUX CEUX CEUX CEUX CEUX CEUX CEUX CEUX CEUX CEUX CEUX CEUX CEUX CEUX CEUX XMAD CEUX XMAD XMAD XMAD XMAD XMAD XMAD XMAD XMAD XMAD XMAD XMAD
Nº Títulos / Nr. of Precio € / Price shares € 511 1.321 1.321 399 922 399 1.321 917 404 767 1.321 1.321 1.321 1.150 2.219 2.219 6.054 14.508 2 305 1.125 1.432 1.432 94 1.432 1.432 1.432 526 1.432 1.432 336 1.432 336 1.096 1.432 1.432 1.432 428 20.000 1 2.765 4.081 1.632 816 1.766 901 901 2.432 816 1.296 1.949
3,3470 3,3470 3,3470 3,3470 3,3470 3,3470 3,3470 3,3470 3,3470 3,3470 3,3470 3,3470 3,3470 3,3470 3,3450 3,3450 3,3450 3,3450 3,3430 3,3430 3,3430 3,3430 3,3430 3,3430 3,3430 3,3430 3,3430 3,3430 3,3430 3,3430 3,3430 3,3430 3,3430 3,3430 3,3430 3,3430 3,3430 3,3430 3,3400 3,3370 3,3400 3,3400 3,3400 3,3400 3,3400 3,3400 3,3400 3,3400 3,3400 3,3400 3,3400
Hora / Trade Fecha / Date Time 31/07/2026 31/07/2026 31/07/2026 31/07/2026 31/07/2026 31/07/2026 31/07/2026 31/07/2026 31/07/2026 31/07/2026 31/07/2026 31/07/2026 31/07/2026 31/07/2026 31/07/2026 31/07/2026 31/07/2026 31/07/2026 31/07/2026 31/07/2026 31/07/2026 31/07/2026 31/07/2026 31/07/2026 31/07/2026 31/07/2026 31/07/2026 31/07/2026 31/07/2026 31/07/2026 31/07/2026 31/07/2026 31/07/2026 31/07/2026 31/07/2026 31/07/2026 31/07/2026 31/07/2026 31/07/2026 31/07/2026 31/07/2026 31/07/2026 31/07/2026 31/07/2026 31/07/2026 31/07/2026 31/07/2026 31/07/2026 31/07/2026 31/07/2026 31/07/2026
13:01:04 13:01:04 13:01:04 13:01:04 13:01:04 13:01:04 13:01:04 13:01:04 13:09:28 13:09:28 13:09:28 13:09:28 13:09:28 13:09:31 13:09:31 13:09:31 13:09:31 13:09:31 13:09:31 13:09:31 13:09:31 13:09:31 13:09:31 13:09:31 13:17:09 13:17:09 13:17:09 13:17:09 13:17:09 13:17:09 13:31:11 13:31:11 13:31:11 13:31:39 13:31:41 13:31:41 13:31:41 13:31:41 13:31:41 13:31:41 13:31:41 13:31:46 13:41:05 13:45:29 13:51:10 13:51:10 13:51:10 13:51:10 13:53:25 13:53:25 13:53:25
Instrumento Financ./Security
Operación / Transaction
SAB SAB SAB SAB SAB SAB SAB SAB SAB SAB SAB SAB SAB SAB SAB SAB SAB SAB SAB SAB SAB SAB SAB SAB SAB SAB SAB SAB SAB SAB SAB SAB SAB SAB SAB SAB SAB SAB SAB SAB SAB SAB SAB SAB SAB SAB SAB SAB SAB SAB SAB
COMPRA / BUY COMPRA / BUY COMPRA / BUY COMPRA / BUY COMPRA / BUY COMPRA / BUY COMPRA / BUY COMPRA / BUY COMPRA / BUY COMPRA / BUY COMPRA / BUY COMPRA / BUY COMPRA / BUY COMPRA / BUY COMPRA / BUY COMPRA / BUY COMPRA / BUY COMPRA / BUY COMPRA / BUY COMPRA / BUY COMPRA / BUY COMPRA / BUY COMPRA / BUY COMPRA / BUY COMPRA / BUY COMPRA / BUY COMPRA / BUY COMPRA / BUY COMPRA / BUY COMPRA / BUY COMPRA / BUY COMPRA / BUY COMPRA / BUY COMPRA / BUY COMPRA / BUY COMPRA / BUY COMPRA / BUY COMPRA / BUY COMPRA / BUY COMPRA / BUY COMPRA / BUY COMPRA / BUY COMPRA / BUY COMPRA / BUY COMPRA / BUY COMPRA / BUY COMPRA / BUY COMPRA / BUY COMPRA / BUY COMPRA / BUY COMPRA / BUY
Pag. 82
Centro Negociación / Trading Venue XMAD XMAD XMAD XMAD XMAD XMAD XMAD XMAD CEUX CEUX CEUX CEUX CEUX CEUX CEUX CEUX CEUX CEUX CEUX CEUX CEUX CEUX CEUX CEUX XMAD XMAD XMAD XMAD XMAD XMAD XMAD XMAD XMAD XMAD XMAD XMAD XMAD XMAD XMAD XMAD XMAD XMAD XMAD XMAD XMAD XMAD XMAD XMAD CEUX CEUX CEUX
Nº Títulos / Nr. of Precio € / Price shares € 1.632 1.226 816 1.632 2.672 317 1.819 531 1.689 187 1.876 646 1.876 351 440 816 269 666 1.876 899 169 808 1.068 1.363 2.765 4.081 2.765 5.530 4.081 778 901 901 1.001 122 2.605 2.765 2.265 901 2.615 901 816 123 2 500 172 1.632 1.133 645 1.432 1.432 1.432
3,3400 3,3400 3,3400 3,3400 3,3400 3,3400 3,3400 3,3400 3,3430 3,3430 3,3430 3,3430 3,3430 3,3430 3,3430 3,3430 3,3430 3,3430 3,3430 3,3430 3,3430 3,3430 3,3430 3,3430 3,3400 3,3400 3,3400 3,3400 3,3400 3,3400 3,3400 3,3400 3,3400 3,3400 3,3400 3,3400 3,3400 3,3400 3,3400 3,3400 3,3400 3,3400 3,3400 3,3400 3,3440 3,3440 3,3440 3,3440 3,3430 3,3430 3,3430
Hora / Trade Fecha / Date Time 31/07/2026 31/07/2026 31/07/2026 31/07/2026 31/07/2026 31/07/2026 31/07/2026 31/07/2026 31/07/2026 31/07/2026 31/07/2026 31/07/2026 31/07/2026 31/07/2026 31/07/2026 31/07/2026 31/07/2026 31/07/2026 31/07/2026 31/07/2026 31/07/2026 31/07/2026 31/07/2026 31/07/2026 31/07/2026 31/07/2026 31/07/2026 31/07/2026 31/07/2026 31/07/2026 31/07/2026 31/07/2026 31/07/2026 31/07/2026 31/07/2026 31/07/2026 31/07/2026 31/07/2026 31/07/2026 31/07/2026 31/07/2026 31/07/2026 31/07/2026 31/07/2026 31/07/2026 31/07/2026 31/07/2026 31/07/2026 31/07/2026 31/07/2026 31/07/2026
13:53:25 13:53:25 13:53:25 13:53:25 13:53:25 13:53:25 13:53:25 13:53:25 13:53:25 13:53:25 13:53:25 13:53:25 14:12:23 14:12:40 14:13:33 14:13:33 14:13:33 14:13:33 14:22:54 14:22:54 14:22:54 14:22:54 14:22:54 14:22:54 14:22:54 14:22:54 14:22:54 14:22:54 14:22:54 14:22:54 14:22:54 14:22:57 14:30:01 14:30:01 14:30:01 14:30:01 14:30:01 14:30:01 14:30:01 14:30:01 14:30:01 14:30:01 14:37:07 14:37:07 14:37:13 14:37:23 14:39:37 14:46:42 14:46:42 14:46:46 14:46:46
Instrumento Financ./Security
Operación / Transaction
SAB SAB SAB SAB SAB SAB SAB SAB SAB SAB SAB SAB SAB SAB SAB SAB SAB SAB SAB SAB SAB SAB SAB SAB SAB SAB SAB SAB SAB SAB SAB SAB SAB SAB SAB SAB SAB SAB SAB SAB SAB SAB SAB SAB SAB SAB SAB SAB SAB SAB SAB
COMPRA / BUY COMPRA / BUY COMPRA / BUY COMPRA / BUY COMPRA / BUY COMPRA / BUY COMPRA / BUY COMPRA / BUY COMPRA / BUY COMPRA / BUY COMPRA / BUY COMPRA / BUY COMPRA / BUY COMPRA / BUY COMPRA / BUY COMPRA / BUY COMPRA / BUY COMPRA / BUY COMPRA / BUY COMPRA / BUY COMPRA / BUY COMPRA / BUY COMPRA / BUY COMPRA / BUY COMPRA / BUY COMPRA / BUY COMPRA / BUY COMPRA / BUY COMPRA / BUY COMPRA / BUY COMPRA / BUY COMPRA / BUY COMPRA / BUY COMPRA / BUY COMPRA / BUY COMPRA / BUY COMPRA / BUY COMPRA / BUY COMPRA / BUY COMPRA / BUY COMPRA / BUY COMPRA / BUY COMPRA / BUY COMPRA / BUY COMPRA / BUY COMPRA / BUY COMPRA / BUY COMPRA / BUY COMPRA / BUY COMPRA / BUY COMPRA / BUY
Pag. 83
Centro Negociación / Trading Venue CEUX CEUX CEUX CEUX CEUX CEUX CEUX CEUX CEUX CEUX CEUX CEUX XMAD XMAD XMAD XMAD XMAD XMAD CEUX CEUX CEUX CEUX CEUX CEUX CEUX CEUX CEUX CEUX CEUX CEUX CEUX CEUX XMAD XMAD XMAD XMAD XMAD XMAD XMAD XMAD XMAD XMAD XMAD XMAD XMAD XMAD XMAD XMAD XMAD XMAD XMAD
Nº Títulos / Nr. of Precio € / Price shares € 672 1.432 1.432 661 414 1.018 1.432 555 1.432 544 888 224 11.170 136 183 816 883 6.812 1.432 1.432 1.432 1.432 670 1.268 164 1.268 1.432 368 1.064 1.432 1.432 174 1.632 1.244 863 1.632 816 2.441 2.876 3.827 2.876 1.793 14.111 2.000 30 1.115 2.744 4.064 800 2.432 715
3,3430 3,3430 3,3430 3,3430 3,3430 3,3430 3,3430 3,3430 3,3430 3,3430 3,3430 3,3430 3,3400 3,3400 3,3400 3,3400 3,3400 3,3400 3,3370 3,3370 3,3370 3,3370 3,3370 3,3370 3,3370 3,3370 3,3370 3,3370 3,3370 3,3370 3,3370 3,3370 3,3350 3,3350 3,3350 3,3350 3,3350 3,3350 3,3350 3,3350 3,3350 3,3350 3,3350 3,3350 3,3350 3,3350 3,3350 3,3350 3,3350 3,3350 3,3350
Hora / Trade Fecha / Date Time 31/07/2026 31/07/2026 31/07/2026 31/07/2026 31/07/2026 31/07/2026 31/07/2026 31/07/2026 31/07/2026 31/07/2026 31/07/2026 31/07/2026 31/07/2026 31/07/2026 31/07/2026 31/07/2026 31/07/2026 31/07/2026 31/07/2026 31/07/2026 31/07/2026 31/07/2026 31/07/2026 31/07/2026 31/07/2026 31/07/2026 31/07/2026 31/07/2026 31/07/2026 31/07/2026 31/07/2026 31/07/2026 31/07/2026 31/07/2026 31/07/2026 31/07/2026 31/07/2026 31/07/2026 31/07/2026 31/07/2026 31/07/2026 31/07/2026 31/07/2026 31/07/2026 31/07/2026 31/07/2026 31/07/2026 31/07/2026 31/07/2026 31/07/2026 31/07/2026
14:46:46 14:46:46 14:46:46 14:46:47 14:49:21 14:49:21 14:49:21 14:49:21 15:25:33 15:25:33 15:33:08 15:33:10 15:33:10 15:33:10 15:33:10 15:33:10 15:33:23 15:33:27 15:33:27 15:33:30 15:33:30 15:33:30 15:33:33 15:33:33 15:33:33 15:42:32 15:42:32 15:42:32 15:42:32 15:42:32 15:42:40 15:46:18 15:46:21 15:46:21 15:46:21 15:46:22 15:46:51 15:46:51 15:46:51 15:46:51 15:46:51 15:47:50 15:47:50 15:47:50 15:47:50 15:47:50 15:47:50 15:47:50 15:47:50 15:47:50 15:47:50
Instrumento Financ./Security
Operación / Transaction
SAB SAB SAB SAB SAB SAB SAB SAB SAB SAB SAB SAB SAB SAB SAB SAB SAB SAB SAB SAB SAB SAB SAB SAB SAB SAB SAB SAB SAB SAB SAB SAB SAB SAB SAB SAB SAB SAB SAB SAB SAB SAB SAB SAB SAB SAB SAB SAB SAB SAB SAB
COMPRA / BUY COMPRA / BUY COMPRA / BUY COMPRA / BUY COMPRA / BUY COMPRA / BUY COMPRA / BUY COMPRA / BUY COMPRA / BUY COMPRA / BUY COMPRA / BUY COMPRA / BUY COMPRA / BUY COMPRA / BUY COMPRA / BUY COMPRA / BUY COMPRA / BUY COMPRA / BUY COMPRA / BUY COMPRA / BUY COMPRA / BUY COMPRA / BUY COMPRA / BUY COMPRA / BUY COMPRA / BUY COMPRA / BUY COMPRA / BUY COMPRA / BUY COMPRA / BUY COMPRA / BUY COMPRA / BUY COMPRA / BUY COMPRA / BUY COMPRA / BUY COMPRA / BUY COMPRA / BUY COMPRA / BUY COMPRA / BUY COMPRA / BUY COMPRA / BUY COMPRA / BUY COMPRA / BUY COMPRA / BUY COMPRA / BUY COMPRA / BUY COMPRA / BUY COMPRA / BUY COMPRA / BUY COMPRA / BUY COMPRA / BUY COMPRA / BUY
Pag. 84
Centro Negociación / Trading Venue XMAD XMAD XMAD XMAD XMAD XMAD XMAD XMAD XMAD XMAD CEUX CEUX CEUX CEUX CEUX CEUX CEUX CEUX CEUX CEUX CEUX CEUX CEUX CEUX CEUX CEUX CEUX CEUX CEUX CEUX CEUX CEUX CEUX CEUX CEUX CEUX CEUX CEUX CEUX CEUX CEUX XMAD XMAD XMAD XMAD XMAD XMAD XMAD XMAD XMAD XMAD
Nº Títulos / Nr. of Precio € / Price shares € 2.282 901 901 1.589 908 61 3.894 1.453 20.000 20.000 96 298 714 546 370 1.654 1.654 1.133 521 1.654 1.654 151 1.503 1.654 1.398 1.543 272 1.271 1.543 2 1.541 1.543 1.543 1.543 1.024 400 1 118 1.543 118 995 61 1.632 2.260 3.200 1.632 689 1.632 499 2.321 3.823
3,3350 3,3350 3,3350 3,3350 3,3350 3,3350 3,3350 3,3350 3,3300 3,3250 3,3270 3,3270 3,3270 3,3270 3,3270 3,3270 3,3270 3,3270 3,3270 3,3270 3,3270 3,3270 3,3270 3,3270 3,3270 3,3230 3,3230 3,3230 3,3230 3,3230 3,3230 3,3230 3,3230 3,3230 3,3230 3,3230 3,3230 3,3230 3,3230 3,3230 3,3230 3,3200 3,3200 3,3200 3,3200 3,3200 3,3200 3,3200 3,3200 3,3200 3,3200
Hora / Trade Fecha / Date Time 31/07/2026 31/07/2026 31/07/2026 31/07/2026 31/07/2026 31/07/2026 31/07/2026 31/07/2026 31/07/2026 31/07/2026 31/07/2026 31/07/2026 31/07/2026 31/07/2026 31/07/2026 31/07/2026 31/07/2026 31/07/2026 31/07/2026 31/07/2026 31/07/2026 31/07/2026 31/07/2026 31/07/2026 31/07/2026 31/07/2026 31/07/2026 31/07/2026 31/07/2026 31/07/2026 31/07/2026 31/07/2026 31/07/2026 31/07/2026 31/07/2026 31/07/2026 31/07/2026 31/07/2026 31/07/2026 31/07/2026 31/07/2026 31/07/2026 31/07/2026 31/07/2026 31/07/2026 31/07/2026 31/07/2026 31/07/2026 31/07/2026 31/07/2026 31/07/2026
15:47:50 15:47:50 15:54:53 15:54:53 15:54:53 15:54:53 15:54:53 15:54:53 15:55:17 15:55:17 15:55:17 15:55:17 15:55:17 15:55:17 15:55:31 15:55:31 15:55:31 15:55:52 15:55:52 15:55:55 15:55:55 15:55:55 15:55:55 15:55:56 15:55:56 15:55:57 15:55:57 15:56:20 15:59:19 15:59:19 16:57:35 16:57:35 16:57:35 16:57:35 16:57:35 16:57:35 16:57:35 16:57:35 16:57:35 16:57:35 16:57:35 17:02:23 17:02:23 17:02:23 17:02:23 17:02:40 17:02:59 17:03:02 17:03:02 17:03:02 17:03:02
Instrumento Financ./Security
Operación / Transaction
SAB SAB SAB SAB SAB SAB SAB SAB SAB SAB SAB SAB SAB SAB SAB SAB SAB SAB SAB SAB SAB SAB SAB SAB SAB SAB SAB SAB SAB SAB SAB SAB SAB SAB SAB SAB SAB SAB SAB SAB SAB SAB SAB SAB SAB SAB SAB SAB SAB SAB SAB
COMPRA / BUY COMPRA / BUY COMPRA / BUY COMPRA / BUY COMPRA / BUY COMPRA / BUY COMPRA / BUY COMPRA / BUY COMPRA / BUY COMPRA / BUY COMPRA / BUY COMPRA / BUY COMPRA / BUY COMPRA / BUY COMPRA / BUY COMPRA / BUY COMPRA / BUY COMPRA / BUY COMPRA / BUY COMPRA / BUY COMPRA / BUY COMPRA / BUY COMPRA / BUY COMPRA / BUY COMPRA / BUY COMPRA / BUY COMPRA / BUY COMPRA / BUY COMPRA / BUY COMPRA / BUY COMPRA / BUY COMPRA / BUY COMPRA / BUY COMPRA / BUY COMPRA / BUY COMPRA / BUY COMPRA / BUY COMPRA / BUY COMPRA / BUY COMPRA / BUY COMPRA / BUY COMPRA / BUY COMPRA / BUY COMPRA / BUY COMPRA / BUY COMPRA / BUY COMPRA / BUY COMPRA / BUY COMPRA / BUY COMPRA / BUY COMPRA / BUY
Pag. 85
Centro Negociación / Trading Venue XMAD XMAD XMAD XMAD XMAD XMAD XMAD XMAD XMAD XMAD XMAD XMAD XMAD XMAD CEUX CEUX CEUX CEUX CEUX CEUX CEUX CEUX CEUX CEUX CEUX CEUX CEUX CEUX CEUX CEUX XMAD XMAD XMAD XMAD XMAD XMAD XMAD XMAD XMAD XMAD XMAD XMAD XMAD XMAD XMAD XMAD XMAD XMAD XMAD XMAD XMAD
Nº Títulos / Nr. of Precio € / Price shares € 1.632 619 1.632 587 3.269 1.632 2.219 1.632 956 61 1.387 2.158 2.158 2.309 1.987 567 4 253 60 1.103 955 1.032 1.032 955 1.422 1.987 515 862 1.125 1.141 2.198 1.632 566 5.268 1.044 2.198 2.198 901 1.319 901 1.775 2.321 5.268 11.698 713 2.198 2.198 2.198 2.198 5.268 2.198
3,3200 3,3200 3,3150 3,3150 3,3150 3,3150 3,3150 3,3150 3,3150 3,3150 3,3150 3,3150 3,3150 3,3150 3,3130 3,3130 3,3130 3,3130 3,3130 3,3130 3,3130 3,3130 3,3130 3,3130 3,3130 3,3130 3,3130 3,3130 3,3130 3,3130 3,3360 3,3360 3,3360 3,3360 3,3360 3,3360 3,3360 3,3360 3,3360 3,3360 3,3360 3,3350 3,3350 3,3350 3,3350 3,3340 3,3340 3,3340 3,3340 3,3340 3,3340
Hora / Trade Fecha / Date Time 31/07/2026 31/07/2026 31/07/2026 31/07/2026 31/07/2026 31/07/2026 31/07/2026 31/07/2026 31/07/2026 31/07/2026 31/07/2026 31/07/2026 31/07/2026 31/07/2026 31/07/2026 31/07/2026 31/07/2026 31/07/2026 31/07/2026 31/07/2026 31/07/2026 31/07/2026 31/07/2026 31/07/2026 31/07/2026 31/07/2026 31/07/2026 31/07/2026 31/07/2026 31/07/2026 31/07/2026 31/07/2026 31/07/2026 31/07/2026 31/07/2026 31/07/2026 31/07/2026 31/07/2026 31/07/2026 31/07/2026 31/07/2026 31/07/2026 31/07/2026 31/07/2026 31/07/2026 31/07/2026 31/07/2026 31/07/2026 31/07/2026 31/07/2026 31/07/2026
17:03:02 17:03:02 17:03:02 17:03:02 17:03:02 17:03:02 17:03:02 17:03:02 17:03:02 17:03:02 17:03:02 17:03:25 17:03:25 17:03:25 17:03:38 17:03:38 17:03:38 17:03:38 17:03:38 17:03:38 17:03:38 17:03:38 17:03:38 17:08:39 17:08:45 17:08:45 17:08:45 17:08:45 17:08:45 17:08:45 17:11:21 17:11:26 17:11:26 17:11:26 17:11:26 17:11:26 17:11:26 17:11:26 17:11:26 17:11:26 17:11:26 17:11:56 17:18:26 17:18:26 17:18:26 17:18:26 17:18:26 17:18:26 17:18:28 17:18:28 17:18:28
Instrumento Financ./Security
Operación / Transaction
SAB SAB SAB SAB SAB SAB SAB SAB SAB SAB SAB SAB SAB SAB SAB SAB SAB SAB SAB SAB SAB SAB SAB SAB SAB SAB SAB SAB SAB SAB SAB SAB SAB SAB SAB SAB SAB SAB SAB SAB SAB SAB SAB SAB SAB SAB SAB SAB SAB SAB SAB
COMPRA / BUY COMPRA / BUY COMPRA / BUY COMPRA / BUY COMPRA / BUY COMPRA / BUY COMPRA / BUY COMPRA / BUY COMPRA / BUY COMPRA / BUY COMPRA / BUY COMPRA / BUY COMPRA / BUY COMPRA / BUY COMPRA / BUY COMPRA / BUY COMPRA / BUY COMPRA / BUY COMPRA / BUY COMPRA / BUY COMPRA / BUY COMPRA / BUY COMPRA / BUY COMPRA / BUY COMPRA / BUY COMPRA / BUY COMPRA / BUY COMPRA / BUY COMPRA / BUY COMPRA / BUY COMPRA / BUY COMPRA / BUY COMPRA / BUY COMPRA / BUY COMPRA / BUY COMPRA / BUY COMPRA / BUY COMPRA / BUY COMPRA / BUY COMPRA / BUY COMPRA / BUY COMPRA / BUY COMPRA / BUY COMPRA / BUY COMPRA / BUY COMPRA / BUY COMPRA / BUY COMPRA / BUY COMPRA / BUY COMPRA / BUY COMPRA / BUY
Pag. 86
Centro Negociación / Trading Venue XMAD XMAD XMAD CEUX CEUX CEUX CEUX CEUX CEUX CEUX CEUX CEUX CEUX CEUX CEUX CEUX CEUX CEUX CEUX CEUX CEUX CEUX XMAD XMAD XMAD XMAD XMAD XMAD XMAD XMAD XMAD XMAD XMAD XMAD XMAD XMAD XMAD XMAD XMAD XMAD XMAD XMAD XMAD XMAD XMAD XMAD XMAD XMAD XMAD XMAD XMAD
Nº Títulos / Nr. of Precio € / Price shares € 1.216 2.198 328 245 953 245 1.198 1.198 735 272 191 1.198 1.198 1.198 1.198 1.198 1.198 648 550 955 243 379 4.019 2.765 3.677 2.448 184 1.986 1.986 6.954 845 2.432 556 2.391 1.917 1.081 1.460 901 901 2.323 630 544 2.987 2.352 2.448 901 901 10.411 1.113 1.430 8.638
3,3340 3,3340 3,3340 3,3330 3,3330 3,3330 3,3330 3,3330 3,3330 3,3330 3,3330 3,3330 3,3330 3,3330 3,3330 3,3330 3,3330 3,3330 3,3330 3,3330 3,3330 3,3330 3,3320 3,3330 3,3330 3,3330 3,3330 3,3330 3,3330 3,3330 3,3340 3,3340 3,3340 3,3340 3,3340 3,3340 3,3340 3,3340 3,3340 3,3340 3,3340 3,3340 3,3320 3,3320 3,3320 3,3320 3,3320 3,3320 3,3310 3,3310 3,3310
Hora / Trade Fecha / Date Time 31/07/2026 31/07/2026 31/07/2026 31/07/2026 31/07/2026 31/07/2026 31/07/2026 31/07/2026 31/07/2026 31/07/2026 31/07/2026 31/07/2026 31/07/2026 31/07/2026 31/07/2026 31/07/2026 31/07/2026 31/07/2026 31/07/2026 31/07/2026 31/07/2026
17:18:28 17:18:32 17:18:32 17:18:32 17:18:32 17:18:32 17:18:32 17:18:35 17:18:35 17:20:54 17:20:54 17:20:54 17:20:54 17:20:54 17:20:54 17:20:54 17:21:04 17:21:04 17:21:16 17:21:16 17:21:20
Instrumento Financ./Security
Operación / Transaction
SAB SAB SAB SAB SAB SAB SAB SAB SAB SAB SAB SAB SAB SAB SAB SAB SAB SAB SAB SAB SAB
COMPRA / BUY COMPRA / BUY COMPRA / BUY COMPRA / BUY COMPRA / BUY COMPRA / BUY COMPRA / BUY COMPRA / BUY COMPRA / BUY COMPRA / BUY COMPRA / BUY COMPRA / BUY COMPRA / BUY COMPRA / BUY COMPRA / BUY COMPRA / BUY COMPRA / BUY COMPRA / BUY COMPRA / BUY COMPRA / BUY COMPRA / BUY
Pag. 87
Centro Negociación / Trading Venue XMAD XMAD XMAD XMAD XMAD XMAD XMAD XMAD XMAD XMAD XMAD XMAD XMAD XMAD XMAD XMAD XMAD XMAD XMAD XMAD XMAD
Nº Títulos / Nr. of Precio € / Price shares € 8.819 2.654 1.221 4.156 1.433 4.087 2.954 2.073 1.422 2.876 4.253 1.499 816 1.151 816 93 2.876 956 1.920 955 1.789
3,3310 3,3300 3,3300 3,3300 3,3300 3,3300 3,3300 3,3300 3,3300 3,3300 3,3300 3,3300 3,3300 3,3300 3,3300 3,3300 3,3300 3,3300 3,3300 3,3300 3,3300
-
Sala de Prensa
-
Nos entendemos
es
Español
-
Sala de Prensa
-
Nos entendemos
31.07.2026
Banco Sabadell activa una línea de financiación con condiciones preferentes para los afectados por los incendios
- La entidad pone en marcha un plan de apoyo que incluye créditos al 0% y sin comisiones para particulares, autónomos y empresas
- La red de profesionales especializados y equipos sectoriales de la entidad se ponen a disposición de todos los afectados para ofrecer soluciones personalizadas en función de las necesidades concretas
- La entidad se ha dirigido a todos los asegurados potencialmente afectados para facilitar la rápida tramitación de sus siniestros, en caso de que los tengan
- Con estas iniciativas, Banco Sabadell trata de ofrecer una ayuda eficaz y rápida a las familias y empresas afectadas y contribuir a la rápida recuperación económica y social de las zonas dañadas
31 de julio de 2026
Banco Sabadell pone en marcha una línea de financiación con condiciones preferentes como parte de un plan de medidas de apoyo para todas las personas que se están viendo afectadas por los incendios que están impactando en diversos puntos del territorio, especialmente en Guadalajara, Madrid, Ávila, Castellón y Zamora en las últimas horas.
Esta iniciativa, que incluye créditos al 0% y sin comisiones para un plazo de hasta cinco años, trata de ofrecer un apoyo eficaz y rápido a las familias, autónomos, comercios y empresas de todos los sectores para que cuenten con financiación lo antes posible con el objetivo de que obtengan liquidez inmediata para hacer frente a gastos urgentes y reparar daños materiales.
La entidad pone a disposición de los afectados su red de profesionales especializados y equipos sectoriales, con capacidad para ofrecer soluciones personalizadas en función de las necesidades concretas de particulares, autónomos, comercios y empresas de cualquier tamaño.
Sabadell Seguros ofrece asistencia
Por su parte, Sabadell Seguros se ha puesto en contacto con los clientes potencialmente afectados para ofrecerles acompañamiento desde el primer momento y facilitar la gestión de los siniestros. La compañía ha activado procedimientos específicos para acelerar la tramitación de expedientes y coordinar las medidas de asistencia necesarias en cada caso.
Sabadell Seguros ha habilitado una línea telefónica específica (912 763 738) para dar soporte a los clientes afectados, atender consultas, orientar sobre los siguientes pasos y ayudar a gestionar cualquier incidencia relacionada con el seguro de hogar o comercio.
Con estas actuaciones, Banco Sabadell reafirma su compromiso de acompañar a las personas y empresas en los momentos de mayor dificultad, contribuyendo a la recuperación de la actividad económica y social en los territorios afectados por esta emergencia.
-
https://comunicacion.grupbancsabadell.com/sala-de-prensa/banco-sabadell-activa-una-linea-de-financiacion-con-condiciones-preferentes-para-los-afectados-por-los-incendios/ - Vía @BancoSabadell
También te puede interesar
Contacto de prensa
Si quieres recibir más información sobre nuestra actualidad, no dudes en contactar con nuestros especialistas.
Banco de Sabadell, S.A., Plaça de Sant Roc, núm. 20, 08201 Sabadell, inscrito en el Registro Mercantil de Barcelona, tomo/I.R.U.S. 1000152932861, folio 873, hoja B-1561, NIF A08000143. Entidad de crédito sujeta a la supervisión del Banco de España e inscrita en el Registro administrativo especial con el número 0081. Para cualquier consulta puedes contactar con nosotros. Banco de Sabadell, S.A., 2022. Todos los derechos reservados.
COMISIÓN NACIONAL DEL MERCADO DE VALORES A los efectos de dar cumplimiento al artículo 227 de la Ley 6/2023, de 17 de marzo, de los Mercados de Valores y de los Servicios de Inversión, Banco de Sabadell, S.A. (Banco Sabadell), pone en conocimiento de la Comisión Nacional del Mercado de Valores (CNMV) la siguiente OTRA INFORMACIÓN RELEVANTE Como continuación de la comunicación de Otra Información Relevante de 24 de julio de 2026, con número de registro 42058, relativa a la ejecución de la reducción del capital social de Banco Sabadell acordada por la Junta General Ordinaria de Accionistas celebrada el 6 de mayo de 2026, bajo el punto quinto del orden del día, mediante la amortización de la totalidad de las acciones propias adquiridas en el marco del programa de recompra aprobado por el Consejo de Administración, Banco Sabadell comunica que en fecha de hoy ha quedado inscrita en el Registro Mercantil de Barcelona la escritura pública de reducción de capital (y consecuente modificación estatutaria) en la cuantía de 14.968.634,38 euros, mediante la amortización de 119.749.075 acciones propias. En consecuencia, el capital social de Banco Sabadell ha quedado fijado en 596.057.810,75 euros, representado por 4.768.462.486 acciones de 0,125 euros de valor nominal cada una de ellas, todas ellas pertenecientes a la misma clase y serie.
Gonzalo Barettino Coloma Secretario General Sabadell, a 31 de julio de 2026
-
Sala de Prensa
-
Nos entendemos
es
Español
-
Sala de Prensa
-
Nos entendemos
27.07.2026
Banco Sabadell reorganiza su estructura para acelerar la transformación, simplificar la gestión y reforzar la ejecución de su plan de negocio
- La inteligencia artificial y la transformación ganan peso con la creación de dos nuevas áreas específicas: ‘Transformación Corporativa e IA’, con alcance transversal para toda la entidad, y ‘Transformación de Negocio’, orientada a acelerar la digitalización y mejorar la experiencia de cliente
- La nueva estructura organizativa se alinea con las prioridades estratégicas del banco: refuerza el foco en los segmentos de banca de relación –empresas, banca privada y banca personal–, al tiempo que impulsa la modernización y digitalización del negocio de particulares
- Mayor capacidad de ejecución y simplificación organizativa, centralizando funciones de soporte para agilizar la toma de decisiones y aumentar la velocidad de entrega de proyectos

27 de julio de 2026
Banco Sabadell ha anunciado una nueva estructura organizativa que tiene como objetivo acelerar la transformación de la entidad, simplificar su organización y reforzar su modelo de banca de relación, eje estratégico sobre el que se sustenta el crecimiento futuro del banco.
La composición del Comité de Dirección se mantiene sin cambios, preservando la estabilidad de la gobernanza mientras se impulsa esta nueva fase de transformación. La nueva estructura entrará en vigor el próximo 1 de septiembre
Esta nueva estructura nos permitirá concentrar más recursos y capacidades en aquellas áreas que son clave para nuestra estrategia, acelerar la transformación del banco y aprovechar plenamente el potencial de la inteligencia artificial para mejorar nuestros procesos. Queremos una organización más simple, más ágil y más colaborativa, preparada para ofrecer el mejor servicio a nuestros clientes y afrontar con éxito los retos de los próximos años
Marc Armengol, CEO
La nueva organización responde a varios principios fundamentales, entre ellos ordenar los negocios de acuerdo con las prioridades estratégicas, aumentar el foco y la velocidad de transformación, simplificar la estructura, reforzar la accountability, evolucionar las formas de trabajo para fomentar una mayor colaboración entre equipos, así como garantizar la continuidad operativa durante el proceso de transición.
La IA como eje transformador
Entre las principales novedades destaca la creación del área de Transformación Corporativa e Inteligencia Artificial, integrada en la Dirección de Estrategia que lidera Marc Prat. Esta área, que tendrá al frente a Robert Duran, nace con el objetivo de dar un impulso adicional al despliegue de la inteligencia artificial en toda la organización. Asimismo, se refuerza en capacidades IA la Dirección de Operaciones y Tecnología, que dirige Elena Carrera.
Además, dentro del área de Negocio España, que dirige Carlos Ventura, se crea una nueva área de Transformación de Negocio orientada a acelerar la innovación en producto para clientes de valor, la digitalización y los proyectos con impacto directo en clientes. Al frente de esta nueva división estará Jorge Rodríguez Maroto, el responsable de banca de Particulares, que también incorpora Negocios y Autónomos a su ámbito de responsabilidad, del que ya formaban parte la financiación, los medios de pago, el crédito al consumo, los seguros, la gestión de activos y Sabadell Consumer Finance.
Dentro del área de actuación de Ventura se crea también la unidad de Banca Comercial, dirigida por Albert Figueras, quien suma a la coordinación de las direcciones territoriales las responsabilidades de ventas remotas y servicing remoto a clientes.
La entidad ha anunciado a su vez la creación de una nueva unidad de banca personal, que dirigirá Xavi Blanquet, reportando a Ventura. De esta manera, refuerza de nuevo la apuesta por ofrecer un servicio especializado y de alta calidad a los clientes de valor, tras el anuncio hace unos días de la próxima incorporación de Adela Martín para liderar la banca privada.
Por tanto, el negocio en España estará dividido a partir de ahora en 1) Banca Retail y Transformación de Negocio, 2) Banca de Empresas, 3) Banca Privada, 4) Banca Personal, y 5) Banca Comercial. Igualmente, dependerá de Carlos Ventura la Dirección de Marketing.
Otros cambios que comporta la nueva estructura afectan a la Dirección Financiera que dirige Sergio Palavecino, quien asume a partir de ahora la gestión de costes del banco; a la dirección de Personas y Sostenibilidad, que encabeza Sonia Quibus, sumará la función de gestión de Compras, y a la de Comunicación, liderada por Virginia Zafra, que asume Comunicación Interna en su totalidad.
En aras a ganar agilidad en la toma de decisiones, la reorganización también contempla la centralización de diversas funciones, actualmente distribuidas en distintas áreas de negocio (Personas, Asesoría Jurídica, Planificación Financiera, Organización, Tecnología y Operaciones).
También te puede interesar
Contacto de prensa
Si quieres recibir más información sobre nuestra actualidad, no dudes en contactar con nuestros especialistas.
Banco de Sabadell, S.A., Plaça de Sant Roc, núm. 20, 08201 Sabadell, inscrito en el Registro Mercantil de Barcelona, tomo/I.R.U.S. 1000152932861, folio 873, hoja B-1561, NIF A08000143. Entidad de crédito sujeta a la supervisión del Banco de España e inscrita en el Registro administrativo especial con el número 0081. Para cualquier consulta puedes contactar con nosotros. Banco de Sabadell, S.A., 2022. Todos los derechos reservados.
-
Sala de Prensa
-
Nos entendemos
es
Español
-
Sala de Prensa
-
Nos entendemos

 Presentación de resultados 2T26
Banco Sabadell gana 971 M€ hasta junio apoyado en el fuerte impulso del negocio y lanza una nueva recompra de acciones por 331 M€
24.07.2026
- El impulso de la actividad comercial sustenta la mejora de los ingresos y se plasma en incrementos anuales del 5,5% del crédito y el 6,4% en los recursos de clientes en el Grupo. La nueva financiación aumenta de forma notable en el trimestre en España en todos los segmentos: pymes y empresas (+38%), hipotecas (+22%) y consumo (+9%)
- Los ingresos del negocio bancario confirman el cambio de tendencia anticipado, con crecimientos trimestrales del margen de intereses (+3,4%) y de las comisiones (+4%), que continuarán en la segunda mitad del año
- La entidad inicia el calendario de remuneración a los accionistas con el nuevo programa de recompra de acciones. Mantiene su alta capacidad de generación de capital de manera orgánica y sitúa la ratio CET1 fully loaded en el 13,11%
- La rentabilidad crecerá en los próximos trimestres apoyada en el crecimiento del negocio, la contención de los gastos y la elevada calidad de los activos, hasta alcanzar los niveles de RoTE previstos del 14,5% este año y el 16% en 2027
Estos resultados confirman la fortaleza de nuestro proyecto. Los ingresos se incrementan y lo harán más en los próximos trimestres gracias al fuerte impulso de nuestra actividad comercial. Afrontamos la segunda mitad del año con confianza y enfocados en generar valor para clientes, empleados y accionistas
Marc Armengol CEO
La solidez del balance y nuestra capacidad de generación de capital siguen siendo unos de los principales activos del Grupo. Tenemos niveles de solvencia robustos y la confianza en la mejora de nuestros resultados para alcanzar la rentabilidad comprometida en los ejercicios 2026 y 2027
Sergio Palavecino Director Financiero

Grupo Banco Sabadell ha obtenido un beneficio neto de 971 millones de euros en el primer semestre de 2026, en línea con el mismo periodo del año anterior (-0,5%) e incluyendo la aportación de TSB (que en el presente ejercicio formó parte del grupo durante cuatro meses hasta su venta). Sin tener en cuenta la contribución de la unidad británica y los resultados extraordinarios, el beneficio recurrente se ha situado en 691 millones de euros (-14,1%) y ha comenzado a crecer trimestralmente (8,4%) gracias al impulso del negocio, una tendencia que continuará en adelante.
Como se había anticipado, los ingresos del negocio bancario han comenzado a crecer trimestralmente gracias al dinamismo de la actividad comercial, tras haber marcado un valle entre enero y marzo. Esta mejora continuará en la segunda parte del año y contribuirá, junto a la contención de los gastos y la elevada calidad de los activos, a que la rentabilidad RoTE recurrente aumente en los próximos trimestres desde el 13,6% de cierre de junio hasta el 14,5% a final del 2026 y el 16% en 2027.
El banco ha iniciado el calendario de remuneración al accionista. Tras el pago en mayo de un dividendo extraordinario de 50 céntimos en efectivo por la venta de TSB, la entidad ha anunciado un nuevo programa de recompra de acciones por importe de 331 millones de euros (equivalente a en torno al 2,1% del capital social del banco), que se activará la próxima semana. La política de remuneración a los accionistas se sustenta en la probada capacidad del banco de generar capital de manera orgánica. La ratio de solvencia CET1 fully loaded se ha situado en el 13,11%.
El consejero delegado de Banco Sabadell, Marc Armengol, ha afirmado: "Estos resultados confirman la fortaleza de nuestro proyecto. Los ingresos se incrementan y lo harán más en los próximos trimestres gracias al fuerte impulso de nuestra actividad comercial. Afrontamos la segunda mitad del año con confianza y enfocados en generar valor para clientes, empleados y accionistas”.
El director financiero de Banco Sabadell, Sergio Palavecino, ha asegurado: “La solidez del balance y nuestra capacidad de generación de capital siguen siendo unos de los principales activos del Grupo. Tenemos niveles de solvencia robustos y la confianza en la mejora de nuestros resultados para alcanzar la rentabilidad comprometida en los ejercicios 2026 y 2027”.
14,5%
RoTE
>1%
Margen de intereses
<3%
Costes
~40pbs
Coste total de riesgo
Impulso de la actividad comercial en todos los segmentos
El impulso de la actividad comercial se ha plasmado en un incremento del crédito vivo del 5,5% interanual, hasta cerca de 125.200 millones de euros. En España, el crecimiento ha sido del 3,6%, hasta 107.100 millones de euros, con aumentos en todos los segmentos. En pymes y grandes empresas, la inversión crediticia ha ascendido hasta rondar los 45.700 millones de euros, lo que representa un aumento del 1,9% interanual y del 2,1% trimestral. La nueva producción en términos trimestrales se anota un incremento del 38%.
El crédito vivo en hipotecas experimenta igualmente una evolución positiva, hasta situarse en 40.200 millones de euros (+3,4% interanual y +0,9% trimestral), con crecimientos del 22% trimestral en nueva producción. Estas dinámicas se replican en el crédito al consumo, hasta situarse en 5.600 millones de euros (+12,7% interanual y +2,7% trimestral) y una nueva producción que se acelera trimestralmente un 9%.

El dinamismo comercial también se ha plasmado en los recursos de clientes, que registran un incremento interanual del 6,4% en el conjunto del Grupo, hasta los 188.110 millones de euros. El crecimiento ha venido impulsado tanto por los recursos en balance (+4,7% interanual) como por los fuera de balance (+11% interanual). Entre estos últimos, destacan especialmente los fondos de inversión, apoyados en suscripciones netas positivas, así como la favorable evolución de la actividad de gestión de patrimonios y de los seguros comercializados.
Cambio de tendencia y aceleración del crecimiento
Sin contar con TSB, Banco Sabadell ha obtenido unos ingresos del negocio bancario (margen de intereses más comisiones) de 2.417 millones de euros en el primer semestre, de los que 1.230 millones han sido en el segundo trimestre, en el que ha registrado un incremento del 3,6% frente al primero fruto del dinamismo de la actividad comercial, como el banco había anticipado. Se prevé que la curva siga una tendencia alcista en los próximos trimestres.
El cambio de tendencia previsto se ha confirmado también en el margen de intereses, con un crecimiento trimestral del 3,4%, hasta los 902 millones de euros, impulsado por los mayores volúmenes de crédito. Tras alcanzar una cifra de 1.774 millones de euros en el semestre, el banco mantiene su previsión de cerrar el año con un alza superior al 1% en el conjunto del ejercicio.
De forma similar, los ingresos por comisiones mejoran un 4% frente al primer trimestre, hasta los 328 millones de euros (643 millones entre enero y junio), fruto de la mayor contribución de los ingresos por servicios. Esta tendencia también continuará en la segunda parte del año y permitirá cerrar el ejercicio con un alza de en torno al dígito medio.
Los costes totales del semestre se sitúan en 1.227 millones de euros e incorporan 88 millones de euros no recurrentes derivados del plan de prejubilaciones puesto en marcha en España, que ya se ha completado y que permitirá mejorar la eficiencia en adelante. Los ahorros anualizados serán de 40 millones de euros brutos a partir de 2027, si bien en la segunda parte de 2026 ya se obtendrán 20 millones, por encima del tercio de los 40 millones previsto inicialmente. En consecuencia, la previsión es que los costes recurrentes crezcan por debajo del 3% a cierre de 2026.
El resultado semestral recoge varios impactos extraordinarios. En sentido positivo, la venta de TSB ha generado unas plusvalías netas de impuestos de 322 millones de euros (340 millones brutos). En sentido contrario, se han registrado otros impactos, como el plan de prejubilaciones en España. El saldo total ha resultado en una aportación positiva de 201 millones de euros netos a la cuenta de resultados.
En cuanto a la calidad de los activos, la ratio de morosidad continúa mejorando y se reduce al 2,47% en el segundo trimestre de 2026, frente al 2,55% del trimestre anterior, con una cobertura stage 3 con el total de provisiones que se sitúa en el 68,7%. Esta buena evolución de la tasa de mora es consecuencia de la reducción de los activos problemáticos. El saldo de NPAs baja en 44 millones de euros en el trimestre y en 421 millones de euros en los últimos 12 meses. El coste del riesgo se ha situado en los 40 puntos básicos, la cifra prevista para el conjunto del ejercicio.

-
https://comunicacion.grupbancsabadell.com/sala-de-prensa/banco-sabadell-gana-971-me-hasta-junio-apoyado-en-el-fuerte-impulso-del-negocio-y-lanza-una-nueva-recompra-de-acciones-por-331-me/ - Vía @BancoSabadell
También te puede interesar
Contacto de prensa
Si quieres recibir más información sobre nuestra actualidad, no dudes en contactar con nuestros especialistas.
Banco de Sabadell, S.A., Plaça de Sant Roc, núm. 20, 08201 Sabadell, inscrito en el Registro Mercantil de Barcelona, tomo/I.R.U.S. 1000152932861, folio 873, hoja B-1561, NIF A08000143. Entidad de crédito sujeta a la supervisión del Banco de España e inscrita en el Registro administrativo especial con el número 0081. Para cualquier consulta puedes contactar con nosotros. Banco de Sabadell, S.A., 2022. Todos los derechos reservados.
Les comunicamos que tenemos prevista la celebración de una reunión con analistas e inversores institucionales el próximo día 24 de julio de 2026 a las 09:00 horas (CEST), con el objetivo de informar sobre los resultados del segundo trimestre de 2026 de Banco Sabadell. La presentación podrá seguirse por cualquier persona interesada a través de Internet en la dirección de la web corporativa de Banco Sabadell (www.grupobancosabadell.com). La grabación de dicha presentación estará a disposición de cualquier persona interesada, en la web corporativa de Banco Sabadell. El mismo día 24 de julio, a partir de las 11:30 horas (CEST), se efectuará una rueda de prensa que tendrá lugar en el centro corporativo de Banco Sabadell situado en la calle Sena, 12 de Sant Cugat del Vallés en Barcelona, y podrá seguirse desde la web corporativa de Banco Sabadell. La documentación en relación con dichos resultados se hará pública con anterioridad mediante comunicación de la misma a la Comisión Nacional del Mercado de Valores (CNMV).
Gonzalo Barettino Coloma Secretario General Sabadell, 22 de julio de 2026
2T26
Informe Financiero Trimestral
Hechos relevantes
3
Aspectos clave
4
Principales magnitudes
6
Evolución de resultados y actividad
7
Entorno macroeconómico
7
Evolución de la cuenta de resultados
9
Evolución del balance
15
Gestión del riesgo
19
Gestión de la liquidez
22
Gestión del capital y calificaciones crediticias
23
Resultados por unidades de negocio
25
La acción
29
Conciliación y glosario de términos sobre medidas del rendimiento
30
Conciliación de la información contable del grupo
30
Medidas alternativas del rendimiento
33
Aviso legal Este documento tiene únicamente finalidad informativa y no constituye una oferta de contratar ningún producto. Ni este documento, ni ninguna parte del mismo, deben erigirse en el fundamento en el que se base o del que dependa ningún acuerdo o compromiso. La decisión sobre cualquier operación financiera debe hacerse teniendo en cuenta las necesidades del cliente y su conveniencia desde un punto de vista jurídico, fiscal, contable y/o financiero y de conformidad con los documentos informativos previstos por la normativa vigente. Las inversiones comentadas o recomendadas podrían no ser interesantes para todos los inversores. Las opiniones, proyecciones o estimaciones contenidas en este documento se basan en información pública disponible y constituyen una valoración de Banco de Sabadell, S.A. a la fecha de su realización, pero de ningún modo aseguran que los futuros resultados o acontecimientos serán conformes con dichas opiniones, proyecciones o estimaciones. La información está sujeta a cambios sin previo aviso, no se garantiza su exactitud y puede ser incompleta o resumida. Banco de Sabadell, S.A. no aceptará ninguna responsabilidad por cualquier pérdida que provenga de cualquier utilización de este documento o de sus contenidos o de cualquier otro modo en relación con los mismos. Bases de presentación La cuenta de resultados y el balance de situación consolidados al cierre de junio de 2026 y de 2025, junto a los diferentes desgloses de partidas que se muestran en este Informe Financiero, se presentan siguiendo las bases, principios y criterios contables definidos en la Nota 1 de las cuentas semestrales consolidadas del grupo a 30 de junio de 2026. De acuerdo a las Directrices sobre medidas alternativas del rendimiento publicadas por la European Securities and Markets Authority el 5 de octubre de 2015 (ESMA/2015/1415es) se adjunta un glosario de las definiciones y la conciliación con las partidas presentadas en los estados financieros de ciertas medidas financieras alternativas utilizadas en el presente documento. Ver apartado Glosario de términos sobre medidas del rendimiento.
Segundo trimestre de 2026
2
- Hechos relevantes Como continuación a la Información Privilegiada de 1 de julio de 2025 (número de registro oficial 2805) y a la Comunicación de Otra Información Relevante de 6 de agosto 2025 (número de registro oficial 36328), Banco Sabadell informa de que, tras haberse obtenido las aprobaciones regulatorias necesarias, en el día 30 de abril de 2026 transmitió el 100% del capital social de TSB Banking Group plc (TSB) por un importe de 2.863 millones de libras esterlinas a Santander UK plc (la Operación). La contraprestación es el resultado del precio de 2.650 millones de libras esterlinas, ajustado al alza en 213 millones de libras esterlinas por la variación positiva experimentada por el Valor Neto Contable Tangible de TSB entre 1 de abril de 2025 y el 30 de abril de 2026, tal y como se había acordado. La Operación conlleva además la transmisión a Santander UK plc de otros instrumentos de capital y valores, no vencidos, emitidos por TSB y suscritos por Banco Sabadell, por un importe de 1.217 millones de libras esterlinas. La Operación ha dado lugar a una plusvalía de 322 millones de euros netos para Banco Sabadell, una vez considerados todos los impactos derivados de la Operación, y una generación de capital de más de 400 puntos básicos en la ratio Common Equity Tier 1 (CET1) fully-loaded, de los que 369 pbs se materializan en este ejercicio, y 36 pbs asociados a menores activos ponderados por riesgo operacional se materializarán entre 2027 y 2028. Como consecuencia de ello y en ejecución del acuerdo adoptado por la Junta General Extraordinaria celebrada el 6 de agosto de 2025, el 29 de mayo se distribuyó un dividendo extraordinario en efectivo, con cargo a reservas voluntarias de libre disposición, por importe de 50 céntimos de euro (brutos) por acción. La distribución de este dividendo extraordinario ha tenido un impacto en la ratio de capital Common Equity Tier 1 (CET 1) de Banco Sabadell de 378 puntos básicos. De acuerdo con la normativa contable aplicable al grupo, las operaciones llevadas a cabo por TSB y sus entidades dependientes, que constituían la práctica totalidad del segmento Negocio bancario Reino Unido, pasaron a considerarse como operaciones interrumpidas desde el 1 de julio de 2025 hasta la fecha de su venta. En consecuencia: • En la cuenta de pérdidas y ganancias contable del Grupo, los resultados asociados a TSB y sus entidades dependientes se presentan en una única línea, bajo el epígrafe “resultados de actividades interrumpidas”, para el ejercicio 2025. Esto implica que los ingresos y gastos vinculados a estos resultados se excluyan, línea por línea, del desglose de actividades continuadas de ambos periodos. • En el balance consolidado del Grupo, los activos y pasivos relacionados con la venta de TSB y sus entidades dependientes se agrupan bajo las líneas “activos no corrientes y grupos enajenables de elementos clasificados como mantenidos para la venta” y “pasivos incluidos en grupos enajenables de elementos clasificados como mantenidos para la venta”. Esta clasificación aplica exclusivamente a los balances posteriores a 1 de julio de 2025, sin afectar a balances anteriores. No obstante: • En la cuenta de pérdidas y ganancias de gestión, así como en las principales métricas de gestión incluidas en este informe, los resultados de TSB y sus entidades dependientes se siguen presentando de forma desagregada y línea a línea, tal como se venía haciendo en los informes trimestrales previos. Esto se debe a que, hasta que la operación se ha completado, la gestión de TSB ha continuado bajo el mismo modelo operativo anterior al anuncio de la venta. Esta forma de presentación está alineada con los criterios utilizados internamente en los informes de gestión.
NOTA: La información presentada en este informe corresponde a datos de gestión. Para consultar datos contables y su conciliación, ver el apartado 6. La información relativa a los apartados de cuenta de resultados, magnitudes de balance de clientes, gestión del riesgo y liquidez hace referencia al perímetro Ex TSB. Asimismo, en la cuenta de resultados se muestra la aportación neta de TSB agregada en un único epígrafe.
Segundo trimestre de 2026
3
- Aspectos clave Margen de intereses
Margen de intereses El margen de intereses se sitúa en 1.774 millones de euros a cierre de junio de 2026, lo que representa una variación interanual del -2,0%, en un entorno de tipos de interés más reducidos, que ha incidido en el rendimiento de los activos y en el coste de los pasivos. En el trimestre, el margen de intereses registra un incremento del 3,4%, impulsado principalmente por el mayor volumen de crédito, así como por una mayor aportación de la liquidez.
Variación YoY:
-2,0%
1.810
1.774
1S25
Variación QoQ:
1S26
+3,4%
872
902
1T26
2T26
Comisiones netas Las comisiones netas ascienden a 643 millones de euros a cierre de junio de 2026, lo que representa una reducción interanual del -0,9%, explicada principalmente por la menor contribución de las comisiones de servicios.
Variación YoY:
-0,9%
En términos trimestrales, se revierte la evolución de las comisiones de servicios, que, apoyadas en el buen comportamiento de las comisiones de tarjetas y de operaciones de préstamos sindicados, permiten que el total de comisiones registre un crecimiento trimestral del 4,0%.
649
643
Total costes El total de costes se sitúa en 1.227 millones de euros a cierre de junio de 2026, e incorpora en este epígrafe 88 millones de euros de costes no recurrentes derivados de iniciativas de eficiencia en España. Por su parte, los costes recurrentes incrementan un 4,9% interanual, destacando el aumento de las amortizaciones, impactadas por la reclasificación desde la línea de dotaciones de gastos asociados a activos del negocio de pagos (Paycomet) en el cuarto trimestre de 2025. Aislando este impacto, los costes recurrentes incrementan un 3,8% interanual. En el trimestre se registran 33 millones de euros de costes no recurrentes derivados de iniciativas de eficiencia en el epígrafe de costes. Los costes recurrentes, se mantienen prácticamente en línea con el trimestre anterior.
Comisiones netas
1S25
1S26
+4,0%
315
328
1T26
2T26
Total costes
Variación YoY:
(1)
+4,9%
Variación QoQ:
+0,3%
(1)
1.227 1.085 0
88
1.085
1.139
1S25
1S26 Costes recurrentes
Beneficio neto A cierre de junio de 2026, el beneficio neto se sitúa en 892 millones de euros, cifra que asciende a 971 millones de euros al incorporar la aportación neta de TSB correspondiente a los cuatro primeros meses del ejercicio. El resultado incluye 201 millones de euros netos de impactos no recurrentes.
Variación QoQ:
624 55
603 33
569
570
1T26
2T26
Costes no recurrentes
(1) Variación sobre el total de costes recurrentes.
Beneficio neto Variación YoY:
+10,9%
Variación QoQ:
+114,3%
El RoTE asciende a 14,9%, siendo el RoTE recurrente de 13,6%*. 804
892 608 284
1S25
1S26
1T26
2T26
- Proforma ajustando en el periodo la venta de TSB, que implica el reparto de un dividendo de 50 céntimos y la desconsolidación de los intangibles. No incluye el beneficio de TSB ni considera los impactos extraordinarios.
Segundo trimestre de 2026
4
Inversión crediticia viva (performing) El crédito vivo registra un crecimiento interanual del 5,5%, impulsado tanto por el buen comportamiento en España, con crecimientos en todos los segmentos, como por la positiva evolución de los negocios en el exterior, especialmente en Miami y México.
Inversión crediticia viva Variación YoY:
Trimestralmente, la inversión muestra un avance del 3,0%, apoyado principalmente en la buena evolución en España, destacando el crecimiento del crédito a empresas y al sector público, así como en la estacionalidad positiva del segundo trimestre.
+5,5%
Variación QoQ:
+3,0%
118.710
121.587
125.184
Jun 25
Mar 26
Jun 26
Total recursos de clientes
Recursos de clientes Los recursos de clientes registran un incremento interanual del 6,4%, impulsado tanto por el crecimiento de los recursos en balance como por el aumento de los recursos fuera de balance. En estos últimos destacan especialmente los fondos de inversión, apoyados en suscripciones netas positivas, así como la favorable evolución de la actividad de gestión de patrimonios y de los seguros comercializados. En el trimestre, los recursos de clientes presentan un crecimiento del 1,8%, igualmente sustentado tanto en el aumento de los recursos fuera de balance como en la evolución positiva de los recursos de clientes en balance.
Variación YoY:
+6,4%
Variación QoQ:
+1,8%
184.768
188.106
49.318
52.529
54.726
127.404
132.239
133.380
Jun 25
Mar 26
176.722
Recursos de clientes en balance
Jun 26 Recursos fuera de balance
Stage 3 y ratios de cobertura (%) 70,7
68,8
67 , 00
68,7 57 , 00
52,8
54,6
52,5
2,81
2,55
2,47
Jun 25
Mar 26
Jun 26
47 , 00
37 , 00
Activos problemáticos (NPAs) La ratio de morosidad se reduce al 2,47% y la ratio de cobertura stage 3 con el total de provisiones se sitúa en el 68,7%.
27 , 00
17 , 00
Ratio de morosidad
El saldo de NPAs se reduce en 44 millones de euros en el trimestre y en 421 millones de euros en los últimos doce meses, siendo la cobertura del 63,4%. El coste del riesgo de crédito se sitúa en 31 pbs, mientras que el coste del riesgo total asciende a 40 pbs.
Ratio de cobertura stage 3
Activos problemáticos 4.447
4.070
4.025
659
636
3.674
3.411
3.390
Jun 25 Activos stage 3
Mar 26 Jun 26 Activos inmobiliarios problemáticos
773
CET1 fully-loaded (%)
Ratio de capital La ratio CET1 fully-loaded* se sitúa en el 13,11% a cierre de junio de 2026. La ratio CET1 phase-in se sitúa en el 13,16% y la ratio de Capital Total asciende al 18,12%, por lo que se sitúa por encima de los requerimientos regulatorios, con un MDA buffer de 423 pbs.
Ratio de cobertura stage 3 con total provisiones
13,56
13,18
13,11
Jun 25
Mar 26
Jun 26
- Aplicando calendario regulatorio del output floor.
Segundo trimestre de 2026
5
- Principales magnitudes 3 0 .0 6 .2 5
3 0 .0 6 .2 6
(5) Y o Y ( %)
1.810 2.459 2.534 1.449 804 975
1.774 2.417 2.463 1.236 892 971
-2,0 -1,7 -2,8 -14,7 10,9 -0,5
To tal activo s
252.373
199.084
-21,1
Inversió n crediticia bruta viva Inversió n crediticia bruta de clientes Recurso s de clientes en balance Recurso s fuera de balance To tal recurso s de clientes P atrimo nio neto Fo ndo s pro pio s
118.710 122.286 127.404 49.318 176.722 14.491 14.996
125.184 128.504 133.380 54.726 188.106 12.175 12.381
5,5 5,1 4,7 11,0 6,4 -16,0 -17,4
0,8 2,4 12,7 15,3 42,8
0,7 2,3 12,3 14,9 49,8
2,81 68,8 22 44
2,47 68,7 31 40
93,3 193 138
92,6 188 131
79.212 13,62 13,56 17,09 19,38 28,99 9,10 5,37
70.748 13,16 13,11 16,34 18,12 28,03 10,20 5,94
-10,7
5.120 2,703 13.839 0,34 2,93 2,43 1,11 7,93
4.781 3,099 14.816 0,32 2,59 2,09 1,49 9,62
-6,6 14,7 7,1 -5,5 -11,6 -14,1
1.165 14.139
1.116 13.842
Cuenta de resultados (m illones de € ) M argen de intereses M argen básico M argen bruto M argen antes de do tacio nes B eneficio neto B eneficio neto co n TSB
Balance (m illones de € )
Rentabilidad y eficiencia (%) ROA RORWA ROE ROTE Eficiencia (incluye co stes no recurrentes)
Gestión del riesgo Ratio de mo ro sidad (%) Ratio de co bertura stage 3 co n to tal pro visio nes (%) Co ste del riesgo de crédito (pbs) Co ste del riesgo to tal (pbs)
Gestión de la liquidez (%) Lo an-to -depo sit ratio LCR NSFR
(1)
Gestión del capital
(2)
A ctivo s po nderado s po r riesgo (A P R) (millo nes de €) Co mmo n Equity Tier 1 (%) Co mmo n Equity Tier 1 fully-lo aded (%) Tier 1 (%) Ratio to tal de capital (% ) M REL (% A P R) M REL (% LRE) Leverage ratio (%)
Acciones (datos a fin de período) Número de accio nes en circulació n meno s la auto cartera (en millo nes) Valo r de co tizació n (€) Capitalizació n bursátil (millo nes de €) B eneficio neto atribuido po r acció n (B P A ) (€) Valo r co ntable po r acció n (€) Valo r co ntable tangible po r acció n (€) Valo r de co tizació n so bre el valo r co ntable tangible P rice-to -earnings ratio
(3) (4)
Otros datos Oficinas Empleado s
(1) (2) (3) (4) (5)
Teniendo en cuenta la mejor estimación a la fecha de publicación del informe. Ratio fully-loaded aplicando calendario regulatorio del output floor. Conforme a las expectativas de los supervisores, las ratios regulatorias deberán reflejar una deducción en CET1 correspondiente a cualquier exceso sobre el umbral fijado en cada momento para distribuciones extraordinarias de capital (definido en terminos de ratio fully-loaded aplicando el calendario regulatorio del output floor). Número de acciones totales deduciendo la posición final de la autocartera (incluyendo programa de recompra si aplica). Sin ajustar los valores históricos. Las variaciones YoY a lo largo del documento referentes a la cuenta de resultados hacen referencia a los seis meses acumulados de 2026 vs seis meses acumulados de 2025.
Segundo trimestre de 2026
6
- Evolución de resultados y actividad Entorno macroeconómico Contexto económico, político y financiero internacional El conflicto en Oriente Próximo fue el foco principal de los acontecimientos político-económicos en el 2T26. El Estrecho de Ormuz se mantuvo prácticamente cerrado al tránsito de buques durante los meses de abril y mayo, mientras el precio del petróleo se mantuvo, en general, por encima de los 100 dólares por barril. A mediados de junio, la firma de un memorándum de entendimiento entre Estados Unidos e Irán dio lugar a una importante caída del precio del petróleo, que pasó a situarse alrededor de los niveles de antes del conflicto. En todo caso, el restablecimiento del tránsito por el Estrecho de Ormuz fue escaso y las hostilidades volvieron a ponerse de manifiesto en poco tiempo. Una de las cuestiones que facilitó la moderación del precio del petróleo fueron los ajustes de oferta y demanda que tuvieron lugar en el mercado global de petróleo, con el restablecimiento de rutas, uso de reservas estratégicas de petróleo y, especialmente, las menores importaciones por parte de China. Los efectos macroeconómicos del conflicto han sido visibles principalmente en los precios, con incrementos generalizados en los datos de inflación. También ha sido notable el impacto en los índices de confianza, tanto de los consumidores como de las empresas. Por el contrario, el efecto en el consumo o la producción industrial ha sido más moderado de lo que se anticipó en primera instancia. Con todo, la actividad se mantuvo sólida en Estados Unidos, mientras que, en la zona euro, se registraron muestras de debilidad algo más acentuadas. En el ámbito comercial, Estados Unidos dio a conocer la conclusión de una de las investigaciones que se abrieron sobre 60 países por motivos de trabajo forzoso. A través de la misma, se recomiendan aranceles de entre el 10% y el 12,5% para los diferentes países. Se trata de un mecanismo legal que se espera que pueda reemplazar la tasa del 10% que opera de forma temporal hasta finales de julio bajo la Sección 122 de la Ley de Comercio. En cualquier caso, esto no debería tener impacto en la UE, que se espera que opere bajo las reglas del acuerdo comercial que firmó con Estados Unidos el año pasado y que considera un arancel del 15% general y ventajas arancelarias en tasas sectoriales. Por otro lado, la UE ratificó la actualización del acuerdo comercial con México. Además, la UE y China se dieron tiempo hasta octubre para solucionar diferencias comerciales antes de la implementación de potenciales medidas por parte de Europa contra el gigante asiático. Situación económica en España En España, los últimos indicadores de actividad sugieren un mantenimiento o incluso aceleración del crecimiento respecto al primer trimestre. Las ventas al detalle y la producción industrial de mayo se recuperaron de sus caídas de abril, al tiempo que los índices de confianza empresarial también experimentaron una mejora en junio, con la única excepción del PMI de manufacturas, que cayó al revertirse la acumulación de inventarios en mayo. Por otro lado, los indicadores relacionados con el turismo y con las matriculaciones de vehículos también tuvieron un buen comportamiento, mientras que la afiliación a la Seguridad Social de junio marcó un crecimiento mensual máximo desde abril de 2023. Con todo, la encuesta de actividad que hace el
Banco de España (BdE) a las empresas indica que estas esperan un aumento de la facturación en el 2T26 y declaran un reducido impacto del conflicto en Oriente Medio sobre la demanda, aunque más importante sobre los costes y las decisiones de inversión. En este contexto, el BdE mantuvo sus previsiones de crecimiento en el 2,3% este año y el 1,7% el año que viene, como resultado de un deterioro del contexto internacional compensado por unos mejores datos de los esperados en el 2T26 y la revisión al alza de los flujos migratorios. En cuanto a los precios, la inflación de junio se mantuvo en el 3,6% interanual, máximo desde junio de 2024, influido por los precios de la energía (en especial de la electricidad) y debido a la elevada inflación subyacente, influida especialmente por el precio de los servicios más relacionados con el turismo. Por último, en cuanto a la política económica, destacó la prórroga durante tres meses parte de las medidas energéticas aprobadas en marzo para paliar los impactos de la guerra en Irán y la aprobación del techo de gasto y los objetivos de déficit público por parte del Gobierno como paso previo a la presentación del proyecto de presupuestos para el año que viene. Situación en México Estados Unidos comunicó formalmente que no renovará el TMEC en su configuración actual más allá de 2036, fecha de vencimiento prevista actualmente. Ello da lugar a un periodo de revisiones anuales que pueden extenderse durante años. Algunos centros de estudio y agencias de rating han reaccionado con rebajas de sus previsiones de crecimiento del PIB de México, aunque el promedio del consenso se mantiene en torno al 1% para 2026. Mientras tanto, los indicadores de actividad han continuado mostrando debilidad. Por otro lado, el Consejo Europeo ratificó la renovación del acuerdo comercial de la UE con México, de forma que solo queda pendiente su aprobación final por el Parlamento mexicano. Se trata de un desarrollo positivo, aunque, en la actualidad, México mantenga la mayor parte de sus relaciones comerciales con Estados Unidos. Respecto a los precios, la inflación se moderó en junio, hasta el 3,4% interanual. La tasa subyacente se redujo hasta la parte alta del objetivo de inflación del Banxico (4%), en mínimos del último año. En este contexto, el Banxico mantuvo inalterado el tipo oficial en el 6,50% en su reunión de junio, en línea con lo esperado. El Banxico había dado por finalizado el ciclo de bajadas en su reunión previa y considera que el nivel actual de tipos es adecuado para afrontar los desafíos del entorno macroeconómico. La institución considera que persisten los riesgos a la baja sobre la actividad económica y que los riesgos sobre la inflación están equilibrados. El consenso prevé que el tipo oficial se mantenga en el 6,50% este año. Mercados de renta fija El BCE incrementó el tipo de depósito en 25 pbs, hasta el 2,25%, en su reunión de junio. El BCE revisó al alza las previsiones de inflación para 2026 y 2027 a causa del shock energético y calificó el ajuste en los tipos de interés como robusto. Adicionalmente, Lagarde insistió en que, dada la
Segundo trimestre de 2026
7
elevada incertidumbre, el BCE adoptará las decisiones “reunión a reunión” y que el banco central no está comprometido de antemano con una senda de tipos concreta. El mercado está cotizando alguna subida de tipos adicional por parte del BCE, aunque la volatilidad al respecto ha sido elevada. Por otro lado, K. Warsh tomó posesión al frente de la Reserva Federal. En su reunión de junio, la Fed mantuvo el rango objetivo del tipo de los Fed Funds en el 3,50%-3,75%, el cual no sufrió cambios durante el trimestre. En la revisión de previsiones, la Fed no anticipó un deterioro significativo de la actividad, aunque sí un nivel de precios por encima del objetivo tanto este año como el próximo. En cuanto a los tipos de interés, se reflejó la división dentro del FOMC, con varios miembros siendo partidarios de un tensionamiento adicional de los tipos de interés este año, mientras que otros siguieron considerando más probable un rango de tipos más bajo o estable. A su vez, en la reunión se adoptaron cambios en la comunicación, con un statement mucho más corto de lo habitual y donde se formalizó el final de la forward guidance por parte de la Fed. Además, K. Warsh anunció la creación de grupos de trabajo de cara a reformar el funcionamiento de la Fed en materia de: i) comunicación, ii) fuentes de datos, iii) marco de precios, iv) balance y, v) productividad y mercado laboral (relacionado con la IA). Los grupos de trabajo estarán formados por expertos tanto del ámbito académico como del mundo profesional. Por su parte, el Banco de Inglaterra mantuvo el tipo oficial en el 3,75% en junio. La decisión fue adoptada por 7-2, donde dos miembros fueron partidarios de incrementar el tipo oficial en 25 pbs. Los miembros del BoE expresaron su preocupación por los posibles efectos de segunda ronda, en un contexto en el que la inflación de servicios continúa mostrando una elevada persistencia.
PIB – EE.UU. vs. Zona euro (variación interanual en %) PIB EEUU
Las rentabilidades de la deuda pública a largo plazo registraron un tono divergente a ambos lados del Atlántico. En Estados Unidos, hubo un repunte, impulsado por la recalibración al alza de expectativas de tipos oficiales de la Fed y por la resiliencia de los datos macroeconómicos. En Europa, la caída del precio del petróleo permitió reducir las expectativas de inflación en la zona euro, recalibrando a la baja las expectativas de tipos oficiales. Así, las rentabilidades a largo plazo retrocedieron a lo largo del trimestre a pesar de que llegaron a alcanzar máximos desde mediados de 2011 en Alemania y desde mediados de 2008 en Reino Unido. Las primas de riesgo de los países periféricos registraron retrocesos. La prima española retrocedió -2 pbs a lo largo del trimestre, hasta 48 pbs, mientras que la italiana lo hizo -13 pbs hasta 77 pbs. Por su lado, la prima francesa registró un ligero aumento de +7 pbs, hasta 79 pbs. Mercados de renta variable Las bolsas registraron alzas generalizadas a lo largo del trimestre gracias a la caída del precio del petróleo y el rally en la industria de semiconductores en Asia. Las big tech americanas registraron avances (+12%), aunque el desempeño siguió siendo peor que el de las small caps (+21%) y cerraron junio por debajo del nivel de principios de año (-2%). Las bolsas europeas también cerraron con avances (Stoxx 600: +10%), aunque en general inferiores a los de las americanas. Destacó en negativo el FTSE 100, que se había beneficiado en el primer trimestre del alza en el precio del petróleo y el peso del sector energético en el índice. En conjunto, se observó una volatilidad mucho más contenida que en el primer trimestre del año ante la desescalada del conflicto en Oriente Próximo.
Tipo de interés oficial – EE.UU. vs. Zona euro (en %) Tipo de interés oficial EEUU
PIB zona euro
15,0
Tipo de interés oficial zona euro
5,5
10,0
4,5
5,0
3,5
0,0
2,5
-5,0
1,5
-10,0
0,5
6/26
6/25
6/24
6/23
6/22
6/21
6/20
6/19
6/18
-0,5
6/17
6/26
6/25
6/24
6/23
6/22
6/21
6/20
6/19
6/18
6/17
-15,0
Fuente: Bloomberg.
Tipos de cambio: Paridad 1 euro/moneda 30.06.25 30.09.25 31.12.25 31.03.26 30.06.26 USD
1,1720
1,1741
1,1750
1,1498
1,1394
MXN
22,0899
21,5314
21,1180
20,7101
19,9030
Fuente: Banco de España.
Segundo trimestre de 2026
8
Evolución de la cuenta de resultados Resumen de resultados: A cierre de junio de 2026, Banco Sabadell ha obtenido un beneficio neto de 892 millones de euros, que asciende a 971 millones de euros incorporando la aportación neta de TSB de los cuatro primeros meses del año. Cabe destacar que el beneficio está impactado por 201 millones de euros netos de efectos no recurrentes, de los cuales 322 millones de euros netos corresponden a la venta de TSB realizada en el segundo trimestre (340 millones de euros brutos). De este importe, 331 millones de euros brutos se han registrado en la línea de Plusvalías por venta de activos y otros resultados y 9 millones de euros brutos en el epígrafe de Resultados de operaciones financieras y diferencias de cambio. Adicionalmente, se ha registrado la totalidad de las iniciativas de eficiencia en España, que han supuesto un impacto de -64 millones de euros netos (-92 millones de euros brutos, de los que -37 millones de euros brutos en el segundo trimestre). De dicho importe, -88 millones de euros brutos se han contabilizado en el epígrafe de Total costes, -2 millones de euros brutos en Otras dotaciones y deterioros y -2 millones de euros brutos en Plusvalías por venta de activos y otros resultados, correspondiendo estos
dos últimos conceptos a impactos asociados al cierre de oficinas. Por otra parte en el segundo trimestre del ejercicio se ha llevado a cabo la venta de una participación accionarial, lo que ha supuesto un impacto neto/bruto de -45 millones de euros en el epígrafe de Plusvalías por venta de activos y otros resultados. Por último, señalar el impacto total relacionado con la cobertura de la libra sobre el precio de venta de TSB, que ha supuesto el registro de -17 millones de euros brutos en 2026 (-12 millones de euros netos) en la línea de Resultados de operaciones financieras y diferencias de cambio, de los que -3 millones de euros brutos se han registrado en el segundo trimestre.
Cuenta de pérdidas y ganancias acumulada (en millones de € )
1S25
1S26
YoY (%)
Margen de intereses
-2,0
1.810
1.774
Comisiones netas
649
643
-0,9
Margen básico
2.459
2.417
-1,7
16 102 -43
17 65 -37
5,3 -36,0 -13,9
Margen bruto
2.534
2.463
-2,8
Gastos de explotación Gastos de personal Otros gastos generales de administración Amortización Total costes
-911 -592 -319 -175 -1.085
-1.025 -695 -330 -202 -1.227
12,5 17,3 3,4 15,9 13,0
-1.085
-1.139
4,9
0
-88
--
1.449
1.236
-14,7
-179 -21 -41 -12
-257 -34 6 279
43,9 59,1
Resultados operaciones financieras y diferencias de cambio Resultados método participación y dividendos Otros productos y cargas de explotación
Promemoria: Costes recurrentes Costes no recurrentes
Margen antes de dotaciones Dotaciones para insolvencias Dotaciones a otros activos financieros Otras dotaciones y deterioros Plusvalías por venta de activos y otros resultados
Resultado antes de impuestos
1.195
1.230
2,9
Impuesto sobre beneficios Resultado atribuido a intereses minoritarios
-390 1
-335 3
-14,1 184,9
Beneficio neto
804
892
10,9
Aportación neta TSB
171
79
-53,9
Beneficio neto con TSB
975
971
-0,5
Segundo trimestre de 2026
9
Cuenta de pérdidas y ganancias trimestral (en millo nes de €)
2 T2 5
3 T2 5
4 T2 5
1T 2 6
2 T2 6
Qo Q ( % )
Margen de intereses
906
899
895
872
902
3,4
Co misio nes netas
327
314
332
315
328
4,0
Margen básico
1.233
1.213
1.227
1.187
1.230
3,6
Resultado s o peracio nes financieras y diferencias de cambio
-9
-31
-4
1
16
--
Resultado s méto do participació n y dividendo s
41
34
45
24
41
72,8
Otro s pro ducto s y cargas de explo tació n
-13
-11
-56
-17
-20
15,9
1.251
1.204
1.212
1.195
1.267
6,0
Gasto s de explo tació n
-446
-470
-486
-523
-501
-4,2
Gasto s de perso nal
-294
-301
-315
-361
-333
-7,8
Otro s gasto s generales de administració n
-153
-169
-171
-162
-168
3,7
-89
-91
-119
-100
-102
1,8
-535
-561
-605
-624
-603
-3,3
-535
-561
-605
-569
-570
0,3
0
0
0
-55
-33
-39,8
Margen antes de dotaciones
716
643
608
572
664
16,2
Do tacio nes para inso lvencias
-92
-117
-130
-120
-137
14,3
Do tacio nes a o tro s activo s financiero s
-5
-3
-14
-18
-15
-18,0
Otras do tacio nes y deterio ro s
-16
-6
20
5
0
-100,0
P lusvalías po r venta de activo s y o tro s resultado s
-1
-4
-20
0
280
--
Resultado antes de im puestos
601
513
463
438
792
80,7
Impuesto so bre beneficio s
-190
-169
-153
-152
-183
19,8
1
0
1
2
1
-45,6
Beneficio neto
410
344
310
284
608
114,3
Aportación neta TSB
77
70
76
63
16
-74,5
Beneficio neto con TSB
486
414
386
347
624
80,0
Margen de intereses:
Margen de clientes y margen sobre ATMs:
El margen de intereses se sitúa en 1.774 millones de euros a cierre de junio de 2026, lo que representa una variación interanual del -2,0%. Esta evolución se explica principalmente por el menor rendimiento del crédito y por la disminución de la aportación de la liquidez. Estos impactos se ven parcialmente compensados por la evolución positiva de los volúmenes, el menor coste de los recursos y de la financiación en los mercados de capitales, así como por la mayor contribución de la cartera de renta fija.
El margen de clientes se sitúa en el 2,84% a cierre del segundo trimestre de 2026, reduciéndose así en 16 pbs respecto al mismo periodo del año anterior. Esta evolución se explica principalmente por el menor rendimiento del crédito, parcialmente compensado por la reducción del coste de los recursos. En términos trimestrales, el margen de clientes se mantiene prácticamente estable.
Margen bruto
A mo rtizació n To tal co stes P ro memo ria:
0
Co stes recurrentes Co stes no recurrentes
Resultado atribuido a intereses mino ritario s
En el trimestre, el margen de intereses registra un incremento del 3,4%, impulsado principalmente por el mayor volumen de crédito, así como por una mayor aportación de la liquidez.
El margen sobre activos totales medios se reduce en 6 pbs interanualmente y presenta un crecimiento de 1 pb en el trimestre.
Evolución del margen (en %)
3,00%
2,91%
2,88%
2,85%
2,84% Margen de clientes
Margen de intereses sobre ATM
1,85%
1,79%
1,83%
1,78%
1,79%
2T25
3T25
4T25
1T26
2T26
Segundo trimestre de 2026
10
Evolución del margen de intereses
906
899
895
872
902
2T25
3T25
4T25
1T26
2T26
Variación YoY:
-2,0%
Variación QoQ:
+3,4%
Evolución trimestral del margen de intereses (millones €)
+3
+16
+11
902
872
1T26
Margen de intereses de clientes
Número de días
Cartera de renta fija, liquidez, coste financiación mayorista y otros
2T26
Rendimientos y cargas trimestrales 2 T2 5 (en millones de €)
S a l do
R t dos
2,69 3,88 3,06 0,47
194 1.120 254 22
28.256 118.000 34.496 17.602
196.697 3,24 1.590
198.354
m e di o
Efectivo y equivalentes (1 ) Crédito a la clientela (neto) Cartera de renta fija Otros activos
Total activos Entidades de crédito (2) Depósitos de la clientela M ercado de capitales Otros pasivos y recursos propios
Total recursos
3 T2 5 S a l do
Ti po %
28.978 115.675 33.186 18.858
25.379 126.078 23.078 22.162
m e di o
4 T2 5 S a l do
Ti po %
R t dos
2,39 3,68 2,99 0,65
170 1.093 260 29
21.926 119.104 34.893 17.632
3,10 1.552
193.554
m e di o
1T 2 6 S a l do
Ti po %
R t dos
2,41 3,64 2,97 0,26
133 1.093 261 12
24.989 119.374 36.348 17.926
3,07 1.499
198.637
m e di o
2 T2 6 S a l do
Ti po %
R t dos
2,21 3,63 2,94 0,20
136 1.070 263 9
25.246 122.190 37.564 16.957
3,02 1.478
201.957
m e di o
Ti po %
R t dos
2,22 3,62 2,86 0,53
140 1.104 268 22
3,05 1.534
-2,73 -0,88 -3,29 -0,78
-173 -278 -190 -43
28.405 126.488 21.808 21.652
-2,48 -0,77 -3,08 -1,13
-177 -244 -169 -62
22.600 128.014 21.446 21.495
-2,54 -0,76 -2,99 -0,98
-145 -244 -161 -53
25.018 131.932 21.536 20.151
-2,40 -0,78 -3,00 -0,90
-148 -253 -159 -45
27.084 132.854 20.754 21.265
-2,37 -0,78 -3,17 -0,94
-160 -258 -164 -50
196.697 -1,39
-684
198.354
-1,31
-652
193.554
-1,24
-604
198.637
-1,24
-605
201.957
-1,26
-632
Margen de intereses
906
899
895
872
902
Margen de clientes
3,00
2,91
2,88
2,85
2,84
Margen de intereses sobre ATM
1,85
1,79
1,83
1,78
1,79
(1) (2)
Incluye caja, bancos centrales, entidades de crédito y adquisiciones temporales de activos. Incluye las cesiones temporales de activos.
Segundo trimestre de 2026
11
Resultados por operaciones financieras y diferencias de cambio:
Comisiones netas:
A cierre de junio de 2026, este epígrafe totaliza 17 millones de euros, manteniéndose en línea con el mismo periodo del año anterior. En comparación con el trimestre precedente, presenta una evolución favorable, explicada principalmente por el registro de 9 millones de euros asociados a instrumentos de deuda por la venta de TSB, así como por el menor impacto de la cobertura de la libra sobre el precio de venta de dicha entidad, al haberse contabilizado únicamente un mes de dicho efecto durante el segundo trimestre.
Las comisiones netas ascienden a 643 millones de euros a cierre de junio de 2026, lo que representa una reducción interanual del -0,9%, explicada principalmente por la menor contribución de las comisiones de servicios. En términos trimestrales, se revierte la tendencia de las comisiones de servicios, que, apoyadas en el buen comportamiento de las comisiones de tarjetas y de operaciones de préstamos sindicados, permiten que el total de comisiones registre un crecimiento trimestral del 4,0%.
Evolución de las comisiones 332
315
328
72
65
67
159
158
169
82
101
93
92
3T25
4T25
1T26
2T26
327
314
71
65
177
166
79 2T25
Gestión de activos y seguros
Servicios
Variación YoY:
-0,9%
Variación QoQ:
+4,0%
Operaciones de riesgo
Comisiones (en millones de €)
1T 2 6
2 T2 6
Qo Q ( % )
1S2 5
1S2 6
Y oY (% )
Operaciones de activo
42
42
1,4
89
84
-5,4
Avales y otras garantías
23
24
5,5
48
47
-2,7
Com isiones derivadas de operaciones de riesgo
65
67
2,8
137
131
-4,4
Tarjetas
40
46
16,3
86
86
0,4
Órdenes de pago
14
15
5,8
32
29
-9,1
Valores
19
19
0,6
35
37
5,5
Cuentas a la vista
56
54
-2,9
113
110
-2,5
Cambio de billetes y divisas
19
19
-0,6
43
38
-11,2
Resto
10
16
61,8
34
25
-24,5
158
169
7,4
343
327
-4,8
Fondos de inversión
32
33
3,0
61
65
6,8
Comercialización de fondos pensiones y seguros Gestión de patrimonios
51
49
-5,1
85
100
17,7
9
10
9,1
22
20
-11,0
Gestión de activos y seguros
93
92
-0,9
168
185
9,9
Total com isiones
315
328
4,0
649
643
-0,9
Com isiones de servicios
Segundo trimestre de 2026
12
Resultados método participación y dividendos:
Total costes:
Se sitúan en 65 millones de euros a cierre de junio de 2026, reduciéndose en la comparativa interanual por una menor aportación del negocio de seguros afectada por la volatilidad del mercado, y adicionalmente por el registro de resultados positivos en el primer semestre de 2025 procedentes de participadas de BS Capital. Trimestralmente presenta un crecimiento de 17 millones de euros por la mejora en la aportación del negocio de seguros.
El total de costes se sitúa en -1.227 millones de euros a cierre de junio de 2026, e incorpora en este epígrafe -88 millones de euros de costes no recurrentes derivados de iniciativas de eficiencia en España relacionadas con prejubilaciones. Por su parte, los costes recurrentes incrementan un 4,9% interanual, destacando el incremento de las amortizaciones, impactadas por la reclasificación desde la línea de dotaciones de gastos asociados a activos del negocio de pagos (Paycomet) en el cuarto trimestre de 2025. Aislando este impacto, los costes recurrentes incrementan un 3,8% interanual.
Otros productos y cargas de explotación: Se sitúan en -37 millones de euros a cierre de junio de 2026, presentando una mejora interanual de 6 millones de euros. En el trimestre se sitúan en -20 millones de euros.
En el trimestre se registran -33 millones de euros de costes no recurrentes derivados de iniciativas de eficiencia en el epígrafe de costes. Los costes recurrentes, se mantienen prácticamente en línea con el trimestre anterior.
Total costes (en millones de €)
1T 2 6
2 T2 6
Qo Q ( % )
1S2 5
1S2 6
Y oY (% )
Gastos de personal
-361
-333
-7,8
-592
-695
17,3
Informática y comunicaciones
-67
-67
0,5
-126
-134
6,2
Publicidad
-14
-13
-4,2
-28
-27
-5,2
Inmuebles e instalaciones
-9
-11
31,2
-17
-20
15,6
Informes técnicos y gastos judiciales
-8
-6
-15,7
-22
-14
-35,7 2,0
Servicios administrativos subcontratados
-19
-18
-5,2
-37
-38
Contribuciones e impuestos
-27
-29
6,8
-55
-56
2,0
Otros
-19
-23
20,8
-34
-42
22,9
Otros gastos generales de adm inistración
-162
-168
3,7
-319
-330
3,4
Am ortización
-100
-102
1,8
-175
-202
15,9
Total costes
-624
-603
-3,3
-1.085
-1.227
13,0
P ro memo ria: Co stes recurrentes Co stes no recurrentes
-569
-570
0,3
-1.085
-1.139
4,9
-55
-33
-39,8
0
-88
--
42,8
49,8
Ratio de eficiencia (incluye co stes no recurrentes) (%)
Evolución de total costes
0
605
624
603
89
91
119
55 100
33 102
153
169
171
162
167
294
301
315
307
301
2T25
3T25
4T25
1T26
2T26
535
0
561
0
Gastos de personal recurrentes Amortización recurrente
Otros gastos generales recurrentes Costes no recurrentes
Variación YoY:
+4,9%
(1)
Variación QoQ:
+0,3%
(1)
(1) Variación sobre el total de costes recurrentes.
Segundo trimestre de 2026
13
Dotaciones para insolvencias y otros deterioros:
Plusvalías por venta de activos y otros resultados:
Totalizan ‑285 millones de euros a cierre de junio de 2026, lo que supone un incremento interanual como consecuencia del registro de mayores dotaciones por riesgo de crédito, que compensan la mejora en las provisiones asociadas a inmuebles. En términos trimestrales, las dotaciones aumentan debido principalmente al mayor registro de dotaciones por riesgo de crédito.
A cierre de junio de 2026 en este epígrafe se registra principalmente 331 millones de euros brutos relacionados con la venta de TSB. Adicionalmente se contabilizan -45 millones de euros brutos/netos relacionados con la venta de una participación accionarial, así como -2 millones de euros brutos derivados de iniciativas de eficiencia en España relacionados con el cierre de oficinas.
Con este nivel de dotaciones el coste del riesgo de crédito se sitúa en 31 pbs a cierre de junio de 2026 y el coste del riesgo total asciende a 40 pbs.
Beneficio neto: A cierre de junio de 2026, el beneficio neto alcanza los 892 millones de euros, representando un incremento del 10,9% interanual. Teniendo en cuenta la aportación neta de TSB de los cuatro primeros meses del ejercicio, el beneficio asciende a 971 millones de euros. Tal y como se ha comentado anteriormente, el beneficio incluye 201 millones de euros netos de impactos no recurrentes, de los cuales 322 millones de euros netos corresponden a la venta de TSB, -64 millones de euros netos a iniciativas de eficiencia en España, -45 millones de euros netos a la venta de una participación accionarial y -12 millones de euros netos a la cobertura de la libra sobre el precio de venta de TSB . Aislando dichos impactos, el beneficio neto presenta una reducción interanual del -14,1% y un incremento en el trimestre del 8,4%.
Segundo trimestre de 2026
14
Evolución del balance Aspectos relevantes: El crédito vivo presenta una evolución positiva tanto en la comparativa interanual como en el trimestre impulsado tanto por el buen comportamiento en España, con crecimientos en todos los segmentos, como por la positiva evolución de los negocios en el exterior, especialmente en Miami y México.
positivas, así como la favorable evolución de la actividad de gestión de patrimonios y de los seguros comercializados. En el trimestre, los recursos de clientes presentan un avance igualmente sustentado tanto en el aumento de los recursos fuera de balance como en la evolución positiva de los recursos de clientes en balance.
Los recursos de clientes registran un incremento interanual impulsado tanto por el crecimiento de los recursos en balance como por el aumento de los recursos fuera de balance. En estos últimos destacan especialmente los fondos de inversión, apoyados en suscripciones netas
Préstamos y anticipos a la clientela: La inversión crediticia bruta viva cierra junio de 2026 con un saldo de 125.184 millones de euros, incrementando así un 5,5% interanual y un 3,0% en el trimestre, impulsado tanto por el buen comportamiento en España, como de los negocios en el exterior, especialmente en Miami y México.
La inversión crediticia bruta viva de las oficinas en el extranjero (Europa y Miami), asciende a 12.702 millones de euros, incrementando así un 15,2% interanual y un 4,5% en el trimestre impulsado principalmente por la positiva evolución de la cartera de Miami.
En el perímetro España (incluyendo las oficinas en el extranjero), la inversión crediticia bruta viva presenta una mejora del 4,7% en términos interanuales creciendo en todos los segmentos. En el trimestre muestra un crecimiento del 3,0% donde destaca principalmente el mayor crédito a empresas y al sector público, así como el efecto positivo de la estacionalidad del segundo trimestre.
México presenta un incremento del 25,9% interanual y del 2,7% en el trimestre impactados por la evolución el dólar y el peso mexicano. A tipo de cambio constante, la comparativa interanual registra un incremento del 17,4% y se mantiene estable en el trimestre.
Préstamos y anticipos a la clientela (en millones de €) Préstamos y créditos con garantía hipotecaria Préstamos y créditos con otras garantías reales Crédito comercial Arrendamiento financiero Deudores a la vista y varios
Inv e rs ió n c re dit ic ia brut a v iv a Activos stage 3 (clientela) Ajustes por periodificación
Inv e rs ió n c re dit ic ia brut a de c lie nt e s s in a dquis ic ió n t e m po ra l de a c t iv o s Adquisición temporal de activos
Inv e rs ió n c re dit ic ia brut a de c lie nt e s Correcciones de valor por deterioro de activos
P ré s t a m o s y a nt ic ipo s a la c lie nt e la
V ar iació n Y o Y ( %) Qo Q ( %)
3 0 .0 6 .2 5
3 1.0 3 .2 6
3 0 .0 6 .2 6
49.772 5.281 8.320 2.495 52.841
51.331 6.894 8.547 2.533 52.283
51.824 7.134 8.821 2.764 54.642
4,1 35,1 6,0 10,7 3,4
1,0 3,5 3,2 9,1 4,5
118 .7 10
12 1.5 8 7
12 5 .18 4
5 ,5
3 ,0
3.444 133
3.152 206
3.145 175
-8,7 31,5
-0,2 -15,1
12 2 .2 8 6
12 4 .9 4 5
12 8 .5 0 4
5 ,1
2 ,8
0
0
0
--
--
12 2 .2 8 6
12 4 .9 4 5
12 8 .5 0 4
5 ,1
2 ,8
-2.405
-2.285
-2.196
-8,7
-3,9
119 .8 8 2
12 2 .6 6 0
12 6 .3 0 8
5 ,4
3 ,0
Segundo trimestre de 2026
15
Inversión crediticia bruta viva por segmento, 30.06.26 (en %)
Inversión crediticia bruta viva: comportamiento por geografía (en millones de €)
121.587
Pymes y grandes empresas 37%
5.288
125.184 5.431
116.298
119.753
+3.455
+143
Sector público 10% Otra financiación 2% México 4% Oficinas en el extranjero 10%
Crédito al consumo 5%
España (1)
Hipotecas 32%
Mar 26 Variación YoY:
España (1)
México
+4,7%
+25,9%
+5,5%
+17,4%
+5,0%
+2,7%
+3,0%
-0,3%
+2,8%
Var. YoY a tc constante: Variación QoQ: Var. QoQ a tc constante:
México
+3,0%
Jun 26
(1) España incluye oficinas en el extranjero (12.702M€ en jun 26 y 12.153M€ en mar 26).
Pasivo: Recursos de clientes: El total de recursos de clientes asciende a 188.106 millones de euros a cierre de junio de 2026, lo que representa un crecimiento del 6,4% interanual, y del 1,8% en el trimestre. Por lo que se refiere a los recursos de clientes en balance totalizan 133.380 millones de euros, presentando un crecimiento del 4,7% interanual y del 0,9% en el trimestre, ambas variaciones provocadas por la buena evolución tanto de las cuentas a la vista como de los depósitos a plazo. Los saldos de cuentas a la vista ascienden a 110.100 millones de euros, representando un crecimiento del 3,4% interanual, y del 0,4% respecto al trimestre anterior. Los depósitos a plazo totalizan 22.769 millones de euros, representando un incremento del 11,3% interanual y del 2,1% en el trimestre.
El total de recursos de clientes fuera de balance asciende a 54.726 millones de euros a cierre de junio de 2026, lo que supone un incremento interanual del 11,0%. En esta evolución destaca el buen comportamiento de los fondos de inversión, apoyados en suscripciones netas positivas, así como la favorable evolución de la actividad de gestión de patrimonios y de los seguros comercializados. En términos trimestrales, los recursos de clientes fuera de balance registran un aumento del 4,2%, igualmente apoyado en la buena evolución de los fondos de inversión y de la gestión de patrimonios.
Recursos gestionados y comercializados: Totalizan 212.782 millones de euros, lo que supone una reducción interanual del -1,2% y una evolución estable respecto al trimestre anterior, debido al impacto de las cesiones temporales de activos. Excluyendo el efecto de dichas cesiones temporales de activos, estos recursos de clientes registran un crecimiento interanual del 4,3% y un incremento del 1,9% en el trimestre.
Segundo trimestre de 2026
16
Depósitos de la clientela, 30.06.26 (en %) (*)
Evolución de los recursos de clientes (en millones de €)
Depósitos a plazo 17%
Cuentas a la vista 80%
184.692
184.768
188.106
20.949
21.066
22.154
31.023
31.707
31.464
32.571
127.404
127.660
132.037
132.239
133.380
Jun 25
Sep 25
Mar 26
Jun 26
176.722
179.330
19.426
20.647
29.892
Cesión temporal de activos 3% Dic 25
Recursos de clientes en balance
Fondos de inversión
Recursos de clientes en balance
4,7% 0,9%
Variación YoY: (*) Sin ajustes por periodificación ni cobertura con derivados.
Otros recursos fuera de balance (1)
Variación QoQ: Total recursos de clientes
6,4% 1,8%
Variación YoY: Variación QoQ:
(1) Incluye fondos de pensiones, seguros comercializados y gestión de patrimonios.
Recursos de clientes V a ria c ió n Y o Y ( %) Q o Q ( %)
(en millones de €)
3 0 .0 6 .2 5
3 1.0 3 .2 6
3 0 .0 6 .2 6
Pasivos financieros a coste amortizado
186.282
183.867
183.639
-1,4
-0,1
58.878 0 13.516 38.693 6.669
51.628 435 18.224 28.149 4.820
50.259 440 18.247 24.677 6.896
-14,6 -35,0 -36,2 3,4
-2,7 1,1 0,1 -12,3 43,1
127.404
132.239
133.380
4,7
0,9
142.427 106.477 20.454 15.273 223
137.168 110.100 22.769 4.134 165 0 17.626 3.263
-3,7 3,4 11,3 -72,9 -26,0
-2,2 0,4 2,1 -49,7 21,5
18.907 4.763
140.268 109.626 22.293 8.213 136 0 16.846 3.274
-6,8 -31,5
4,6 -0,3
166.097
160.387
158.057
-4,8
-1,5
Fo ndo s de inversió n So ciedades de inversió n IIC co mercializadas no gestio nadas
29.892 726 29.165
31.464 862 30.602
32.571 920 31.651
9,0 26,7 8,5
3,5 6,8 3,4
Gestió n de patrimo nio s
5.226
6.152
6.892
31,9
12,0
Fo ndo s de pensio nes Individuales Empresas A so ciativo s
3.334 2.145 1.186 3
3.387 2.160 1.223 3
3.537 2.267 1.267 4
6,1 5,6 6,9 5,8
4,4 4,9 3,6 5,9
Seguro s co mercializado s
10.866
11.527
11.725
7,9
1,7
Recursos fuera de balance
49.318
52.529
54.726
11,0
4,2
Recursos gestionados y comercializados
215.415
212.917
212.782
-1,2
-0,1
P asivo s financiero s sin naturaleza mino rista Depó sito s de banco s centrales Depó sito s de entidades de crédito Emisio nes institucio nales Otro s pasivo s financiero s
Recursos de clientes en balance Depó sito s de la clientela Cuentas a la vista Depó sito s a plazo Cesió n tempo ral de activo s A justes po r perio dificació n y co bertura co n derivado s Empréstito s y o tro s valo res nego ciables P asivo s subo rdinado s
Recursos en balance
(1)
(2)
(1)
(1) (1)
(1) (2)
Los recursos de clientes en balance a 30.06.26 incluyen 110.100 millones de euros de cuentas a la vista (109.626 millones de euros a 31.03.26 y 106.477 millones de euros a 30.06.25), 22.653 millones de euros de depósitos a plazo excluyendo cédulas multicedente, depósitos subordinados y Yankee CD (22.178 millones de euros a 31.03.26 y 20.439 millones de euros a 30.06.25), y 626 millones de euros de emisiones retail (pagarés), incluidos en Empréstitos y otros valores negociables (435 millones de euros a 31.03.26 y 488 millones de euros a 30.06.25). Se trata de los pasivos subordinados de los valores representativos de deuda.
Segundo trimestre de 2026
17
Patrimonio neto: La siguiente tabla muestra la evolución del patrimonio neto a cierre de junio de 2026: Patrimonio Neto V a ria c ió n (en millo nes de €)
3 0 .0 6 .2 5
3 1.0 3 .2 6
3 0 .0 6 .2 6
Yo Y
Qo Q
Fondos propios
14.996
14.664
12.381
-2.615
-2.282
661
628
611
-50
-17
13.755
14.640
11.055
-2.700
-3.585 -10
Capital Reservas Otro s elemento s de patrimo nio neto
24
28
18
-6
M eno s: accio nes pro pias
-419
-278
-273
146
6
B eneficio atribuido al grupo
975
347
971
-5
624
M eno s: dividendo s a cuenta
Otro resultado global acum ulado Intereses de m inoritarios
Patrimonio neto
0
-700
0
0
700
-541 36
-683 37
-244 38
297 2
439 1
14.491
14.017
12.175
-2.316
-1.842
Segundo trimestre de 2026
18
Gestión del riesgo Aspectos relevantes: La ratio de morosidad mejora hasta el 2,47% y la ratio de cobertura stage 3 con el total de provisiones se sitúa en el 68,7% a junio de 2026. Los activos problemáticos muestran una reducción de 44 millones de euros en el trimestre, siendo la reducción del saldo de stage 3 de 21 millones de euros y el de los activos inmobiliarios problemáticos de 23 millones de euros. En los últimos doce meses, el saldo de activos problemáticos se reduce en 421 millones de euros, de los que 284 millones de euros corresponden a saldo de stage 3 y 137 millones de euros a activos inmobiliarios problemáticos.
La cobertura de activos problemáticos asciende a 63,4%. En cuanto al desglose del crédito por stages, destacar que el crédito en stage 2 representa el 3,92% del total siendo su cobertura del 4,7%, mientras que el crédito en stage 3 representa un 2,47%, con una cobertura del 52,5%.
Gestión del riesgo: Los activos problemáticos presentan un saldo de 4.025 millones de euros a cierre de junio de 2026, de los que 3.390 millones de euros corresponden a activos stage 3 y 636 millones de euros a activos inmobiliarios problemáticos.
Ratio de morosidad (en %) (*)
La ratio de NPAs bruta se reduce hasta el 2,9%, siendo la ratio de NPAs neta del 1,1%.
Ratios de cobertura stage 3 con el total de provisiones (en %) (*)
6 7 9 0 8 , 3 4 7 7 6 4 3
2,81
2,75
2,65
2,55
2,47
68,77
69,34
69,46
70,74
68,73
Jun 25
Sep 25
Dic 25
Mar 26
Jun 26
Jun 25
Sep 25
Dic 25
Mar 26
Jun 26
(*) Calculado incluyendo riesgos contingentes.
Ratio de morosidad por segmentos (*) J un 2 5
Sep 25
D ic 2 5
M ar 26
J un 2 6 1,57%
Hipo tecas
2,02%
1,96%
1,89%
1,60%
Crédito al co nsumo
5,69%
5,64%
5,10%
5,31%
5,10%
P ymes y grandes empresas
4,09%
3,93%
3,69%
3,52%
3,47%
Resto
Ratio de morosidad
1,27%
1,29%
1,52%
1,72%
1,61%
2,81%
2,75%
2,65%
2,55%
2,47%
J un 2 5
Sep 25
D ic 2 5
M ar 26
J un 2 6
Ratio de morosidad por segmentación DRC (*)
P ro mo ció n y co nstrucció n inmo biliaria
4,47%
4,21%
4,15%
2,89%
2,38%
Co nstrucció n no inmo biliaria
3,40%
3,32%
2,35%
2,34%
2,40%
Empresas
1,52%
1,61%
1,84%
2,03%
2,01%
P ymes y autó no mo s
6,12%
5,70%
5,33%
5,18%
5,16%
P articulares co n garantía de la primera hipo teca
1,98%
1,92%
1,84%
1,56%
1,52%
2,81%
2,75%
2,65%
2,55%
2,47%
Ratio de morosidad (*) Calculado incluyendo riesgos contingentes.
Segundo trimestre de 2026
19
Evolución activos stage 3 (millones €) (*)
Evolución activos inmobiliarios problemáticos (millones €) (*)
-8% YoY
-18% YoY 3.674
3.634
3.491
3.411
3.390
773
729
684
659
636
Jun 25
Sep 25
Dic 25
Mar 26
Jun 26
Jun 25
Sep 25
Dic 25
Mar 26
Jun 26
Composición activos inmobiliarios problemáticos (en %)
Evolución activos problemáticos (millones €) (*) -9% YoY
Edificios en construcción 0,1%
Suelo 8%
Edificios terminados 92%
4.447
4.363
4.176
4.070
4.025
Jun 25
Sep 25
Dic 25
Mar 26
Jun 26
(*) Calculado incluyendo riesgos contingentes.
La siguiente tabla muestra la evolución de los activos problemáticos de los últimos trimestres: Variación trimestral de activos problemáticos (en millo nes de €)
2T 25
3T 25
4T 25
1T 2 6
2T 26
Entradas brutas
461
426
509
494
538
Recuperacio nes y ventas
-621
-379
-562
-508
-460
-161
47
-53
-14
78
Entrada neta ordinaria (stage 3) Entradas brutas
5
14
5
4
6
Ventas
-43
-58
-50
-30
-29
Variación activos inmobiliarios problemáticos
-38
-44
-45
-26
-23
Entrada neta ordinaria (stage 3) + Variación activos inmobiliarios problemáticos
-199
3
-98
-40
54
Fallido s
Variación trimestral de activos problemáticos
Segundo trimestre de 2026
-109
-87
-90
-66
-99
-307
-84
-188
-106
-44
20
Evolución de activos problemáticos (*) (en millones de € )
Jun 25
Sep 25
Dic 25
Mar 26
Jun 26
Riesgos stage 3
3.674
3.634
3.491
3.411
3.390
Total provisiones
2.527
2.520
2.425
2.413
2.330
68,8%
69,3%
69,5%
70,7%
68,7%
Riesgos stage 3
3.674
3.634
3.491
3.411
3.390
Provisiones stage 3
1.941
1.938
1.834
1.862
1.781
52,8%
53,3%
52,5%
54,6%
52,5%
773
729
684
659
636
Ratio de cobertura stage 3 con total provisiones (%)
Ratio de cobertura stage 3 (%) Activos inmobiliarios problemáticos Provisiones
306
272
251
239
222
39,5%
37,3%
36,6%
36,2%
34,9%
Total activos problemáticos
4.447
4.363
4.176
4.070
4.025
Provisiones
2.832
2.791
2.675
2.651
2.552
Ratio de cobertura de activos problemáticos (%)
63,7%
64,0%
64,1%
65,2%
63,4%
Inversión crediticia bruta sin adquisición temporal de activos + garantías financieras y otras garantías concedidas + activos inmobiliarios problemáticos
131.464
132.862
132.338
134.430
137.998
3,4%
3,3%
3,2%
3,0%
2,9%
Ratio de cobertura de inmuebles problemáticos (%)
Ratio NPA bruta (%) Activos problemáticos netos
1.615
1.572
1.500
1.418
1.473
Ratio NPA neta (%) Activos problemáticos netos sobre total activos (%)
1,2% 0,8%
1,2% 0,8%
1,1% 0,8%
1,1% 0,7%
1,1% 0,7%
(*) Incluye riesgos contingentes. (1) La ratio NPA bruta se calcula como activos problemáticos brutos sobre inversión crediticia bruta sin adquisición temporal de activos y garantías concedidas más activos inmobiliarios problemáticos y la ratio NPA neta se calcula como activos problemáticos netos incluyendo todas las provisiones sobre inversión crediticia bruta sin adquisición temporal de activos y garantías concedidas más activos inmobiliarios problemáticos.
Desglose del crédito y provisiones por stages (en millones de € ) Inversión crediticia bruta sin adquisición temporal de activos y garantías financieras y otras garantías concedidas Variación QoQ Variación YoY Provisiones
% Stage s/ Total inversión Cobertura
Segundo trimestre de 2026
Stage 1
Stage 2
Stage 3
128.587
5.386
3.390
3,2% 7,1% 295
-5,8% -22,0% 254
-0,6% -7,7% 1.781
93,6% 0,2%
3,9% 4,7%
2,5% 52,5%
21
Gestión de la liquidez Aspectos relevantes: Banco Sabadell ha realizado una emisión de 500 millones de euros de cédulas hipotecarias en el primer trimestre de 2026 y una emisión de 201 millones de euros de Senior Preferred en el segundo trimestre (emisión realizada por México en pesos mexicanos).
Sólida posición de liquidez donde la ratio LCR (Liquidity Coverage Ratio) se sitúa en 188% a cierre de junio de 2026, con una cifra total de activos líquidos de 51.419 millones de euros. La ratio de loan to deposit a cierre de junio de 2026 se sitúa en el 92,6% con una estructura de financiación minorista equilibrada.
(en millones de € )
30.06.25
31.03.26
30.06.26
119.882 -1.046
122.660 -1.315
126.308 -2.811
Crédito neto ajustado
118.835
121.344
123.497
Recursos de clientes en balance
127.404
132.239
133.380
93,3
91,8
92,6
Préstamos y anticipos a la clientela Créditos mediación
(1)
Loan-to-deposit ratio (%) (1)
Excluye las adquisiciones temporales de activos.
Estructura de financiación, 30.06.26 (en %)
Desglose mercado mayorista, 30.06.26 (en %) Emisiones retail 0%
Subordinadas 16%
Yankee CD 1%
Deuda senior 35%
Titulizaciones 9%
Repos 11% Depósitos 77% Mercado mayorista 12% Otros bancos centrales 0%
BCE 0%
Cédulas hipotecarias 39%
Vencimientos S a ldo (en millo nes de €)
2026
2027
2028
2029
2030
2031
2 0 3 1
v iv o
Cédulas hipo tecarias
1.390
1.100
985
950
1.250
200
2.000
11.624
Senio r preferred
0
0
750
1.473
750
0
0
3.268
Senio r no n preferred
67
18
500
1.500
500
500
1.195
4.280
Subo rdinadas
0
0
0
0
0
0
1.015
1.515
1.457
1.118
2.235
3.923
2.500
700
4.210
16.143
Total
Nota: Los vencimientos de deuda excluyen las emisiones de AT1 e incluyen la amortización anticipada en las emisiones con fecha de amortización opcional cuando estas hayan sido ya anunciadas.
Detalle de nuevas emisiones del año
Detalle de vencimientos del año
(en millones de € ) Cédulas hipotecarias Senior preferred Total
(en millones de € ) Cédulas hipotecarias Senior preferred Senior non preferred Subordinadas Total
1T26 500 500
2T26 201 201
Segundo trimestre de 2026
1T26 0 500 0 500 1.000
2T26 0 0 0 0 0
3T26 1.000 0 0 0 1.000
4T26 390 0 67 0 457
22
Gestión del capital y calificaciones crediticias Aspectos relevantes: La ratio CET1 fully-loaded* se sitúa en el 13,11% a cierre de junio de 2026. La ratio CET1 phase-in se sitúa en el 13,16% a cierre de junio de 2026. La ratio de Capital Total phase-in asciende al 18,12%, por lo que se sitúa por encima de los requerimientos regulatorios con un MDA buffer de 423 pbs. Los requerimientos mínimos prudenciales aplicables para junio de 2026 a Banco Sabadell tras el proceso de revisión y evaluación supervisora (SREP) se sitúan en el 8,92% para el CET1 y 13,34% para el Capital Total.
La Leverage ratio phase-in asciende al 5,94%. La ratio MREL como % de los APR’s se sitúa en el 28,03%, superior al requerimiento vigente del 25,38%(1) y la ratio MREL como % de Leverage ratio exposure (LRE) se sitúa en el 10,20%, superior al requerimiento vigente del 6,26%.
(1) La ratio incluye el Combined Buffer Requirement, estimado en 3,24%.
- Aplicando calendario regulatorio del output floor.
Ratios de capital P ha s e - in (en millo nes de €)
3 0 .0 6 .2 5
Capital Reservas Deduccio nes
(1)
Recursos Common Equity Tier 1 CET 1 (% ) P articipacio nes preferentes y o tro s
3 1.0 3 .2 6
F ully- lo a de d 3 0 .0 6 .2 6
3 0 .0 6 .2 5
3 1.0 3 .2 6
3 0 .0 6 .2 6
661
628
611
661
628
611
13.805
13.549
11.532
13.805
13.549
11.532
-3.678
-3.501
-2.833
-3.673
-3.496
-2.829
10.788 13,62%
10.676 13,23%
9.309 13,16%
10.793 13,56%
10.681 13,18%
9.313 13,11%
2.750
2.250
2.250
2.750
2.250
2.250
Recursos Tier I Tier I (% )
13.538 17,09%
12.926 16,01%
11.559 16,34%
13.543 17,02%
12.931 15,95%
11.563 16,28%
Recursos Tier II Tier II (% )
1.813 2,29%
1.326 1,64%
1.259 1,78%
1.813 2,28%
1.326 1,64%
1.259 1,77%
Base de capital
15.351
14.253
12.818
15.356
14.258
12.823
Ratio total de capital (% )
19,38%
17,66%
18,12%
19,29%
17,59%
18,05%
Activos ponderados por riesgo (APR)
79.212
80.717
70.748
79.589
81.069
71.030
Leverage ratio (% )
5,37%
5,24%
5,94%
5,37%
5,24%
5,95%
CET 1 individual (% )
15,37%
14,82%
13,98%
Tier I individual (% )
19,12%
17,87%
17,30%
Tier II individual (% )
2,38%
1,71%
1,85%
Ratio total de capital individual (% )
21,50%
19,57%
19,14%
4.832
4.882
3.597
ADIs
(2)
Nota: Ratio fully-loaded aplicando calendario regulatorio del output floor. La ratio CET1 incluye el devengo del dividendo con una ratio pay-out del 60%. La ratio de 30.06.26 excluye la plusvalía por la venta de TSB. Conforme a las expectativas de los supervisores, las ratios regulatorias deberán reflejar una deducción en CET1 correspondiente a cualquier exceso sobre el umbral fijado en cada momento para distribuciones extraordinarias de capital (definido en terminos de ratio fully-loaded aplicando el calendario regulatorio del output floor). (1) (2)
Incluye los ajustes transicionales de la normativa CRR3 (Basilea IV) a partir del 1 de enero de 2025. “Available Distributable Items”: Hace referencia al beneficio distribuible. No incluye el dividendo a cuenta ni la prima de emisión.
Segundo trimestre de 2026
23
Evolución de MREL (% APR, % LRE)
28,03% 3,97% 5,94% 1,78% 3,18%
10,20% 1,44% 2,16% 0,65% 1,16%
Senior preferred Senior non preferred Tier 2 AT1 CET 1
13,16%
4,79%
Jun 26 % APR
Jun 26 % LRE
Calificaciones de las agencias de rating Agencia S&P Global Ratings (1) Moody's Ratings (2) Fitch Ratings Morningstar DBRS
Fecha
Largo Plazo
Corto plazo
Perspectiva
16.12.2025 10.06.2026 08.07.2026 17.02.2026
ABaa1 AA (low )
A-2 A2 F2 R-1 (low )
Positiva Estable Estable Estable
(1) Copyright by Standard & Poor’s, A division of the M cGraw-Hill Companies, Inc. Reproduced with permission of Standard & Poor’s. (2) El rating a corto plazo corresponde a los depósitos.
El grupo mantiene la categoría de grado de inversión (investment grade, por su denominación en inglés) por parte de todas las agencias de rating que lo califican. Con fecha 16 de diciembre de 2025 S&P Global Ratings mejoró la perspectiva desde estable a positiva, afirmando el rating de crédito del emisor a largo y corto plazo en 'A-/A-2' respectivamente. La mejora de la perspectiva reflejaba la posibilidad de que S&P Global Ratings mejore el rating de Banco Sabadell en el caso de que la entidad alcance y mantenga un colchón suficiente de instrumentos subordinados con capacidad de absorción de pérdidas (que supere el 6%), de manera que, en un escenario de resolución, ofrezca protección adicional a los bonistas de deuda senior. Con fecha 10 de junio de 2026, Moody’s Ratings confirmó la calificación de los depósitos de Banco Sabadell en 'A2'/'Prime-1' y la calificación de la deuda senior unsecured en 'Baa1'. La perspectiva de los depósitos a largo plazo fue mejorada de estable a positiva, mientras que la perspectiva de la deuda senior unsecured se mantuvo estable. La perspectiva positiva de los depósitos a largo plazo refleja la expectativa de Moody’s de que la calidad de los activos del Banco continuará mejorando, con la ratio de activos problemáticos (NPA) descendiendo por debajo del 3% durante el periodo de revisión de la perspectiva. La perspectiva positiva también incorpora una rentabilidad estable con un margen de intereses retomando el crecimiento trimestral en el segundo trimestre de 2026.
Con fecha 8 de julio de 2026 Fitch Ratings confirmó el rating a largo plazo de Banco Sabadell en 'A-' con perspectiva estable. En opinión de Fitch, la estrategia del Banco para el período 2025-2027 se está ejecutando correctamente, lo que está dando lugar a un aumento sostenible de los volúmenes de negocio y de los beneficios. Esto se ve favorecido por el entorno de crecimiento económico en España y por unas menores provisiones, derivadas de la mejora de la calidad de los activos. Las calificaciones también tienen en consideración la amplia solvencia del Banco. El rating a corto plazo se mantuvo en ‘F2'. Con fecha 17 de febrero de 2026, Morningstar DBRS confirmó el rating a largo plazo de Banco Sabadell en 'A (low)' con perspectiva estable, reflejando la mejora de la rentabilidad, la cual se ve beneficiada por unos tipos de interés más elevados, el crecimiento del crédito, la disciplina de costes y el descenso del coste del riesgo. Asimismo, la agencia destaca la amplia posición de capital, liquidez y la diversificación de la estructura de financiación. El rating a corto plazo se mantuvo en 'R-1 (low)'.
Segundo trimestre de 2026
24
Resultados por unidades de negocio por oficinas especializadas. El resto de empresas, que incluyen pymes, negocios y autónomos, se gestionan desde las oficinas. Tanto unas como otras cuentan con gestores especializados en el segmento, así como con el asesoramiento experto de especialistas de producto y/o sector. Todo ello permite a Banco Sabadell ser un referente para todas las empresas y líder en experiencia cliente. También se incluye Banca Privada que ofrece un asesoramiento personalizado y experto, respaldado con la capacidad de producto especialista y de alto valor para nuestros clientes.
Se presenta en este apartado información de los resultados y otros indicadores por unidades de negocio del grupo. Los criterios con los que grupo Banco Sabadell informa de los resultados por segmentos son: − −
Dos áreas geográficas: Negocio Bancario España y México. Tanto al Negocio bancario España como a México se le asigna un 13% de capital sobre sus activos ponderados por riesgo, asignando todas las deducciones correspondientes a cada unidad de negocio y el exceso de fondos propios se asigna al Negocio Bancario España.
•
Banca Corporativa: A través de su presencia tanto en el territorio español como internacional en 11 países más, ofrece soluciones financieras y de asesoramiento a grandes corporaciones e instituciones financieras españolas e internacionales. Estructura su actividad en dos ejes: el eje cliente, cuyo objetivo es dar servicio a sus clientes naturales en todo el espectro de sus necesidades financieras, delimitado por el carácter de los mismos y que integra a las grandes corporaciones de Banca Corporativa; las instituciones financieras, la Banca Privada en USA, y el negocio de capital riesgo desarrollado a través de BS Capital y, en segundo lugar, el ámbito de los Negocios Especializados, que agrupa las actividades de Financiación Estructurada, Tesorería, Banca de Inversión y Contratación, Custodia y Análisis, cuyo objetivo es el asesoramiento, diseño y ejecución de operaciones a medida, que anticipen las necesidades financieras específicas de sus clientes, sean empresas o particulares, extendiendo su ámbito desde las grandes corporaciones a compañías y clientes de menor tamaño, en la medida en que sus soluciones constituyen la mejor respuesta a unas necesidades financieras cada vez más complejas.
−
Negocio bancario México: Ofrece servicios bancarios y financieros de Banca Corporativa, Banca Comercial y Banca de Particulares en México.
−
Destacar que, durante los cuatro primeros meses del ejercicio, el Grupo ha contado con la contribución del negocio bancario en Reino Unido a través de la franquicia TSB, que integraba la actividad desarrollada en dicho mercado, incluyendo cuentas corrientes y de ahorro, crédito, tarjetas e hipotecas. La aportación neta de este negocio se presenta de forma agregada en una línea específica de la cuenta de resultados.
En lo referente al resto de criterios aplicados, la información por segmentos se estructura, en primer lugar, siguiendo una distribución geográfica y, en segundo lugar, en función de los clientes a los que van dirigidos. Segmentación por área geográfica y unidades de negocio −
Negocio bancario España, agrupa las unidades de negocio de Particulares, Empresas y Banca Corporativa, donde Particulares y Empresas se gestionan bajo la misma Red Comercial:
•
Banca Particulares: Es la unidad de negocio que ofrece productos y servicios financieros a personas físicas con destino particular. El negocio se basa en un modelo de banca que combina procesos de un banco digital para las interacciones que demandan autonomía, inmediatez y sencillez que ofrecen los canales digitales con una gestión comercial especializada y personalizada para aquellas interacciones en las que se demanda el acompañamiento experto, a través de la red comercial, tanto en las propias oficinas como a distancia. Entre los principales productos comercializados, destacan productos de inversión y financiación a corto, medio y largo plazo tales como préstamos al consumo, hipotecas y servicios de leasing o renting. Desde el punto de vista de los recursos, los principales productos ofrecidos son los depósitos y cuentas a la vista de los clientes, seguros de ahorro, fondos de inversión y planes de pensiones. Adicionalmente, entre los principales servicios también se encuentran los medios de pago como tarjetas y los productos de seguros en sus distintas modalidades.
•
Banca Empresas: Ofrece productos y servicios financieros a personas jurídicas y personas físicas con destino empresarial, atendiendo a todo tipo de empresas con facturación hasta 200 millones de euros, así como al sector institucional. Los productos y servicios que se ofrecen para las empresas se basan en soluciones de financiación para corto y largo plazo, soluciones para la gestión del excedente de tesorería, productos y servicios para garantizar la operativa diaria de cobros y pagos por cualquier canal y ámbito geográfico, así como productos de cobertura de riesgos y banca seguros. Banco Sabadell tiene claramente definido un modelo de relación para cada segmento de empresas, innovador y diferenciador de la competencia, que permite estar muy cerca del cliente adquiriendo un amplio conocimiento del mismo, ofreciendo al mismo tiempo un grado de compromiso total. Las grandes empresas se gestionan básicamente
La información que se presenta está basada en la contabilidad individual de cada una de las sociedades que forman el grupo, con las eliminaciones y los ajustes correspondientes de consolidación. Destacar que toda la información reportada hace referencia a información de gestión. Cada negocio soporta sus costes directos, obtenidos a partir de la contabilidad general.
Segundo trimestre de 2026
25
Cuenta de resultados 1S26 (en millones de € )
Margen de intereses
Negocio bancario España
Negocio bancario México
Total
1.673
101
1.774
Comisiones netas
629
14
643
Margen básico
2.302
115
2.417
13 65 -22
4 0 -14
17 65 -37
Margen bruto
2.358
105
2.463
Gastos de explotación Amortización Total costes
-979 -195 -1.174
-45 -8 -53
-1.025 -202 -1.227
Margen antes de dotaciones
1.184
52
1.236
-279 280
-7 0
-285 279
Resultados operaciones financieras y diferencias de cambio Resultados método participación y dividendos Otros productos y cargas de explotación
Total dotaciones y deterioros Plusvalías por venta de activos y otros resultados
Resultado antes de impuestos
1.185
45
1.230
Impuesto sobre beneficios Resultado atribuido a intereses minoritarios
-324 3
-11 0
-335 3
Beneficio neto Aportación neta TSB Beneficio neto con TSB
857 0 857
35 0 35
892 79 971
15,3% 49,8% 2,5% 69,2%
9,1% 50,3% 2,6% 59,2%
14,9% 49,8% 2,5% 68,7%
Negocio bancario España
Negocio bancario México
Total
1.810
ROTE Eficiencia (incluye costes no recurrentes) Ratio de morosidad Ratio de cobertura stage 3 con total provisiones
Cuenta de resultados 1S25 (en millones de € )
Margen de intereses
1.719
91
Comisiones netas
637
12
649
Margen básico
2.355
104
2.459
14 102 -29
2 0 -13
16 102 -43
Resultados operaciones financieras y diferencias de cambio Resultados método participación y dividendos Otros productos y cargas de explotación
Margen bruto
2.442
92
2.534
Gastos de explotación Amortización Total costes
-870 -167 -1.038
-41 -7 -48
-911 -175 -1.085
Margen antes de dotaciones
1.404
44
1.449
-241 -12
0 0
-241 -12
Total dotaciones y deterioros Plusvalías por venta de activos y otros resultados
Resultado antes de impuestos
1.151
45
1.195
Impuesto sobre beneficios Resultado atribuido a intereses minoritarios
-382 1
-8 0
-390 1
Beneficio neto Aportación neta TSB Beneficio neto con TSB
767 0 767
37 0 37
804 171 975
15,5% 42,5% 2,8% 68,8%
11,2% 51,9% 2,2% 66,4%
15,3% 42,8% 2,8% 68,8%
Negocio bancario España
Negocio bancario México
Total
Total activo
191.720
7.364
199.084
Inversión crediticia bruta viva Exposición inmobiliaria
119.753 413
5.431 0
125.184 413
Total pasivo y patrimonio neto
191.720
7.364
199.084
Recursos de clientes en balance Financiación mayorista mercado capitales Fondos propios asignados
130.021 20.216 11.587
3.359 0 794
133.380 20.216 12.381
Recursos de clientes fuera de balance
54.726
0
54.726
Negocio bancario España
Negocio bancario México
Negocio bancario Reino Unido
Total
Total activo
192.914
6.329
53.130
252.373
Inversión crediticia bruta viva Exposición inmobiliaria
114.396 467
4.314 0
42.097 0
160.806 467
Total pasivo y patrimonio neto
192.914
6.329
53.130
252.373
Recursos de clientes en balance Financiación mayorista mercado capitales Fondos propios asignados
124.356 21.039 11.734
3.048 0 771
40.825 6.286 2.491
168.229 27.325 14.996
Recursos de clientes fuera de balance
49.318
0
0
49.318
ROTE Eficiencia Ratio de morosidad Ratio de cobertura stage 3 con total provisiones
Balance 1S26 (en millones de € )
Balance 1S25 (en millones de € )
Segundo trimestre de 2026
26
Negocio bancario España El beneficio neto a cierre de junio de 2026 se sitúa en 857 millones de euros, incrementando así en un 11,7% interanual. Destacar que este beneficio incorpora los 201 millones de euros netos de impactos no recurrentes mencionados anteriormente, por lo que, aislando este efecto, el beneficio neto presenta una reducción del -14,5%.
seguros, afectada por la volatilidad del mercado. Adicionalmente se ve influenciada por el registro de resultados positivos en el primer semestre de 2025 procedentes de participadas de BS Capital. El total de costes incorpora ‑88 millones de euros de costes no recurrentes por iniciativas de eficiencia relacionadas con prejubilaciones. Los costes recurrentes presentan un aumento del 4,7% interanual, destacando el incremento de las amortizaciones, impactadas por la reclasificación desde la línea de dotaciones de gastos asociados a activos del negocio de pagos (Paycomet) en el cuarto trimestre de 2025. Aislando este impacto, los costes recurrentes incrementan un 3,5% interanual.
El margen de intereses asciende a 1.673 millones de euros a cierre de junio de 2026, representando una reducción del -2,7% interanual derivada principalmente del menor rendimiento del crédito y de la disminución de la aportación de la liquidez. Estos impactos se ven parcialmente compensados por la evolución positiva de los volúmenes, el menor coste de los recursos y de la financiación en los mercados de capitales, así como por la mayor contribución de la cartera de renta fija.
En el epígrafe de plusvalías por ventas de activos y otros resultados se registran principalmente 331 millones de euros brutos relacionados con la venta de TSB. Adicionalmente se contabilizan -45 millones de euros brutos/netos relacionados con la venta de una participación accionarial, así como -2 millones de euros brutos derivados de iniciativas de eficiencia en España, relacionados con el cierre de oficinas.
Las comisiones netas se sitúan en 629 millones de euros, un -1,2% por debajo del cierre de junio del año anterior, explicada principalmente por la menor contribución de las comisiones de servicios. Los resultados por el método de la participación y dividendos muestran una reducción interanual principalmente por la menor aportación del negocio de
Evolutivo Sim ple (en millones de € )
1S25
1S26
YoY (%)
1T25
2T25
3T25
4T25
1T26
2T26
Margen de intereses
1.719
1.673
-2,7
857
862
850
843
825
848
Comisiones netas
637
629
-1,2
318
318
309
322
308
320
Margen básico
2.355
2.302
-2,3
1.175
1.180
1.158
1.166
1.133
1.169
Resultados operaciones financieras y diferencias de cambio
14
13
-9,8
25
-11
-29
-7
-3
16
Resultados método participación y dividendos
102
65
-36,0
61
41
34
45
24
41
Otros productos y cargas de explotación
-29
-22
-23,9
-23
-6
-5
-48
-10
-12
Margen bruto
2.442
2.358
-3,5
1.238
1.204
1.158
1.156
1.144
1.214
Gastos de explotación
-870
-979
12,5
-444
-426
-448
-466
-501
-478
Amortización
-167
-195
16,4
-82
-85
-87
-116
-96
-98
Total costes
-1.038
-1.174
13,1
-526
-512
-535
-581
-597
-577
Margen antes de dotaciones
1.404
1.184
-15,7
712
692
622
575
546
637
-241
-279
15,5
-129
-112
-124
-107
-130
-149
Total dotaciones y deterioros Plusvalías por venta de activos y otros resultados
-12
280
--
-12
-1
-1
-20
0
280
1.151
1.185
2,9
572
579
497
447
416
768
-382
-324
-15,2
-196
-186
-166
-151
-147
-177
1
3
184,9
0
1
0
1
2
1
767
857
11,7
375
392
331
296
267
590
ROTE
15,5%
15,3%
15,3%
15,5%
15,2%
14,4%
13,6%
15,3%
Eficiencia (incluye costes no recurrentes)
42,5%
49,8%
42,5%
42,5%
43,7%
45,3%
52,2%
49,8%
Ratio de morosidad
2,8%
2,5%
3,1%
2,8%
2,8%
2,7%
2,6%
2,5%
Ratio de cobertura stage 3 con total provisiones
68,8%
69,2%
67,3%
68,8%
69,3%
69,9%
71,2%
69,2%
Resultado antes de impuestos Impuesto sobre beneficios Resultado atribuido a intereses minoritarios
Beneficio neto Ratios acumulados
Los recursos de clientes en balance incrementan un 4,6% interanual. Los recursos fuera de balance crecen un 11,0%, destacando los fondos de inversión, apoyados en suscripciones netas positivas, así como la favorable evolución de la actividad de gestión de patrimonios y de los seguros comercializados.
La inversión crediticia bruta viva incrementa un 4,7% interanual, creciendo en todos los segmentos.
Evolutivo Sim ple (en millones de € )
Jun 25
Jun 26
YoY (%)
Mar 25
Jun 25
Sep 25
Dic 25
Mar 26
Jun 26
Total activo
192.914
191.720
-0,6
188.073
192.914
185.879
186.300
189.606
191.720
Inversión crediticia bruta viva
114.396
119.753
4,7
110.768
114.396
115.500
114.669
116.298
119.753
467
413
-11,5
484
467
457
434
420
413
Total pasivo y patrimonio neto
192.914
191.720
-0,6
188.073
192.914
185.879
186.300
189.606
191.720
Recursos de clientes en balance
124.356
130.021
4,6
123.602
124.356
124.396
128.598
129.052
130.021
Financiación mayorista mercado capitales Fondos propios asignados
21.039 11.734 0 49.318
20.216 11.587 0 54.726
-3,9 -1,3
20.481 11.952
21.039 11.734
19.439 11.475
19.531 11.375
18.522 11.345
20.216 11.587
11,0
47.591
49.318
51.670
52.656
52.529
54.726
Empleados
13.638
13.348
13.594
13.638
13.660
13.617
13.450
13.348
Oficinas
1.153
1.104
1.153
1.153
1.151
1.149
1.150
1.104
Exposición inmobiliaria
Recursos de clientes fuera de balance Otros datos
Segundo trimestre de 2026
27
Negocio bancario México El beneficio neto a cierre del primer semestre de 2026 se sitúa en 35 millones de euros, lo que representa una reducción interanual como consecuencia del incremento de los costes y del mayor nivel de dotaciones dado que el primer semestre de 2025 incluía liberaciones asociadas a acreditados singulares.
Las comisiones netas se sitúan en 14 millones de euros a cierre de junio de 2026, presentando un crecimiento del 7,7% interanual a tipo de cambio constante por una mayor actividad del negocio. El total de costes asciende a -53 millones de euros, lo que supone un incremento interanual del 3,1% a tipo de cambio constante, derivado principalmente de mayores gastos generales.
El margen de intereses se sitúa en 101 millones de euros, creciendo un 10,7% interanual favorecido por la apreciación del peso mexicano. A tipo de cambio constante, presenta un incremento del 3,4% derivado principalmente de un mayor volumen de crédito y un menor coste de los recursos.
(en millones de € )
Margen de intereses
Las dotaciones y deterioros presentan un incremento interanual, debido a que el ejercicio anterior incorporaba liberaciones asociadas a acreditados singulares. Evolutivo Sim ple
1S25
1S26
YoY (%)
YoY (%) a tipo constante
1T25
2T25
3T25
4T25
1T26
2T26
91
101
10,7
3,4
47
44
50
52
47
54
Comisiones netas
12
14
15,3
7,7
4
8
5
10
7
7
Margen básico
104
115
11,3
3,9
51
53
55
62
54
61
Resultados operaciones financieras y diferencias de cambio
2
4
118,4
104,0
0
2
-2
3
4
0
Resultados método participación y dividendos
0
0
--
--
0
0
0
0
0
0
Otros productos y cargas de explotación
-13
-14
8,2
1,1
-7
-7
-7
-7
-7
-7
92
105
13,9
6,4
45
48
46
57
52
53
-41
-45
11,4
4,0
-20
-20
-22
-20
-22
-23
Margen bruto Gastos de explotación Amortización
-7
-8
4,7
-2,2
-4
-4
-4
-3
-4
-4
Total costes
-48
-53
10,4
3,1
-24
-24
-26
-24
-26
-27
Margen antes de dotaciones
44
52
17,8
10,0
21
24
21
33
25
27
Total dotaciones y deterioros
0
-7
--
--
2
-2
-1
-17
-3
-3
Plusvalías por venta de activos y otros resultados
0
0
--
--
0
0
-3
0
0
0
Resultado antes de impuestos
45
45
2,1
-4,7
22
22
16
16
22
24
Impuesto sobre beneficios
-8
-11
41,7
32,3
-3
-4
-3
-2
-5
-6
Resultado atribuido a intereses minoritarios
0
0
--
--
0
0
0
0
0
0
37
35
-6,2
-12,4
19
18
13
14
17
18
Beneficio neto Ratios acumulados ROTE
11,2%
9,1%
11,0%
11,2%
10,6%
10,0%
9,2%
9,1%
Eficiencia
51,9%
50,3%
53,8%
51,9%
53,0%
49,8%
50,6%
50,3%
Ratio de morosidad
2,2%
2,6%
2,4%
2,2%
1,9%
2,7%
2,5%
2,6%
Ratio de cobertura stage 3 con total provisiones
66,4%
59,2%
61,6%
66,4%
70,8%
59,8%
60,9%
59,2%
La inversión crediticia viva presenta un incremento del 17,4% interanual a tipo de cambio constante.
(en millones de € )
Total activo
Los recursos de clientes en balance incrementan un 0,5% a tipo de cambio constante.
Jun 25
Jun 26
YoY (%)
6.329
7.364
Evolutivo Sim ple
YoY (%) a tipo constante
Mar 25
Jun 25
Sep 25
Dic 25
Mar 26
Jun 26
6.558
6.329
6.561
7.208
7.230
7.364
16,4
7,6
Inversión crediticia bruta viva
4.314
5.431
25,9
17,4
4.358
4.314
4.603
4.946
5.288
5.431
Total pasivo y patrimonio neto
6.329
7.364
16,4
7,6
6.558
6.329
6.561
7.208
7.230
7.364
Recursos de clientes en balance
3.048
3.359
10,2
0,5
3.244
3.048
3.264
3.439
3.186
3.359
771
794
3,0
-7,2
717
771
757
768
793
794
Empleados
501
494
513
501
508
500
493
494
Oficinas
12
12
12
12
12
12
12
12
Fondos propios asignados Otros datos
Nota: El tipo de cambio EUR/MXN acumulado a 30.06.26 aplicado en la cuenta de resultados es de 20,382 (el aplicado a 30.06.25 fue de 21,822) y en el caso del balance, el tipo de cambio aplicado es de 19,903 (el aplicado a 30.06.25 fue de 22,089) para el peso mexicano. En balance el tipo de cambio EUR/USD es del 1,139 a 30.06.26 (el aplicado a 30.06.25 fue de 1,172).
Segundo trimestre de 2026
28
- La acción 30.06.25
31.03.26
30.06.26
Acciones y contratación Número de acciones en circulación menos la autocartera (en millones)
(1)
5.120
4.920
4.781
Contratación media diaria (millones de € )
(2 )
42
55
63
Valor de cotización (€ )
(3 )
Inicio del año
1,877
3,365
3,365
Máxima del año
2,849
3,484
3,520
Mínima del año
1,795
2,893
2,788
Cierre del periodo
2,703
3,043
3,099
Capitalización bursátil (millones € )
13.839
14.971
14.816
0,34
0,29
0,32
Valor contable (millones € )
14.996
14.664
12.381
Valor contable por acción (€ )
2,93
2,98
2,59
12.440
12.037
9.976
Valor contable tangible por acción (€ ) Valor de cotización sobre el valor contable tangible
2,43 1,11
2,45 1,24
2,09 1,49
Price-to-earnings ratio
7,93
10,46
9,62
Ratios bursátiles Beneficio neto atribuido por acción (BPA) (€ )
Valor contable tangible (millones € )
(1) (2) (3)
Número de acciones totales deduciendo la posición final de la autocartera (incluyendo programa de recompra si aplica). Según datos de BME (Bolsas y Mercados Españoles). Sin ajustar los valores históricos.
Evolución comparativa de la acción SAB (*) Período del 30.06.25 al 30.06.26
SAB 06/25
(1)
08/25
IBEX 35
Europe Banks (1)
10/25
12/25
02/26
STOXX Europe 50 04/26
06/26
STOXX Europe 600 Banks
(*) El 29.05.26 se distribuyó un dividendo extraordinario en efectivo por importe de 50 céntimos de euro (brutos) por acción relacionado con la venta de TSB.
Segundo trimestre de 2026
29
- Glosario de términos sobre medidas del rendimiento Conciliación de la información contable del grupo A continuación, se presenta la cuenta de pérdidas y ganancias y el balance de situación contable del grupo así como la conciliación entre la cuenta de pérdidas y ganancias contable y la cuenta de resultados de gestión, que es la que se muestra a lo largo de este informe. Las principales diferencias son:
- El tratamiento de los resultados generados por TSB y sus entidades dependientes tras el acuerdo de venta alcanzado en la Junta General Extraordinaria de Accionistas el 6 de agosto de 2025. Es decir, en la cuenta de resultados de gestión, los resultados de TSB y sus entidades dependientes se han registrado de forma desagregada y epígrafe a epígrafe, tal como se venía haciendo en los informes trimestrales previos, aunque se muestra su aportación neta en una sola línea de la cuenta de resultados, mientras que el tratamiento en la cuenta de pérdidas y ganancias contable, de acuerdo a la normativa contable de aplicación, se presentan en un único epígrafe “resultados de actividades interrumpidas”. A tener en cuenta que la cuenta de resultados contable de periodos anteriores se ha reexpresado a efectos comparativos. Adicionalmente, en el balance consolidado contable del Grupo, los activos y pasivos relacionados con la venta de TSB y sus entidades dependientes se agrupan bajo las
líneas “activos no corrientes y grupos enajenables de elementos clasificados como mantenidos para la venta” y “pasivos incluidos en grupos enajenables de elementos clasificados como mantenidos para la venta”. Esta clasificación aplica exclusivamente a los balances posteriores a 1 de julio de 2025, sin afectar a balances anteriores.
- Tras la resolución, en octubre de 2025, del acuerdo firmado con Nexi S.p.A. - que incluía la venta de la filial Paycomet - el Grupo, de acuerdo con la normativa contable aplicable, dejó de clasificar los activos y pasivos de dicha filial como no corrientes mantenidos para la venta. En consecuencia, volvió a aplicar las políticas contables y criterios de valoración vigentes antes de la firma del acuerdo. La modificación más relevante consistió en reclasificar los gastos por amortización de los activos de Paycomet (principalmente TPVs) desde el epígrafe “Otras dotaciones y deterioros” a “Costes”. A nivel contable, se ha reexpresado la información comparativa del ejercicio 2025, mientras que, en términos de gestión, no se han reexpresado los periodos anteriores.
Cuenta de pérdidas y ganancias acumulada contable (en millones de € )
1S25
1S26
YoY (%)
Margen de intereses
-1,3
1.774
1.751
Comisiones netas
649
643
-0,9
Margen básico
2.423
2.394
-1,2
24 102 -43
9 65 -37
-62,5 -36,0 -13,9
Margen bruto
2.506
2.432
-3,0
Gastos de explotación Amortización Total costes
-914 -202 -1.117
-1.024 -214 -1.238
12,1 5,6 10,9
Margen antes de dotaciones
1.390
1.194
-14,1
-179 -21 -29 -12
-257 -34 6 -131
43,9 59,1
-32,3
Resultados operaciones financieras y diferencias de cambio Resultados método participación y dividendos Otros productos y cargas de explotación
Dotaciones para insolvencias Dotaciones a otros activos financieros Otras dotaciones y deterioros Plusvalías por venta de activos y otros resultados
Resultado antes de impuestos
1.148
778
Impuesto sobre beneficios
-373
-311
-16,8
Resultado de las actividades continuadas
775
467
-39,7
Resultado de las actividades interrumpidas Resultado atribuido a intereses minoritarios
201 1
506 3
151,7 184,9
Beneficio neto con TSB
975
971
-0,5
Segundo trimestre de 2026
30
Cuenta de pérdidas y ganancias trimestral contable (en millo nes de €)
Margen de intereses
2T25 889
3T25 883
4T25 880
1T26 855
2T26 896
QoQ (% ) 4,8
Co misio nes netas
327
314
332
315
328
4,0
Margen básico
1.215
1.196
1.212
1.170
1.224
4,6
Resultado s o peracio nes financieras y diferencias de cambio
-8
-27
-4
-1
10
--
Resultado s méto do participació n y dividendo s
41
34
45
24
41
72,8
Otro s pro ducto s y cargas de explo tació n
-13
-11
-56
-17
-20
15,9
1.236
1.192
1.199
1.176
1.256
6,8
Gasto s de explo tació n
-448
-471
-482
-523
-501
-4,3
A mo rtizació n
-103
-106
-113
-109
-105
-3,6
To tal co stes
-551
-577
-595
-632
-606
-4,2
Margen antes de dotaciones
684
615
604
544
650
19,6
Do tacio nes para inso lvencias
-92
-117
-130
-120
-137
14,3
Do tacio nes a o tro s activo s financiero s
-5
-3
-14
-18
-15
-18,0
Otras do tacio nes y deterio ro s
-10
0
2
5
0
-100,0
P lusvalías po r venta de activo s y o tro s resultado s
-1
-4
-20
0
-130
--
576
490
441
410
368
-10,3
Margen bruto
Resultado antes de im puestos Impuesto so bre beneficio s
-186
-161
-151
-144
-166
15,2
Resultado de las actividades continuadas
390
330
289
266
202
-24,2
Resultado de las actividades interrumpidas
97
85
97
83
424
--
Resultado atribuido a intereses mino ritario s
1
0
1
2
1
-45,6
486
414
386
347
624
80,0
Beneficio neto con TSB
Conciliación Contable – Gestión cuenta de pérdidas y ganancias acumulada 2026
(en millones de € )
Margen de intereses
Resultados contables
1S26 Ajustes relacionados con la venta de TSB
Resultados gestión
2.188
1.751
436
Comisiones netas
643
26
668
Margen básico
2.394
462
2.856
Resultados operaciones financieras y diferencias de cambio
9
15
24
Resultados método participación y dividendos
65
0
65
Otros productos y cargas de explotación
-37
-32
-69
2.432
444
2.876
-1.024
-242
-1.266
-214
-28
-242
Total costes
-1.238
-270
-1.508
Margen antes de dotaciones
Margen bruto Gastos de explotación Amortización
1.194
174
1.368
Dotaciones para insolvencias
-257
-24
-282
Dotaciones a otros activos financieros
-34
0
-34
6
0
6
-131
410
279
Resultado antes de impuestos
778
560
1.338
Impuesto sobre beneficios
-311
-53
-364
Resultado de las actividades continuadas
467
506
974
Resultado de las actividades interrumpidas
506
-506
0
Resultado atribuido a intereses minoritarios
3
0
3
971
0
971
Otras dotaciones y deterioros Plusvalías por venta de activos y otros resultados
Beneficio neto con TSB
Segundo trimestre de 2026
31
Conciliación Contable – Gestión cuenta de pérdidas y ganancias acumulada 2025
(en millones de € )
Margen de intereses
Resultados contables
1S25 Ajustes relacionados con Ajustes relacionados la venta de TSB con Paycom et
Resultados gestión
1.774
651
0
Comisiones netas
649
46
0
694
Margen básico
2.423
697
0
3.119
Resultados operaciones financieras y diferencias de cambio
24
4
0
29
Resultados método participación y dividendos
102
0
0
102
Otros productos y cargas de explotación
2.425
-43
7
0
-35
2.506
708
0
3.214
Gastos de explotación
-914
-367
3
-1.278
Amortización
-202
-39
9
-232
Total costes
-1.117
-406
12
-1.510
Margen antes de dotaciones
Margen bruto
1.390
302
12
1.704
Dotaciones para insolvencias
-179
-22
0
-201
Dotaciones a otros activos financieros
-21
2
0
-20
Otras dotaciones y deterioros
-29
0
-12
-41
Plusvalías por venta de activos y otros resultados
-12
1
0
-12
1.148
282
0
1.431
Resultado antes de impuestos Impuesto sobre beneficios
-373
-81
0
-454
Resultado de las actividades continuadas
775
201
0
976
Resultado de las actividades interrumpidas
201
-201
0
0
Resultado atribuido a intereses minoritarios
1
0
0
1
975
0
0
975
Beneficio neto con TSB
Balance de situación contable (en millo nes de €)
V a ria c ió n Y o Y ( %) Q o Q ( %)
3 0 .0 6 .2 5
3 1.0 3 .2 6
3 0 .0 6 .2 6
26.359 3.927 6.473 201.367 162.479 11.488 27.400 455 2.071 2.565 597 8.558
9.545 4.574 5.645 165.311 122.660 13.422 29.229 430 1.707 2.479 52.723 6.479
5.460 5.701 5.766 170.629 126.308 15.058 29.264 468 1.671 2.406 414 6.569
-79,3 45,2 -10,9 -15,3 -22,3 31,1 6,8 2,8 -19,3 -6,2 -30,6 -23,2
-42,8 24,6 2,1 3,2 3,0 12,2 0,1 8,7 -2,1 -3,0 -99,2 1,4
252.373
248.893
199.084
-21,1
-20,0
2.068 233.817 695 13.518 183.408 28.002 8.194 437 0 1.561
1.531 183.867 435 18.224 140.268 20.119 4.820 346 48.203 929
1.815 183.639 440 18.247 137.168 20.889 6.896 346 0 1.109
-12,2 -21,5 -36,7 35,0 -25,2 -25,4 -15,8 -20,8 --29,0
18,5 -0,1 1,1 0,1 -2,2 3,8 43,1 -0,1 -100,0 19,4
237.882
234.876
186.909
-21,4
-20,4
14.996 -541 36
14.664 -683 37
12.381 -244 38
-17,4 -54,9 6,2
-15,6 -64,2 3,0
Patrimonio neto
14.491
14.017
12.175
-16,0
-13,1
Total pasivo y patrimonio neto
252.373
248.893
199.084
-21,1
-20,0
Garantías financieras co ncedidas Co mpro miso s de préstamo s co ncedido s Otro s co mpro miso s co ncedido s
1.888 27.109 8.901
1.907 27.938 9.349
1.896 21.939 8.587
0,5 -19,1 -3,5
-0,6 -21,5 -8,1
Efectivo , saldo s en efectivo en banco s centrales y o tro s depó sito s a la vista A ctivo s financiero s mantenido s para nego ciar y a valo r razo nable co n cambio s en resultado s A ctivo s financiero s a valo r razo nable co n cambio s en o tro resultado glo bal A ctivo s financiero s a co ste amo rtizado P réstamo s y anticipo s a la clientela P réstamo s y anticipo s a banco s centrales y entidades de crédito Valo res representativo s de deuda Inversio nes en nego cio s co njunto s y aso ciadas A ctivo s tangibles A ctivo s intangibles A ctivo s no co rrientes y grupo s enajenables clasificado s co mo mantenido s para la venta Otro s activo s
Total activo P asivo s financiero s mantenido s para nego ciar y a valo r razo nable co n cambio s en resultado s P asivo s financiero s a co ste amo rtizado Depó sito s de banco s centrales Depó sito s de entidades de crédito Depó sito s de la clientela Valo res representativo s de deuda emitido s Otro s pasivo s financiero s P ro visio nes P asivo s incluido s en grupo s enajenables clasificado s co mo mantenido s para la venta Otro s pasivo s
Total pasivo Fo ndo s pro pio s Otro resultado glo bal acumulado Intereses de mino ritario s
Segundo trimestre de 2026
32
Medidas alternativas del rendimiento (MARs) El grupo en la presentación de sus resultados al mercado y para el seguimiento del negocio y toma de decisiones utiliza medidas del rendimiento de acuerdo con la normativa contable generalmente aceptada (NIIF-UE) y también utiliza otras medidas no auditadas comúnmente utilizadas en el sector bancario (Medidas alternativas de rendimiento o “MARs”), como indicadores de seguimiento de la gestión de los activos y pasivos, y de la situación financiera y económica del grupo, lo que facilita su comparabilidad con otras entidades.
Siguiendo las directrices de ESMA sobre las MARs (ESMA/2015/1415es de octubre 2015), cuya finalidad es promover la utilidad y transparencia de la información para la protección a los inversores en la Unión Europea, el grupo presenta a continuación para cada MARs la conciliación con las partidas presentadas en los estados financieros (en cada uno de los apartados del informe) y su definición y cálculo.
Definición y cálculo ROA
Resultado consolidado del ejercicio (últimos 12 meses) / activos totales medios (últimos 12 meses). Beneficio atribuido al grupo (últimos 12 meses) / fondos propios medios (últimos 12 meses).
ROE
Página 6 6
Resultado consolidado del ejercicio (últimos 12 meses) / activos ponderados por riesgo medios (APR) (últimos 12 meses). Beneficio atribuido al grupo (últimos 12 meses) / fondos propios medios (últimos 12 meses). El denominador excluye el importe de los activos intangibles y el fondo de comercio de las participadas. () Gastos de administración y amortizaciones / margen bruto. Es la diferencia entre el rendimiento y los costes de los activos y pasivos relacionados con clientes. En su cálculo se considera la diferencia entre el tipo medio que el banco cobra por los créditos a sus clientes y el tipo medio que el banco paga por los depósitos de sus clientes. El tipo medio del crédito a clientes es el (*) porcentaje anualizado entre el ingreso financiero contable del crédito a clientes en relación al saldo medio () diario del crédito a clientes. El tipo medio de los recursos de clientes es el porcentaje anualizado entre los costes financieros contables de los recursos de clientes en relación al saldo medio diario de los recursos de clientes.
10
Coste del riesgo de crédito (pbs)
Su cálculo se compone de un cociente donde el numerador considera los últimos 12 meses de las dotaciones a insolvencias ajustando los costes asociados a la gestión de activos stage 3 y el denominador (**) incluye el promedio de los últimos 12 meses de: i) la inversión crediticia bruta de clientes, sin adquisiciones temporales de activos, y riesgos en stage 3 de entidades de crédito y ii) garantías financieras y otras garantías concedidas.
14
Coste del riesgo total (pbs)
Su cálculo se compone de un cociente donde el numerador considera los últimos 12 meses del total de dotaciones y deterioros y el denominador incluye el promedio de los últimos 12 meses de: i) la inversión (**) crediticia bruta de clientes, sin adquisiciones temporales de activos, y riesgos en stage 3 de entidades de crédito y ii) garantías financieras y otras garantías concedidas y iii) activos inmobiliarios problemáticos.
14
Ratio de cobertura stage 3 con total provisiones
Muestra el porcentaje de riesgos stage 3 que está cubierto por provisiones totales. Su cálculo se compone (**) del cociente entre las correcciones de valor por deterioro de activos del balance y las provisiones registradas en el pasivo del balance asociadas a exposiciones fuera de balance / total de riesgos stage 3.
19
Ratio de morosidad
Su cálculo se compone de un cociente donde en el numerador se incluyen los riesgos clasificados en el stage 3 y en denominador se incluyen: i) la inversión crediticia bruta de clientes, sin adquisiciones (**) temporales de activos, y riesgos en stage 3 de entidades de crédito y ii) garantías financieras y otras garantías concedidas.
19
Activos problemáticos
(**)
Los activos problemáticos son la suma de los riesgos clasificados en stage 3 y los activos inmobiliarios problemáticos.
20
Loan-to-deposit ratio
Préstamos y anticipos a la clientela excluyendo ATAs y créditos de mediación sobre recursos de clientes en balance. El denominador está formado por los pasivos financieros a coste amortizado excluyendo los (**) pasivos que no sean de naturaleza minorista tales como los depósitos de bancos centrales, los depósitos de entidades de crédito, las emisiones institucionales y otros pasivos financieros.
22
Beneficio neto atribuido por acción
Es el cociente del beneficio neto atribuido al grupo ajustado por el importe del cupón del Additional Tier I de los últimos 12 meses entre el número medio de acciones en circulación de los últimos 12 meses (número medio de acciones totales deduciendo la media de la autocartera, incluyendo los programas de recompra, si aplica).
29
Valor contable por acción
Es el cociente entre el valor contable / número de acciones en circulación (número de acciones totales deduciendo la posición final de autocartera, incluyendo los programas de recompra, si aplica) a fecha de cierre del período. Por valor contable se considera la suma de los fondos propios.
29
Es el cociente entre el valor contable tangible y el número de acciones en circulación (número de acciones totales deduciendo la posición final de autocartera, incluyendo los programas de recompra, si aplica) a fecha de cierre del período. Por valor contable tangible se considera la suma de los fondos propios y ajustado por los activos intangibles y el fondo de comercio de las participadas. Es el cociente entre el precio o valor de cotización de la acción / valor contable tangible por acción. Es el cociente entre el precio o valor de cotización de la acción / beneficio neto atribuible por acción.
29 29 29
RORWA ROTE Ratio de eficiencia (incluye costes no recurrentes)
Margen de clientes
Valor contable tangible por acción Valor de cotización sobre el valor contable tangible Price-to-earnings ratio
6 6 6
(*) Media aritmética calculada como la suma de los saldos diarios del periodo de referencia y dividida entre el número de días de dicho periodo. (**) Datos excluyendo la aportación de TSB.
Segundo trimestre de 2026
33
M e dida de re ndim ie nt o ROA
ROE
RORWA
ROTE
Ratio de eficiencia (incluye co stes no recurrentes)
M argen de clientes (*)
Co ste del riesgo de crédito (pbs)
Co ste del riesgo to tal (pbs)
C o nc ilia c ió n ( e xpre s a do e n m illo ne s de e uro s )
1S 2 5
2025
1S 2 6
Resultado co nso lidado del ejercicio (último s 12 meses) A ctivo s to tales medio s (último s 12 meses) R O A ( %) B eneficio atribuido al grupo (último s 12 meses) Fo ndo s pro pio s medio s (último s 12 meses) R O E ( %) Resultado co nso lidado del ejercicio (último s 12 meses) A ctivo s po nderado s po r riesgo medio s (A P R) (último s 12 meses) R O R WA ( %) B eneficio atribuido al grupo (último s 12 meses) Fo ndo s pro pio s medio s, sin activo s intangibles (último s 12 meses) R O T E ( %) To tal co stes M argen bruto R a t io de e f ic ie nc ia ( %) Crédito a la clientela (neto ) Resultado s Saldo medio Tipo medio anualizado % Depó sito s de la clientela Resultado s Saldo medio Tipo medio anualizado % M a rge n de c lie nt e s Do tacio nes para inso lvencias (último s 12 meses) Gasto s NP Ls (último s 12 meses) Inversió n crediticia bruta sin adquisició n tempo ral de activo s (último s 12 meses) Garantías financieras y o tras garantías co ncedidas (último s 12 meses)
1.917 244.922 0 ,8 1.915 15.039 12 ,7 1.917 79.740 2 ,4 1.915 12.523 15 ,3 -1.085 2.534 4 2 ,8
1.777 245.221 0 ,7 1.775 14.952 11,9 1.777 79.512 2 ,2 1.775 12.422 14 ,3 -2.251 4.951 4 5 ,5
1.775 238.586 0 ,7 1.771 14.419 12 ,3 1.775 77.577 2 ,2 9 1.771 11.870 14 ,9 -1.227 2.463 4 9 ,8
2.273 114.999 3,99
4.460 116.790 3,82
2.174 120.790 3,63
-587 126.208 -0,94 3 ,0 5 -400 -119 117.615 8.621
-1.076 126.734 -0,85 2 ,9 7 -426 -109 120.584 8.546
-511 132.395 -0,78 2 ,8 5 -504 -100 123.645 8.572
C o s t e de l rie s go de c ré dit o ( pbs ) To tal do tacio nes y deterio ro s (último s 12 meses) Inversió n crediticia bruta sin adquisició n tempo ral de activo s (último s 12 meses) Garantías financieras y o tras garantías co ncedidas (último s 12 meses)
22 -556 117.615 8.621
25 -491 120.584 8.546
31 -535 123.645 8.572
839
767
694
44 2.527 3.674 6 8 ,8 % 3.674 122.286 8.405 2 ,8 1% 3.674 773 4 .4 4 7 118.835 127.404 9 3 ,3 % 1.817 1.915 -98 5.330 0 ,3 4 14.996 5.120 2 ,9 3 12.440 14.996 2.556 5.120 2 ,4 3 2,703 2,43 1,11 2,703 0,34 7 ,9 3
38 2.425 3.491 6 9 ,5 % 3.491 123.114 8.540 2 ,6 5 % 3.491 684 4 .17 6 119.503 132.037 9 0 ,5 % 1.630 1.775 -146 5.152 0 ,3 2 14.631 4.998 2 ,9 3 11.988 14.631 2.642 4.998 2 ,4 0 3,365 2,40 1,4 0 3,365 0,32 10 ,6 4
40 2.330 3.390 6 8 ,7 % 3.390 128.606 8.757 2 ,4 7 % 3.390 636 4 .0 2 5 123.497 133.380 9 2 ,6 % 1.600 1.771 -171 4.965 0 ,3 2 12.381 4.781 2 ,5 9 9.976 12.381 2.406 4.781 2 ,0 9 3,099 2,09 1,4 9 3,099 0,32 9 ,6 2
A ctivo s inmo biliario s pro blemático s (último s 12 meses)
Ratio de co bertura stage 3 co n to tal pro visio nes (%)
Ratio de mo ro sidad (%)
A ctivo s pro blemático s
Lo an-to -depo sit ratio (%)
B eneficio neto atribuido po r acció n (B P A ) (€)
Valo r co ntable po r acció n (€)
Valo r co ntable tangible po r acció n (€)
Valo r de co tizació n so bre el valo r co ntable tangible
P rice-to -earnings ratio
C o s t e de l rie s go t o t a l ( pbs ) To tal pro visio nes Riesgo s stage 3 R a t io de c o be rt ura s t a ge 3 c o n t o t a l pro v is io ne s ( %) Riesgo s stage 3 Inversió n crediticia bruta sin adquisició n tempo ral de activo s Garantías financieras y o tras garantías co ncedidas R a t io de m o ro s ida d ( %) Riesgo s stage 3 A ctivo s inmo biliario s pro blemático s A c t iv o s pro ble m á t ic o s P réstamo s y anticipo s a la clientela sin A TA s ajustado s po r crédito s de mediació n Recurso s de clientes en balance Lo a n- t o - de po s it ra t io ( %) B eneficio atribuido al grupo ajustado B eneficio atribuido al grupo (último s 12 meses) A T1 (último s 12 meses) Número medio de accio nes en circulació n meno s la media de la auto cartera (en millo nes) B e ne f ic io ne t o a t ribuido po r a c c ió n ( B P A ) ( € ) Fo ndo s pro pio s Número de accio nes en circulació n meno s la auto cartera (en millo nes) V a lo r c o nt a ble po r a c c ió n ( € ) Valo r co ntable tangible (millo nes €) Fo ndo s pro pio s A ctivo s intangibles Número de accio nes en circulació n meno s la auto cartera (en millo nes) V a lo r c o nt a ble t a ngible po r a c c ió n ( € ) Valo r de co tizació n (€) Valo r co ntable tangible po r acció n (€) V a lo r de c o t iza c ió n s o bre e l v a lo r c o nt a ble t a ngible Valo r de co tizació n (€) B eneficio neto atribuido po r acció n (B P A ) (€) P ric e - t o - e a rnings ra t io
(*) El margen de clientes está calculado con datos acumulados. Ver listado, definición y finalidad de las MARs utilizadas a nivel grupo Banco Sabadell en: www.grupbancsabadell.com / ACCIONISTAS_E_INVERSORES / INFORMACION_ECONOMICO_FINANCIERA / MEDIDAS_ALTERNATIVAS_DEL_RENDIMIENTO
Segundo trimestre de 2026
34
Relación con accionistas e inversores Para información adicional contacte con:
Relación con Accionistas e Inversores [email protected] +34 91 3217373
Segundo trimestre de 2026
35
Banco Sabadell 2T · 2026
Resultados
24 de julio de 2026 1
Índice
- Consideraciones iniciales
pág. 3
- Aspectos clave del 2T26
pág. 6
- Resultados financieros
pág. 14
- Balance
pág. 23
- Consideraciones finales
pág. 27
2
Consideraciones iniciales 3
Un banco centrado en España, rentable, orientado al crecimiento y con una atractiva rentabilidad para el accionista Mayor foco en España, manteniendo una escala que nos proporciona agilidad
Nuestra plataforma e infraestructura tecnológica impulsan la próxima fase de transformación
Hemos recuperado el impulso comercial tras la finalización de la OPA hostil
El compromiso de nuestros empleados se encuentra en máximos históricos, reforzando nuestra cultura de ejecución
Ofrecemos una atractiva remuneración al accionista
4
Tenemos unas buenas perspectivas con claras oportunidades por delante
Compromiso con el cumplimiento de nuestros objetivos
RoTE % 14,5
Oportunidades para aflorar valor adicional para el banco
Aprovechando nuestra escala para ser más ágiles
RoTE recurrente
en 2026
Apalancarnos en la IA y la tecnología
RoTE % 16 en 2027
Incrementando nuestro foco en los clientes de mayor valor
5
Aspectos clave del 2T26 6
El inicio de una recuperación sostenida de los ingresos La actividad comercial continúa acelerándose
Crédito vivo
Recursos de clientes
+3,0% v.t.
+1,8% v.t.
Los ingresos del negocio bancario crecieron según lo previsto
Margen de intereses
Comisiones
+3,4% v.t.
+4,0% v.t.
Impactos no recurrentes
Ahorro de costes
en 2T26
20M€ en 2S26
Plan de prejubilaciones, totalmente ejecutado Cierre satisfactorio de la venta de TSB, con un negocio más enfocado y simple Elevada remuneración al accionista
-37M€
-92M€ en 1S26
Generación de capital
Dividendo extraordinario
405pbs
0,50€/acción en mayo 2026
• Dividendo extraordinario de 0,50€ por acción ya abonado • Programa de recompra de acciones de 800M€ ejecutado al 100%
• Nuevo programa de recompra de acciones de 331M€
La rentabilidad seguirá mejorando a lo largo del año y estamos en línea para cumplir con los objetivos de 2026
7
Cuenta resultados del 2T26: los ingresos del negocio bancario vuelven a crecer Cuenta resultados
2T26 (M€)
1S26 (M€)
2T26/1T26
1S26/1S25
Margen de intereses
902
1.774
+3,4%
-2,0%
Comisiones
328
643
+4,0%
-0,9%
% 13,6
Costes recurrentes totales
-570
-1.139
+0,3%
+4,9%
RoTE recurrente3
Provisiones
-152
-285
+14,4%
+18,3%
Beneficio neto recurrente
3591
6912
+8,4%
-14,1%
% 14,9 RoTE reportado
Beneficio neto (incl. TSB)
624
971
+80,0%
-0,5%
1 Beneficio neto recurrente 2T26 (359M€) = beneficio neto, incl. TSB (624M€) - contribución TSB (16M€) - impactos no recurrentes (249M€, ver detalle en diapositiva 15). 2 Beneficio neto recurrente 1S26 (691M€) = beneficio neto, incl. TSB (971M€) - contribución TSB (79M€) - impactos no recurrentes (201M€, ver detalle en
diapositiva 15) 3 Proforma desconsolidando TSB desde junio de 2025, lo que implica la distribución de un dividendo de 50 céntimos de euro por acción y la desconsolidación de los intangibles de TSB. No incluye la contribución de TSB al Grupo. Adicionalmente, excluye (neto de impuestos): -31M€ relacionados con la cobertura de tipo del cambio de los ingresos de la venta de TSB, -64M€ de costes no recurrentes asociados al programa de prejubilaciones en España en el 1S26, +322M€ de plusvalía por la venta de TSB y -45M€ vinculados a la venta de una participación accionarial.
8
El crédito vivo se acelera en el trimestre…
Crédito vivo por segmento MM€
Jun-26
% v.t.
Jun-26
% i.a. México
Hipotecas
40,2
+0,9%
+3,4%
Préstamos al consumo
5,6
+2,7%
+12,7%
Miami
+1,9%
Oficinas en el extranjero
Pymes y grandes empresas Sector público
45,7 12,5
+2,1% +7,9%
+8,2%
Otra financiación
3,0
+23,4%
-2,6%
Total España
107,1
+2,8%
+3,6%
TC constante
TC constante
TC constante
Total internacional TC constante
Total TC constante
5,4 7,7 5,0 18,1
125,2
% v.t.
% i.a.
+2,7%
+25,9%
-0,3%
+17,4%
+3,1%
+17,8%
+2,2%
+14,5%
+6,8%
+11,3%
+6,5%
+11,7%
+4,0%
+18,2%
+2,5%
+14,6%
+3,0%
+5,5%
+2,8%
+5,0%
9
… impulsado por la evolución positiva de la nueva producción en el trimestre Hipotecas
Préstamos al consumo
M€, nueva producción trimestral en España
M€, nueva producción trimestral en España
Pymes y grandes empresas
Pymes y grandes empresas
Préstamos y créditos
Circulante
M€, nueva producción trimestral en España
M€, nueva producción trimestral en España
-17% i.a.
-3% i.a.
+7% i.a.
-3% i.a.
+22% v.t.
+9% v.t.
+38% v.t.
+6% v.t.
6.288
5.884 1.817 1.242
2Q26 2T25
1Q26 1T26
8.120
8.644
4.568
1.516 750
2Q26 2T26
8.938
2T25 2Q25
668
728
1T26 1Q26
2T26 2Q26
2Q25 2T25
1Q26 1T26
2Q26 2T26
2Q25 2T25
1Q26 1T26
2Q26 2T26
10
Los recursos de clientes aumentan, manteniendo el coste de los depósitos contenido Total recursos de clientes M€
Jun-26
% v.t.
% i.a
Desglose de recursos en balance MM€
En balance Del que: España Fuera de balance
Total recursos de clientes
133.380
+0,9%
+4,7%
126.116
+0,9%
+4,8%
54.726
188.106
+4,2%
+1,8%
+11,0%
+6,4%
85,6 No remunerados 47,7 Remunerados Coste de los recursos de clientes 78pbs
133,4 Jun- 26 61pbs España +0 pbs v.t.
-10 pbs i.a.
11
La visibilidad sobre los resultados de 2026 respalda el objetivo de RoTE de 2027 Lo que dijimos
Crecimiento del crédito vivo de un dígito medio en 2026
Crecimiento de los recursos en balance del 3-4% en 2026 Punto de inflexión ya alcanzado en el margen de intereses y comisiones Disciplina de costes apoyada en medidas de eficiencia
Situación actual
+5,5%
M€
% i.a.
+4,7%
125
119
120
120
122
2Q25 2T25
3Q25 3T25
4Q25 4T25
1Q26 1T26
2Q26 2T26
132
132
134
4T25 4Q25
1T26 1Q26
2T26 2Q26
Tendencia al alza
M€
% i.a.
127
128
2T25 2Q25
3T25 3Q25
Tendencia al alza
M€
Margen recurrente a/a
698
652
622
618
660
Las mandíbulas seguirán ampliándose desde los niveles actuales
2Q25 3Q25 4Q25 1Q26 2Q26 2T25 3T25 4T25 1T26 2T26 Margen recurrente: margen de intereses + comisiones – costes recurrentes
La ampliación de las mandíbulas es la palanca clave para alcanzar un RoTE del 16% en 2027, y estamos avanzando según la senda prevista
12
Impulsando la creación de valor sostenible para el accionista… Evolución del número de acciones en circulación¹
Creación de valor para el accionista
(en millones)
(en €)
-15%
Reducción del nº de acciones
+12%
TACC 2022-26
Nuevo programa de recompra
1 Excluyendo la autocartera.
… combinando dividendos en efectivo y recompras de acciones
13
Resultados financieros 14
El beneficio neto 1S26 se vió impactado positivamente por 201M€ no recurrentes Impactos no recurrentes de Sabadell M€
Concepto Venta de TSB Cobertura de la divisa de los ingresos de la venta de TSB
Costes no recurrentes derivados del programa de prejubilaciones
Venta de una participación accionarial Total
Línea de la cuenta de resultados impactadas Plusvalía por venta de activos y otros resultados
2T26
1S26
Bruto
Neto
Bruto
Neto
331
316
331
316
ROF y diferencias de cambio
9
6
9
6
ROF y diferencias de cambio
-3
-2
-17
-12
Costes totales
-33
-23
-88
-61
Provisiones
-2
-1
-2
-1
-2
-2
-2
-2
-45
-45
-45
-45
Plusvalía por venta de activos y otros resultados Plusvalía por venta de activos y otros resultados
249
201
Impactos no recurrentes de eficiencia (brutos): 92M€ Neutro en capital
15
La rentabilidad mejorará en el 2S26 hasta alcanzar el 14,5% a cierre del ejercicio M€
2T26
1S26 2T26/1T26 1S26/1S25
Margen de intereses Comisiones Margen básico ROF y diferencias de cambio Otros resultados de explotación Margen bruto Costes recurrentes Costes no recurrentes Margen antes de dotaciones Total provisiones y deterioros Plusvalías por venta de activos y otros resultados Beneficio antes de impuestos Impuestos Minoritarios
902 328 1.230 16 22 1.267 -570 -33 664 -152
1.774 643 2.417 17 28 2.463 -1.139 -88 1.236 -285
+3,4% +4,0% +3,6% n.m. n.m. +6,0% +0,3% -39,8% +16,2% +14,4%
-2,0% -0,9% -1,7% +5,3% -52,0% -2,8% +4,9% n.m. -14,7% +18,3%
280
279
n.m.
n.m.
792 -183 -1
1.230 -335 -3
+80,7% +19,8% -45,6%
+2,9% -14,1% n.m.
Contribución neta de TSB
16
79
n.m.
n.m.
Beneficio neto (incluyendo TSB)
624
971
+80,0%
-0,5%
Beneficio neto recurrente
3591
6912
+8,4%
-14,1%
% 13,6 RoTE recurrente3
1 Beneficio neto recurrente 2T26 (359M€) = beneficio neto, incl. TSB (624M€) - contribución TSB (16M€) - impactos no recurrentes (249M€, ver detalle en diapositiva 15). 2 Beneficio neto recurrente 1S26 (691M€) = beneficio neto, incl. TSB (971M€) - contribución TSB (79M€) - impactos no recurrentes (201M€, ver detalle en
diapositiva 15) 3 Proforma desconsolidando TSB desde junio de 2025, lo que implica la distribución de un dividendo de 50 céntimos de euro por acción y la desconsolidación de los intangibles de TSB. No incluye la contribución de TSB al Grupo. Adicionalmente, excluye (neto de impuestos): -31M€ relacionados con la cobertura de tipo del cambio de los ingresos de la venta de TSB, -64M€ de costes no recurrentes asociados al programa de prejubilaciones en España en el 1S26, +322M€ de plusvalía por la venta de TSB y -45M€ vinculados a la venta de una participación accionarial.
16
2T26 confirma el punto de inflexión del margen de intereses Margen de intereses trimestral
Evolución trimestral del margen de intereses
M€
M€
+3,4% +16
2T26/1T26
906
872
-2,0%
902
+3
+11
902 872
1S26/1S25
2T25
Margen de clientes Margen de intereses sobre ATM
1T26
1T26
2T26
Margen de clientes
Número de días
Cartera de renta fija, liquidez, financiación mayorista y otros
2T26
2T25
1T26
2T26
3,00%
2,85%
2,84%
• Margen de intereses de clientes apoyado en mayores volúmenes en el trimestre
1,79%
• El margen de clientes ha tocado suelo y se espera que mejore gradualmente
1,85%
1,78%
• El margen de intereses de no clientes aumentó en el trimestre impulsado por una mayor contribución de liquidez 17
El margen de intereses aumentará en un dígito bajo trimestralmente Evolución trimestral esperada del margen de intereses M€
4T26 vs. 4T25 Crecimiento de dígito medio
Se espera que el margen de intereses trimestral siga aumentando, con crecimiento de un dígito medio en el 4T26 frente al 4T25, impulsado por: • Se espera que el BCE sitúe la facilidad de depósito en el 2,5%. Los tipos de interés a largo plazo seguirán mostrando volatilidad. • Volúmenes de crédito creciendo a un dígito medio • Recursos de clientes en balance creciendo al 3-4% • Rendimiento del crédito aumentando cada trimestre por la repreciación positiva de los préstamos a tipo variable • El coste de depósitos se espera que crezca a un menor ritmo que el rendimiento del crédito • Mejora trimestral del diferencial de clientes hasta niveles superiores a 290pbs en el 4T26
• Margen de intereses de no clientes estable desde el 1S26 4T25 4Q25
1T26 1Q26
2T26 2Q26
3T26e 3Q26e 4T26e 4Q26e
Se espera que el margen de intereses crezca >1% i.a. en 2026, en línea con el objetivo
18
Las comisiones crecieron un +4% en el trimestre, apoyadas en mayores comisiones de servicios Comisiones netas M€
Variación trimestral positiva, impulsada principalmente por las comisiones de servicios y de crédito
+4,0% 2T26/1T26
-0,9% 1S26/1S25
• Crecimiento de las comisiones de servicios apoyado en el negocio de pagos, la actividad de banca corporativa y la estacionalidad • Las comisiones de gestión de activos y seguros se mantuvieron estables en el trimestre
En adelante, se espera que las comisiones crezcan progresivamente, apoyadas en: • Negocio de pagos y otros servicios • Mayores activos bajo gestión • Actividad de banca corporativa
Crédito y riesgos contingentes Servicios
Se espera que las comisiones crezcan un dígito medio
Gestión de activos y seguros
19
Costes recurrentes estables en el trimestre Costes totales M€
En el trimestre, los costes recurrentes totales se mantuvieron estables
535 89 153
624 55
603 33
100
102
162
167
+0,3%
• Los gastos de personal y de administración permanecen estables gracias a la contención de costes
2T26/1T26¹
• Reconocimiento de 55M€ en el 1T26 y 33M€ en el 2T26 de costes no recurrentes relacionados con el plan de prejubilaciones
+4,9% 1S26/1S25²
294
2T25
307
1T26
301
Esperamos que los costes recurrentes incrementen ligeramente respecto a los niveles actuales
2T26
• La reclasificación del negocio de pagos en 4T25 tendrá un impacto favorable en la comparativa interanual en el 4T26 • Se espera materializar ya en 2026 20M€ de ahorros totales
Costes no recurrentes Amortización y depreciación Otros gastos generales Gastos de personal
1 Excluyendo -55M€ en 1T26 y -33M€ en 2T26 de costes no recurrentes relacionados con iniciativas de eficiencia en España. 2 Excluyendo -88M€ de costes no recurrentes relacionados con iniciativas de eficiencia en España en 1S26.
Se espera que los costes recurrentes crezcan <3% al cierre del año
20
Se espera que las mandíbulas sigan ampliándose en adelante Margen recurrente trimestral M€
El margen recurrente mejorará desde el 1T26 en adelante 2025
2026
• Se espera que el margen de intereses y las comisiones sigan creciendo: • Crecimiento del margen de intereses superior al 1% i.a. • Crecimiento de las comisiones en un dígito medio % i.a. • Esperamos que los costes recurrentes incrementen ligeramente respecto a los niveles actuales
Mínimo
• Crecimiento de los costes recurrentes totales inferior al 3% i.a.
Las mandíbulas seguirán ampliándose, apoyadas en el crecimiento de ingresos y la disciplina de costes
Margen de intereses + comisiones Costes recurrentes
21
La calidad de activos sigue respaldando un coste del riesgo contenido Provisiones de crédito
Desglose de provisiones totales 2T26
M€
M€
+21,6% 2T26/1T26
66
2T25
115
94
+72,5% 1S26/1S25
1T26
2T26
31pbs
40pbs
CoR de crédito
CoR total
• El coste del riesgo de crédito está en línea con los niveles recurrentes.
• La liberación de provisiones de activos adjudicados se apoyó en las plusvalías de ventas inmobiliarias
El coste del riesgo total se mantendrá en ~40pbs en 2026
• Costes de gestión de activos problemáticos y otras provisiones también en línea con los niveles recurrentes
22
Balance 23
Tendencia positiva en calidad de activos apoyada en la reducción de dudosos Ratios de morosidad y cobertura M€
69% 69%
2,81% 2.81%
3.674
Jun-25 jun.-25 Jun-25
3.411
3.390
Mar-26 mar.-26 Mar-26
Jun-26 jun.-26 Jun-26
Jun-25
Dudosos
2,55% 2.55%
2,47% 2.47%
Mar-26
Jun-26
Ratio de morosidad
Ratios clave
M€
M€
Stage 3
Jun-26
% i.a
Jun-26
% i.a.
Exposición (M€)
5.386
-1.518
3.390
-284
% del libro de crédito
3,9%
-136pbs
2,5%
-34pbs
Cobertura
4,7%
+36pbs
52,5%
-29pbs
1 Activos problemáticos / (inversión bruta + activos adjudicados).
jun.-25 Jun-25
mar.-26 Mar-26
69% 69%
jun.-26 Jun-26
Ratio de cobertura stage 3 con total provisiones
Exposición y ratio de cobertura por stages Stage 2
71% 71%
Ratio de activos problemáticos brutos¹ Ratio de activos problemáticos netos Activos problemáticos netos / activos totales
Jun-25
Mar-26
Jun-26
3,4%
3,0%
2,9%
1,2%
1,1%
1,1%
0,8%
0,7%
0,7% 24
Sólida posición de liquidez y ratings de crédito Métricas de liquidez
Ratings a largo plazo
M€
Jun-26
93%
Rating de crédito Perspectiva a largo plazo
Loan-to-deposit
131% NSFR 188% LCR
Standard & Poor’s
A-
Moody’s
Baa1
Fitch Ratings
Adesde BBB+
DBRS
A (bajo)
Positiva Estable Estable Estable
Nuevas emisiones en el año 53
51
17
17
51 18
36
34
33
Jun-25
Mar-26
Jun-26
Otros activos líquidos
• AT1: se espera normalizar el exceso de AT1 en 2027 • Tier 2: déficit actual compensado por el exceso de AT1
• Senior preferred / non-preferred: mantener el colchón de gestión por encima de los requisitos de MREL mediante emisiones oportunistas en euros • Cédulas hipotecarias: emisión oportunista en euros
Activos líquidos totales MM€
Plan de financiación 2026
Instrumento
Importe (MM€)
Cédulas hipotecarias
0,5
Bonos senior (Certificados bursátiles bancarios, Sabadell México)
0,2
Total
0,7
- 2 titulizaciones (SRT)
• Titulizaciones de transferencia significativa del riesgo (SRT): potencial operación en 2S26 para optimizar la gestión de capital
Menores necesidades de financiación MREL tras la venta de TSB
HQLAs
25
20pbs de capital generados en el trimestre, tras el devengo de dividendos del 60% y crecer el libro en un 3% Evolución del CET1 fully-loaded
46pbs de generación de capital antes del devengo del dividendo
+61pbs
+3pbs -18pbs
-26pbs 60% pay-out
13,18%
13,11%
12,91%
+20pbs Mar-26
Mar-26 Generación orgánica Ajustes de pro forma de CET1 valoración de la tras la venta post cupones cartera de renta fija de TSB de AT1 y tras el divendendo extraordinario1
Crecimiento de APRs
Devengo del dividendo
Nota: las ratios de capital de junio 2026 incluyen 11pbs de exceso de CET1 por encima del 13% (fully-loaded, aplicando el calendario regulatorio del output floor), nivel a partir del cual existe el compromiso de distribución de capital. 1 No incluye la liberación de APRs relacionados con riesgo operacional de TSB.
Jun-26
26
Consideraciones finales 27
Cumpliendo todos los compromisos clave para alcanzar los objetivos Objetivo 2026 Ingresos del negocio bancario
Costes Coste del riesgo
Cumpliendo exactamente lo previsto para el año ✓ Punto de inflexión ya alcanzado en margen de intereses y comisiones ✓ Crédito y depósitos en línea para alcanzar el objetivo ✓ La expansión del margen de clientes comienza ahora ✓ El crecimiento de comisiones continuará en el 2S26
Mayor visibilidad en el 2S26 ✓ Se espera que las medidas de eficiencia generen 20M€ de ahorros en el 2S26
Completamente en línea con las expectativas ✓ Perspectivas positivas en la calidad de los activos ✓ Se espera que el coste del riesgo se mantenga estable en el 2S26
En línea para cumplir nuestros objetivos de RoTE
14,5% en 2026
1% i.a. (margen de intereses)
Un dígito medio (comisiones)
<3% pbs ~40
En línea En línea Mejorado marginalmente En línea
16% en 2027
RoTE recurrente
El nuevo programa de recompra de acciones de 331M€ comenzará la próxima semana
28
Anexo 01. Margen de intereses y de clientes 02. Vencimientos de deuda 03. Posición MREL 04. Cartera ALCO 05. Evolución de activos problemáticos
- Objetivos ESG 2030
- Desglose de APR
- Colchón MDA
- Impactos no recurrentes
- Inteligencia artificial
29
Anexo 1 Rendimiento del crédito, costes de los recursos de clientes, margen de clientes y margen de intereses como % de los activos totales medios
Rentabilidad del crédito y coste de recursos de clientes
Margen de clientes y margen de intereses como % de los activos totales medios
En %
En %
3,88%
3,68%
3,64%
3,63%
3,62%
3,00%
2,91%
2,88%
2,85%
2,84%
0,88%
0,77%
0,76%
0,78%
0,78%
1,85%
1,79%
1,83%
1,78%
1,79%
2T25
3T25
4T25
1T26
2T26
2T25
3T25
4T25
1T26
2T26
Rendimiento del crédito
Margen de clientes
Coste de recursos de clientes
Margen de intereses como % de los activos totales medios
30
Anexo 2 Vencimientos de deuda
4.210
3.923 2.500
2.235
1.457
1.118
2026
2027
2028
2029
2030
2031
2031
Cédulas hipotecarias
1.390
1.100
985
950
1.250
200
2.000
Deuda senior preferred
0
0
750
1.473
750
0
0
Deuda senior non-preferred
67
18
500
1.500
500
500
1.195
Deuda subordinada
0
0
0
0
0
0
1.015
1.457
1.118
2.235
3.923
2.500
700
4.210
Total
700
Vencimientos de deuda en euros y excluyendo emisiones AT1. Incluye únicamente vencimientos, no las opciones de compra. Se incluye las emisiones de Banco Sabadell México.
31
Anexo 2 Vencimientos de deuda
Principales vencimientos y amortizaciones de deuda
Principales vencimientos o calls de deuda
en los últimos 6 meses
en los próximos 12 meses
Fecha
Importe nominal
Tier 2
15/01/2026 (amortizado)
500M€
Bonos senior preferred
11/03/2026 (amortizado)
AT1
15/03/2026 (amortizado)
Instrumento
Total
Fecha
Importe nominal
Cédulas hipotecarias
28/08/2026
1.000M€
500M€
Cédulas hipotecarias
21/12/2026
390M€
500M€
Cédulas hipotecarias
26/04/2027
1.100M€
1.500M€
AT1
19/05/2027 (call)
750M€
Senior non-preferred
16/06/2027 (call)
500M€
Instrumento
Total
Nota: en el caso de los instrumentos AT1, Sabadell podrá amortizar los bonos en cualquier momento durante el período que comienza en esa fecha y termina en la primera fecha de reseteo.
3.740M€
32
Anexo 3 Posición MREL
Situación MREL % activos ponderados por riesgo (APR phase-in), % exposición de ratio de apalancamiento (LRE)
28,03%
% 25,38 Requerimiento en 2026¹
% 10,20
6,26% Requerimiento en 2026¹
3,97%
1,44%
2,16%
Posición subordinada MREL
% 18,33
8,75%
1,78%
Subordinación
24,06%
3,18%
Posición subordinada MREL
% 6,26
13,16%
Requerimiento subordinación en 20261
0,65% 1,16%
4,79%
Requerimiento subordinación en 20261 Jun-26 Jun-26 reportado (% LRE) reportado (% LRE)
Jun-26 Jun-26 reportado (% APR) reportado (% APR)
CET1
Subordinación
5,94%
AT1
Tier 2
Senior non-preferred
Senior preferred
1 Requerimiento aplicable desde el 7 de abril de 2026, según la comunicación recibida a través del Banco de España concerniente a la decisión adoptada por la Junta Única de Resolución (JUR).
Nota 1: las ratios de capital de junio 2026 incluyen 16pbs de exceso de CET1 por encima del 13%, nivel a partir del cual existe el compromiso de distribución de capital. Nota 2: las ratios incluyen el Combined Buffer Requirement (3,24% desde jun-26 en adelante).
33
Anexo 4 Cartera ALCO
Evolución de la cartera de renta fija
Composición de la cartera
MM€
MM€. Jun-26. 15,2%
17,3%
30,9
17,5%
34,7
34,8
5,4
5,6
España Italia
19,7
5,9
5,3
4,5
3,3
2,1
Otros gobiernos no europeos y agencias Otros gobiernos europeos
25,0
Jun-25
29,2
29,3
Mar-26
Jun-26
Deuda corporativa y financiera
Valor razonable Coste amortizado % del total de activos
Jun-26
Rendimiento
Duración total1
Vencimiento medio
Valor razonable
3,1%
1,6 años
4,6 años
Total
2,9%
3,3 años
5,9 años
Nota: La cartera de renta fija excluye la cartera de negociación. 1 La duración incluye el efecto de las coberturas.
• La sensibilidad del capital a la volatilidad del diferencial de los bonos se mantiene baja ya que la composición de la cartera de valor razonable es pequeña y de corta duración • Opción de seguir comprando durante 2026 • Alrededor de 0,8MM€ vencen en el 2S26 • Plusvalías/minusvalías de capital latentes (después de impuestos): o Valor razonable: -0,1pp de CET1 (ya deducido) o Coste amortizado: -0,3pp de CET1
34
Anexo 5 Evolución de activos problemáticos
Activos adjudicados M€
Activos adjudicados vendidos % 24
-18% i.a
últimos 12 meses
773
+9% Prima promedio
659
636
40%
36%
35%
Jun-25
Mar-26
Jun-26
38%
33%
Jun-25
92% Edificios terminados (stock)
Mar-26
Jun-26
Ratiode decobertura cobertura Ratio
Activosadjudicados adjudicados Activos
Exposición de activos problemáticos y ratio de cobertura M€ -9% i.a.
64% 4,447 4.447
4.070 4,070
4.025 4,025
Jun-25
Mar-26
Jun-26
Activosproblemáticos problemáticos Activos
Jun-25
65%
63%
Mar-26
Jun-26
Ratio de Rarcobertura
Nota: incluye riesgos contingentes. Ratio de cobertura de activos problemáticos calculada como (provisiones totales de crédito + provisiones totales de activos adjudicados) / (stage 3 + activos adjudicados). 1 Activos problemáticos / (inversión bruta + activos adjudicados).
35
Anexo 6 Compromiso Sostenible Sabadell 2030
Nuevo marco de actuación ESG con horizonte 2030:
20
objetivos para 2030 20 compromisos para impulsar un impacto real y transformador hacia un 2030 más sostenible
Institución sostenible líder
Acompañar a clientes e inversores en la transición
Trabajar juntos por una sociedad sostenible y cohesionada
Ser una entidad de referencia reconocida por su desempeño ESG, capaz de impulsar el cambio
Convertir la sostenibilidad en una ventaja competitiva para clientes e inversores, con métricas que demuestran el impacto real
Contribuir a una sociedad más inclusiva y resiliente, mediante programas medibles y escalables
9 objetivos
6 objetivos
5 objetivos
36
Anexo 6 Objetivos ESG 2030
Sociedad
Clientes e inversores
Institución sostenible
Indicadores
Objetivos 2030
Huella de carbono
Reducción del 9% de la huella de carbono propia (alcances 1 y 2)
Neutralidad de emisiones
Mantener la neutralidad de las emisiones propias de gases de efecto invernadero
Diversidad
Alcanzar un 40% de representación de mujeres en el equipo directivo
Brecha salarial de género
Reducir la brecha salarial de género ajustada por debajo del 3% de media
Formación
Mantener la cobertura de formación de empleados por encima del 95%
Top Employer
Puntuación del Top Employers Institute superior al 90%
Proveedores evaluados en términos ESG
Mantener más del 90% la facturación con proveedores evaluados en términos ESG (1) en las categorías más sostenibles (2)
Absentismo
Mantener la tasa de absentismo por debajo del 4%
Fiscalidad responsable
Garantizar la alineación continuada con las mejores prácticas nacionales e internacionales en fiscalidad responsable y transparente, incluyendo el fomento de la relación cooperativa mantenida con las administraciones tributarias, con reflejo en evaluaciones externas favorables (3)
Sendas de descarbonización
Cumplir los objetivos de descarbonización publicados para sectores intensivos en CO₂
Net-zero – objetivos intermedios
Establecer objetivos de descarbonización 2035 para sectores con sendas de descarbonización ya fijadas
Movilización sostenible
Movilizar 90MM€ en soluciones de finanzas sostenibles (4) (2026–2030)
Financiación social
Alcanzar 10MM€ en financiación social (2026–2030)
Activos bajo gestión sostenibles
Mantener el 80% de los activos bajo gestión invertidos en fondos sostenibles (5) en 2030
Digitalización
60% de nuevas altas de clientes particulares a través de canales digitales (6)
Educación financiera
Alcanzar 11.000 beneficiarios anuales mediante programas de educación financiera
Voluntariado
Alcanzar 3.300 voluntarios anuales en iniciativas de impacto social
Ciberseguridad
Mantener puntuaciones sobresalientes (7) (>90/100) en las principales agencias de rating de ciberseguridad perimetral (Bitsight, RiskRecon y SecurityScoreCard).
Vivienda asequible
Financiar 7.000 viviendas asequibles (2026–2030)
Programas de talento
Alcanzar 80.000 beneficiarios de programas de desarrollo de talento (2026–2030)
(1) Proveedores críticos o con facturación anual superior a 500.000€ (2) En el caso de Achilles, se refiere a las categorías A+, A y B (3) Renovación anual del sello t de transparente, otorgado por Fundación Haz (4) Incluye financiación con aplicación sostenible (FAS), financiación vinculada a sostenibilidad (FVS), financiación social y mercados de capitales (5) Fondos comercializados bajo las marcas SABAM y/o por otras gestoras Amundi. Se consideran fondos sostenibles según el artículo 8 o 9 del reglamento europeo SFDR (6) Proceso íntegro en canal digital (7) Puntuación superior a 90 sobre 100, basada en una media normalizada en escala 0–100
37
Anexo 7 Desglose de APR
Por tipo:
Por geografía:
Riesgo de crédito
Riesgo operacional
MM€ 57,2
MM€ 12,7
MM€ 70.748 APR phase-in Jun-26
España
MM€ 63,6 Reino Unido
Riesgo de mercado
Otros
MM€ 0,5
MM€ 0,3
MM€ 2,8 Mexico
MM€ 4,3
38
Anexo 8 Colchón MDA
Datos a junio ‘26 Requerimientos de capital
Posición de capital (phase-in)
Pilar 1 CET1
4,50%
Requerimiento Pilar 2 (P2R)
1,18%1
Colchón de conservación de capital
2,50%
Colchón anticíclico
0,49%
Otras entidades de importancia sistémica
0,25%
CET1
8,92%
AT1
1,89%1
3,18%
Tier 2
2,53%1
1.78%
Capital total
13,34%
18,12%
pbs 423 Colchón MDA
% 5,9 Ratio de apalancamiento phase-in 13,16% • El MDA se sitúa en 423 pbs, por encima del requerimiento del 8,92% • El colchón anticíclico adicional del 0,5% en España desde octubre de 2026 representará c.40pbs para Sabadell • La ratio de apalancamiento phase-in aumentó +58 pbs en el año
Nota: las ratios de capital incluyen 16pbs de exceso de CET1 por encima del 13%, nivel a partir del cual existe el compromiso de distribución de capital. 1 Aplicando el artículo 104a de la CRD, el cual asume que el banco puede utilizar el exceso de Tier 2 y AT1 para cumplir con el P2R (en total 98pbs de excedente de capital híbrido, de los cuales 42pbs serían AT1 y 56 pbs Tier 2).
39
Anexo 9 Impactos no recurrentes M€
Concepto Venta de TSB Cobertura de la divisa de los ingresos de la venta de TSB
Costes no recurrentes derivados del programa de prejubilaciones
Venta de una participación accionarial Total
Bruto
Neto
Bruto
Neto
Últimos 12 meses Bruto Neto
331
316
331
316
331
316
ROF y diferencias de cambio
9
6
9
6
9
6
ROF y diferencias de cambio
-3
-2
-17
-12
-44
-31
Costes totales
-33
-23
-88
-61
-88
-61
Provisiones
-2
-1
-2
-1
-2
-1
-2
-2
-2
-2
-2
-2
-45
-45
-45
-45
-45
-45
Línea de la cuenta de resultados impactadas Plusvalía por venta de activos y otros resultados
Plusvalía por venta de activos y otros resultados Plusvalía por venta de activos y otros resultados
2T26
1S26
249
201
182
40
Anexo 10 Inteligencia artificial
La IA impulsa la creación de valor mediante mejoras en…
Cómo interactuamos con nuestros clientes
Productividad interna
Toma de decisiones
Iniciando nuestro proceso de transformación
100% de los empleados
Utilizando herramientas de IA (más de 1.000 agentes creados por los propios usuarios)
95% llamadas analizadas
para mejorar el NPS de resolución de llamadas
10% de reducción del tiempo
resolución de las llamadas entrantes
40% pymes
captación mediante herramientas de IA
~20% mejora de productividad
de los ingenieros de software
41
Anexo 10 Un marco de gobierno para el uso seguro, transparente y supervisado de la IA
Banco Sabadell cuenta con un marco de gobierno y control de modelos analíticos y de Inteligencia Artificial, basado en riesgos y alineado con el Reglamento Europeo de Inteligencia Artificial, para asegurar un uso responsable de la IA. Este enfoque permite promover una IA confiable, explicable y supervisada, orientada a proteger a clientes, empleados y otros grupos de interés, y a asegurar un uso responsable de la tecnología en la actividad bancaria.
Principios de IA Responsable
Procesos
Privacidad, datos y seguridad
Controles sobre la calidad de los datos, privacidad y protección en datos personales y mecanismos de protección frente a fallos, manipulación, ataques y contingencias de seguridad IT.
Robustez, transparencia y límites de uso
Estándares de desarrollo de sistemas de IA confiables desde su concepción, que velan por la solidez, la transparencia, el control sobre los usos permitidos y la seguridad de la información. Limitación de casos de uso sensibles. Certificación de proveedores de sistemas de IA.
Sesgos, equidad y derechos fundamentales
Análisis de sesgos y equidad que velan por la no discriminación ni vulneración de derechos fundamentales de las personas.
Supervisión humana y rendición de cuentas
Roles y responsabilidad definidos para todos los stakeholders involucrados en el desarrollo y uso responsable de la IA.
Cumplimiento regulatorio
Sistema de gestión de la calidad y de riesgos alineado con el Reglamento Europeo de Inteligencia Artificial.
Monitorización a lo largo del ciclo de vida
Estándares de validación, seguimiento periódico, monitorización de desempeño, estabilidad, desviación de datos, planes de contingencia, acciones de mejora continua.
La información presentada se basa en las políticas y procedimientos internos de Banco Sabadell sobre gobierno, control y uso responsable de modelos e Inteligencia Artificial.
42
Glosario
APRs
Activos ponderados por riesgo
NPA
Non-performing assets, Activos problemáticos
BCE
Banco Central Europeo
NPL
Non-performing loans, Préstamos morosos
CET 1
Common Equity Tier 1
NSFR
Net Stable Funding Ratio: ratio de liquidez a medio plazo
CRR 2 y CRR3
Capital Requirements Regulation 2 y 3
Pymes
Pequeña y mediana empresa
ESG
Environmental, Social and Governance
pbs
Puntos básicos
P2R
Requerimiento Pilar 2
P/E
Price-to-earnings ratio
RoTE
Return on Tangible Equity
HQLA
High Quality Liquid Assets (Activos líquidos de alta calidad)
JGA
Junta General de Accionistas
LCR
Ratio de cobertura de liquidez de corto plazo
LRE
Denominador del Leverage Ratio Exposure. Equivale al total activo más una serie de elementos de fuera de balance incluidos los derivados y las repos, entre otras
SFDR
Reglamento de Divulgación de Finanzas Sostenibles
SREP
Supervisory Review and Evaluation Process
LTV
Loan To Value, Relación valor-préstamo
TC
Tipo de cambio
MDA
Maximum Distributable Amount
TACC
Tasa Anual de Crecimiento Compuesto
MREL
Minimum Requirement of Eligible Liabilities
43
Aviso legal Esta presentación (la “Presentación”) ha sido preparada y emitida por y es de exclusiva
Valores (“CNMV”) y a disposición del público tanto en la web de Banco Sabadell
Consulte el Informe financiero trimestral (https://www.grupbancsabadell.com/corp/es/accionistas-
responsabilidad de Banco de Sabadell, S.A. (“Banco Sabadell” o la “Sociedad”). A estos efectos,
(www.grupbancsabadell.com) como en la de la CNMV (www.cnmv.es), así como otros factores de e-inversores/informacion-economico-financiera.html) para una explicación más detallada de las
la Presentación comprende e incluye las diapositivas contenidas en este documento, la
riesgo actualmente desconocidos o imprevisibles, que pueden estar fuera del control de Banco
MARs utilizadas, incluyendo su definición o la reconciliación entre los indicadores de gestión
exposición oral que, en su caso, se haga de estas diapositivas por la Sociedad y sus
Sabadell, pueden afectar de forma adversa a su negocio y situación financiera y causar que los
aplicables y las partidas presentadas en los estados financieros consolidados elaborados de
Representantes (según se definen más abajo), así como cualquier sesión de preguntas y
resultados difieran materialmente de aquellos que subyacen en las manifestaciones a futuro y
conformidad con las NIIF.
respuestas que siga a la citada exposición oral y cualquier documento o material informativo que
estimaciones, previsiones, objetivos o proyecciones. En consecuencia, no debe depositarse una
Los datos del mercado y la posición competitiva incluidos en la Presentación se han obtenido
se distribuya o guarde relación con cualquiera de los anteriores.
confianza indebida en las manifestaciones a futuro contenidas en esta Presentación.
generalmente de publicaciones sobre el sector y encuestas o estudios realizados por terceros. La
La información contenida en esta Presentación no pretende ser exhaustiva ni ha sido verificada
La información contenida en esta Presentación, incluyendo pero no limitada a las manifestaciones información sobre otras entidades se ha tomado de informes publicados por dichas entidades.
de forma independiente y parte de ella está expresada en forma resumida. Ni Banco Sabadell ni
a futuro y estimaciones o proyecciones, se entienden realizadas a la fecha de esta Presentación
Existen limitaciones respecto a la disponibilidad, exactitud, exhaustividad y comparabilidad de
ninguna de las sociedades de su grupo (“Grupo Banco Sabadell”), ni sus respectivos consejeros,
(salvo que se refieran a otra fecha específica) y no pretenden dar ninguna seguridad en cuanto a
dicha información. Banco Sabadell no ha verificado dicha información de forma independiente y
directivos, empleados, representantes o agentes (los “Representantes”) realizan ninguna
los resultados futuros. No existe ninguna obligación de actualizar, completar, revisar o mantener
no puede garantizar su exactitud y exhaustividad. Ciertas manifestaciones incluidas en la
manifestación sobre ni garantizan, expresa o tácitamente, la ecuanimidad, exactitud,
al día la información contenida en esta Presentación, sea como consecuencia de nueva
Presentación sobre el mercado y la posición competitiva de Banco Sabadell se basan en análisis
exhaustividad y corrección de la información aquí contenida ni, en consecuencia, debe darse esta información o de sucesos o resultados futuros o por cualquier otro motivo. La información
internos de Banco Sabadell, que conllevan determinadas asunciones y estimaciones. Estos
por sentada. Ni Banco Sabadell ni ninguna de las sociedades del Grupo Banco Sabadell, ni sus
contenida en esta Presentación puede ser objeto de modificación en cualquier momento sin
análisis internos no han sido verificados por ninguna fuente independiente y no puede asegurarse
respectivos Representantes asumen responsabilidad alguna (ya sea a título de negligencia o de
previo aviso y no debe confiarse en ella a ningún efecto.
que dichas estimaciones o asunciones sean correctas. En consecuencia, no se debe depositar
cualquier otro modo) cualquier daño, perjuicio o coste directo o indirecto (incluyendo, pero no
Esta Presentación contiene información financiera derivada de los estados financieros no
una confianza indebida en los datos sobre el sector, el mercado o la posición competitiva de
limitado a daños consecuenciales, daños reputacionales, lucro cesante, daños punitivos o daños
auditados del Grupo Banco Sabadell correspondientes al segundo trimestre de 2026. La
Banco Sabadell contenidos en esta Presentación.
morales) derivado del uso de esta Presentación, de sus contenidos o relacionado de cualquier
información financiera por áreas de negocio ha sido formulada de conformidad con las Normas
La distribución de esta Presentación en ciertas jurisdicciones puede estar restringida por la ley.
otra forma con la Presentación por, con excepción de cualquier responsabilidad derivada de dolo, Internacionales de Información Financiera (“NIIF”), así como con los criterios de contabilidad y se exoneran expresamente de cualquier responsabilidad, directa o indirecta, expresa o implícita, internos del Grupo Banco Sabadell con el fin de que cada área presente de manera fiel la
Los receptores de esta Presentación deben informarse sobre estas limitaciones y atenerse a
contractual, extracontractual, legal o de cualquier otra fuente, por la exactitud y exhaustividad de
naturaleza de su negocio. Los criterios mencionados anteriormente no están sujetos a normativa
de la distribución de esta Presentación por sus receptores.
la información contenida en esta Presentación, y por las opiniones vertidas en ella así como por
alguna y podrían incluir estimaciones, así como valoraciones subjetivas que, en caso de
los posibles errores, omisiones o incorrecciones que puedan existir en la Presentación.
El Grupo Banco Sabadell y sus Representantes no son responsables, ni aceptan responsabilidad
adoptarse una metodología distinta, podrían presentar diferencias significativas en la información
alguna, por el uso, las valoraciones, opiniones, expectativas o decisiones que puedan adoptarse
Banco Sabadell advierte que esta Presentación puede contener manifestaciones a futuro y
presentada.
por terceros con motivo de la publicación de esta Presentación.
estimaciones, previsiones, objetivos o proyecciones respecto al negocio, la situación financiera, la Adicionalmente a la información financiera preparada de acuerdo con las NIIF, esta Presentación estrategia, los planes y los objetivos del Grupo Banco Sabadell. Si bien estas manifestaciones a incluye ciertas Medidas Alternativas del Rendimiento (“MARs”) según se definen en el
ellas. El Grupo Banco Sabadell y sus Representantes se exoneran de responsabilidad respecto
Nadie debe adquirir o suscribir valores o instrumentos financieros de la Sociedad con base en esta Presentación. Esta Presentación no constituye, ni forma parte, ni debe entenderse como (i)
futuro y estimaciones, previsiones, objetivos o proyecciones representan la opinión actual del
Reglamento Delegado (UE) 2019/979 de la Comisión, de 14 de marzo de 2019 y en las
Grupo Banco Sabadell sobre las expectativas futuras relativas al desarrollo de su negocio, un
Directrices sobre las Medidas Alternativas del Rendimiento publicadas por la European Securities adquirir, valor o instrumento financiero alguno ni, incluso por el hecho de su comunicación, and Markets Authority el 5 de octubre de 2015 (ESMA/2015/1415es). Las MARs son medidas del constituye ni forma parte, ni puede tomarse como base, ni puede entenderse como una inducción
cierto número de riesgos, incertidumbres y otros factores relevantes podrían ocasionar que los resultados reales sean materialmente diferentes de las expectativas del Grupo Banco Sabadell.
una oferta, solicitud o invitación a suscribir, adquirir, vender, emitir, asegurar o de otra manera
rendimiento financiero elaboradas a partir de la información financiera del Grupo Banco Sabadell
Estos factores incluyen, pero no se limitan a: (1) la situación del mercado, factores
a la ejecución, de ningún contrato o compromiso de cualquier índole en relación con valor o
pero que no están definidas o detalladas en el marco de información financiera aplicable y que,
macroeconómicos, tendencias gubernamentales, políticas y regulatorias; (2) movimientos en los
instrumento financiero alguno; ni como (ii) una forma de opinión financiera, recomendación o
por tanto, no han sido auditadas ni son susceptibles de serlo en su totalidad. Estas MARs se
mercados bursátiles nacionales e internacionales, tipos de cambio y tipos de interés; (3)
asesoramiento de carácter financiero o inversor en relación con valor o instrumento financiero
utilizan con el objetivo de que contribuyan a una mejor comprensión del desempeño financiero del alguno.
presiones competitivas; (4) desarrollos tecnológicos; (5) cambios en la posición financiera o la
Grupo Banco Sabadell pero deben considerarse como una información adicional, y en ningún
solvencia de sus clientes, deudores y contrapartes y (6) el conflicto militar entre Rusia y Ucrania.
caso sustituyen la información financiera elaborada de acuerdo con las NIIF. Asimismo, la forma
Estos y otros factores de riesgo descritos en los informes y documentos pasados o futuros del
en la que el Grupo Banco Sabadell define y calcula estas MARs puede diferir de la de otras
Grupo Banco Sabadell, incluyendo aquellos remitidos a la Comisión Nacional del Mercado de
entidades que empleen medidas similares y, por tanto, podrían no ser comparables entre ellas.
Mediante la recepción de, o el acceso a, esta Presentación Vd. acepta y queda vinculado por los términos, condiciones y restricciones antes expuestos.
44
Presentación de resultados
2T26
Nota de prensa 24 de julio 2026
Banco Sabadell gana 971 M€ hasta junio apoyado en el fuerte impulso del negocio y lanza una nueva recompra de acciones por 331 M€
• El impulso de la actividad comercial sustenta la mejora de los ingresos y se plasma en
incrementos anuales del 5,5% del crédito y el 6,4% en los recursos de clientes en el Grupo. La nueva financiación aumenta de forma notable en el trimestre en España en todos los segmentos: pymes y empresas (+38%), hipotecas (+22%) y consumo (+9%)
• Los ingresos del negocio bancario confirman el cambio de tendencia anticipado, con crecimientos trimestrales del margen de intereses (+3,4%) y de las comisiones (+4%), que continuarán en la segunda mitad del año
• La entidad inicia el calendario de remuneración a los accionistas con el nuevo programa
de recompra de acciones. Mantiene su alta capacidad de generación de capital de manera orgánica y sitúa la ratio CET1 fully loaded en el 13,11%
• La rentabilidad crecerá en los próximos trimestres apoyada en el crecimiento del negocio, la contención de los gastos y la elevada calidad de los activos, hasta alcanzar los niveles de RoTE previstos del 14,5% este año y el 16% en 2027
"Estos resultados confirman la fortaleza de nuestro proyecto. Los ingresos se incrementan y lo harán más en los próximos trimestres gracias al fuerte impulso de nuestra actividad comercial. Afrontamos la segunda mitad del año con confianza y enfocados en generar valor para clientes, empleados y accionistas”
“La solidez del balance y nuestra capacidad de generación de capital siguen siendo unos de los principales activos del Grupo. Tenemos niveles de solvencia robustos y la confianza en la mejora de nuestros resultados para alcanzar la rentabilidad comprometida en los ejercicios 2026 y 2027”
Marc Armengol CEO
Sergio Palavecino CFO
Dirección de Comunicación [email protected]
@SabadellPremsa @SabadellPrensa @SabadellPress
1
Presentación de resultados
2T26
Nota de prensa 24 de julio 2026
Grupo Banco Sabadell ha obtenido un beneficio neto de 971 millones de euros en el primer semestre de 2026, en línea con el mismo periodo del año anterior (-0,5%) e incluyendo la aportación de TSB (que en el presente ejercicio formó parte del grupo durante cuatro meses hasta su venta). Sin tener en cuenta la contribución de la unidad británica y los resultados extraordinarios, el beneficio recurrente se ha situado en 691 millones de euros (-14,1%) y ha comenzado a crecer trimestralmente (8,4%) gracias al impulso del negocio, una tendencia que continuará en adelante. Como se había anticipado, los ingresos del negocio bancario han comenzado a crecer trimestralmente gracias al dinamismo de la actividad comercial, tras haber marcado un valle entre enero y marzo. Esta mejora continuará en la segunda parte del año y contribuirá, junto a la contención de los gastos y la elevada calidad de los activos, a que la rentabilidad RoTE recurrente aumente en los próximos trimestres desde el 13,6% de cierre de junio hasta el 14,5% a final del 2026 y el 16% en 2027. El banco ha iniciado el calendario de remuneración al accionista. Tras el pago en mayo de un dividendo extraordinario de 50 céntimos en efectivo por la venta de TSB, la entidad ha anunciado un nuevo programa de recompra de acciones por importe de 331 millones de euros (equivalente a en torno al 2,1% del capital social del banco), que se activará la próxima semana. La política de remuneración a los
Dirección de Comunicación [email protected]
@SabadellPremsa @SabadellPrensa @SabadellPress
2
Presentación de resultados
2T26
Nota de prensa 24 de julio 2026
accionistas se sustenta en la probada capacidad del banco de generar capital de manera orgánica. La ratio de solvencia CET1 fully loaded se ha situado en el 13,11%. El consejero delegado de Banco Sabadell, Marc Armengol, ha afirmado: "Estos resultados confirman la fortaleza de nuestro proyecto. Los ingresos se incrementan y lo harán más en los próximos trimestres gracias al fuerte impulso de nuestra actividad comercial. Afrontamos la segunda mitad del año con confianza y enfocados en generar valor para clientes, empleados y accionistas”. El director financiero de Banco Sabadell, Sergio Palavecino, ha asegurado: “La solidez del balance y nuestra capacidad de generación de capital siguen siendo unos de los principales activos del Grupo. Tenemos niveles de solvencia robustos y la confianza en la mejora de nuestros resultados para alcanzar la rentabilidad comprometida en los ejercicios 2026 y 2027”.
Impulso de la actividad comercial en todos los segmentos El impulso de la actividad comercial se ha plasmado en un incremento del crédito vivo del 5,5% interanual, hasta cerca de 125.200 millones de euros. En España, el crecimiento ha sido del 3,6%, hasta 107.100 millones de euros, con aumentos en todos los segmentos. En pymes y grandes empresas, la inversión crediticia ha ascendido hasta rondar los 45.700 millones de euros, lo que representa un aumento del 1,9% interanual y del 2,1% trimestral. La nueva producción en términos trimestrales se anota un incremento del 38%. El crédito vivo en hipotecas experimenta igualmente una evolución positiva, hasta situarse en 40.200 millones de euros (+3,4% interanual y +0,9% trimestral), con crecimientos del 22% trimestral en nueva producción. Estas dinámicas se replican en el crédito al consumo, hasta situarse en 5.600 millones de euros (+12,7% interanual y +2,7% trimestral) y una nueva producción que se acelera trimestralmente un 9%.
Dirección de Comunicación [email protected]
@SabadellPremsa @SabadellPrensa @SabadellPress
3
Presentación de resultados
Nota de prensa 24 de julio 2026
2T26
El dinamismo comercial también se ha plasmado en los recursos de clientes, que registran un incremento interanual del 6,4% en el conjunto del Grupo, hasta los 188.110 millones de euros. El crecimiento ha venido impulsado tanto por los recursos en balance (+4,7% interanual) como por los fuera de balance (+11% interanual). Entre estos últimos, destacan especialmente los fondos de inversión, apoyados en suscripciones netas positivas, así como la favorable evolución de la actividad de gestión de patrimonios y de los seguros comercializados.
Cambio de tendencia y aceleración del crecimiento Sin contar con TSB, Banco Sabadell ha obtenido unos ingresos del negocio bancario (margen de intereses más comisiones) de 2.417 millones de euros en el primer semestre, de los que 1.230 millones han sido en el segundo trimestre, en el que ha registrado un incremento del 3,6% frente al primero fruto del dinamismo de la actividad comercial, como el banco había anticipado. Se prevé que la curva siga una tendencia alcista en los próximos trimestres.
Dirección de Comunicación [email protected]
@SabadellPremsa @SabadellPrensa @SabadellPress
4
Presentación de resultados
2T26
Nota de prensa 24 de julio 2026
El cambio de tendencia previsto se ha confirmado también en el margen de intereses, con un crecimiento trimestral del 3,4%, hasta los 902 millones de euros, impulsado por los mayores volúmenes de crédito. Tras alcanzar una cifra de 1.774 millones de euros en el semestre, el banco mantiene su previsión de cerrar el año con un alza superior al 1% en el conjunto del ejercicio. De forma similar, los ingresos por comisiones mejoran un 4% frente al primer trimestre, hasta los 328 millones de euros (643 millones entre enero y junio), fruto de la mayor contribución de los ingresos por servicios. Esta tendencia también continuará en la segunda parte del año y permitirá cerrar el ejercicio con un alza de en torno al dígito medio. Los costes totales del semestre se sitúan en 1.227 millones de euros e incorporan 88 millones de euros no recurrentes derivados del plan de prejubilaciones puesto en marcha en España, que ya se ha completado y que permitirá mejorar la eficiencia en adelante. Los ahorros anualizados serán de 40 millones de euros brutos a partir de 2027, si bien en la segunda parte de 2026 ya se obtendrán 20 millones, por encima del tercio de los 40 millones previsto inicialmente. En consecuencia, la previsión es que los costes recurrentes crezcan por debajo del 3% a cierre de 2026. El resultado semestral recoge varios impactos extraordinarios. En sentido positivo, la venta de TSB ha generado unas plusvalías netas de impuestos de 322 millones de euros (340 millones brutos). En sentido contrario, se han registrado otros impactos, como el plan de prejubilaciones en España. El saldo total ha resultado en una aportación positiva de 201 millones de euros netos a la cuenta de resultados. En cuanto a la calidad de los activos, la ratio de morosidad continúa mejorando y se reduce al 2,47% en el segundo trimestre de 2026, frente al 2,55% del trimestre anterior, con una cobertura stage 3 con el total de provisiones que se sitúa en el 68,7%. Esta buena evolución de la tasa de mora es consecuencia de la reducción de los activos problemáticos. El saldo de NPAs baja en 44 millones de euros en el trimestre y en 421 millones de euros en los últimos 12 meses. El coste del riesgo se ha situado en los 40 puntos básicos, la cifra prevista para el conjunto del ejercicio.
Dirección de Comunicación [email protected]
@SabadellPremsa @SabadellPrensa @SabadellPress
5
Presentación de resultados
Nota de prensa 24 de julio 2026
2T26
Datos acumulados en millones €
Jun 25
Jun 26
Variación interanual
Margen de intereses
1.810
1.774
-2,0%
649
643
-0,9%
2.459
2.417
-1,7%
ROF y diferencias de cambio
16
17
5,3%
Otros resultados de explotación
59
28
-52,0%
2.534
2.463
-2,8%
Gastos de explotación
-911
-1.025
12,5%
Amortización
-175
-202
15,9%
-1.085
-1.227
13,0%
-1.085
-1.139
4,9%
0
-88
--
1.449
1.236
-14,7%
Total provisiones y deterioros
-241
-285
18,3%
Plusvalías por venta de activos y otros resultados
-12
279
--
1.195
1.230
2,9%
Impuestos y minoritarios
-391
-338
-13,5%
Aportación neta TSB
171
79
-53,9%
Beneficio neto con TSB
975
971
-0,5%
MAGNITUDES Saldos posición en millones €
Jun 25
Jun 26
Variación interanual
Total activos
252.373
199.084
-21,1%
Inversión crediticia bruta viva
118.710
125.184
5,5%
Recursos de clientes en balance
127.404
133.380
4,7%
Recursos de clientes de fuera de balance
49.318
54.726
11,0%
RATIOS
Jun 25
Jun 26
Core capital / Common equity fully-loaded (%)
13,6
13,1
Ratio de morosidad (%)
2,81
2,47
Ratio de cobertura stage 3 con total provisiones (%)
68,8
68,7
Número de oficinas
1.165
1.116
Número de personas empleadas
14.139
13.842
Comisiones
Ingresos del negocio bancario
Margen bruto
Total costes Promemoria: Costes recurrentes Costes no recurrentes
Margen antes de dotaciones
Beneficio antes de impuestos
Dirección de Comunicación [email protected]
@SabadellPremsa @SabadellPrensa @SabadellPress
6
Prompts
Click prompts to add them under the company line, click again to take one out, then copy the result into your AI chat. Shared by Asian Century Stocks and Uncovered Thai Stocks. Thank you.
ETFs Holding BANCO DE SABADELL S.A.
Exchange-traded funds whose newest published daily portfolio holds one of the company's listings, largest weight first.
| ETF | Weight in ETF | Shares | Market value | As of |
|---|---|---|---|---|
| THOR | 1.32% | 73,933 | $ 311.991K | Aug 31, 2026 |
| GMOI | 0.27% | 436,731 | $ 1.843M | Aug 31, 2026 |
| DFSI | 0.19% | 542,283 | $ 2.253M | Nov 12, 2026 |
| AVSD | 0.18% | 167,477 | $ 687.376K | Nov 16, 2026 |
| JSTC | 0.18% | 127,186 | $ 526.326K | Nov 17, 2026 |
| DFIC | 0.16% | 5,827,020 | $ 24.208M | Nov 12, 2026 |
| DFAX | 0.14% | 4,199,117 | $ 17.445M | Nov 12, 2026 |
| AVDE | 0.14% | 6,809,628 | $ 27.949M | Nov 16, 2026 |
| DFIV | 0.11% | 5,752,170 | $ 23.897M | Nov 12, 2026 |
| DFAI | 0.09% | 3,880,347 | $ 16.12M | Nov 12, 2026 |
| DXIV | 0.04% | 24,140 | $ 100.286K | Nov 12, 2026 |