Redacción Mapfre octubre 27, 202619 min. Las primas superan los 22.800 millones (+2,0%), con avances tanto en Vida (+5,0%) como en No Vida (+1,1%). Mejora la rentabilidad de los negocios de Vida y No Vida, respaldada por la excelencia técnica y la…
Redacción Mapfre
octubre 27, 202619 min.

-
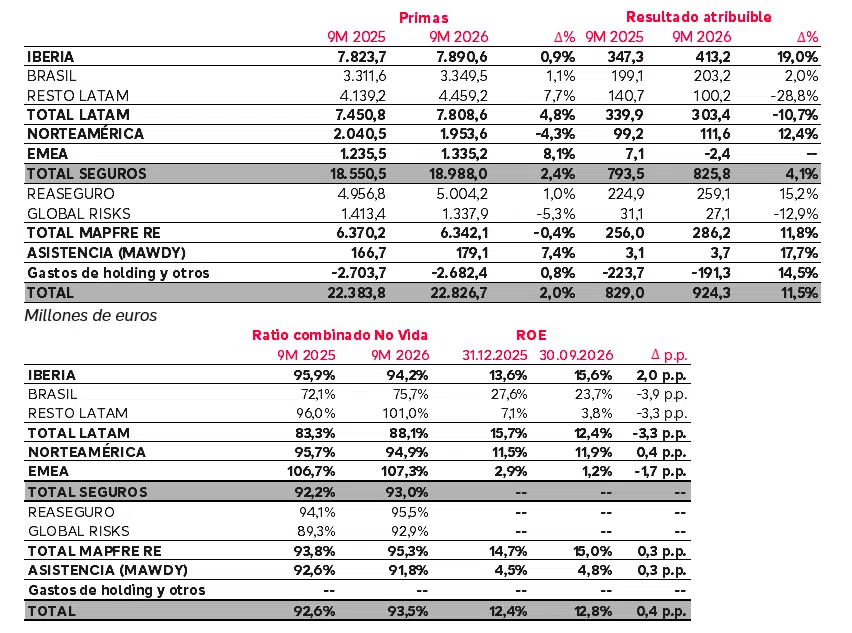
Las primas superan los 22.800 millones (+2,0%), con avances tanto en Vida (+5,0%) como en No Vida (+1,1%).
-
Mejora la rentabilidad de los negocios de Vida y No Vida, respaldada por la excelencia técnica y la importante contribución del resultado financiero. El ratio combinado de No Vida se sitúa en un excelente 93,5% (+0,9 p.p.).
-
El ROE alcanza el 12,8% (+0,4 p.p.) y los fondos propios aumentan hasta los 9.445 millones (+5,4%).
-
Iberia impulsa significativamente su beneficio hasta los 413 millones (+19,0%), con una mejora del ratio combinado hasta el 94,2% (-1,7 p.p.), gracias al sólido desempeño de sus principales negocios.
-
Latam alcanza un resultado neto de 303 millones (-10,7%), afectado por diversos eventos de la naturaleza, fundamentalmente el terremoto en Colombia. Destaca la aportación muy positiva de Brasil, con un resultado superior a los 200 millones (+2,0%) y un ratio combinado de 75,7% (+3,6 p.p.).
-
Norteamérica alcanza un resultado histórico de 112 millones (+12,4%) y mejora su ratio combinado hasta un excelente 94,9% (-0,8 p.p.).
-
Mapfre Re, que engloba Reaseguro y Global Risks, obtiene un beneficio de 286 millones (+11,8%), con un sólido ratio combinado del 95,3% (+1,5 p.p.), que incluye el impacto del terremoto en Colombia.
-
La adquisición de Safety Insurance avanza conforme a lo previsto, con el cierre estimado para el primer trimestre de 2027.
-
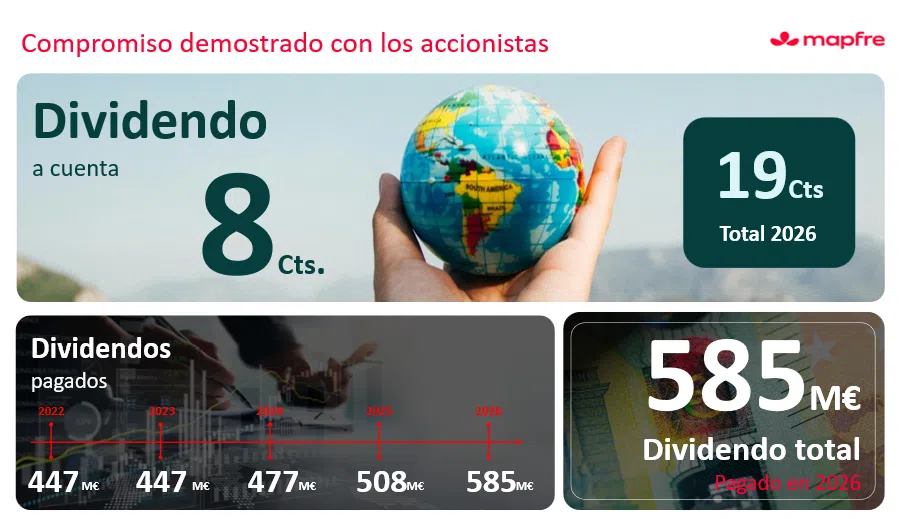
El Consejo de Administración ha aprobado un dividendo a cuenta de los resultados de 2026 de 8,0 céntimos por acción, que se abonará el próximo 26 de noviembre.

“Los resultados reflejan la fortaleza de Mapfre en la recta final de nuestro Plan Estratégico. El crecimiento rentable del negocio y el aumento del dividendo que acabamos de anunciar reflejan nuestra capacidad para seguir creando valor para clientes y accionistas. Adicionalmente, la adquisición de Safety Insurance, que sigue según lo previsto, reforzará nuestra presencia en Estados Unidos y nuestras perspectivas de crecimiento.”
Antonio Huertas, presidente y CEO de Mapfre
Mapfre S.A. (Mapfre) advierte que, salvo indicación en contrario, las cifras y ratios que contiene este informe de actividad están presentadas bajo los principios contables vigentes en cada país, que generalmente no aplican las NIIF 17 & 9. Ciertos ajustes se han aplicado para permitir la comparación y agregación entre unidades y regiones. El Grupo Mapfre presenta sus estados financieros bajo las normas internacionales vigentes (NIIF) con carácter semestral. Algunas de las cifras se han redondeado. Por lo tanto, podrían surgir discrepancias en las tablas entre los totales y las cantidades listadas debido a dicho redondeo.
1. Principales magnitudes – contabilidad local homogeneizada
-
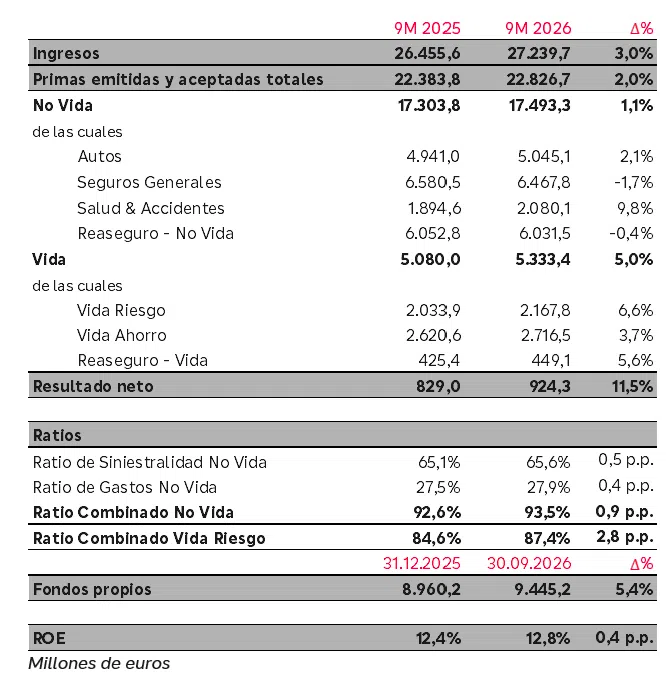
Las primas crecen un 2,0% en euros. A tipos de cambio constantes, crecen un 0,7%.
-
Las primas de No Vida se incrementan un 1,1% en euros. El negocio de Seguros Generales cae (-1,7%), afectado por una menor emisión de seguros Agro en Brasil, así como en el ramo de Empresas en Iberia debido a varias emisiones no recurrentes en 2025. Salud y Accidentes crece (+9,8%) con avances en Iberia y Resto Latam, especialmente en México. El ramo de Automóviles crece un 2,1%, con avances en prácticamente todas las regiones.
-
Las primas de Vida suben un 5,0% en euros. Vida Ahorro crece un 3,7%, pese a la exigente comparativa por la emisión de pólizas corporativas relevantes en Iberia en 2025. El negocio de Vida Riesgo registra un sólido crecimiento (+6,6%), impulsado por México y Resto Latam. Excluyendo el impacto de las pólizas corporativas no recurrentes, el crecimiento de Vida alcanzaría el 12,6%.
-
La mayoría de las regiones y unidades contribuyen positivamente al resultado. El beneficio neto aumenta un 11,5% hasta los 924 millones, influido por los siguientes factores:
-
El incremento del resultado de No Vida (+11,8%), fruto de una gestión prudente. El evento más relevante ha sido el terremoto de Colombia en agosto, que ha tenido un coste estimado neto de impuestos y minoritarios de 83 millones para el Grupo. Además, ha habido otros eventos destacados en el año, como las tormentas en Portugal y España en el mes de febrero y el terremoto de Venezuela en junio.
-
El negocio de Vida aporta 199 millones al resultado (+10,6%) con un notable ratio combinado en Vida Riesgo del 87,4%, apoyado fundamentalmente en Brasil.
-
La importante contribución del resultado financiero, tanto en Vida como en No Vida, sustentada en la elevada rentabilidad de las carteras. Además, se ha ajustado el perfil de riesgo de las mismas ante el actual entorno de incertidumbre, lo que se ha traducido en importantes plusvalías.
-
El ratio combinado de No Vida se sitúa en el 93,5% (+0,9 p.p.):
-
El ratio de siniestralidad se sitúa en el 65,6% (+0,5 p.p.), apoyado en la gestión técnica. Por su parte, el ratio de gastos alcanza el 27,9% (+0,4 p.p.).
-
En Automóviles, el ratio combinado mejora hasta el 99,0% (-0,6 p.p.), destacando las mejoras en Iberia y Norteamérica.
-
Seguros Generales conserva un ratio muy sólido del 81,8% (+1,3 p.p.), mientras que Salud y Accidentes aumenta 3,2 p.p. hasta el 100,0%, muy afectado por la subida de los costes de siniestros en México.
-
Los fondos propios se sitúan en 9.445 millones (+5,4% durante el año), con una aportación positiva del resultado retenido y de las diferencias de conversión, principalmente procedentes de la apreciación del dólar y las divisas latinoamericanas, en especial el real brasileño.
-
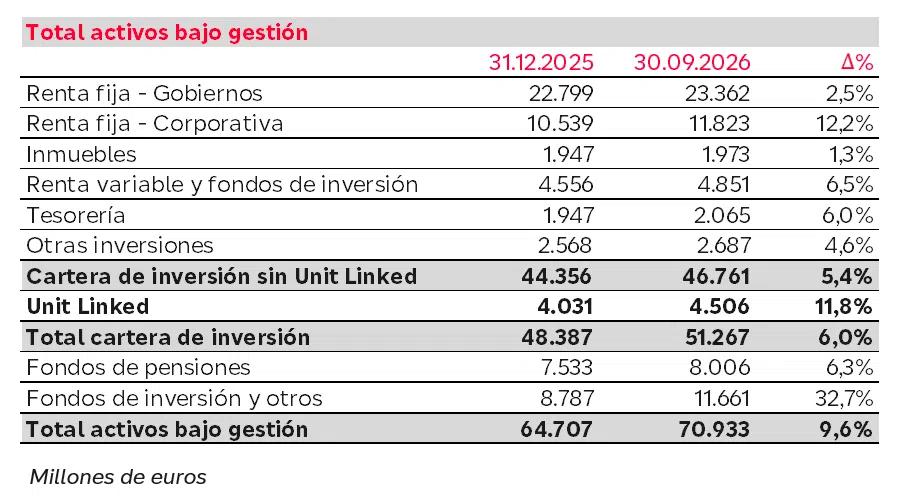
Los activos bajo gestión se muestran a continuación:
- El ratio de Solvencia II continúa por encima del punto medio del rango objetivo, situándose en el 208,8% a cierre de junio de 2026, frente a 205,3% a diciembre de 2025.
2. Información por regiones y unidades
Iberia obtiene un resultado de 413 millones (+19,0%), consolidando la fuerte mejora del ratio combinado
-
Las primas en Iberia alcanzan los 7.891 millones (+0,9%), de los cuales España aporta 7.531 millones (+0,3%), mientras que Portugal aporta 359 millones (+13,6%).
-
Las primas de No Vida suben un 0,7% con buen comportamiento en Salud y Accidentes (+4,1%) y en Automóviles (+1,1%). Por su parte, Seguros Generales cae (-2,4%), afectado por la emisión no recurrente de Empresas en 2025. Excluyendo este impacto, Seguros Generales crece un 2,0% y el total de primas de No Vida un 2,5%.
-
El ratio combinado de No Vida mejora 1,7 p.p. hasta el 94,2%:
-
Destaca la buena evolución del ratio de Automóviles que se sitúa en el 96,0% (-2,5 p.p.) como consecuencia de las medidas técnicas implementadas.
-
El ratio combinado de Seguros Generales mejora hasta alcanzar un excelente 91,5% (-2,7 p.p.), a pesar de la ocurrencia de eventos climatológicos en el año.
-
Salud y Accidentes registra un ratio muy sólido del 96,4% (+1,4 p.p.).
-
Las primas de Vida crecen (+1,1%) pese a la exigente comparativa por la emisión de algunas pólizas corporativas relevantes de Vida Ahorro en 2025. Excluyendo dichas operaciones, el crecimiento de las primas de Vida sería del 17,6%. Las primas de Vida Riesgo crecen un 4,5%, con un ratio combinado del 73,2%. El negocio de Vida aporta 80 millones al resultado (-12,8%).
-
Sin el efecto de las pólizas no recurrentes, tanto de Vida como de No Vida, el total de las primas en Iberia aumenta un 6,8%.
-
España aporta más de 404 millones (+19,9%) al resultado de la región, mientras que Portugal registra un beneficio de 8,7 millones (-13,2%).
Brasil mantiene un excelente ROE del 23,7%, sustentado en la excelencia técnica y en un buen resultado financiero
-
Las primas se sitúan en los 3.349 millones (+1,1%), impulsadas por la apreciación del real brasileño (+5,5%). En moneda local, el volumen de negocio cae un 4,2%. La contratación de seguros vinculados a créditos continúa condicionada por los elevados tipos de interés, afectando a los negocios de Agro y Vida Riesgo. Los otros ramos de Seguros Generales, tanto industriales como particulares, contribuyen positivamente al crecimiento.
-
El ratio combinado de No Vida registra un excelente 75,7% (+3,6 p.p.), impactado por la climatología adversa en la región centro-sur del país. Seguros Generales presenta un ratio de 67,2% (+3,9 p.p.), sustentado en la elevada rentabilidad del ramo de Agro. El ratio de Automóviles aumenta hasta el 105,0% (+3,6 p.p.).
-
El negocio de Vida Riesgo sigue registrando una rentabilidad excelente, con un ratio combinado del 84,0% (+1,9 p.p.).
-
El resultado financiero continúa creciendo, apoyado en los elevados tipos de interés.
-
El resultado neto supera los 203 millones (+2,0%).
Resto Latam continúa creciendo en primas y aporta más de 100 millones al resultado del Grupo
-
Las primas se incrementan hasta los 4.459 millones (+7,7%), impulsadas por los negocios tanto de Vida como de Salud y Accidentes. El ramo de Daños continúa reflejando la reducción de las tasas de seguro, además del impacto del tipo de cambio, al estar la mayoría de sus pólizas denominadas en dólares.
-
El ratio combinado repunta hasta el 101,0% (+5,0 p.p.). Seguros Generales se sitúa en el 96,3% (+8,7 p.p.), Salud y Accidentes en el 102,4% (+2,8 p.p.) y el ratio de Automóviles alcanza el 101,5% (+5,6 p.p.). Los ratios se han visto afectados por un mayor número de eventos catastróficos y climatológicos.
-
El negocio de Vida obtiene un resultado neto de 30 millones.
-
Los ingresos financieros continúan contribuyendo significativamente al resultado.
-
En México, las primas se elevan hasta los 1.714 millones (+13,0%), respaldadas por el efecto positivo del tipo de cambio (+7,4%), con un crecimiento del 5,2% en moneda local. Se mantienen los avances en Vida (+14,9%) y Salud y Accidentes (+37,4%). El ratio combinado se sitúa en el 102,1% (+5,8 p.p.) presionado por el aumento de los costes de siniestros en Salud y Accidentes y en Automóviles, que continuarán compensándose progresivamente mediante ajustes de tarifas. El resultado alcanza los 19,6 millones (frente a 37,3 millones en 9M 2025).
-
En Perú, las primas aumentan hasta los 695 millones (+8,7%), mientras que en moneda local aumentan un 6,7%, impulsadas por el negocio de Vida y Salud y Accidentes, además de una apreciación de la divisa (+1,9%). El ratio combinado se sitúa en el 104,0% (+8,9 p.p.) y el resultado asciende a 41,7 millones (frente a 38,3 millones en 9M 2025).
-
En Colombia, las primas alcanzan los 414 millones (-2,6%), favorecidas por la apreciación de la divisa (+14,0%), y caen en moneda local (-14,6%). El ratio combinado repunta hasta el 110,8% (+20,7 p.p.) debido a un incremento generalizado de la siniestralidad en Automóviles y por el terremoto del mes de agosto, que ha tenido un impacto atribuible de –7,5 millones. El resultado se sitúa en -10,8 millones (frente a 13,8 millones en 9M 2025).
Norteamérica presenta un resultado récord de 112 millones (+12,4%) y continúa mejorando el ratio combinado
-
Las primas ascienden a 1.954 millones (-4,3%), afectadas por la depreciación del dólar (-3,6%) mientras que se contraen un 0,7% en moneda local.
-
El ratio combinado de No Vida mejora hasta el 94,9% (-0,8 p.p.), gracias a las medidas técnicas y los ajustes de tarifas aplicados en los últimos años. El ratio combinado de Automóviles mejora hasta el 96,3% (-1,3 p.p.), mientras que Seguros Generales mantiene un nivel muy sólido de 86,9% (+3,8 p.p.).
-
Estados Unidos registra 1.719 millones en primas y un resultado de 106 millones (+24,2%), mientras que Puerto Rico obtiene primas por importe de 234 millones y un resultado de 5,8 millones (frente a 14,1 millones en 9M 2025).
-
Respecto a la adquisición de Safety Insurance, la operación avanza conforme al calendario previsto. Tras completarse la revisión por parte de las autoridades de competencia, quedan pendientes la celebración de la Junta Extraordinaria de Accionistas de Safety, prevista para el próximo 3 de noviembre, y la correspondiente autorización de las autoridades regulatorias de Massachusetts.
El resultado de EMEA continúa presionado por el negocio de Italia, reportando beneficios en el resto de la región
-
Las primas se sitúan en 1.335 millones (+8,1%), apoyadas fundamentalmente en la buena evolución del negocio de Vida en Malta, con avances en el resto de países.
-
Alemania mejora de forma relevante el beneficio y sitúa el ratio combinado por debajo del 100% (-10,9 p.p.).
-
El resultado de Turquía sigue reflejando el aumento de la siniestralidad, la depreciación de la lira turca (-12,2%) y los ajustes por hiperinflación. Estos últimos han tenido un efecto neto de -19,5 millones (-15,4 millones en 9M 2025). El resultado financiero continúa beneficiándose de los elevados tipos de interés del país.
-
Italia registra pérdidas de 15 millones tras reforzar durante el segundo trimestre las reservas de carteras de negocio no rentables.
-
La región en su conjunto registra pérdidas de 2,4 millones, frente a un beneficio de 7,1 millones en 9M 2025, y el ratio combinado se sitúa en el 107,3% (+0,6 p.p.).
Mapfre Re alcanza un resultado de 286 millones (+11,8%)
-
Las primas continúan afectadas por el entorno de mercado con tasas a la baja y se sitúan en 6.342 millones (-0,4%). El negocio de Reaseguro obtiene 5.004 millones (+1,0%), mientras que Global Risks genera 1.338 millones (-5,3%).
-
El ratio combinado se sitúa en el 95,3% (+1,5 p.p.). Respecto a los siniestros acaecidos durante los primeros nueve meses del año, destaca el terremoto de Colombia en el tercer trimestre, con un impacto atribuible estimado en 75 millones, además de las tormentas en Portugal y España en el mes de febrero y el terremoto de Venezuela en junio. Se mantiene el enfoque prudente en las reservas.
-
Las rentabilidades de la cartera de inversión han contribuido muy positivamente al resultado financiero de No Vida, que aumenta un 67,8%. Adicionalmente, el ajuste del perfil de riesgo de las carteras en el actual entorno de incertidumbre se ha traducido en la realización de plusvalías relevantes.
-
El resultado se sitúa en 286 millones, de los que 259 millones corresponden al negocio de Reaseguro con un ratio combinado de 95,5%, y 27 millones a Global Risks, con un ratio combinado del 92,9%.
3. Otra información de interés
Aprobación de un dividendo a cuenta de 8,0 céntimos
-
El Consejo de Administración ha aprobado un dividendo a cuenta de los resultados de 2026 de 8,0 céntimos por acción, que se abonará el próximo 26 de noviembre. Este dividendo es un 14,3% superior al dividendo a cuenta del ejercicio anterior.
-
De este modo, el dividendo total pagado durante el año 2026 ascenderá a 19,0 céntimos por acción (+15,2% frente al dividendo pagado en el año 2025).
Advertencia:
Información adicional y dónde encontrarla
En relación con la operación propuesta, Safety Insurance Group, Inc. (“Safety”) presentó ante la Securities and Exchange Commission (la “SEC”) un proxy statement (o declaración de representación) definitivo. El proxy statement definitivo se remitió por primera vez a los accionistas de Safety en torno al 14 de septiembre de 2026. Safety podrá, asimismo, presentar ante la SEC otros documentos relevantes en relación con la operación propuesta y cuestiones relacionadas. Esta comunicación no sustituye al proxy statement ni a ningún otro documento que Safety pueda presentar ante la SEC. SE INSTA A LOS ACCIONISTAS DE SAFETY A LEER EL PROXY STATEMENT (INCLUIDAS CUALESQUIERA MODIFICACIONES O SUPLEMENTOS AL MISMO Y LOS DOCUMENTOS INCORPORADOS POR REFERENCIA EN ÉL), ASÍ COMO OTROS DOCUMENTOS RELEVANTES RELACIONADOS CON LA OPERACIÓN PROPUESTA QUE SAFETY PRESENTE ANTE LA SEC CUANDO ESTÉN DISPONIBLES, YA QUE CONTENDRÁN INFORMACIÓN IMPORTANTE SOBRE LA OPERACIÓN PROPUESTA Y LAS PARTES PARTICIPANTES EN DICHA OPERACIÓN. Los accionistas e inversores pueden obtener gratuitamente copias del proxy statement y de otros materiales relevantes (cuando estén disponibles), así como de otros documentos presentados por Safety ante la SEC, a través de la página web de la SEC. Asimismo, podrán obtenerse, sin coste alguno, copias del proxy statement y de los documentos incorporados por referencia en el mismo contactando con el departamento de Relaciones con Inversores de Safety en [email protected] o en el teléfono (877) 951-2522.
Participantes en la solicitud
Safety, Mapfre USA Corp. y sus respectivos consejeros y directivos ejecutivos pueden ser considerados, conforme a las normas de la SEC, participantes en la solicitud de proxies en relación con la operación propuesta. La información relativa a los consejeros y directivos ejecutivos de Safety está disponible en: (a) el Informe Anual de Safety en el Formulario 10-K correspondiente al ejercicio finalizado el 31 de diciembre de 2025, incluyendo las secciones “Item 10. Directors, Executive Officers and Corporate Governance,” “Item 11. Executive Compensation”, “Item 12. Security Ownership of Certain Beneficial Owners and Management and Related Stockholder Matters” y “Item 13. Certain Relationships, Related Transactions, and Director Independence,”, presentado ante la SEC el 27 de febrero de 2026, y que puede encontrarse en www.sec.gov; (b) el proxy statement definitivo de Safety para su junta anual de accionistas de 2026, presentado ante la SEC el 31 de marzo de 2026, bajo los epígrafes “Proposal 1: Election of the Company’s Directors,” “Executive Officers,”, “Executive Compensation,” “Director Compensation” y “Security Ownership of Certain Beneficial Owners, Directors and Management,”, y que puede encontrarse en www.sec.gov; y (c) los Informes en el Formulario 8-K (Current Reports) y los Informes Trimestrales en el Formulario 10-Q presentados con posterioridad. En la medida en que la tenencia de valores de Safety por sus consejeros o directivos ejecutivos haya variado desde las cantidades reflejadas en el proxy statement correspondiente a la junta anual de accionistas de 2026, dichos cambios se han reflejado o se reflejarán en los Formularios 3, 4 y 5 presentados ante la SEC (que pueden encontrarse en www.sec.gov). Las copias de los documentos presentados por Safety ante la SEC estarán disponibles gratuitamente a través la página web de la SEC y de la página web de Safety (https://www.safetyinsurance.com/about/financial.html). Los accionistas de Safety pueden obtener información adicional sobre los intereses de dichos participantes leyendo el proxy statement definitivo, incluido el epígrafe “The Merger—Interests of Directors and Executive Officers in the Merger”, y otros materiales relevantes relativos a la operación propuesta cuando estén disponibles. Podrán obtenerse copias de estos documentos gratuitamente de las fuentes indicadas anteriormente.
Advertencia relativa a las declaraciones prospectivas
Esta comunicación contiene declaraciones prospectivas (forward-looking statements) en el sentido de la Sección 27A de la Securities Act de 1933, en su versión modificada, la Norma 175 promulgada al amparo de dicha ley, la Sección 21E de la Securities Exchange Act de 1934, en su versión modificada, y la Norma 3b-6 promulgada al amparo de esta última. Dichas declaraciones incluyen manifestaciones relativas a acontecimientos futuros esperados y expectativas que no constituyen hechos históricos. Cualquier declaración relativa a los planes, objetivos, expectativas, estrategias, creencias o resultados futuros de Safety y/o Mapfre, S.A. (“Mapfre”), así como a acontecimientos futuros, constituye una declaración prospectiva. Las declaraciones prospectivas suelen identificarse mediante términos tales como “cree”, “espera”, “anticipa”, “pretende”, “objetivo”, “estima”, “continúa”, “posiciona”, “planifica”, “predice”, “proyecta”, “prevé”, “orientación”, “meta”, “objetivo”, “perspectivas”, “posible” o “potencial”, mediante verbos condicionales de futuro como “asumirá”, “será”, “debería”, “podría” o “puede”, así como por variaciones de dichos términos o expresiones similares, o sus formas negativas.
Estas declaraciones prospectivas incluyen, entre otras cuestiones, declaraciones relativas a los beneficios esperados de la operación propuesta, incluidos futuros resultados financieros y operativos; los planes, objetivos, expectativas e intenciones de Safety y/o Mapfre; el calendario previsto para la consumación de la operación propuesta; y otras declaraciones que no constituyen hechos históricos. Los resultados reales pueden diferir sustancialmente de los expresados o implícitos en las declaraciones prospectivas debido a diversos factores, incluyendo, entre otros: (A) riesgos relacionados con la consumación de la operación propuesta, incluidos los riesgos de que: (i) la operación no se complete dentro del plazo previsto o no llegue a completarse; (ii) no se obtenga la aprobación de los accionistas de Safety al acuerdo de fusión; (iii) no se obtengan las autorizaciones regulatorias o gubernamentales necesarias, incluidas las del Massachusetts Commissioner of Insurance; (iv) no se cumplan otras condiciones para la consumación de la operación previstas en el acuerdo de fusión; (B) los efectos que una eventual terminación del acuerdo de fusión pueda tener sobre el negocio de Safety y/o Mapfre, incluido el riesgo de que la cotización de sus acciones disminuya significativamente si la operación no se completa; (C) los efectos que el anuncio o la pendencia de la operación propuesta puedan tener sobre los negocios de Safety y/o Mapfre, incluidos los riesgos de que: (i) el negocio, los resultados operativos o la cotización de las acciones de Safety y/o Mapfre se vean perjudicados; (ii) los planes y operaciones actuales de Safety y/o Mapfre se vean alterados; (iii) la capacidad de Safety y/o Mapfre para retener o contratar empleados clave resulte afectada negativamente; (iv) las relaciones comerciales de Safety y/o Mapfre (incluyendo clientes, asegurados, agentes, proveedores de servicios y socios comerciales) se vean perjudicadas; (v) la atención de la dirección o de los empleados de Safety y/o Mapfre se desvíe de otros asuntos importantes; (D) el efecto de las limitaciones impuestas por el acuerdo de fusión sobre la capacidad de Safety para gestionar su negocio, devolver capital a los accionistas o participar en operaciones alternativas; (E) la naturaleza, coste y resultado de litigios actuales o futuros y otros procedimientos legales, incluidos los relacionados con la operación propuesta e iniciados contra Safety y/o Mapfre y otros; (F) el riesgo de que la operación propuesta y las operaciones relacionadas impliquen costes, pasivos o retrasos inesperados, o de que los beneficios previstos no se materialicen o no lo hagan dentro del plazo esperado, así como el riesgo de que Mapfre y Safety no se integren con éxito o que dicha integración resulte más difícil, larga o costosa de lo previsto; (G) otros factores económicos, empresariales, competitivos, legales, regulatorios y/o fiscales; y (H) otros factores descritos en los informes de Safety presentados ante la SEC, incluidos, entre otros, los riesgos descritos en su Informe Anual en Formulario 10-K correspondiente al ejercicio finalizado el 31 de diciembre de 2025, presentado ante la SEC el 27 de febrero de 2026, y en sus Informes Trimestrales en Formulario 10-Q, así como aquellos otros factores descritos o actualizados periódicamente en las restantes presentaciones de Safety ante la SEC. Todas las declaraciones prospectivas atribuibles a Safety y/o Mapfre, o a personas que actúen en su nombre, están expresamente sujetas en su totalidad a esta advertencia. Además, Safety y/o Mapfre rechazan cualquier obligación de actualizar la información contenida en esta comunicación o de anunciar públicamente los resultados de cualquier revisión de las declaraciones prospectivas para reflejar acontecimientos o desarrollos futuros, salvo cuando así lo exija la legislación aplicable. Se advierte a los accionistas existentes que no depositen una confianza indebida en estas declaraciones prospectivas, las cuales se refieren únicamente a la fecha de la presente comunicación.
Comparte en


Quizá te puede interesar

Corporativo
Nueva subida del dividendo
Se trata de la sexta mejora consecutiva de la retribución al accionista en los últimos tres años. Con este aumento, el dividendo total correspondiente al ejercicio 2026 alcanzará los 1...

Corporativo
Mapfre celebra su gran evento anual sobre activos reales
El evento ha contado con la presencia de decenas de inversores y profesionales del sector, así como la participación de las firmas JLL, Mutualidad de la Abogacía, Manova Partners, Fort...

Corporativo
El aumento de los costes de reparación pone en peligro una movilidad al alcance de todos
Los principales institutos de investigación del automóvil a nivel mundial se reúnen esta semana en Ciudad de México con motivo de la Conferencia anual internacional de RCAR (Research C...

Corporativo
Marta Silva se incorporará a Mapfre como consejera independente
Mapfre someterá a la próxima Junta General de Accionistas el nombramiento de Marta Silva de Lapuerta como consejera independiente de Mapfre S.A. Sustituirá en el Consejo a Antonio Góme...

Centro de preferencias de la privacidad (Configuración de cookies)
Cuando visita un sitio web, éste puede almacenar o recuperar información en su navegador, principalmente en forma de cookies. Esta información puede ser sobre usted, sus preferencias o su dispositivo y se utiliza principalmente para lograr que el sitio funcione como se espera. La información generalmente no lo identifica en forma directa, pero puede brindarle una experiencia web más personalizada.
Respetamos su privacidad por lo que puede excluir algunos tipos de cookies haciendo clic en los diferentes encabezados de categorías de cookies para obtener más información y cambiar nuestra configuración predeterminada. Sin embargo, si bloquea algunos tipos de cookies, su experiencia de uso en el sitio web y los servicios que podemos ofrecerle pueden verse afectados.
Aceptar
Gestionar las preferencias de consentimiento
Cookies estrictamente necesarias
Activas siempre
Estas cookies se utilizan para que el sitio web funcione y para que puedas navegar a zonas seguras. No podemos desactivarlas, pero si aun así quieres, puedes hacerlo a través de la configuración de tu navegador. Al hacerlo es muy probable que la página web no funcione, ya que son cookies necesarias.
Más información acerca de estas cookies
Cookies Analíticas
Cookies Analíticas
Se utilizan para recabar estadísticas de actividad del usuario. Entre otros, se analizan el número de usuarios que visitan el sitio web, el número de páginas visitadas, así como la actividad de los usuarios en el sitio web y su frecuencia de utilización. La información recopilada siempre es anónima de tal forma que no se podrá establecer un vínculo entre ésta y la persona física a quién se refiere.
Más información acerca de estas cookies
Cookies Funcionales
Cookies Funcionales
Estas cookies permiten mejorar la funcionalidad, como vídeos y chats en línea. Es posible que las establezcamos nosotros o proveedores externos cuyos servicios están integrados en nuestras páginas. Si no permites estas cookies, es posible que algunas o todas estas prestaciones no funcionen correctamente. Un ejemplo serían las cookies de reproductores multimedia, que se utilizan para almacenar datos técnicos con vistas a reproducir contenidos de video o de audio.
Además, gracias a ellas el contenido se ajusta a tu uso. Permiten recordar información para personalizar tu experiencia.
Más información acerca de estas cookies
Cookies de Marketing
Cookies de Marketing
Estas cookies posibilitan la personalización y adecuación de las comunicaciones publicitarias que se te muestran, de acuerdo con tus preferencias. Además, permiten personalizar algunas de las opciones generales de la página web, gracias a los datos de navegación. También se usan para integrar las redes sociales en nuestro site y que el usuario tenga la posibilidad de compartir en redes sociales los contenidos de interés.
Más información acerca de estas cookies
Lista de proveedores
Clear
Apply Cancel
Leg.Interest
checkbox label label
checkbox label label
checkbox label label
Rechazar

Hola, ¿en qué te puedo ayudar?