CAF reports financial information for the third quarter of 2026.
Bull 3
Bear 0
Results
|
Construcciones y Auxiliar de Ferrocarriles, S.A. is a manufacturer of integrated transport systems, specializing in rail and bus solutions for urban and interurban mobility. The company designs, supplies, and operates trains, trams, and zero-emission electric and hydrogen buses, alongside components, signaling systems, and turnkey mobility services. Its product portfolio covers the full lifecycle of transport projects, from feasibility studies to operation and maintenance. CAF serves transport authorities globally, with production facilities located in Spain, France, the United Kingdom, Poland, the United States, Mexico, and Brazil, supported by maintenance centers on five continents. Summarised from the company's own disclosures, fiscal year ended Dec 2025 |
Industry Aerospace & Defense | Homepage cafmobility.com |
| Sector Industrials | IR page cafmobility.com | |
|
Tags
railway vehicles, urban buses, electric buses, hydrogen buses, signaling systems, turnkey transport solutions, maintenance services, sustainable mobility
|
Press page — |
Metrics
| Valuation | |
|---|---|
| Market cap | € 1.302B |
| Market cap (USD) | $ 1.439B |
| P/E | 7.55 |
| PEG | 0.18 |
| P/BV | 1.25 |
| P/S | 0.27 |
| P/OCF | 7.24 |
| P/FCF | 18.52 |
| Dividend yield | — |
| Turnover / mcap | — |
| Returns | |
|---|---|
| ROE | 16.1% |
| ROI | 9.4% |
| ROIC | 10.8% |
| Profit margin | 3.4% |
| Growth | |
|---|---|
| Revenue growing | Yes |
| Profits growing | Yes |
| Revenue up 3y | Yes |
| Revenue up 5y | Yes |
| Earnings growth 3y (net profit CAGR) | 41.0% |
| Quality | |
|---|---|
| Profitable | Yes |
| Margin expanding | Yes |
| Buying back stock | No |
| Diluting (TTM) | — |
| Debt/Equity | 62.2% |
| Podcast bulls (TTM) | Sign up |
| Podcast bears (TTM) | Sign up |
| Podcast sentiment (TTM) | Sign up |
| Podcast sentiment % (TTM) | Sign up |
| News sentiment (TTM) | 11 |
| Quality score | 52.9% |
| Insiders | |
|---|---|
| Buys, 1w | Sign up |
| Buys, 1m | Sign up |
| Buys, 1y | Sign up |
| Sells, 1w | Sign up |
| Sells, 1m | Sign up |
| Sells, 1y | Sign up |
Sign up to see this company's insider trades
| Figure | FY 2025 | FY 2024 | FY 2023 | FY 2022 | FY 2021 | FY 2020 | FY 2019 | FY 2018 | FY 2017 | FY 2016 | FY 2015 | FY 2014 | FY 2013 | FY 2012 | FY 2011 | FY 2010 |
|---|---|---|---|---|---|---|---|---|---|---|---|---|---|---|---|---|
| Revenue | 4.487B | 4.212B | 3.825B | 3.165B | 2.943B | 2.762B | 2.598B | 2.048B | 1.477B | 1.318B | 1.284B | 1.447B | 1.535B | 1.721B | 1.725B | 1.576B |
| Net profit | 151.36M | 107.646M | 92.317M | 54.864M | 88.771M | 10.253M | 25.09M | 39.62M | 42.517M | 37.28M | 42.614M | 62.129M | 91.037M | 100.054M | 141.449M | 125.44M |
| Free cash flow | 70.292M | 98.767M | — | 33.424M | 108.957M | 127.853M | — | — | — | — | — | — | — | — | — | — |
Filed figures
Lines the statements and their notes report beside the headline figures, read from the filings' XBRL as filed (no restatement applied), with figures computed from one filing's own lines. Cash-flow lines carry their cash direction: an outflow is negative. Each period links to its filing; a figure's period, report date and tag are in its tooltip.
| Figure | Dec 2020 | Dec 2021 | Dec 2022 | Dec 2023 | Dec 2024 | Dec 2025 |
|---|---|---|---|---|---|---|
| Balance sheet detail | ||||||
| Trade receivables (EUR) | 1.36B | 1.51B | 1.9B | 2.21B | 2.26B | 2.49B |
| ↳ YoY growth | +11.4% | +26.0% | +16.0% | +2.5% | +9.9% | |
| ↳ 5y CAGR | +12.9% | |||||
| Other receivables (EUR) | 171M | 168M | 215M | 196M | 209M | 229M |
| Borrowings, current (EUR) | 171M | 283M | 278M | 303M | 273M | 178M |
| Borrowings, non-current (EUR) | 809M | 676M | 590M | 509M | 549M | 614M |
| Cash and deposits (EUR) | 574M | 551M | 473M | 443M | 574M | 598M |
| Intangible assets (EUR) | 221M | 223M | 255M | 284M | 287M | 278M |
| Net debt (borrowings + leases - cash) (EUR) | 406M | 407M | 395M | 369M | 249M | 194M |
| Cash flow detail | ||||||
| Operating cash flow (EUR) | 177M | 154M | 111M | 106M | 185M | 184M |
| Purchases of property, plant and equipment (EUR) | -49.3M | -44.6M | -77.5M | -78.9M | -86.1M | -114M |
| Change in receivables (cash effect) (EUR) | 1.65M | -136M | — | — | — | — |
| Change in inventories (cash effect) (EUR) | -19.5M | 7.54M | — | — | — | — |
| Change in payables (cash effect) (EUR) | 431,000 | 8.1M | — | — | — | — |
| Dividends paid (cash effect) (EUR) | -821,000 | -29.1M | -36.2M | -32.6M | -41.5M | -50.1M |
| Share buybacks (cash effect) (EUR) | -3.81M | 0.00 | -1.38M | — | — | — |
| Interest paid (cash effect) (EUR) | -53.1M | -39.8M | -46.7M | -51.7M | -52.5M | -38.1M |
| Income taxes paid (cash effect) (EUR) | 38.3M | 36.7M | 54.6M | 49M | 59.7M | 75M |
| Operating cash flow before change in receivables (EUR) | 176M | 290M | — | — | — | — |
| Free cash flow (OCF - PPE - intangibles) (EUR) | 128M | 109M | 33.4M | 27.2M | 98.8M | 70.3M |
| Income detail | ||||||
| Total comprehensive income (EUR) | -71.5M | 110M | 73.8M | 112M | 69.4M | 151M |
| Comprehensive income to owners (EUR) | 72.3M | -107M | -71.2M | -109M | -64.8M | -146M |
| Reported | Feb 25, 2022 | Feb 25, 2022 | Feb 24, 2023 | — | Feb 27, 2026 | Feb 27, 2026 |
Sign up to see institutional holdings
Sign UpPodcast Mentions
Sign up to see podcast mentions and sentiment
Sign UpInside information and other relevant information filed with the CNMV, newest first, titles as filed, own-share transactions and liquidity-contract reports included. The link opens the filed document. Press releases from the company's own website, newest first.
The Company's Board of Directors has approved the Strategic Plan 2027-2030.
Bull 0
Bear 0
Routine
CAF alcanza 273 km en modo batería durante las pruebas de autonomía en el circuito de ensayos de Wildenrath
Bull 1
Bear 0
Product/operations
Volver
Compartir
Copiar enlaceFacebook LinkedIn WhatsApp
Las pruebas realizadas con un vehículo de la serie Clase 557 para VRR (Verkehrsverbund Rhein-Ruhr) facilitarán una información de gran valor para el desarrollo de los futuros proyectos de unidades BEMU.
CAF ha realizado las pruebas de autonomía con una unidad múltiple eléctrica (BEMU) de la plataforma Civity en el centro de pruebas y homologación de Wildenrath, en Alemania. El vehículo probado fue una unidad Clase 557 de tamaño corto, equipada con baterías de tracción LTO (óxido de titanato de litio) de producción estándar.
Durante las pruebas, el vehículo alcanzó una autonomía de 273 km operando exclusivamente con energía de batería. Además, se evaluó el rendimiento del sistema de tracción en condiciones de operación extremas. Los datos y la información obtenidos serán incorporados al desarrollo de tecnologías de propulsión eléctrica eficientes.
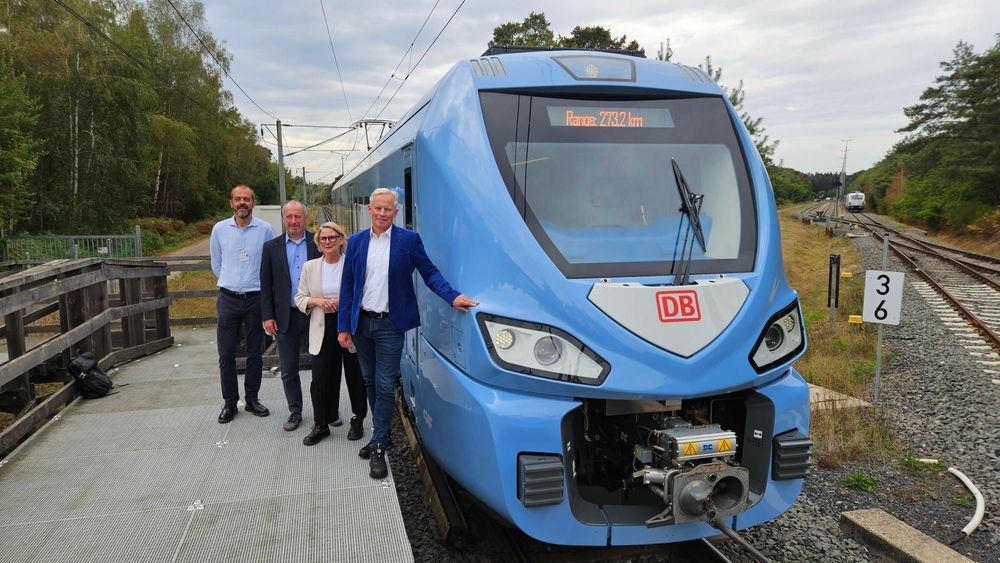
Además de la autonomía alcanzada, la prueba se centró especialmente en la interacción entre el sistema de control del vehículo, la gestión de la energía y el comportamiento de la batería. Los datos de medición registrados se compararán ahora con los resultados generados por los modelos de simulación utilizados durante el proceso inicial de desarrollo.
Contribuyendo a la descarbonización de las redes ferroviarias regionales
Las unidades múltiples eléctricas de batería se consideran una tecnología clave para la continua descarbonización del transporte ferroviario regional. Permiten la operación sin emisiones en tramos ferroviarios no electrificados y ofrecen una alternativa a los vehículos diésel sin necesidad de electrificar completamente la ruta.
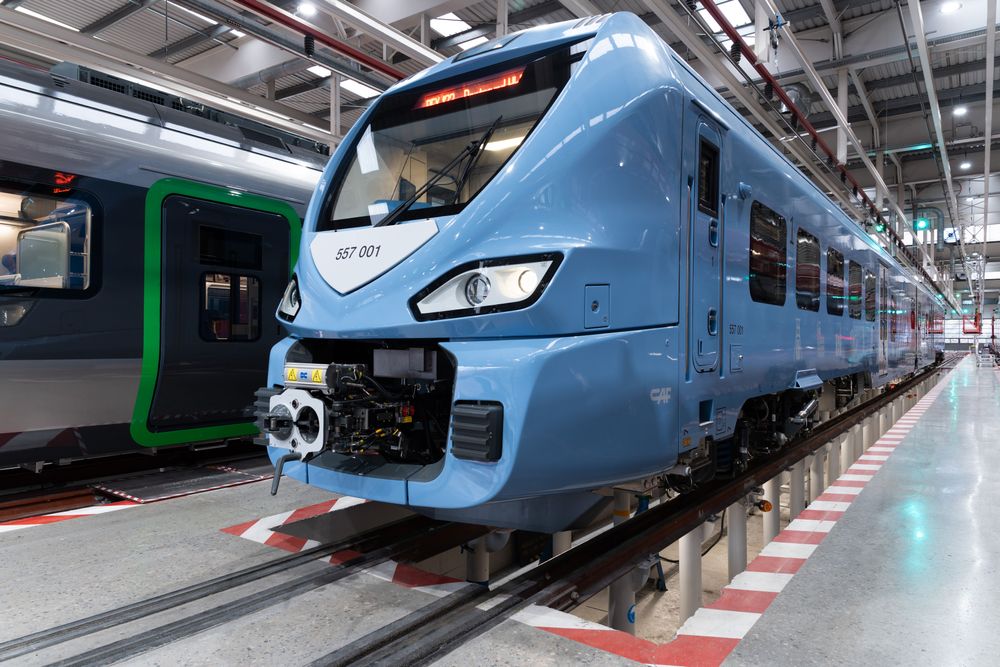
Un tren eléctrico de batería Clase 557 se exhibirá en InnoTrans 2026 en Berlín, donde se presentará por primera vez ante el público internacional del sector.
 .
Conócenos Soluciones Accionistas e inversores Actualidad Talento Contacto
Síguenos
Marca
Sistema interno de información
(canales de denuncias)
trust
in motion
© CAF, Construcciones y Auxiliar de Ferrocarriles, S.A. 2026
Construcciones y Auxiliar de Ferrocarriles
© CAF S.A. 2026
Aviso legal Política de cookies Política de privacidad Accesibilidad




Prompts
Click prompts to add them under the company line, click again to take one out, then copy the result into your AI chat. Shared by Asian Century Stocks and Uncovered Thai Stocks. Thank you.
CONSTRUCCIONES Y AUXILIAR DE FERROCARRILES, S.A. (ticker CAF), listed in Spain.
Copied
ETFs Holding CONSTRUCCIONES Y AUXILIAR DE FERROCARRILES, S.A.
Exchange-traded funds whose newest published daily portfolio holds one of the company's listings, largest weight first.
| ETF | Weight in ETF | Shares | Market value | As of |
|---|---|---|---|---|
| OAIM | 2.16% | 101,919 | $ 8.407M | Aug 31, 2026 |
| AVDV | 0.07% | 177,892 | $ 13.283M | Nov 16, 2026 |
| AVDS | 0.05% | 2,670 | $ 199.365K | Nov 16, 2026 |
| DFIS | 0.04% | 26,673 | $ 2.037M | Nov 12, 2026 |
| DXIV | 0.03% | 942 | $ 71.93K | Nov 12, 2026 |
| AVSD | 0.02% | 855 | $ 63.842K | Nov 16, 2026 |
| DFAX | 0.02% | 24,539 | $ 1.874M | Nov 12, 2026 |
| DFIC | 0.01% | 28,156 | $ 2.15M | Nov 12, 2026 |
| DFSI | 0.01% | 2,086 | $ 159.284K | Nov 12, 2026 |
| AVDE | 0.01% | 19,587 | $ 1.463M | Nov 16, 2026 |
| DFAI | 0.01% | 17,087 | $ 1.305M | Nov 12, 2026 |