Antes de continuar, te explicamos para qué usamos las cookies. Este sitio web de CaixaBank S. A. recoge datos sobre tu navegación a través de cookies propias y de terceros para: Analizarlos para mejorar productos y servicios. Personalizarte el…
Antes de continuar, te explicamos para qué usamos las cookies.
Este sitio web de CaixaBank S. A. recoge datos sobre tu navegación a través de cookies propias y de terceros para:
- Analizarlos para mejorar productos y servicios.
- Personalizarte el contenido (por ejemplo, recomendaciones de vídeos).
- Personalizarte la publicidad que visualizas sobre productos y servicios.
La personalización de contenido y publicidad está basada en un perfil tuyo creado a partir de tus datos de navegación (por ejemplo, los contenidos visualizados). Puedes conocer más sobre el uso de cookies en nuestra política de cookies(Abrir en ventana nueva)
Configurar cookies(Abrir en ventana nueva)
Rechazar
Aceptar
Ir al contenido central
Acción CABK (Abrir en ventana nueva)
 ES

Cerrar
Web comercial(Abrir en ventana nueva)
Sobre nosotros
Sobre nosotros

Si necesitas que la comunicación con tu banco sea accesible, aquí hacemos que lo sea
Más información
Sostenibilidad
Sostenibilidad

Asumimos la responsabilidad de impulsar una economía positiva para el bienestar de las personas, demostrando el valor social de la banca.
Ir a la sección
Accionistas e inversores
Accionistas e inversores

Accede a toda la información sobre los Resultados de CaixaBank del 3T 2026.
Ir a la sección
Personas
Personas

Wengage es nuestro programa de diversidad, donde impulsamos y visualizamos la igualdad de oportunidades y la diversidad de género, funcional y generacional.
Descubre Wengage
Actualidad
Actualidad

CaixaBank intensifica su oferta de tarjetas para viajar con imagin y MoneyToTravel
Más información
Esfera
Esfera

Esfera, la nueva plataforma de contenidos de CaixaBank
Más información
Información comercial (Abrir en ventana nueva)
 Caixabank (Ir a Inicio)

X
 Imprimir página
30 de Octubre de 2026, 06:30h | 12 min de lectura
CORPORATIVO REGULATORIAS
Nacional
CaixaBank obtiene 4.962 millones de euros de beneficio hasta septiembre, un 12,9% más, con fuerte crecimiento del negocio
#CaixaBank | #Fortaleza financiera | #Gonzalo Gortázar | #Resultados
Nota de prensa resultados CaixaBank 9M2026
212.3 KB
Presentación de resultados CaixaBank 9M2026
2.3 MB
Cuenta de pérdidas y ganancias y datos más relevantes 9M2026
75.9 KB
Infografía resultados CaixaBank 9M2026
811.8 KB
Transcripción del vídeo del CEO de CaixaBank, Gonzalo Gortázar
261.6 KB
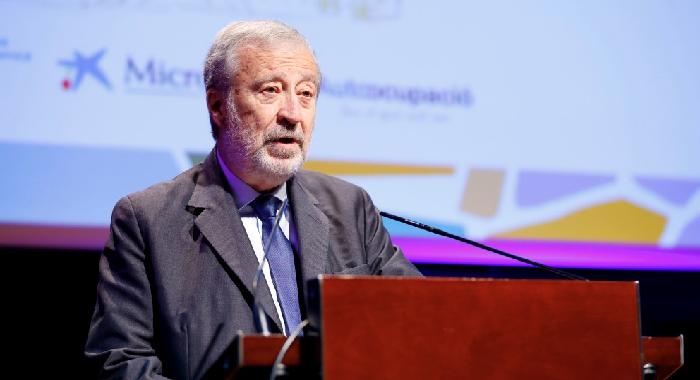
Imagen 1: Gonzalo Gortázar durante la presentación de resultados 9M2026
922.2 KB
Imagen 2 resultados CaixaBank 9M2026
946.4 KB
Imagen 3 resultados CaixaBank 9M2026
869.3 KB
Imagen 4 resultados CaixaBank 9M2026
799.6 KB
Imagen 5 resultados CaixaBank 9M2026
1.1 MB
Vídeo total del CEO de CaixaBank, Gonzalo Gortázar
Tamaño desconocido
Videonoticia
Tamaño desconocido
Vídeo compactado de recursos
Tamaño desconocido
Audio del CEO de CaixaBank, Gonzalo Gortázar
Tamaño desconocido
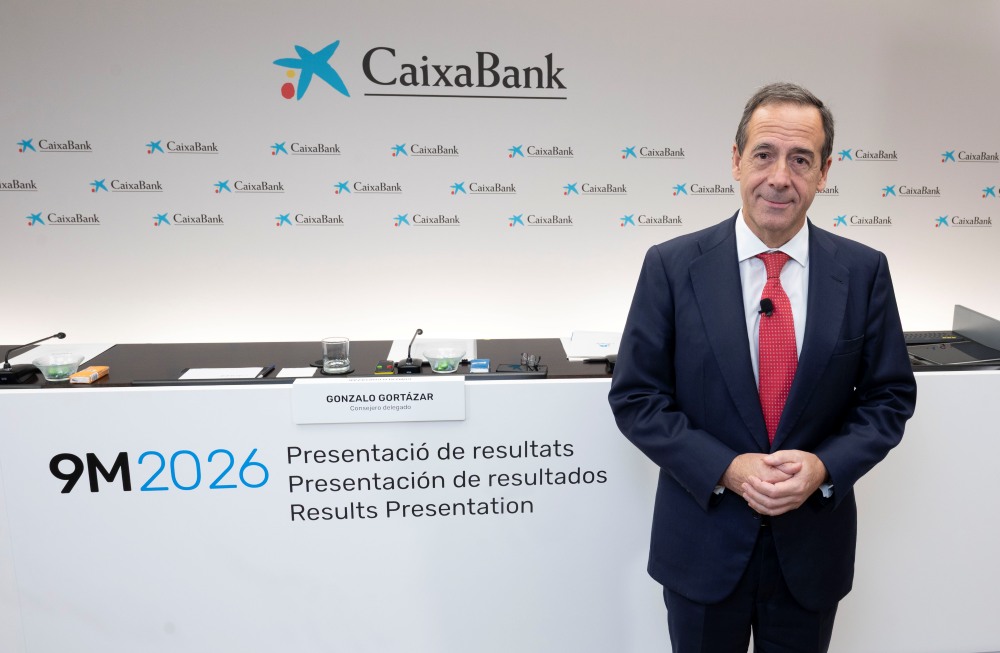
El consejero delegado de CaixaBank, Gonzalo Gortázar, durante la rueda de prensa de presentación de resultados 9M 2026.
El consejero delegado de CaixaBank, Gonzalo Gortázar, durante la rueda de prensa de presentación de resultados 9M 2026.
- El consejero delegado de la entidad, Gonzalo Gortázar, ha afirmado que “el balance de estos meses es muy positivo: crecemos de forma sólida y equilibrada, ganando clientes y aumentando nuestra actividad. Y lo hacemos gracias a nuestra posición de fortaleza que nos permite seguir acompañando a familias y empresas y generando valor para nuestros clientes, accionistas y para el conjunto de la sociedad”.
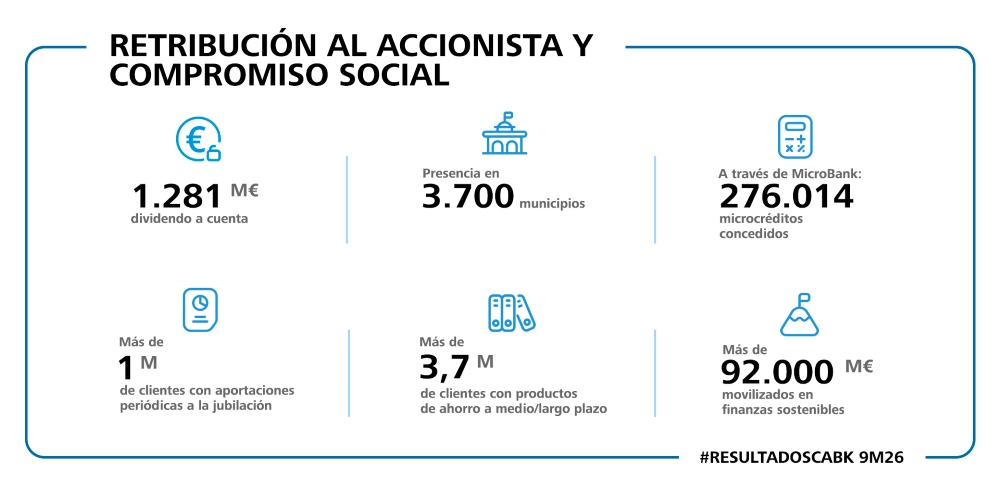
- El Consejo de Administración aprueba la distribución de un dividendo a cuenta por un importe de 1.281 millones de euros (18,44 céntimos brutos por acción), que se pagará el 6 de noviembre.
- El Grupo supera los 21 millones de clientes en España y Portugal, tras ganar cerca de 480.000 clientes netos en los últimos doce meses, y cuenta con una red de más de 4.500 oficinas.
- El margen de intereses asciende a 8.186 millones de euros entre enero y septiembre, lo que supone un alza del 2,9% interanual apoyado por el crecimiento en volúmenes; y los ingresos por servicios (gestión patrimonial, seguros de protección y comisiones bancarias) suben un 7,7%, hasta 4.182 millones.
- Intensa actividad comercial. El volumen de negocio mejora un 6,4% en tasa interanual, hasta 1,16 billones de euros, con una evolución muy positiva en crédito y recursos.
- Buen comportamiento de la financiación tanto a familias como a empresas, que eleva la cartera de crédito sano un 8% interanual, hasta 397.469 millones de euros.
- Los recursos de clientes alcanzan 760.353 millones de euros a septiembre, un 5,6% más respecto a un año antes, impulsados por la gestión patrimonial y la fortaleza de los depósitos.
- imagin, el neobanco impulsado por CaixaBank, cierra el periodo con 4,3 millones de clientes (+9% respecto a un año antes) y un volumen de negocio de alrededor de 24.300 millones de euros (+18%).
- Refuerzo de la posición financiera, con una tasa de morosidad que sigue a la baja y se sitúa en el 1,76%, unos confortables niveles de liquidez y una elevada capacidad de generación orgánica de capital.
- Compromiso social. CaixaBank está presente en unos 3.700 municipios con sucursal, cajero u ofimóvil, y cuenta con cerca de 469.000 titulares de cuentas de pago básicas.
Puedes acceder al contenido de vídeo cambiando tu configuración de cookies. Autoriza el uso de cookies de terceros en esta sección
del portal.
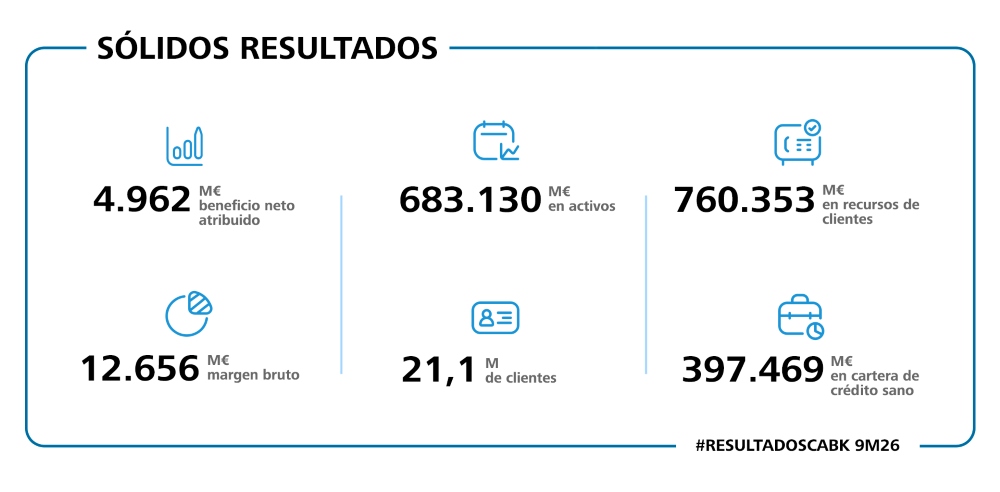
El Grupo CaixaBank ha obtenido un beneficio neto de 4.962 millones de euros entre enero y septiembre de 2026, lo que supone un aumento del 12,9% respecto al mismo periodo del ejercicio anterior (4.397 millones), apoyado en el crecimiento del negocio.
CaixaBank presta ya servicio a 21,1 millones de clientes en España y Portugal (con un crecimiento cercano a los 480.000 en un año), a través de una red que supera las 4.500 oficinas, y cuenta con más de 683.000 millones de euros en activos. La entidad acelera la actividad comercial y la captación, en el marco del Plan Estratégico 2025-2027, gracias a su vocación de servicio al cliente y a una plataforma diferencial de distribución omnicanal y capacidad multiproducto.
El consejero delegado de CaixaBank, Gonzalo Gortázar, ha afirmado que “el balance de estos meses es muy positivo: crecemos de forma sólida y equilibrada, ganando clientes y aumentando nuestra actividad. Y lo hacemos gracias a nuestra posición de fortaleza que nos permite seguir acompañando a familias y empresas y generando valor para nuestros clientes, accionistas y para el conjunto de la sociedad”.
Gortázar ha destacado, además, que “seguimos avanzando en el proceso de transformación de CaixaBank con el objetivo de ofrecer un mejor servicio a nuestros clientes. Estamos incorporando la inteligencia artificial y nuevas herramientas tecnológicas en toda la organización, con mejoras ya tangibles en la experiencia de cliente y en nuestra capacidad comercial”.
Dinámica positiva de la cuenta de resultados
La evolución de la cuenta de resultados mantiene una dinámica positiva entre enero y septiembre, y la rentabilidad (ROTE 12 meses) alcanza el 18,8% a final del periodo.
El margen de intereses se sitúa en 8.186 millones de euros en los nueve primeros meses del ejercicio, lo que supone un aumento del 2,9% en comparación con el mismo periodo de 2025 apoyado por el crecimiento en volúmenes.
Los ingresos por servicios (gestión patrimonial, seguros de protección y comisiones bancarias) se incrementan un 7,7% en tasa interanual, hasta 4.182 millones de euros. En concreto, los ingresos por gestión patrimonial suben un 12,5% (hasta 1.669 millones) por el mayor volumen gestionado, y los ingresos por seguros de protección lo hacen un 14,5% (hasta 1.000 millones). Mientras, las comisiones bancarias se reducen un 0,9% (hasta 1.513 millones), por la caída de las comisiones bancarias recurrentes (-2,1% debido, entre otros factores, a los programas de fidelización).
Los ingresos de la cartera de participadas alcanzan 349 millones de euros, con un crecimiento del 7,8% interanual, de los que 294 millones corresponden al resultado de entidades valoradas por el método de la participación (+10,9%) y 55 millones a ingresos por dividendos (-5,9%).
Respecto al margen bruto (ingresos totales), se incrementa un 4,4%, hasta 12.656 millones de euros a cierre del tercer trimestre; y el margen de explotación, con 7.653 millones, aumenta un 4,6%.
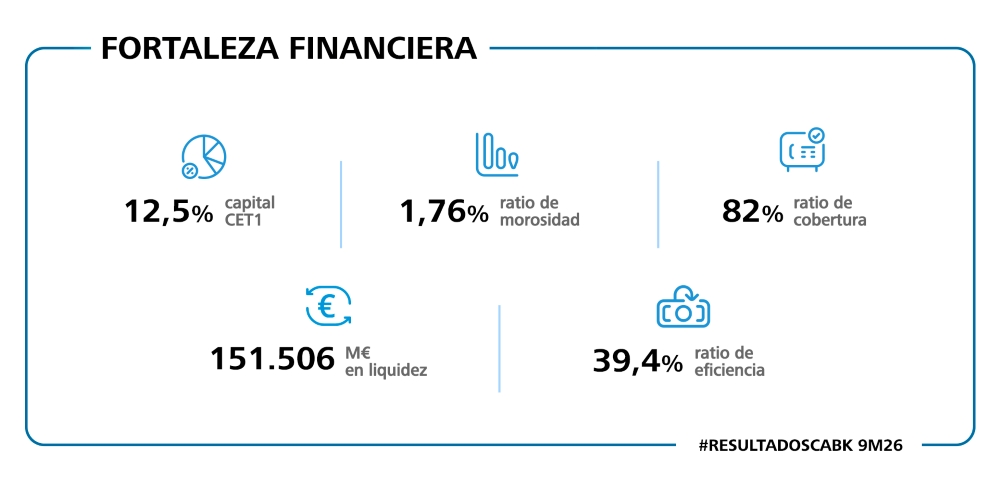
Por su parte, los gastos de administración y amortización suben un 4,3% en tasa interanual, hasta situarse en 5.004 millones entre enero y septiembre; y la ratio de eficiencia (12 meses) se sitúa en el 39,4%.
La cuenta de resultados se ve impactada también en 2026 por la contabilización del Impuesto sobre el margen de intereses y comisiones (IMIC), por una cuantía de 452 millones de euros en los nueve primeros meses del ejercicio, frente a los 446 millones del mismo periodo del año 2025.
Intensa actividad comercial
La entidad registra una intensa actividad comercial y el volumen de negocio mejora un 6,4% en tasa interanual, hasta 1,16 billones de euros a cierre de septiembre, con una evolución muy positiva en crédito y recursos.
El buen comportamiento de la financiación tanto a familias como a empresas eleva la cartera de crédito sano un 8% en tasa interanual, hasta 397.469 millones de euros. Por segmentos, la cartera de crédito sano en empresas aumenta en 19.404 millones de euros desde septiembre de 2025 (+11,4%); la de adquisición de vivienda lo hace en 9.551 millones (+7%); y la de consumo, en 2.195 millones (+9,8%).
En los préstamos para la adquisición de vivienda, CaixaBank mantiene su apuesta por operaciones hipotecarias que den seguridad al cliente de cuánto va a pagar cada mes durante toda la vida del préstamo, y el 60% de la cartera está referenciada ya a tipo fijo (frente al 20% del año 2021).
Por su parte, los recursos de clientes alcanzan 760.353 millones de euros a cierre de septiembre, un 5,6% más respecto a un año antes, impulsados por la gestión patrimonial y la fortaleza de los depósitos. Los activos bajo gestión avanzan un 10,6% interanual, hasta 216.333 millones. En concreto, el patrimonio gestionado en fondos de inversión, carteras y SICAVs asciende a 161.395 millones (+11,5%) y los planes de pensiones totalizan 54.938 millones de euros (+8,1%).
Además, los recursos en balance se incrementan un 3,8%, hasta 538.464 millones de euros, con alzas del 2,7% de los depósitos de clientes (hasta 438.932 millones) y del 11,3% en los pasivos por contratos de seguros (hasta 93.188 millones).
Las suscripciones netas en fondos de inversión, seguros de ahorro y planes de pensiones registran 15.199 millones de euros en los últimos doce meses (+17,9% interanual).
La cartera de seguros de protección refuerza también el positivo comportamiento, con incrementos de las primas del 11,6% en los últimos doce meses (+12,5% en primas de vida-riesgo y +11,1% en no-vida).
imagin, el neobanco impulsado por CaixaBank y palanca clave de captación y crecimiento del Grupo, cierra septiembre con 4,3 millones de clientes (un 9% más que un año antes) y un volumen de negocio de unos 24.300 millones de euros (+18% interanual).
Banco BPI, filial portuguesa 100% de CaixaBank, registra también un aumento continuado del volumen de negocio (+7% en los últimos doce meses) y consigue ganancias en cuotas de mercado. La contribución al resultado del Grupo de la actividad bancaria en Portugal es de 339 millones de euros entre enero y septiembre.
Caída de la morosidad, amplios niveles de liquidez y generación orgánica de capital
CaixaBank ha reforzado su posición financiera, una de las principales fortalezas del Grupo, con una tasa de morosidad que sigue a la baja y una tasa de cobertura al alza, unos confortables niveles de liquidez y una elevada capacidad de generación orgánica de capital.
Los saldos dudosos siguen en descenso un trimestre más, hasta 7.733 millones de euros a cierre de septiembre, gracias a la buena evolución orgánica de la calidad del activo. Así, la ratio de morosidad baja hasta el 1,76%. Los fondos para insolvencias se sitúan en 6.309 millones de euros y la ratio de cobertura mejora hasta el 82%. Además, el coste del riesgo (últimos 12 meses), con un 0,24%, se mantiene en niveles reducidos.
Por su parte, los activos líquidos totales son de 151.506 millones de euros y el Liquidity Coverage Ratio del Grupo (LCR) es del 178%, mostrando amplios niveles de liquidez y muy por encima del mínimo requerido del 100%.
En cuanto al capital, la ratio Common Equity Tier 1 (CET1) cierra septiembre en el 12,5%, que recoge el impacto extraordinario (-20 puntos básicos) del octavo programa de recompra de acciones, anunciado en abril, por 500 millones de euros.
La evolución de la ratio CET1 durante los nueve primeros meses, excluyendo el impacto extraordinario mencionado anteriormente, mejora en 14 puntos básicos y se explica por la generación de capital (+202 pb), minorada por la evolución orgánica de los activos ponderados por riesgo (-43 pb), la previsión de dividendo con cargo al ejercicio (payout 60%) y el pago del cupón de AT1 (-127 pb), y el comportamiento del mercado y otros (-18 pb).
Dividendo a cuenta en noviembre
El Consejo de Administración de CaixaBank aprobó el pasado enero el plan de dividendos para el ejercicio 2026, con la distribución en efectivo de entre el 50% y el 60% del beneficio neto consolidado, a abonar en dos pagos: un dividendo a cuenta por importe de entre el 30% y el 40% del beneficio neto consolidado correspondiente al primer semestre de 2026 (a abonar durante el mes de noviembre), y un dividendo complementario, sujeto a aprobación final por parte de la Junta General de Accionistas (a abonar en abril de 2027).
De acuerdo con dicho plan de dividendos, el Consejo ha aprobado en su última reunión la distribución de un dividendo a cuenta del 40% del beneficio neto consolidado del primer semestre de 2026, por un importe de 1.281 millones de euros (18,44 céntimos de euro brutos por acción), pagadero el próximo 6 de noviembre.
Una rentabilidad razonable y la elevada fortaleza financiera del Grupo permiten mantener una retribución adecuada a los accionistas, que revierte directamente a la sociedad, ya que alrededor del 50% del dividendo lo reciben la Fundación ”la Caixa” y el FROB. Además, la entidad cuenta con más de 500.000 accionistas (cierre de septiembre de 2026), en su inmensa mayoría minoristas.
Compromiso con la sociedad
CaixaBank, en el marco de su compromiso con las personas y la sociedad, está presente en unos 3.700 municipios con sucursal, cajero u ofimóvil, y cuenta con cerca de 469.000 titulares de cuentas de pago básicas. Además, la entidad fomenta el ahorro para el futuro: más de un millón de clientes realizan aportaciones periódicas a la jubilación y más de 3,7 millones tienen productos de ahorro a medio y largo plazo.
Respecto al impulso a emprendedores, a través de MicroBank, el banco social de CaixaBank, se han concedido 276.014 microcréditos en los últimos doce meses por importe de 2.455 millones de euros, y se ha facilitado la creación de más de 28.000 puestos de trabajo.
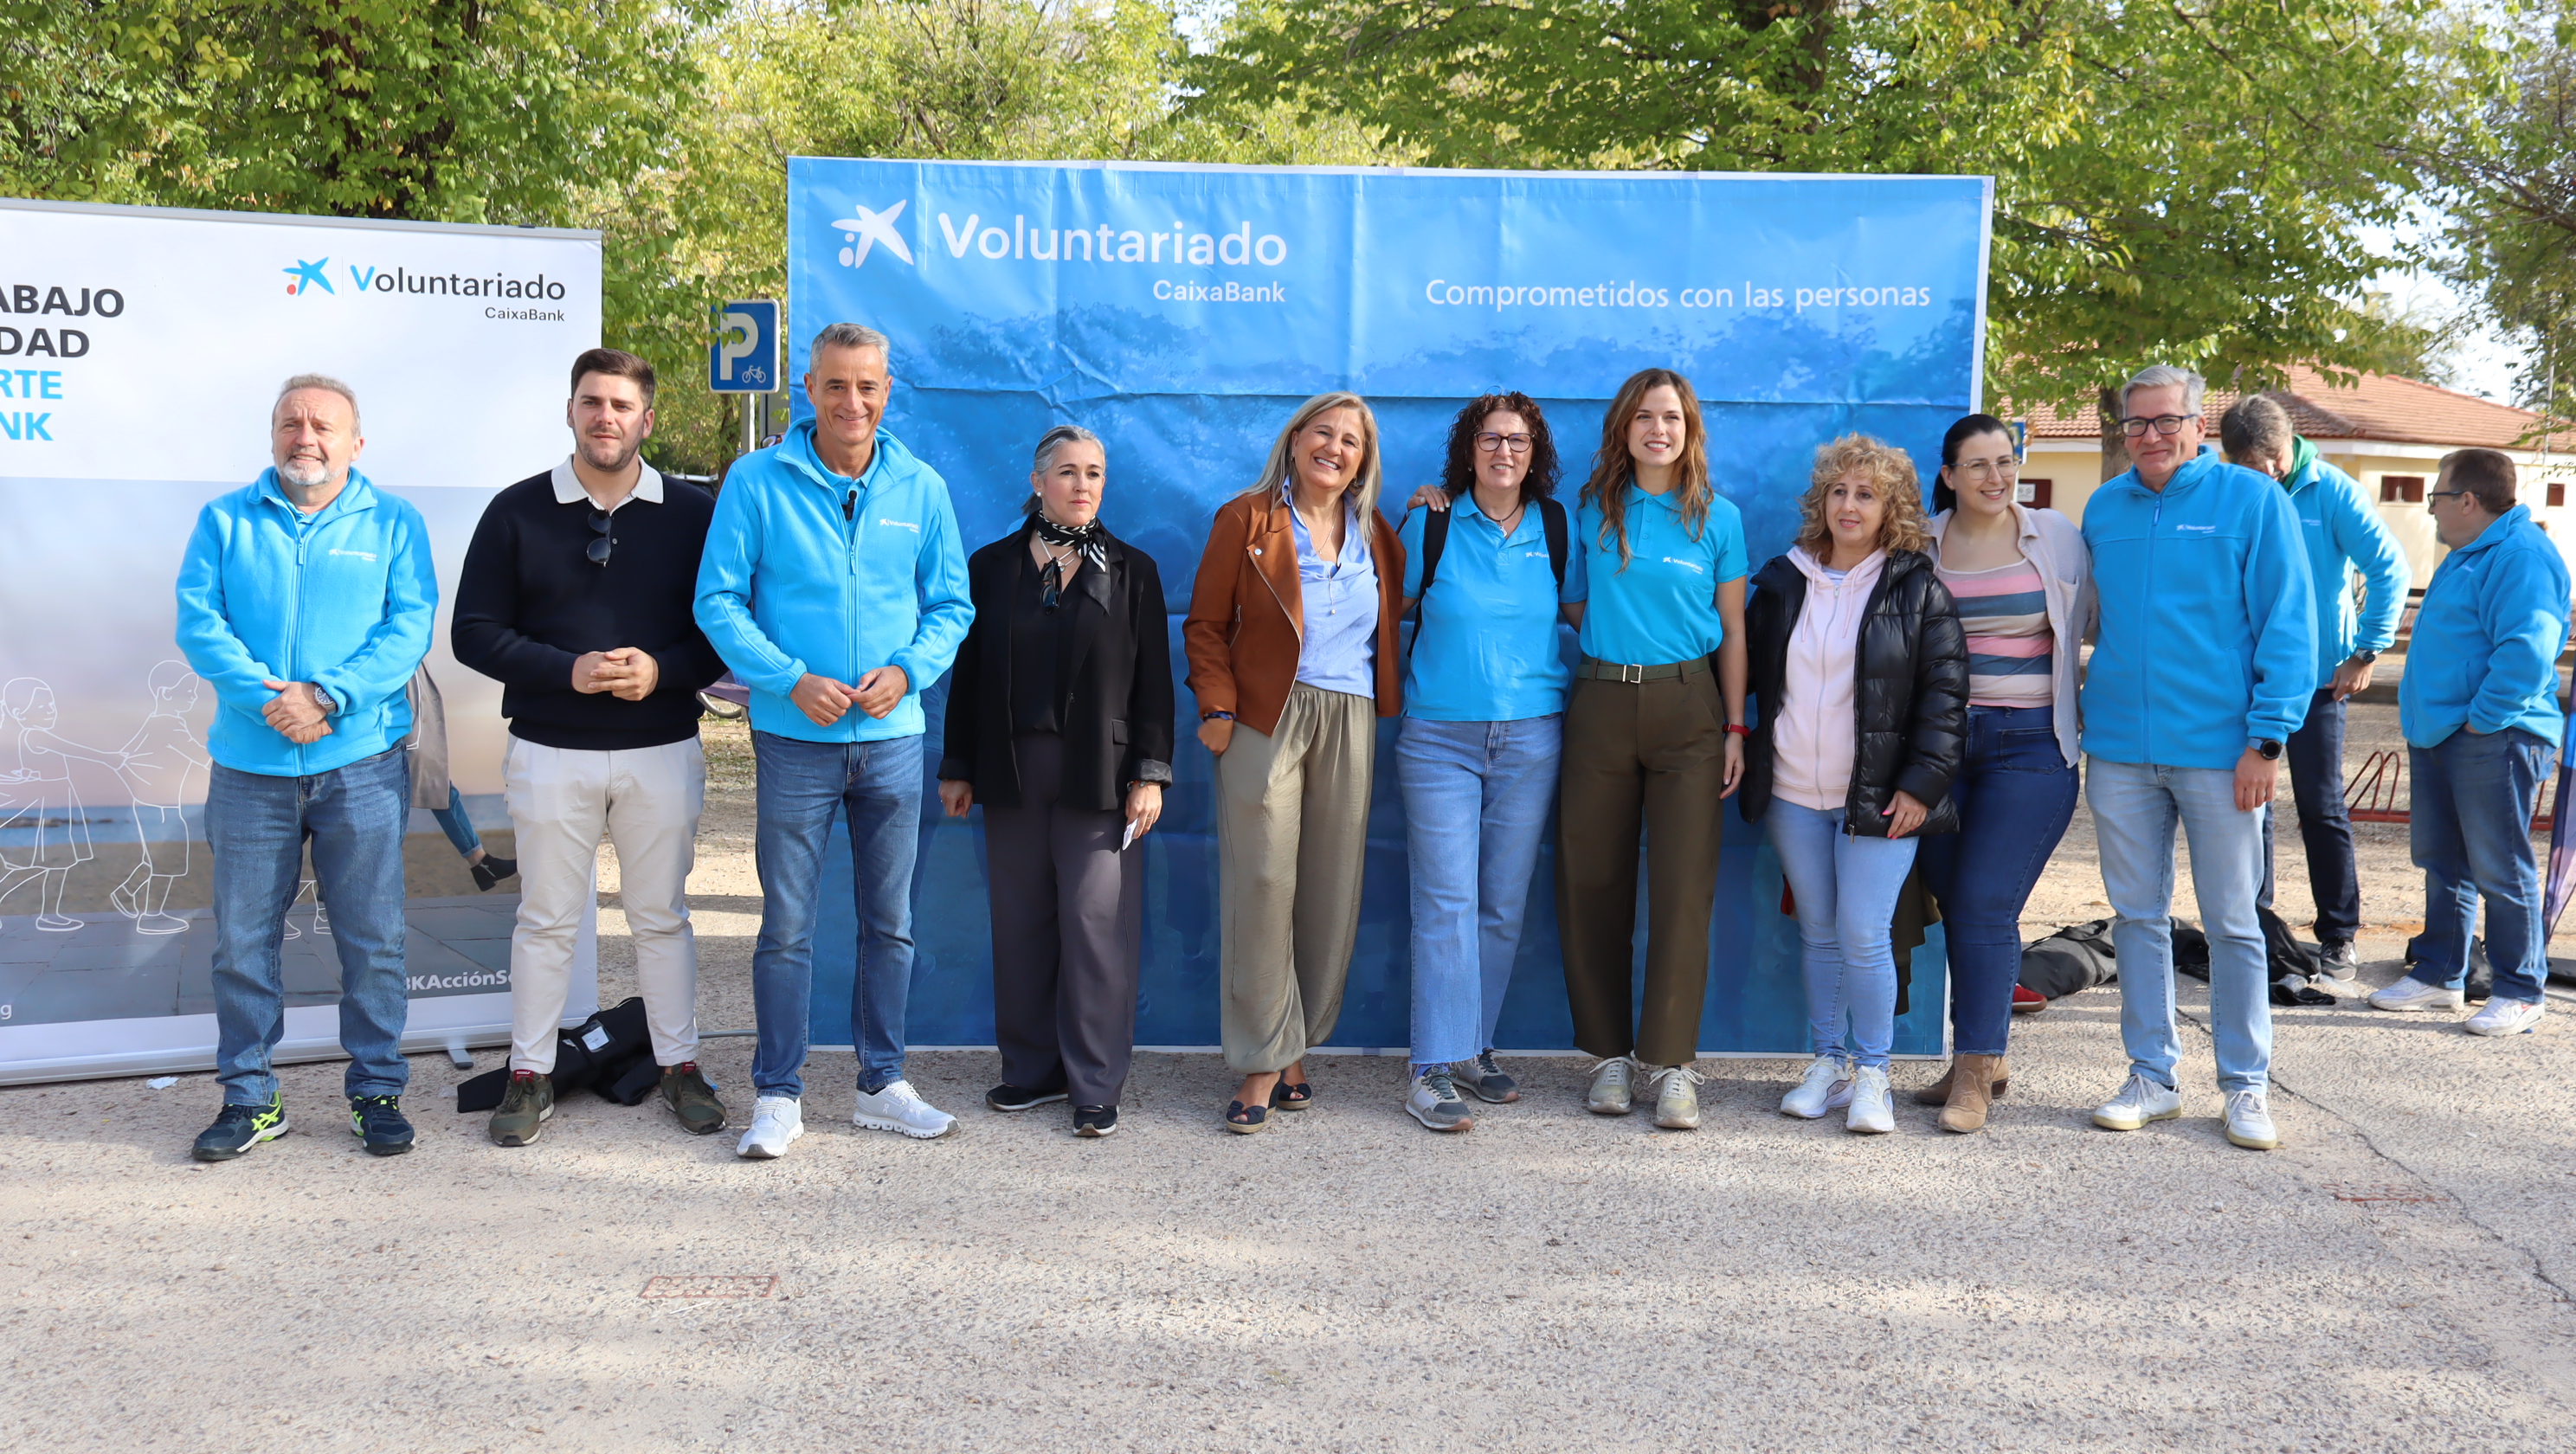
A todo ello se suman iniciativas de formación y empleabilidad a través de CaixaBank Dualiza, con 67.000 estudiantes beneficiados desde su puesta en marcha; al tiempo que Voluntariado CaixaBank continúa ampliando su alcance en lo que va de año, con la participación de 25.000 voluntarios en actividades para apoyar a colectivos vulnerables.
Por otra parte, en su apuesta por avanzar hacia una economía más sostenible, la entidad acumula más de 92.000 millones de euros en finanzas sostenibles desde el comienzo del Plan Estratégico 2025-2027.
Accede a gráficos interactivos: Analisis interactivo | CaixaBank
Videonoticia
Vídeo total del CEO de CaixaBank, Gonzalo Gortázar
Audio del CEO de CaixaBank, Gonzalo Gortázar
Vídeo compactado de recursos
También te puede interesar
Corporativo Emprendimiento y Empresas
23 Octubre 2026, 10:00
CaixaBank, Mejor Banco para Pymes en España y Europa Occidental por Global Finance
Corporativo Emprendimiento y Empresas
22 Octubre 2026, 18:40
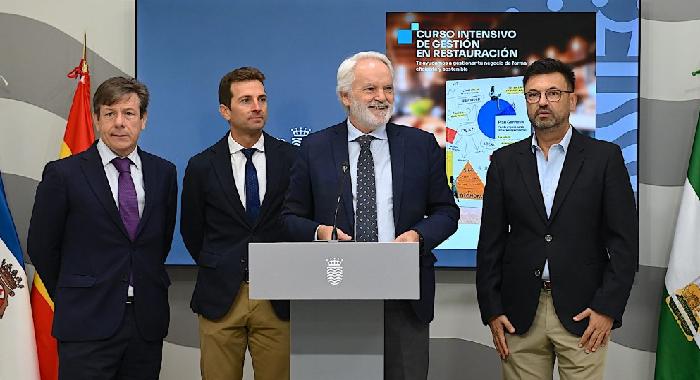
CaixaBank acerca a Ferran Adrià a Jerez para impulsar la formación y la competitividad del sector hostelero
Jerez de la Frontera

Corporativo Compromiso Social
21 Octubre 2026, 10:00
CaixaBank adelanta el pago de las pensiones cada mes en su compromiso con el colectivo sénior: consulta el calen...
Corporativo Compromiso Social
21 Octubre 2026, 09:00
CaixaBank adelanta el pago del ingreso mínimo vital cada mes en su compromiso con las personas en situación de v...

Corporativo Emprendimiento y Empresas
19 Octubre 2026, 11:14
CaixaBank transforma su app para empresas para ofrecer una gestión más ágil y autónoma
Corporativo Sostenibilidad
16 Octubre 2026, 10:45
MicroBank consolida su liderazgo en microfinanzas con el 58% de la cartera de microcréditos de la Unión Europea
Recursos para medios
Accede a nuestros recursos para periodistas.
Ver más
Contacta con nosotros
**[email protected]
** (exclusivo para medios de comunicación).
Para otras consultas accede al teléfono de atención al cliente (Abrir en ventana nueva)
Actualidad
Productos y servicios
Otras webs corporativas
© CaixaBank, SA 2026
 Twitter (Abrir en ventana nueva)
 Facebook (Abrir en ventana nueva)
 Instagram (Abrir en ventana nueva)
 Linkedin (Abrir en ventana nueva)
 Youtube (Abrir en ventana nueva)
 Spotify (Abrir en ventana nueva)
 TikTok (Abrir en ventana nueva)
 Whatsapp (Abrir en ventana nueva)
 Twitter (Abrir en ventana nueva)
 Facebook (Abrir en ventana nueva)
 Instagram (Abrir en ventana nueva)
 Linkedin (Abrir en ventana nueva)
 Youtube (Abrir en ventana nueva)
 Spotify (Abrir en ventana nueva)
 TikTok (Abrir en ventana nueva)
 Whatsapp (Abrir en ventana nueva)
 Twitter (Abrir en ventana nueva)
 Facebook (Abrir en ventana nueva)
 Instagram (Abrir en ventana nueva)
 Linkedin (Abrir en ventana nueva)
 Youtube (Abrir en ventana nueva)
 Spotify (Abrir en ventana nueva)
 TikTok (Abrir en ventana nueva)
 Whatsapp (Abrir en ventana nueva)
 ENS (Abrir en ventana nueva)

 Certificación ILUNION tecnología y accesibilidad (Abrir en ventana nueva)