|
TeamViewer SE is a software company that provides a digital workplace platform connecting people with technology to enable, improve, and automate digital processes. The company offers solutions for remote access and IT support, digital employee experience (DEX), and industrial augmented reality workflows. Key products include TeamViewer Remote for personal and small business use, TeamViewer Tensor for enterprise connectivity, TeamViewer DEX for real-time troubleshooting, and TeamViewer Frontline for connected workers. The platform supports proactive device management and seamless IT operations, leveraging AI and integrating with leading tech partners. TeamViewer serves customers ranging from freelancers and non-profits to small and medium-sized businesses and large enterprises across various industries. The company was founded in 2005 and has established strategic partnerships, including a recent collaboration with ServiceNow to accelerate autonomous IT operations. Summarised from the company's own disclosures, fiscal year ended Oct 2026 |
Industry Software - Application | Homepage ir.teamviewer.com |
| Sector Technology | IR page ir.teamviewer.com | |
|
Tags
remote access, it support, digital employee experience, augmented reality, device management, enterprise software, industrial workflows, TeamViewer Remote, TeamViewer Tensor, TeamViewer DEX, TeamViewer Frontline, TeamViewer ONE
|
Press page — |
Metrics
| Valuation | |
|---|---|
| Market cap | € 1.153B |
| Market cap (USD) | $ 1.288B |
| P/E | 8.81 |
| PEG | 0.43 |
| P/BV | — |
| P/S | 1.54 |
| P/OCF | 5.02 |
| P/FCF | — |
| Dividend yield | — |
| Turnover / mcap | — |
| Returns | |
|---|---|
| ROE | — |
| ROI | — |
| ROIC | — |
| Profit margin | 15.8% |
| Growth | |
|---|---|
| Revenue growing | Yes |
| Profits growing | No |
| Revenue up 3y | Yes |
| Revenue up 5y | Yes |
| Earnings growth 3y (net profit CAGR) | 20.5% |
| Quality | |
|---|---|
| Profitable | Yes |
| Margin expanding | Yes |
| Buying back stock | Yes |
| Diluting (TTM) | No |
| Debt/Equity | — |
| Podcast bulls (TTM) | Sign up |
| Podcast bears (TTM) | Sign up |
| Podcast sentiment (TTM) | Sign up |
| Podcast sentiment % (TTM) | Sign up |
| News sentiment (TTM) | 0 |
| Quality score | 53.8% |
| Insiders | |
|---|---|
| Buys, 1w | Sign up |
| Buys, 1m | Sign up |
| Buys, 1y | Sign up |
| Sells, 1w | Sign up |
| Sells, 1m | Sign up |
| Sells, 1y | Sign up |
Podcast Mentions
Ad-hoc releases, corporate news and financial reports published through EQS, newest first, titles as published, directors' dealings, voting-rights notifications and buy-back reports included. The link opens the release. Press releases from the company's own website, newest first.
Our strategy
Sustainability is part of our business model and corporate culture. Our contributions and ambitions are defined within our sustainability framework named c-a-r-e, which has allowed us to have clear commitments, targets, and measures to become a more sustainable business.


Collaboration
We want to master global sustainability challenges together.
- Establish a supplier engagement plan and engage at least 30% of our suppliers by 2025
- Engage at least 67% of our supplier base in achieving sustainability targets by 2026
- Require suppliers to set scope 1–3 targets directed to achieve a net zero pathway by 2050

Access
We empower people to help others through technology.
- Free use of TeamViewer solutions for private and socially beneficial purposes
- Increase access to education and technology

Reduction
We reduce our carbon footprint and enable our customers to avoid emissions.
- Achieve net zero CO₂ emissions by 2040
- Deliver solutions powered by 100% renewable energy
- Help customers avoid emissions
- Ensured that our offices prioritize energy efficiency and have access to renewable energy resources

Equality
We promote a diverse and inclusive work environment without discrimination.
- Support the representation of women at all management levels
- Recognition of diversity with a zero-tolerance policy towards discrimination
Our commitment to the UN Sustainable Development Strategy
At TeamViewer, sustainability is part of our business model and our corporate culture
As part of the Annual Report as well as a standalone document, our Sustainability Report (“Sustainability Statement 2024”) transparently discloses our commitments to a sustainable business environment.
TeamViewer helps to avoid millions of tons of CO₂ emissions in one year
A study conducted by Five Glaciers Consulting, reviewed by TÜV SÜD, shows the positive environmental impact of TeamViewer solutions. Our customers avoid 41 million tons CO₂ emissions in one year (based on 2022 data).
Our partnerships and recognitions

TeamViewer is a signatory of the Charta der Vielfalt
TeamViewer strengthens its commitment to fostering a workplace that celebrates diversity by endorsing the Charta der Vielfalt e.V. This German organization promotes the recognition, appreciation, and integration of all dimensions of diversity in corporate culture.

TeamViewer supports #WorkingPositively initiative
TeamViewer proudly supports the Working Positively pledge, demonstrating our commitment to bringing visibility and support to individuals living with HIV and other chronic illnesses. This initiative invites companies to actively work towards ending discrimination against people living with HIV in the workplace.

TeamViewer is awarded Pride Champion Gold in Pride Index 2023
For the second year in a row, TeamViewer took part in the UHLALA Group’s Pride Index, which assesses companies on their equality and inclusion initiatives for LGBTQ+ people. It also identifies how employers can further develop their commitment to LGBTQ+ diversity and implement concrete actions.
Global sustainable development
TeamViewer is a signatory of the UN Global Compact
Having high aspirations to contribute to the fulfillment of the UN Sustainable Development Goals, TeamViewer recently became a signatory of the UN Global Compact, thus demonstrating our undertaking to align with the Ten Principles of the United Nations Global Compact on human rights, labor, environment, and anti-corruption. By taking this essential step, we will continuously provide reports on the progress we make in fulfilling our commitments.
TeamViewer supports UN Women’s Empowerment Principles (WEPs)
TeamViewer is dedicated to fostering equality in the workplace and supports the UN Women’s Empowerment Principles (WEPs) for a more equal workplace. As outlined by the UN Global Compact and UN Women, WEPs provide guidance for businesses to promote gender equality and women’s empowerment. By embracing the WEPs, TeamViewer takes a significant step towards creating a fair, just, and equal world.
TeamViewer supports UN Standards of Conduct for Business
TeamViewer aligns with the UN Standards of Conduct for Business, specifically addressing discrimination against LGBTI people globally. We are committed to cultivating an inclusive and diverse workplace, endorsing these standards as a testament to our dedication. Through our policies and practices, we strive to create a world where everyone, regardless of sexual orientation or gender identity, can work and live free from discrimination.
Sustainable Development Goals (SDGs) for a better future
The 2030 Agenda for Sustainable Development, adopted by all United Nations Member States in 2015, provides a shared blueprint for peace and prosperity for people and the planet, and is an urgent call for action by all countries, businesses, and civil society in a global partnership.
TeamViewer commits to the Sustainable Development Goals framework and recognizes the importance of all 17 goals. We believe that the power of technological innovation is essential in driving our society to more sustainable ways of living and doing business.

Find out more about the eight focus SDGs which underscore some of the focal fields where we believe TeamViewer can create a strong impact:
4. Quality education
Deeply convinced that a quality education underpins a range of fundamental development drivers, TeamViewer is committed to contributing towards assuring equal access to education and training (4.3.1) and to increase the proportion of youth and adults with information and communication technology (ICT) skills (4.4.1). Additionally TeamViewer emphasizes its commitment to support the educational sector by the free usage of its technology in specific campaigns.
5. Gender equality
TeamViewer is strongly committed to gender equality and supports participation of women in leadership and decision making. (5.5.2)
8. Decent work and economic growth
Aligned with the SDG 8.5.1, 8.6.1, 8.7.1, 8.8.2, and 8.B.1 TeamViewer insures our employees full access to their labor rights while promoting a secure and healthy working environment for all workers. At the same time, we exclude and strongly condemn any unlawful practices, such as exploitation of child labor and unequal labor-pay, based on discriminative indicators such as gender, nationality, age, and others.
9. Industry, innovation, and infrastructure
TeamViewer takes active ownership of SDG 9.5 A.1 and B.1 by developing technology, essential to reduce the necessity of physical travel. We provide all time remote access and control to every kind of device, thus, enabling people to work from home while reducing their carbon footprint.
10. Reduced inequalities
As the employer of choice for talents from more than 70 nationalities, TeamViewer actively promotes social, economic, and political inclusion irrespective of age, sex, disability, race, ethnicity, origin, religion, economic, social, or other status. (10.2.1, 10.3.1).
12. Responsible consumption and production
It is our sincere conviction that companies around the globe should adopt sustainable practices and reporting (12.6.1), promote sustainable procurement procedures (12.7.1), and take active steps to substantially reduce their carbon footprint through prevention, reduction, and recycling practices.
13. Climate action
We believe in the power of education (13.3.1) in order to raise awareness about the climate change among all our stakeholders, including our employees and customers. We are also committed to jointly build capacities (13.3.2) to implement adaptation, mitigation, and development actions.
17. Partnerships for the goals
We promote regional and international cooperation on and access to science, technology, and innovation through partnerships between governments, the private sector, and civil society (17.3.1, 17.6).
Data collection and precise calculation of our carbon emissions are pivotal in our ongoing environmental sustainability journey. That’s why our product’s carbon footprint has been officially certified by TÜV SÜD.

Embracing all the dimensions of diversity
TeamViewer is an equal opportunities employer, committed to fostering an inclusive culture where everyone is welcome and supported. Our corporate practices emphasize social, religious, economic, and political inclusion, treating individuals equally regardless of various factors.
We provide global unconscious bias training and ongoing opportunities for employees to connect across diverse backgrounds.

Diversity highlights
- 15+ offices around the world
- 80 different nationalities
- 34%* of our workforce are women
- 33.5% women in leadership positions
- 5 employee driven working groups engaging with diversity topics
*Status as of March 14, 2024
Employee-driven working groups
Climate Action
TeamViewer’s Climate Action Working Group is an employee-led initiative dedicated to strengthening our collective contribution to environmental protection. Bringing together colleagues who are passionate about sustainability, the group drives hands-on activities and awareness campaigns that help reduce our ecological footprint across all offices.
TeamViewer’s Climate Action Working Group is an employee-led initiative dedicated to strengthening our collective contribution to environmental protection. Bringing together colleagues who are passionate about sustainability, the group drives hands-on activities and awareness campaigns that help reduce our ecological footprint across all offices.
TeamViewer’s Climate Action Working Group is an employee-led initiative dedicated to strengthening our collective contribution to environmental protection. Bringing together colleagues who are passionate about sustainability, the group drives hands-on activities and awareness campaigns that help reduce our ecological footprint across all offices.
One of the group’s key efforts is organizing clean-up events around our office locations. These initiatives bring employees together to remove litter from local parks, streets, and natural areas, fostering environmental responsibility and strengthening community engagement.
The group also leads regular awareness campaigns focused on practical steps employees can take to reduce their environmental impact. These campaigns promote energy-efficient practices, such as minimizing unnecessary equipment usage and optimizing workspace energy consumption. They also highlight waste prevention measures and support the company’s ambition to move toward plastic-free offices, encouraging the reduction of single-use plastics, the use of reusable materials, and responsible recycling habits.
By combining education, collaboration, and hands-on action, the Climate Action Working Group helps embed sustainability into everyday work life at TeamViewer – empowering all employees to contribute to a cleaner, more resource-efficient future.
Parents@TeamViewer
Our Parents@TeamViewer Working Group is an employee-driven community that supports colleagues navigating the challenges and opportunities of parenthood while pursuing their careers. The group brings together parents and caregivers from across the company to share experiences, inspire one another, and advocate for a family-friendly work environment.
Our Parents@TeamViewer Working Group is an employee-driven community that supports colleagues navigating the challenges and opportunities of parenthood while pursuing their careers. The group brings together parents and caregivers from across the company to share experiences, inspire one another, and advocate for a family-friendly work environment.
Our Parents@TeamViewer Working Group is an employee-driven community that supports colleagues navigating the challenges and opportunities of parenthood while pursuing their careers. The group brings together parents and caregivers from across the company to share experiences, inspire one another, and advocate for a family-friendly work environment.
A key focus of the group is raising awareness of the flexible and part-time working models available at TeamViewer. These include reduced-hours arrangements, flexible scheduling, job-sharing options, and phased return-to-work setups – each designed to help parents balance professional responsibilities with family life. The working group collaborates closely with HR to continuously review and promote these models so that employees can choose the solution that fits their needs.
The reintegration process after parental leave is another important topic. Parents@TeamViewer provides guidance and peer support for employees preparing to return, ensuring a smooth transition back into their roles. Through informal networks, information sessions, and collaboration with managers, the group helps parents stay connected, up to date, and empowered to re-enter the workplace with confidence.
By championing flexible work, supporting reintegration, and fostering open dialogue, the Parents@TeamViewer Working Group strengthens our commitment to a workplace where families feel supported and careers can grow – at every stage of life.
Diversity
TeamViewer’s Diversity Working Group is an employee-led community committed to fostering a workplace where individuality is valued, perspectives are respected, and everyone feels empowered to contribute their best. The group brings together employees from different backgrounds, cultures, and experiences to drive initiatives that celebrate diversity and strengthen belonging across the organization.
TeamViewer’s Diversity Working Group is an employee-led community committed to fostering a workplace where individuality is valued, perspectives are respected, and everyone feels empowered to contribute their best. The group brings together employees from different backgrounds, cultures, and experiences to drive initiatives that celebrate diversity and strengthen belonging across the organization.
TeamViewer’s Diversity Working Group is an employee-led community committed to fostering a workplace where individuality is valued, perspectives are respected, and everyone feels empowered to contribute their best. The group brings together employees from different backgrounds, cultures, and experiences to drive initiatives that celebrate diversity and strengthen belonging across the organization.
The working group champions several initiatives that support a truly diverse workforce. These include awareness sessions on cultural intelligence, inclusive leadership workshops, company-wide celebrations of international and cultural events, and collaboration with HR to ensure inclusive hiring practices. The group also facilitates open discussions and learning opportunities that help colleagues better understand each other’s experiences and build a more empathetic, globally minded culture.
By amplifying diverse voices and promoting equity in everyday practices, the Diversity Working Group plays a key role in shaping a workplace where all TeamViewer employees – regardless of background, identity, or life experience – can succeed and feel at home.
Gender Equity
At TeamViewer, we believe that diverse perspectives and equal opportunities strengthen our culture and fuel innovation. Our Gender Equity Working Group is an employee-driven initiative dedicated to creating an inclusive environment in which everyone can thrive. The group brings together colleagues from across the organization who are passionate about advancing gender balance, raising awareness, and driving meaningful change.
At TeamViewer, we believe that diverse perspectives and equal opportunities strengthen our culture and fuel innovation. Our Gender Equity Working Group is an employee-driven initiative dedicated to creating an inclusive environment in which everyone can thrive. The group brings together colleagues from across the organization who are passionate about advancing gender balance, raising awareness, and driving meaningful change.
At TeamViewer, we believe that diverse perspectives and equal opportunities strengthen our culture and fuel innovation. Our Gender Equity Working Group is an employee-driven initiative dedicated to creating an inclusive environment in which everyone can thrive. The group brings together colleagues from across the organization who are passionate about advancing gender balance, raising awareness, and driving meaningful change.
A key pillar of the working group is our Mentorship Program for Female Career Development. Through one-on-one mentoring, knowledge sharing, and targeted career guidance, the program supports women at TeamViewer in developing their skills, expanding their networks, and preparing for leadership roles. By connecting experienced mentors with emerging female talent, we foster personal growth, confidence, and long-term career progression.
The Gender Equity Working Group continuously collaborates with HR and leadership teams to identify barriers, propose improvements, and champion initiatives that strengthen equal opportunity across all levels of the company. Together, we are building a workplace where careers can flourish – regardless of gender.
LGBTQIA+
The LGBTQIA+ Working Group at TeamViewer is an employee-driven community committed to building a workplace where everyone – regardless of sexual orientation, gender identity, or expression – feels welcomed, respected, and empowered to be their authentic selves. The group brings together colleagues who are passionate about advancing inclusion, breaking down barriers, and strengthening visibility across the organization.
The LGBTQIA+ Working Group at TeamViewer is an employee-driven community committed to building a workplace where everyone – regardless of sexual orientation, gender identity, or expression – feels welcomed, respected, and empowered to be their authentic selves. The group brings together colleagues who are passionate about advancing inclusion, breaking down barriers, and strengthening visibility across the organization.
The LGBTQIA+ Working Group at TeamViewer is an employee-driven community committed to building a workplace where everyone – regardless of sexual orientation, gender identity, or expression – feels welcomed, respected, and empowered to be their authentic selves. The group brings together colleagues who are passionate about advancing inclusion, breaking down barriers, and strengthening visibility across the organization.
A core pillar of the group is its mentoring program, which provides guidance, career support, and safe spaces for LGBTQIA+ colleagues and allies. Through one-on-one mentoring, peer exchange, and personal development opportunities, the program fosters confidence, broadens professional networks, and helps emerging talent grow into future leaders.
The group also drives broader initiatives that support a diverse workforce, including awareness sessions on LGBTQIA+ topics, allyship training, inclusive language campaigns, and participation in global Pride events. These activities help educate colleagues, celebrate diversity, and promote a culture of understanding and respect. The working group collaborates closely with HR and leadership to ensure policies and practices are inclusive and reflect the needs of LGBTQIA+ employees.
By championing representation, empowering community engagement, and promoting diversity across the organization, the LGBTQIA+ Working Group plays a vital role in shaping a workplace where every TeamViewer employee can thrive – openly, proudly, and authentically.
Corporate governance
Our corporate governance stands for responsible and transparent corporate management and supervision directed towards sustainable, long-term value creation.
This includes our values, guidelines, and corporate principles as well as internal and external control and monitoring mechanisms.
Our impact
Explore how TeamViewer actively translates its commitmens into tangible environmental and social initiatives under c-a-r-e, our sustainability framework.
[
Quick read
\
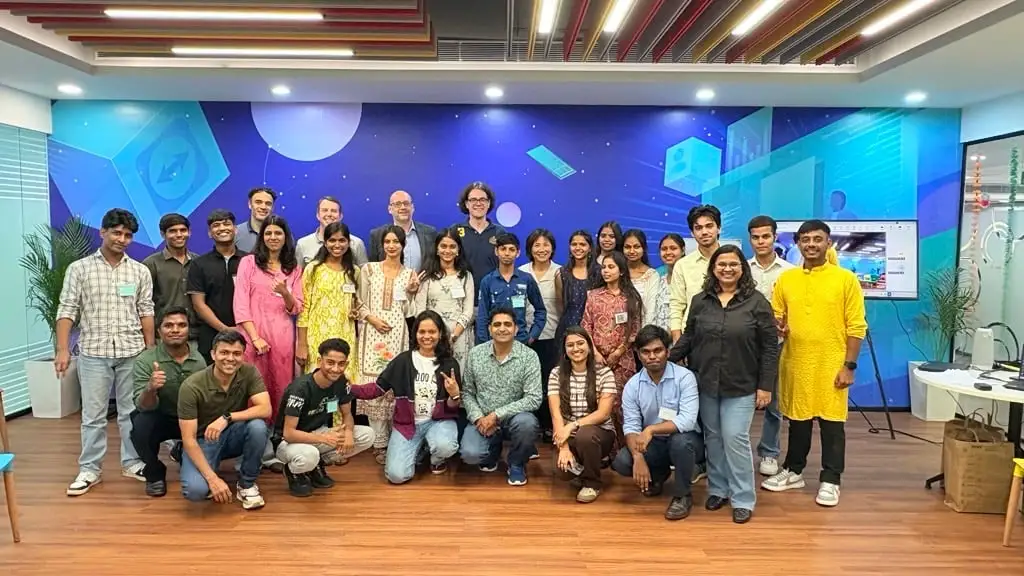
Empowering futures: Transforming lives through education in Noida, India\
From classrooms to careers — building confidence, resilience, and independence for underserved youth. We proudly continue a CSR program in Noida, focused on empowering children and young adults from underserved communities to become self-reliant, confident individuals with the skills to shape their own futures.
Feb 17, 2026](https://www.teamviewer.com/en/insights/teamviewer-transforms-lives-through-education-in-noida-india/)
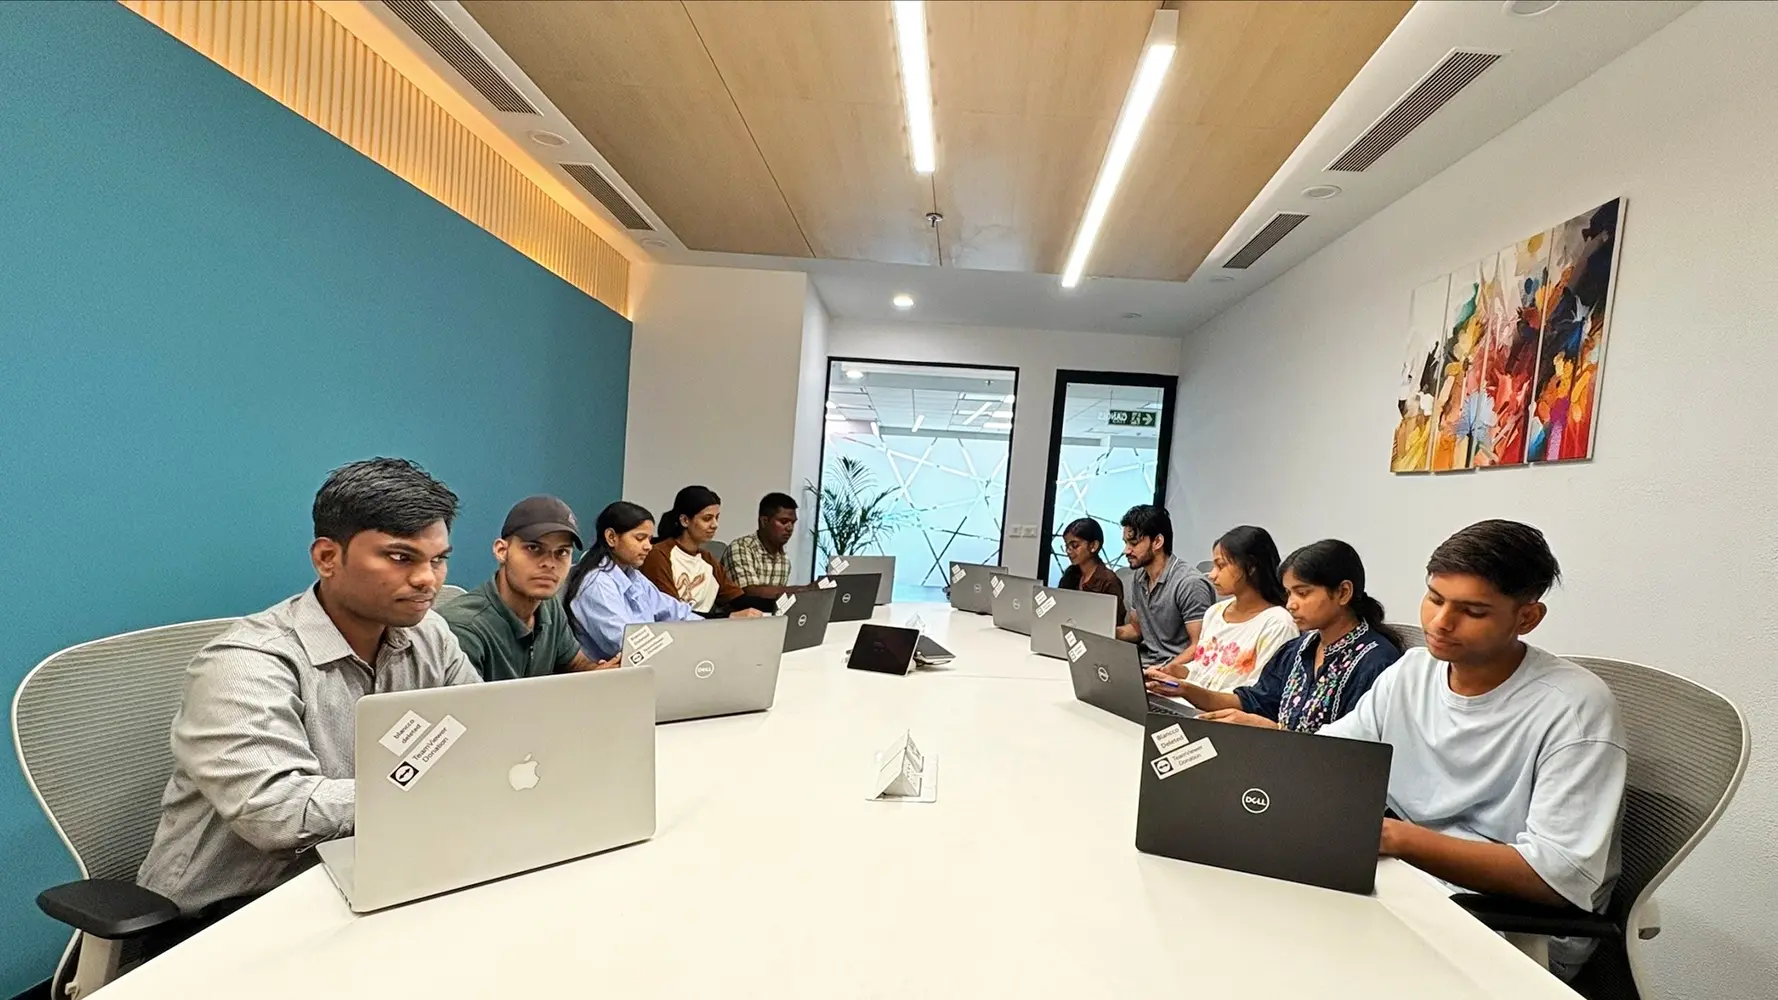
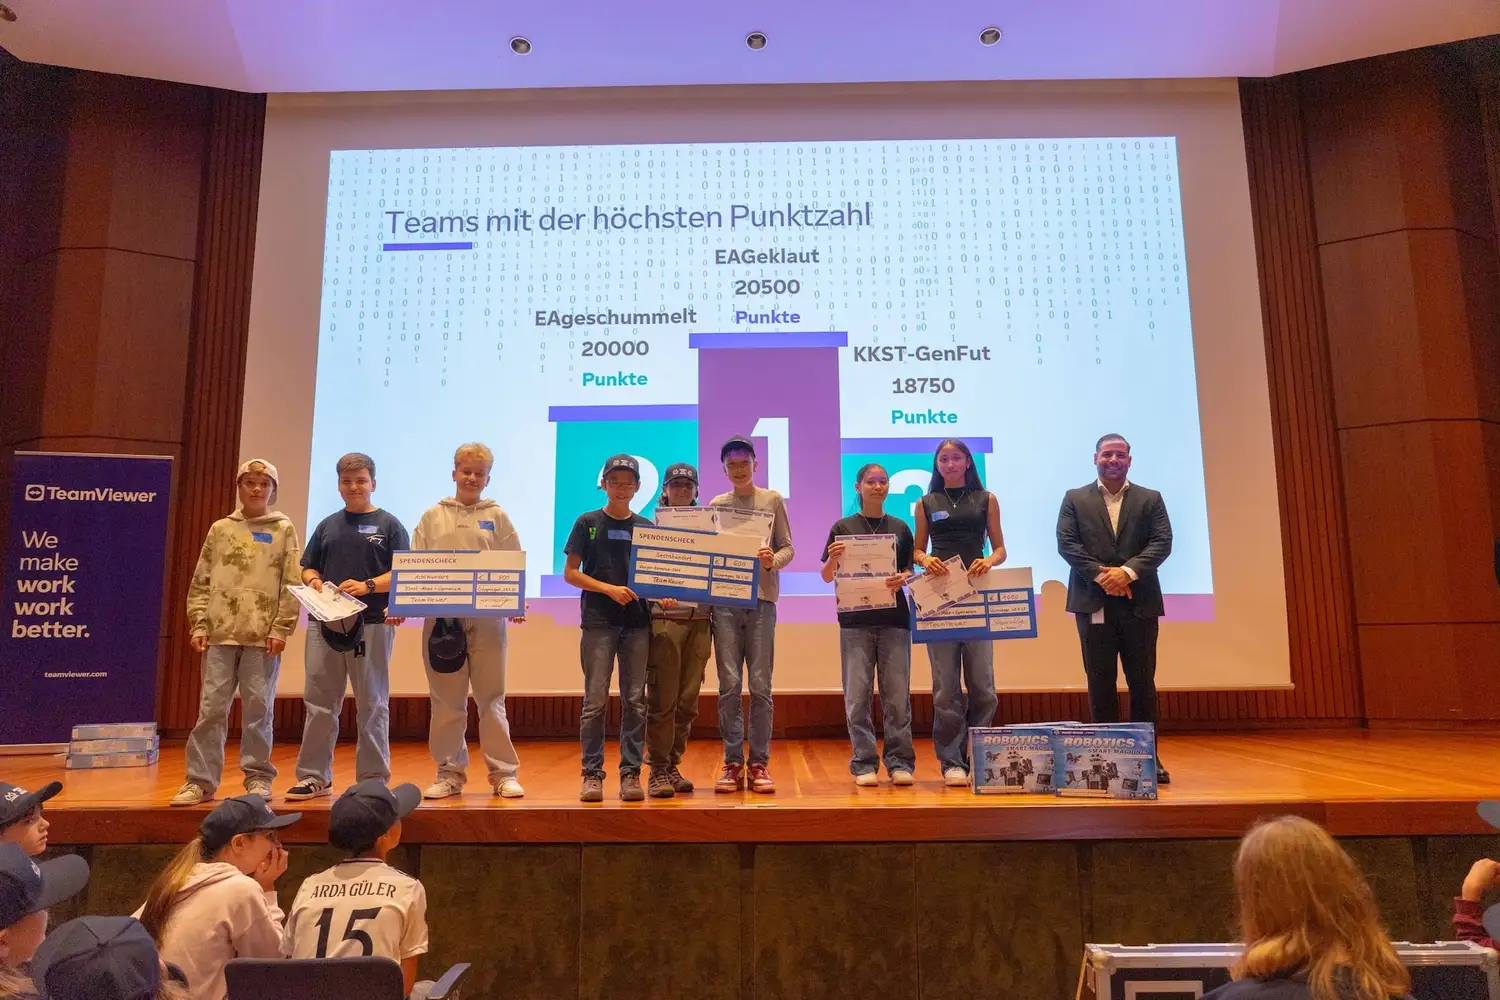

AwardTeamViewer receives 2025 Tech Cares Award from TrustRadius
Jul 16, 2025

Sustainability and CSRTeamViewer recognized on CDP’s 2024 Supplier Engagement A-List
Jul 10, 2025

ArticleEmpowering young adults with digital safety
Jun 11, 2025



Partnerships and voluntary commitments of leading experts




Change Region
Products
ONE Platform
Solutions
Partner
Resources
Support
Company
Additional Links


EQS - TeamViewer SE Q2 2026 Results and Analyst Call 28th July, 2026 | 09:00 CET Transcript
Speakers: Oliver Steil Michael Wilkens Mark Banfield Bisera Grubesic
1
Bisera Grubesic
Good morning, ladies and gentlemen, and welcome to TeamViewer's Q2 2026 Earnings Call. I am Bisera Grubesic, Head of IR at TeamViewer, and today I am joined by our CEO, Oliver Steil; CFO, Michael Wilkens; and CRO, Mark Banfield. Oliver and Mark will run you through the quarterly business update, and Michael will present the financials. The presentation will be concluded by a Q&A session. Please note that you can find the important notice and the APM disclosure on slides 2 and 3 as per usual. And with this, I'd like to hand it over to Oliver to kick off our presentation.
Oliver Steil
Thank you, Bisera. Good morning, everyone. Welcome from my side as well, and thank you very much for joining our call today. The second quarter marked a real inflection point for TeamViewer. The strategic and operational progress we saw building in Q1 is now really translating into tangible business outcomes. The DEX turnaround is fueling growth. Churn improved to its lowest level since the 1E acquisition, and importantly, major enterprise customers recommitted through larger multi-year agreements. At the same time, we are seeing customers increasingly consolidate remote connectivity, DEX, and AI capabilities on TeamViewer ONE. This drove double-digit year-over-year constant currency growth in our highest value enterprise ARR bucket, and I think it underscores the growing customer buy-in to TeamViewer's integrated platform for autonomous endpoint management. Our momentum was further reinforced by recent external recognition from leading industry analysts and by our landmark partnership with ServiceNow. Combining TeamViewer's endpoint technology with the ServiceNow AI platform, and backed by long-term commitments and joint investments, the strategic partnership is built to grow and shape the future of autonomous IT operations. We also saw encouraging progress in SMB, where churn is starting to stabilize as expected. Targeted retention initiatives and improving sales execution are taking effect here, and we expect SMB headwinds to continue moderating throughout the second half of 2026. And while the top-line growth in the second quarter continued to reflect the previously disclosed headwinds, these effects are unwinding as expected. And more 2
importantly, the key leading indicators across the business all improved during the quarter. Profitability remains strong with an adjusted EBITDA margin of 43.2%, and at the same time, we continue to invest in innovation, in AI, and go-to-market capabilities, which really demonstrates our ability to balance growth investments with financial discipline. Taken together, these developments reinforce our confidence in accelerating the business dynamics during the second half of 2026, and we are therefore reaffirming our full-year guidance. Next, we will zoom in on the most relevant results of this quarter. Let me spend the first few minutes on what I think are the most important developments which we saw in Q2; the improvement in enterprise momentum driven by the DEX turnaround and the rapid adoption of TeamViewer ONE. Let's start with the chart on the left, which shows the quarterover-quarter change in enterprise ARR in constant currency. As we explained last quarter, enterprise growth in Q1 was temporarily impacted by one-off 1E churn. These effects are now leveling off as we expected. You can see a clear inflection point in the second quarter. This reflects the DEX turnaround, stronger customer engagement across the board, and growing expansion activity. And that brings me to the chart on the right. What I find particularly encouraging is the continued acceleration in TeamViewer ONE adoption. Looking at our standard and advanced tiers, you can see how momentum built steadily throughout the quarter, reaching its strongest levels in June. Customers are increasingly embracing the TeamViewer ONE platform and the value proposition behind it. Importantly, this momentum is broad-based and demonstrates growing demand for a unified approach to remote connectivity, digital employee experience, and automation. Taken together, the DEX turnaround and the accelerating adoption of TeamViewer ONE provides strong evidence that our platform strategy is gaining traction. Let me show you what this means for the broader enterprise picture on the next slide. The key message on this slide is simple; our platform strategy is gaining traction, and we see that in tangible commercial benefits. Total enterprise ARR grew plus 8% year-over-year in constant currency, supported by improving customer engagement, expansion activity, and the recovery of the DEX business which I just walked you through. 3
Enterprise NRR improved sequentially to 94% and to 98% if you adjust for SMB to enterprise upsell. And what is particularly encouraging is what we saw in our highest value customer segment. Customers with more than EUR200,000 view in ARR grew 11% year-over-year in constant currency. Several strategic DEX customers expanded onto TeamViewer ONE during the quarter, generating meaningful ARR uplift and validating the rationale behind the 1E acquisition. Let me now turn to SMB on Slide 8. As expected, SMB ARR remained under pressure in Q2 and was down 4% yearover-year in constant currency. This continues to reflect the lagging effect of the strategic course correction measures that we implemented to improve the quality of the customer base and thereby strengthen our long-term economics. But the important message is the underlying improving trend that we saw in SMB. The chart on the right shows that SMB ARR momentum improved sequentially in the second quarter, and SMB churn stabilized in June, consistent with the trajectory we outlined earlier this year. We are seeing early benefits from targeted retention initiatives, pricing actions, and improving sales execution. There's clearly still work to do, but the key operational indicators are moving in the right direction, and they support our expectation that SMB headwinds will continue to moderate throughout the second half of 2026. Michael will explain our respective financial results later in the call in more detail. Let me now walk you through some of the strategic highlights from the past quarter. The most important one we announced just a couple of days ago; our multi-year strategic partnership with ServiceNow. This is a landmark endorsement of TeamViewer's technology, our strategy, and our position in the market. It's worth spending a moment on why it matters. The logic is very straightforward. This partnership brings together ServiceNow's AI orchestration layer and TeamViewer's endpoint execution layer. And that means we help ServiceNow to bridge the gap between identifying issues and then resolving them. Together with their own agentic AI offering, this enables automated and ultimately autonomous IT workflows for ServiceNow's customers, among them, of course, many of the largest enterprises in the world. As Bill McDermott, the Chairman and CEO of ServiceNow, has put it, ServiceNow and TeamViewer are closing the loop 4
from insight at the edge to outcomes at scale. And the partnership has both a commercial and a technological dimension. On the technology side, our DEX and remote connectivity capabilities are being integrated into the ServiceNow AI platform, which extends the reach of our solutions into one of the most widely adopted enterprise software ecosystems in the world. And on the commercial side, we agreed on dedicated joint investments across sales, marketing, and channel activities. This significantly expands our access to ServiceNow's global customer base, their partner network, and their enterprise relationships. This creates a really powerful route to market for our platform. And just as importantly, this is designed as a long-term strategic partnership. So ServiceNow and TeamViewer have committed to exploring deeper integrations, additional use cases, and future innovation opportunities together. That gives us confidence that this partnership can create meaningful value over time and scale well beyond its initial scope. For us, this announcement is about more than a partnership. It's a strong external validation of the product strategy and technology investments we've been making over the past years. Let me stay with the ServiceNow partnership for one more moment because there is a piece of recent Gartner research which I think is worth putting alongside it. Just this month, Gartner published its innovation insight on agentic remote support, and you can see the key points on the left-hand side of the slide. Gartner recently published research discussing the emerging category of agentic remote support and digital workplace operation automation. We believe these research pieces together highlight themes that are becoming increasingly relevant across enterprise IT organizations. TeamViewer continues to invest in capabilities to design to help customers address these opportunities and challenges of autonomous IT. And when we look at the building blocks that each side brings, we believe our agentic remote support, digital employee experience, and endpoint management capabilities combined with ServiceNow's IT service management and agentic AI orchestration put us in a really strong position, and that there are very few players who can 5
offer that combination. So we think we're on the right track, and the ServiceNow partnership isn't the only proof point we picked up this quarter. Let me show you on the next slide. Here's an overview of some important external recognition we received during the quarter, which spans our entire portfolio. Starting with DEX, Gartner again recognized TeamViewer as a leader in its 2026 Magic Quadrant for Digital Employee Experience Management tools, making this our third consecutive year of recognition. Shortly thereafter, IDC also named TeamViewer a leader in its worldwide DEX vendor assessment. Together, these recognitions reinforce the strength of our DEX platform and our position in a highly strategic market. Two other flagship reports from leading analysts firms focused on TeamViewer Frontline, which you can see on the right-hand side of the slide. Frost & Sullivan recognized TeamViewer as a visionary leader, while PAC once again named us as the sole best-in-class vendor in its innovation radar. These reports highlight both the maturity of our technology and our ability to deliver differentiated value for customers. And when it comes to our Remote and Tensor solutions, the picture is really encouraging, as you can see in the middle of the slide. On peer review platforms such as G2 and TrustRadius, we continue to hold leading positions across multiple categories. These platforms are particularly relevant because they reflect direct customer feedback, and they often play an important role in software buying decisions, especially in the SMB segment. Taken together, these recognitions are valuable proof points that our focus on innovation, product quality, and customer value continues to translate into market leadership across multiple parts of the portfolio. Beyond partners and industry analysts, we also received an important recognition in our largest market, the United States. This one is a bit different in nature because it opens access to a significant new market opportunity. Let me show you what I mean on the next slide. We achieved a significant milestone on our path forward towards FedRAMP authorization, the Federal Risk and Authorization Management Program, for TeamViewer DEX. FedRAMP is the key gateway into the US federal market, where security, compliance, and operational resilience requirements are among the highest in the world.
6
In June, TeamViewer DEX received the FedRAMP "In Process" designation and was officially listed on the FedRAMP marketplace. This reflects the significant progress we've made together with our sponsor, which is the US Department of Veterans Affairs. FedRAMP creates access to a market with very high barriers to entry and long-term demand for trusted software platforms. Once we're authorized, federal agencies can leverage the certification, which significantly expands our ability to serve this customer segment. And the opportunity extends well beyond the public sector because the standards required for FedRAMP are also highly valued by customers in regulated industries such as financial services, healthcare, and defense. So we believe this investment strengthened our position across a much broader set of customers and use cases. The authorization process is still ongoing, but this milestone represents an important step towards expanding our addressable market and further strengthening TeamViewer's position as a trusted enterprise platform. Ultimately, however, the most important validation comes from our customers. Let me give you a few examples here as well. The feedback of our customers remains one of the most important indicators for us. It gives us an early view into the value customers are realizing and how our AI capabilities are performing in real-world environments. What is particularly encouraging is how consistent that feedback is across different industries and customer segments. Whether it is reducing manual effort, accelerating issue resolution, improving visibility into IT environments, or proactively identifying risks, customers are reporting tangible operational benefits from using TeamViewer's AIpowered capabilities. For us, this is an important validation of the strategy we have been executing against. It reinforces our conviction that AI is becoming a meaningful competitive differentiator for TeamViewer while creating additional value for customers and supporting the long-term opportunity around TeamViewer ONE and autonomous endpoint management. This customer value is not only reflected in testimonials. We continue to see it translate into commercial success and new customer wins across our business. Mark will now walk you through some recent customer wins and how TeamViewer ONE adoption continues to gain traction across our customer base.
7
Mark Banfield
Thank you, Oliver, and a warm welcome from me also. These three customer examples really illustrate the breadth of our opportunity and the relevance of our portfolio across very different customer requirements. Let me start with the world's leading technology provider for the airport transport industry, supporting operations in more than 1,000 airports in over 200 countries. They selected TeamViewer DEX to manage and optimize some 60,000 endpoints that underpin mission-critical airport and passenger processing operations. They ran a rigorous head-to-head evaluation against a broad field of vendors and chose to replace a competing major digital employee experience platform they had in place for many, many years. For them, a degraded endpoint is not just an employee problem. It can delay flights and disrupt airport operations. Analytics alone do not protect uptime at scale, and that is exactly where TeamViewer DEX separates itself: real-time automation at the edge that remediates issues rather than just dashboarding them. That is clear evidence of the strength of our enterprise DEX offering and our ability to displace long-standing incumbents in the most demanding uptime-critical environments. The second example is GTS, a growing managed services provider, and it is a good illustration of how TeamViewer ONE is resonating with customers that are looking to consolidate their tools, improve automation, and scale their operations through a single integrated platform approach. And finally, on the Frontline side, we continue to see strong demand for digitizing frontline and warehouse operations. This customer deployed Frontline across multiple warehouse locations and integrates it directly into their existing SAP workflows, which helped increase productivity and operational efficiency. While these customers operate in very different industries and environments, they ultimately bought TeamViewer for the same reason, to remove operational friction, improve productivity, and enable more efficient workflows through a trusted platform. The upsell engine is working, and the numbers back it up. Increasingly, some of our largest DEX customers are choosing to move to TeamViewer ONE at renewal. And that momentum accelerated further during the second quarter. What is especially encouraging is that these customers aren't simply renewing. They are expanding their 8
relationship with TeamViewer as they consolidate vendors and move towards a broader platform approach. In many cases, we are replacing solutions that only ever addressed part of the workflow, while TeamViewer ONE offers a much more integrated proposition. The reason we are seeing this growing platform pull becomes clearer on the next slide, where I will talk to you through the innovation roadmap behind TeamViewer ONE. So let's take a closer look at our innovation roadmap for this year and how we are advancing our autonomous endpoint management vision. Just to briefly recap, the power of our AEM approach lies in its self-reinforcing nature. Every support interaction generates new insights. Every resolved issue expands the knowledge base, and every proven resolution can ultimately be operationalized at scale. As a result, the platform continuously evolves, helping customers move from reactive support towards autonomous IT operations. During the quarter, we made really good progress in bringing this vision to life. A key milestone will be our upcoming August release, which introduces new automation capabilities and marks another significant step towards autonomous endpoint management. I will show you this innovation in more detail on the next slide. For TeamViewer, this further differentiates our platform, expands our addressable market, and contributes to the accelerating platform pull we are seeing for TeamViewer ONE. The innovation we will introduce is Automations, a new capability that turns proven resolutions into scalable workflows and brings us another step closer to self-healing IT. These automations are built on insights captured across more than 2.8 million AI-powered support sessions that happened so far, with hundreds of thousands added each month by now. They let IT teams transform recurring fixes into repeatable actions that can be executed automatically whenever a known issue reappears. Put simply, IT teams no longer need to solve the same problem twice. Instead of repeatedly diagnosing and resolving recurring endpoint issues, they can capture a successful resolution once and apply it consistently across their entire environment at scale.
9
Ultimately, this is about turning knowledge into action. Every resolved issue makes the platform smarter, every automation increases customer value, and every step brings organizations closer to autonomous IT operations. What makes this structurally different from anything a competitor can offer is that we are the only company that owns both data streams natively at scale: expert remote session data and real-time endpoint telemetry. As you can see on the slide, the benefits are clear, less manual effort, faster resolution times, and greater operational consistency. At the same time, customers remain fully in control through approval workflows and policy-based governance. So this release really is about tangible examples of how TeamViewer ONE combines AI, endpoint intelligence, and automation. The mechanism I just explained is the reason why AI adoption generally and the number of AI sessions specifically has become one of the key metrics for our success. The scale of this adoption becomes really concrete when you look at a single month. In June alone, customers ran more than 500,000 AIpowered support sessions on our platform. That compares to over 300,000 in March, which we highlighted last quarter. The trajectory is steep, and it compounds. Every session strengthens the data foundation and makes our platform harder to replicate. This adoption is broad-based. We are seeing customers incorporate AI capabilities into their everyday support and IT operations workflows, creating tangible productivity gains and operational efficiencies. From a commercial perspective, this matters because adoption drives expansion. Customers that actively use our AI capabilities increasingly recognize the value of a more integrated platform approach, which creates additional opportunities around TeamViewer ONE and our autonomous endpoint management proposition. Overall, the adoption trends we see today give us real confidence that AI is becoming an increasingly important driver of customer value, platform engagement, and future growth. AI adoption is accelerating at an unprecedented pace. But as organizations deploy more AI agents, autonomous workflows, connected devices, and edge systems, managing these environments becomes significantly more complex.
10
What we increasingly see is that customers need more than visibility. They need intelligence, control, and automated remediation capabilities to operate these environments safely and efficiently. At the same time, they need greater transparency into how AI tools are being used across the organization, including workloads, performance, costs, and potentially unapproved applications. This is particularly relevant in highly regulated industries and mission-critical environments where reliability, governance, and operational resilience are becoming more and more important. We believe this creates a structurally growing demand for autonomous endpoint management. And importantly, this is not a future concept anymore. Through the increasing adoption of TeamViewer ONE and the conversations we are having with customers every single day, we are already seeing organizations beginning this journey towards more autonomous IT operations. So the question becomes: how do organizations actually make that transition? And that brings me to our vision for the self-healing agent for IT. At its core, autonomous endpoint management is about moving from reactive support towards intelligent, proactive, and ultimately autonomous operations. What you can see in this slide is what we call the self-healing agent for IT. The platform continuously observes activity across every endpoint, application, device, workflow, and increasingly, AI agents. It detects friction early, it understands the underlying issue, and it takes action before productivity is impacted. In other words, we are moving from a world where IT teams react to problems towards a world where issues can be increasingly predicted, prevented, and resolved autonomously. This is the vision that shapes our innovation roadmap and increasingly is defining our go-to-market approach for TeamViewer ONE. TeamViewer ONE is the commercial vehicle that brings this vision to customers. While our investments in AI, endpoint intelligence, and automation continue to strengthen the underlying platform. In a market that is moving in this direction, we believe TeamViewer is uniquely positioned to lead this transition. What differentiates us is not a single product or feature. It is the combination of several advantages that come together on one platform. We operate the world's largest remote 11
connectivity platform in the world. We have deep expertise at the endpoint, and we benefit from proprietary data that is generated through millions of support interactions. And we are embedding AI directly into our platform. At the same time, we have aligned our organization around this opportunity. Over the last quarters, we have sharpened our enterprise motion, evolved our go-to-market model, and built an operating model designed around platform selling. The accelerating adoption of TeamViewer ONE and the momentum we are seeing across our customers are encouraging signs that this approach is paying off. Combined with our large installed base, our proven upsell engine, and expanding ecosystem of partnerships, these advantages create a strong foundation for long-term growth. Ultimately, we believe autonomous endpoint management represents a significant market opportunity, and that TeamViewer is exceptionally well-positioned to help shape and benefit from this transition. With that, let me hand over to Michael, and he will take you through the financial results. Michael Wilkens
Thank you, Mark and Oliver, and good morning, everyone. Let's look at our key financials for the second quarter of 2026. Top-line growth continued to reflect the effect of previously disclosed headwinds in SMB and the one-off 1E churn in Q1 2026. More importantly, the key leading operational indicators improved throughout the second quarter, and as a result, we saw improving growth trends sequentially month-by-month, providing encouraging signs of improving momentum as we reached the end of Q2. ARR was broadly stable year-overyear in constant currency and reached EUR737 million. Revenue was EUR183 million, down 1.4% year-over-year in constant currency. We delivered adjusted EBITDA of EUR79 million and maintained a strong margin of 43.2%, demonstrating continued financial discipline despite temporary weakness in the top line. Net income increased by 33% year-over-year, and adjusted EPS was EUR0.27 this quarter. Net leverage ratio was 2.5x, and we remain firmly on track for our around 2.3x year-end target. Before I share the details, as Oliver and Mark already explained, the leading indicators all moved in the right direction during the quarter. Enterprise momentum strengthened as the DEX turnaround fueled TeamViewer 12
ONE adoption, and SMB churn showed signs of stabilization. This gives us confidence in the expected ARR growth acceleration that we have committed to for the second half of 2026. Let me now go through our key financials in more detail on the next slide. And let me start with the P&L. As I mentioned earlier, revenue growth in Q2 as a lagging indicator continued to reflect the effect of previously disclosed headwinds in SMB and 1E one-off churn in Q1. Reported revenue was also negatively impacted by foreign exchange movements, resulting in a 2.8 percentage point headwind compared to last year, primarily driven by the US dollar. The actual average FX rates in Q2 are provided to you on Slide 31. SMB revenue decreased by 3% year-over-year in constant currency to EUR124 million, and this reflects the continued impact of the SMB strategic measures mentioned earlier. Enterprise revenue showed positive momentum and increased by 3% year-over-year, reaching EUR59 million. Gross profit was EUR168 million with a gross margin of 92%, broadly stable year-over-year and reflecting the high quality of our subscription revenue base. COGS decreased by 2% year-over-year, reflecting lower variable costs in line with top-line development and lower frontline-related implementation costs. Total opex decreased by 3% year-over-year to EUR89 million, which shows our disciplined cost management even as we continue to organically invest in growth and innovation. Sales cost increased 5% year-over-year, driven by investments to strengthen customer acquisition capabilities and to support long-term customer retention. This is intentional and ongoing. Marketing cost decreased 28% year-over-year to EUR22 million, as previously indicated, marketing activities increased sequentially from Q1 '26, supporting brand and demand generation. R&D cost were up 12% year-over-year, which reflects continued investment in product innovation, AI capabilities, and the expansion of the combined platform. We are investing in our innovation capabilities to fuel our next leg of growth. G&A expenses increased 4% year-overyear, primarily reflecting timing effects between quarters. On a year-to-date basis, G&A expenses were down 2% yearover-year. Other expenses amounted to EUR740,000 compared to a gain of around EUR600,000 in Q2 '25, which reflects lower positive impacts from derivatives. 13
The adjusted EBITDA was EUR79 million, down 6% yearover-year. This decline mainly reflects lower revenue and a 5.4 percentage point FX headwind in the quarter. Adjusted EBITDA margin was strong at 43.2%. Excluding the negative effect from the FX headwinds on the margin, adjusted EBITDA margin would have been at 44.4%. Net income was up 33% year-over-year. Total interest expenses were EUR10 million in Q2, down EUR0.5 million as we have reduced our net debt position. And the adjusted EPS was EUR0.27 this quarter. Then moving on to leverage. Net debt was EUR833 million at the end of the quarter, which is an improvement of EUR37 million quarter-over-quarter. And the net leverage ratio remained stable at 2.5x. As mentioned, we have a clear path to reach our year-end net leverage target of around 2.3x. The details of the free cash flow will follow on the next slide. Leveraged free cash flow conversion in the quarter was 52%. Let me give you a clear picture of cash flow drivers of this quarter. Pre-tax cash from operating activities was EUR66 million, down 21% year-over-year, primarily due to lower top-line growth and even more less by upfront paid multi-year deals compared to last year and compared to our internal expectations. We are seeing fewer customers opt for upfront payments on multi-year deals, which may reflect a more cautious spending environment likely caused by current macro uncertainty. Interest cash outflows increased by 7% yearover-year due to quarterly phasing effects of interest payments between periods, offsetting the benefit of lower average debt level. This was partially offset by lower expenses for capex, lease payments, and income taxes. With the free cash flow seasonally stronger in the second half of the year, we will continue investing in growth while staying committed to bringing the leverage down to around 2.3x by year-end. Let me now move on to the next slide. Beyond the operational progress, we also continued to strengthen our financial position. During the quarter, we extended the maturity of our EUR75 million revolving credit facility to 2031. We secured a new EUR40 million bilateral financing agreement, and we initiated a new Schuldschein placement. The European Investment Bank-backed bilateral facility supports us in further diversifying our funding sources while also providing attractive financing conditions. Together with the above-mentioned new Schuldschein placement, which 14
is progressing as planned and expected to be closed by mid of August, the proceeds will be used to repay the 1E acquisition-related DCM bridge facility and further optimize our financing structure. These actions enhance our financial flexibility, support future growth investments, and keep us firmly on track with our deleveraging objective. With that picture of Q2 in full, let me close with the guidance on the next slide. In summary, Q2 was a quarter of disciplined execution and ongoing strategic progress. Underlying leading indicators, being DEX turnaround, accelerating TeamViewer ONE adoption, strengthening enterprise momentum, and stabilizing SMB churn, drove sequential monthly growth improvement throughout the second quarter. This supports our confidence in the expected ARR growth acceleration in the second half of '26, and we reiterated our full-year '26 guidance. We expect a constant currency revenue growth in the range of 0% to 3% versus pro forma '25 revenue. Current trends support the expectation of ARR growth acceleration in the second half of '26. At the 30th June 2026 spot rate, the expected total FX impact is negative 2.1 percentage points for Q3 '26. The expected total FX impact on full-year '26 revenue growth is negative 2.4 percentage points. Further details are provided on Slide 31. We continue to guide for an adjusted EBITDA margin of around 43%. We continue to demonstrate disciplined execution while investing in our strategic priorities. Our strong and industryleading margin performance in the first half of the year supports our confidence in achieving the full-year adjusted EBITDA level of around 43%. With that, I would like to hand back to the operator to open the Q&A, please. Operator
We will now begin the question-and-answer session. Anyone who wishes to ask a question may press star and one on their touch-tone telephone. You will hear a tone to confirm that you have entered the queue. If you wish to remove yourself from the question queue, you may press star and two. Participants are requested to use only a headset while asking a question. Anyone who has a question may press star and one at this time. The first question comes from the line of Victor Cheng from Bank of America. Please go ahead, sir. 15
Victor Cheng
Maybe three, if I may. I guess first of all, looking at the guidance, obviously we're expecting an H2 reacceleration. I think about easier comps in SMB and DEX continuing to grow strongly. But can you give us some sense of where you see you might land in the guidance range? Kind of what scenarios give you confidence on the higher end and maybe kind of what needs to work to get to the lower end as well? That would be great. And then secondly, just want to talk about the ServiceNow partnership. Clearly still very early days, but can you talk about kind of any tangible benefits you would expect from this partnership, both in terms of maybe ARR contribution down the line, but also, you know, the pipeline, the reach to customers, and other non-monetary benefits and potential there? And then last question is on customers using AI. Very strong growth there, jumping to 49k versus 26k in Q1. But can you provide us some color on kind of the split of these customers? Are more enterprise customers using it? Where are you seeing more momentum, and where do you think that can be maybe 12 months down the line? Thank you.
Oliver Steil
Yes, thank you, Victor. Let me start with the first one on the guidance for the top line, 0 to 3%. I mean, it's too early today to see a landing point between the zero and the three. This is why we have the range. But as you pointed out, there are lots of driving factors to get us up from now on in Q3 and in Q4. Number one is, of course, the improving trends in SMB. We saw a stabilization in churn, and in July only, we see already an improving in churn on the SMB side, plus continue with SMB, obviously the high demand in the upper end of the SMB side of the house for AI capabilities and the move into our platform game, which is clearly showing a testament of our strategy that also from the upper end of the SMB side, we move now into TeamViewer ONE. These are some leading indicators which are needed and which we see. The second one is if we move then on to enterprise. I mean, it's a big basket of various indicators on the enterprise. Number one is, of course, again, TeamViewer ONE here on the enterprise side. We had some really nice deals, big ones, existing customers who moved from DEX only now to DEX and Tensor, so a reverse TeamViewer ONE. And we see from the pipe perspective additional big prospects out of our base who might do that in Q3 and also in Q4. Another one is from the pipe standalone on new, new customers. We have very few but very massive deals or 16
prospects which we are working on, which is, of course, another ingredient to make it in H2. And last but not least, it's not only the ARR momentum which needs to kick in and will kick in, it's also so-called oneoff revenues, be it professional services, be it from the frontline deals which have a different revenue recognition, and obviously also some hardware sales which might continue in the frontline business. So, it's a very broad basket of diverse and meaningful ingredients, and with that, we have full confidence that we will accelerate in H2. Michael Wilkens
Yeah, thanks, Michael. Maybe I do the second question around the ServiceNow partnership. Clearly very interesting. I mean, primary goal or target is to have an endto-end proposition. So, the workflow engine, the intelligence of the ServiceNow ITSM workflow platform combined with our endpoint intelligence, so what we see on endpoints, what we learn from interactions with the endpoints through our remote sessions, and then with our large automation and remediation platform. So, if you put that together, you have the sensing on the endpoint to understand what's going wrong and the state and what could be better, then the workflow orchestration, and then actually the action on the endpoint through our remote capabilities and the automation. And very interesting for us because it's, I would say, the partner which is closest to what we've been doing in the past and therefore very happy to have a more integrated approach there. Clearly, customer reach will be enormous. ServiceNow is serving more than 8,800 very large enterprise customers with the very upper end of what we typically do, and that addressable base will increase significantly for us. I think it's a massive endorsement of our solution towards the customers, but also the most critical verticals: federal, healthcare, defense, where we also have strong customers. We will work now on building pipeline together. Clearly, there will be no short-term ARR impact because this is enterprise sales cycles. There are deals in play on both sides where we can see whether we combine the offering in the short term, but generally, I would think about a more typical enterprise sales cycle. Go-to-market mechanics are very interesting, so we will integrate, or ServiceNow will integrate TeamViewer 17
product SKUs into their platform, so a very direct way of being able to offer our platform solutions to ServiceNow customers, which I think is the most efficient way that you can do. And then their sellers will sell our proposition as part of the platform with full compensation and so forth. And we work on that on either side into marketing development. So there's, to your question, Victor, there's a lot of non-shortterm tangible effects, I should say, in terms of market positioning, endorsement, joint thinking through the innovation pipeline, how to improve the agentic platform from both sides. And that's why we're so excited about this partnership. And then maybe AI, some color on AI. Yes, so third question. Adoption is quite rapid. So effectively, the way we work is we have Tia, the TeamViewer Intelligent Agent. That agent is orchestrating the learning from session insights, the code generation, and then bringing this into the automation library. And we're adding functionality with every release. There will be a next big release coming in a few weeks from now to really continue to build this infinity loop of self-reinforcing and self-learning to get us to self-healing IT. We expect a good continuation of the growth, so adding first-time users to the platform, as you said, doubled to 49,000. I think we quickly reach 50,000 towards the end of this month and from there adding, adding users during every day-by-day and then also increasing the usage of Tia and within the usage of Tia, the depth of the functionalities within Tia. So we don't have an outlook in terms of how the numbers will grow, but it's a significant addition that we're seeing dayby-day. You asked for segments. It's across all, I would say, segments, SMB, upper part of SMB. So every customer that has regular usage in the IT sphere in our product, so not very occasional use at the consumer side, but really like day-to-day users of the product, whether it's SMB or the largest enterprises, it becomes part of their usage very clearly. And especially on the enterprise side, the feedback is very encouraging because you saw some of the quotes, they really see the improvement in productivity that's coming from that. And I think that's the ultimate measure that we need to watch. Victor Cheng
Very clear. Thank you.
18
Operator
The next question comes from the line of Alice Jennings from Barclays. Please go ahead.
Alice Jennings
Hi, good morning. Thank you for taking my question. I'd firstly just like to understand a bit more about the weakness in SMB ARR, so it was slightly weaker than last quarter, I believe. How much of an impact, for example, did the commercial measures that were taken last year have, or have you seen any kind of change in the competitive environment or any change in customer decision-making, particularly in that lower bucket? And then also with reference to that lower bucket, do you expect that to remain a drag in H2 and the improvement in SMB is largely driven by that higher end, or how should we think about that? And then I just have a second question as well on enterprise. How does the pipeline look? I know you mentioned that there's a few deals. Is this largely relating to kind of TeamViewer standalone, or are they 1E DEX-related deals, and what kind of level of pipeline conversion are you assuming for the rest of the year? Thanks.
Michael Wilkens
Yes, thanks, Alice. Let me start with the SMB question. First of all, yes, it's shrinking in Q2, but it's less shrinking in Q2 vis-a-vis Q1, and this is why we also brought the Page 8. So clear stabilization, which we indicated in Q2 already for Q1 on churn. That was important, and we delivered on that one. Not only that, we project also an improvement on churn and in churn for Q3 and for the remainder of the year. And very early indicators in July actually show us that we are actually improving already on churn. So that's maybe message number one, and of course, it's important. On the lowest end in the SMB side of the house, we cannot do much, right? It's the base, it's the licenses between 200 and 300, and there's lots of competition, there's less so interest in any AI features. And if we would ever consider here any price changes, the demand-supply curve would not work. So, let's stick with the lowest end of the SMB part as it is. More importantly, from the upper two segments, 500 to 1,500 and especially the 1,500 to 10,000, here is, of course, accelerating interest also in AI features, especially in the upper end. And in the middle block, this light blue block, if you would adjust for the movers within SMB from light blue to purple, the minus 6% would be close to zero. So stabilization there as well. And there are lots of positive trends actually which give us an encouraging feeling for the
19
remainder of the year, which is one ingredient also for the acceleration in H2 and therefore for full year. Oliver Steil
Maybe to add on the SMB before you go on enterprise, Mark. The competitive landscape, you were asking has anything changed on the competitive landscape. No. I mean, it's effectively kind of same type of players, kind of the same activity on the competitive side. But with one major exception, of course, and you can see that in our TeamViewer ONE acceleration. We’ve deliberately shown the TeamViewer ONE standard and advanced. There's also TeamViewer ONE enterprise, which we had the big deals that Mark talked about. But standard and advanced is very much focusing on the SMB, and we have a much, much better offering now. So our TeamViewer ONE offering, where we combine the remote proposition with the platform proposition and AI, is giving us really a very strong product to compete in the marketplace against unnamed players and against the smaller platform players to differentiate ourselves from remote pure play, so to speak. And that's starting to work, and you can clearly see on the numbers if you take TeamViewer ONE standard and advanced Q1 versus Q2, there's very significant growth. Now, that's not translating yet in SMB growth because it's a smaller number relative to the big base, and we have these churn stabilization topics which we need to get to and are starting to see as Michael mentioned. But it's going to come because it's a new product which comes with very good upsell into the SMB base, and as this is working through the base, we will see improvement there. And that's a much better strategic positioning, competitive positioning than we ever had before on SMB. So that's why we are very confident for the second half of the year to see acceleration there. Mark on enterprise pipeline?
Mark Banfield
Yeah, sure. Thanks, Oliver. And yeah, Alice, specifically to that question around the type of pipeline, the volume of pipeline, and then the conversion expectations in the second half. There's a couple of points to make. First off, one of the things underpinning our confidence around pipeline development is around TeamViewer ONE. So if you think about these large enterprises, every single one of them uses remote control every single day to resolve employee issues. But most of that data is lost directly after a remote control session is completed. And of course, the TeamViewer ONE vision not only takes that data, understands it, turns it into autonomous capabilities, it really 20
helps them become to sort of really realize this autonomous endpoint management vision. So whilst many organizations use remote access and remote control alongside a DEX platform, no one has this vision of bringing the two together where one feeds the other. So that's really resonating, and that's definitely fueling our pipeline, both in terms of the volume of pipeline but also the conversion expectations in the second half. The second kind of major tailwind, I'd say, is around AI. So, you know, obviously AI is being deployed at an alarming rate across every enterprise organization at the endpoint. You know, I mean, it's being deployed all over the place. And the reality is that most enterprise organizations have realized that they have a lack of control and governance and management of what's happening across those devices. We showed that slide in the deck there which talks about this. This is a major tailwind is what we're seeing. We're seeing an increased demand for a platform that can manage and govern AI across the enterprise. And we specifically what we're doing with TeamViewer DEX. So really we're creating this control layer above the endpoints, which is key. And the last point to make is just really all around sales execution and productivity. So as you know, as we've communicated in previous quarters, we've significantly transformed the go-to-market engine in terms of investments made around certain leadership and talent that's come into the organization, in terms of the go-tomarket strategy and approach. You know, we're clearly very focused now on platform selling, land and expand, as we shift customers left from reactive support to proactive IT autonomous capabilities. That requires a very specific kind of solution sale methodology, and we continually enhance that on a day-byday basis. And you're starting to see, I think, the results of those investments around we made around go-to-market start to play out in Q2, and I expect it will go up and up from there as we go into the second half. So that really underpins how we view and how we look at pipeline for the second half of the year. Alice Jennings
Great, very helpful. Thank you.
Operator
The next question comes from the line of Ben Castillo from BNP Paribas. Please go ahead.
Ben Castillo
Hi, good morning. Yeah, thanks for having me on here. Question just on some nice examples of the DEX and TeamViewer ONE deal wins. How can we think about the 21
impact of selling more on endpoints and platform adoption on the impact on your enterprise ARPU? Is it possible for you to help us, you know, with some color on the typical impact on deal sizes you're seeing? And I guess a follow-up, just on Slide 15 with those with those deals that you've mentioned there. You know, how should we think about how endpoint price contracts work? If I just, again, maybe it's oversimplifying, but if I look at the sort of price per endpoint on the ARR, it seems like quite a wide variance. So is there a rule of thumb, or can you just give us a sense on how those contracts are structured? Thank you. Mark Banfield
I'm happy to start. So look, I think, yeah, obviously a couple of things to say here. One is the Slide 15 that you're talking about, clearly where we migrate and upsell people to the platform, we're achieving a higher endpoint price because we're combining DEX and Tensor together with this TeamViewer ONE vision, and we are achieving uplift. Now, you know, varying levels of uplift across those across those customers. It very much depends on the particular sales situation, what price point we sold at in the past, where they're at in terms of a contractual standpoint. So, you know, we're taking it on a case-by-case basis, but we are seeing uplift across the Board. And I say that it's helping us also become more, it's certainly helping us become much more competitive in new logo opportunities as well as expansion because effectively, you know, we're bringing together two technologies that no one else is able to bring together. So it's allowing us to offer different outcomes to customers. I think that's the key point here is that this is outcome-based selling, and we're able to offer different outcomes to customers and therefore, I think over time, we'll be able to command a better price point. Oliver?
Oliver Steil
Yes, so general direction of travel, Ben, is significantly larger deal sizes when we go to endpoint pricing, endpoint-based pricing. Why is that? The value of the platform is coming through if you roll it out across the company, across the footprint, so to say. Now, that requires companies, customers to take a view of managing devices regularly. And if you look at TeamViewer historically, there has always been a combination of managed devices and non-managed devices, so ad hoc remote support. So you have an environment, and from a TeamViewer perspective, old world, we would see that, I don't know, 10,000 devices are managed devices, they are registered, 22
so we see them in our registry. And then there's lots of remote report sessions that happen to other devices, which is ad hoc support without really registering the devices and paying for these devices. But therefore, the pricing logic is per technician because we charge per seat or per technician independent of whether it's a managed device or unmanaged device. With TeamViewer ONE as a proposition, we really addressing those customers that want a managed platform consistently across their environment. And that then requires to register all the devices, and in that sense, we move to a pricing logic which is the pricing logic of a platform player or a remote management player or other DEX players or other endpoint-oriented players. And therefore, we typically see, as Mark just said, a significant uplift in the deal size and the deal volume. And that's quite consistent now actually across TeamViewer ONE standard, TeamViewer ONE advanced, and TeamViewer ONE enterprise. Ben Castillo
Thanks very much. If I could squeeze in a follow-up just on the sort of selling environment, what you saw through Q2, obviously lots of puts and takes in terms of geopolitics and conflicts and so on. Just any comments on what you saw in sales cycles, pipeline conversion, customer decisionmaking?
Oliver Steil
Yeah, I can go first. Clearly from the geopolitics, we have seen better times, and at least some of the customers, especially on the bigger ones, they tend to become a little bit more cautious, especially on upfront paid multi-year deals. And some of the deals take a little bit longer in decision-making. We do not know whether there is a direct combination or correlation between geo and them or whether it is partially AI topics or other problems they have to cope with, but it tends to take a little bit longer on some of the deals.
Mark Banfield
Definitely. I mean, the thing to add, Ben, I think is what I see is there is a growing anxiety in the enterprise environment to get control and management of this proliferation of AI across the enterprise. And, you know, that's really what we are offering with TeamViewer ONE and with DEX is the ability to automate the whole workflow on how you manage IT, but it provides a level of governance and control. And certainly, it is even more accelerated with our partnership with ServiceNow, you know, who is the AI control tower for the enterprise. But you combine what we are doing on the endpoint at the edge with what ServiceNow 23
is doing, I think there is -- it really -- we are seeing a lot more acceleration in terms of I think it will help us with buying cycles because it really is kind of a necessity to move very, very quickly for enterprise organizations now. Ben Castillo
All right. Thank you.
Operator
The next question comes from the line of Toby Ogg from JPMorgan. Please go ahead.
Toby Ogg
Yeah, hi, good morning and thanks for the question. Couple from me. Just firstly on the free cash flow, as you mentioned, down year-over-year. You talked about various drivers there, including that lower upfront contribution from multiyear deals than expected. Could you talk a bit about your expectations for that dynamic in the second half and just confidence levels around cash conversion evolution for the full year in light of that multi-year deal dynamic? And then just on the SMB churn, you mentioned, Michael, you would see an improvement in July on the SMB side. Can you help us understand, you know, what you think have been the biggest drivers that have contributed to that improvement in churn and, yeah, which of those you think is sort of having the biggest impact on that improvement? Thank you.
Michael Wilkens
Yeah, clearly, hi Toby. Let me start with two. Clear drivers are certainly the massive price increases and the commercial blocker of last year, which is clearly washing out now. And we -- this is the main driver which we see already for Q3, and it will continue for Q4. When we do price ups now, it is a more formal logic, it is an offer to the customers, and they get AI ingredients and features, and the customers opt for it or they do not, and then they do not get a price up. And this is obviously helping tremendously into customer satisfaction and therefore less so churn. That is the main driver. And the other one is obviously with our platform game in the context of TeamViewer ONE. Once you combine the product features into a suite and once you are in, you have obviously lesser and lesser reasons to think about others because you de facto get all of one basket. These are the two main drivers I think I would leave potentially remaining ones to Mark. On the first one on cash flow, yes, indeed, as mentioned, cash flow a little bit softened in Q2 for various reasons, and this is why we are also confident that that will change for H2. Number one is the upfront paid multi-year deals. This is what we cannot change. We had an expectation there, it did
24
not work out. This is certainly related to macro and hopefully this will ease now in H2. Number two, and that is a technical one, the former 1E customers needed to change their addresses, their data in the systems in order to become TeamViewer customers, and that caused a technical delay in their payment. This alone is rough cut 5 million, and this will come now in Q3. So it is only a delay and not a change. And last but not least, to your question on cash conversion, yes, we were at 52. Now, we guided or we said we did not guide on cash, but we said something around 60, and this is clearly what we see, whether it is now 56 or 57 or 58 does not matter for us, especially as it is very important to us also to keep on investing into growth. Remember, ‘26 is the transformation year and the growth is important for us, especially as we walk into 2027, super important. And in the end, the name of the game is our net debt leverage ratio, which we indicated to be around 2.3 and this is what we can clearly see as we are heading towards the end of the year. So all in all, all good. Operator
Ladies and gentlemen, that was the last question. I would now like to turn the conference back over to Oliver Steil for any closing remarks.
Oliver Steil
Yeah, thank you. Thanks for the questions all. So as you see, I think Q2 was really all about proving the plan and building momentum. And it is clear that the developments that we were expecting at the beginning of the year are now materializing. So that is really good. We have the DEX turnaround that is taking hold. We have SMB churn stabilizing as it was anticipated. So all operational indicators across the business moved in the right direction through the quarter or towards the end of the quarter. So that's really good. We are very excited. Particularly encouraging is the momentum on TeamViewer ONE across the segments really. That is why we showed the number and disclosed the numbers. We see continuation, acceleration there and adoption, and customers do really embrace the platform approach. So I think from a strategic development of the company where we were like a few years ago and where we are now in terms of platform play and seeing that the largest DEX customers are expanding and moving onto TeamViewer ONE is a very, very attractive one. And then yes, there is the AI discussion or has been the AI discussion, clearly. But I think what we see on our end is AI 25
adoption continues to scale rapidly, and that is strengthening the foundation behind autonomous endpoint management. So we believe we're getting stronger and stronger with our innovation pipeline around AI. Customers, analysts, and not the least ServiceNow are validating our position there. So our competitive position significantly improving, and therefore we believe we have a clear plan, we have a differentiated platform, we are executing, and second half of the year will be important as always, but we feel really good about the momentum and the pipeline that is building there. So with this, thank you very much for your time and speak again soon. Thank you. Have a good day.
26
Q2 2026 Press Release and Quarterly Statement GÖPPINGEN, Germany, 28 July 2026
TeamViewer Q2 2026: DEX turnaround and TeamViewer ONE platform momentum; full-year guidance reaffirmed ◉
Revenue reached €182.7m (-1.4% cc yoy1), ARR flat cc yoy: Previously disclosed effects (SMB churn and DEX) are leveling off in line with internal expectations
◉
Profitability remained strong: Q2 2026 Adjusted EBITDA of €78.9m with a margin of 43.2%
◉
Full-year 2026 guidance reaffirmed: key leading indicators all moved in the right direction throughout the quarter. This supports management's expectation of growth acceleration during the second half of 2026
◉
Enterprise growth momentum, AI adoption accelerating, SMB churn stabilizing ◉
Enterprise ARR growth of +8.3% cc yoy driven by DEX turnaround and TeamViewer One rapid scaling
◉
DEX turnaround is fueling growth: DEX delivered a strong commercial recovery, with major customers recommitting through larger, longer-term agreements and increased upsell activity, and are consolidating vendors by adopting a single unified platform for remote and DEX. This is underscoring growing customer buy-in to TeamViewer’s integrated platform for Autonomous Endpoint Management
◉
1
◉
TeamViewer ONE adoption is accelerating: Combined cross-sell and up-sell momentum across DEX and Tensor accelerated TeamViewer ONE scaling. Several strategic DEX customers adopted TeamViewer ONE with a meaningful ARR uplift
◉
SMB churn is starting to stabilize as expected: Targeted retention initiatives and improving sales execution are taking effect. SMB headwinds expected to continue moderating through the second half of 2026
◉
AI adoption accelerating as customers advance toward Autonomous Endpoint Management: AI customers reached 49k and AI sessions increased to 2.8m (effective 25 July 2026), driven by the successful inclusion of AI capabilities across core product packages. Strong customer adoption validates TeamViewer's AI-first strategy, enhances customer value creation, and establishes a foundation for future innovation and TeamViewer One adoption
Strategic position at the center of autonomous IT operations validated by landmark ServiceNow partnership, leading industry analysts, and Federal Risk and Authorization Management Program (FedRAMP) “In Process” milestone, highlighting long-term growth opportunities
YoY revenue growth rate is compared to Q2 2025 comparable pro forma Revenue of €190.7m.
TeamViewer SE
1
Q2 2026 Press Release and Quarterly Statement
Oliver Steil, TeamViewer CEO “The business has reached an inflection point, with the turnaround in DEX and the stabilization of SMB churn playing out as expected,” said Oliver Steil. “The measures we’ve taken and our long-term strategy are bearing fruit. DEX churn has normalized to the lowest level since the 1E acquisition, and major enterprise customers have recommitted to our DEX platform with multi-year renewals. Several flagship customers upgraded to TeamViewer ONE, a strong validation of our platform strategy. This is reinforced by recent recognition from leading industry analysts and our landmark ServiceNow partnership
announcement. With long-term commitments and joint investments, this is a strategic partnership built to grow and shape the future of autonomous IT operations. With this tailwind, we are on track for accelerating business dynamics in the second half of 2026 and reiterate our full-year guidance.”
Mark Banfield, TeamViewer CRO “Q2 provides clear evidence that our platform strategy is gaining traction,” said Mark Banfield.
“TeamViewer ONE continued to scale rapidly and is becoming an important driver of growth. Expansion reflected growth within existing accounts, and upsell into our unified platform, as customers consolidate vendors and embrace our vision of Autonomous Endpoint Management. Our DEX turnaround and TeamViewer ONE adoption fueled +11% cc yoy growth in the highest-value Enterprise ARR bucket. At
the same time, SMB churn stabilized in June as expected, and the temporary impact of our strategic course-correction measures continues to moderate. This is exactly the operational progress we committed to.”
Michael Wilkens, TeamViewer CFO “Q2 showed meaningful progress across several leading indicators of future growth,” said Michael Wilkens. “While Q2 revenue growth continued to reflect the effects of previously disclosed headwinds, underlying indicators improved throughout the quarter. Key operational indicators - including Enterprise ARR growth, Enterprise NRR, TeamViewer ONE adoption and SMB churn - all moved in the right direction during the quarter and reinforces our confidence in the expected growth acceleration in the second half of 2026. We reiterated our full-year 2026 guidance of 0% to 3% constant-currency revenue growth and an adjusted EBITDA margin of around 43%.
We also continued to strengthen our financing profile. During the quarter, we successfully extended the maturity of our €75 million revolving credit facility through 2031, we secured a new €40 million bilateral financing agreement and initiated a new Schuldschein placement. This further enhances our financial flexibility and positions TeamViewer well to support future growth while continuing to deleverage.”
TeamViewer SE
2
Q2 2026 Press Release and Quarterly Statement
Q2 2026 company results at a glance (consolidated, unaudited) in € million (unless otherwise stated)
Q2 2026
Q2 2025
Δ in %
Δ in % cc
Annual Recurring Revenue (ARR)
736.8
759.1
-2.9%
-0.1%
Revenue1
182.7
190.7
-4.1%
-1.4%
Gross profit1,2
167.6
175.2
-4%
Gross profit margin1,2
92%
92%
0 pp
Adjusted EBITDA1
78.9
84.0
-6%
Adjusted EBITDA margin1
43%
44%
-1 pp
EBITDA
70.6
77.9
-9%
Operating profit (EBIT)
57.3
63.9
-10%
Net income
30.1
22.6
+33%
Basic number of shares issued and outstanding (m)
157.8
157.0
+1%
Earnings per share – basic (in €)
0.19
0.14
+32%
Adjusted net income1
42.5
44.3
-4%
Adjusted earnings per share – basic (in €)1
0.27
0.28
-5%
Cash flows from operating activities
57.6
72.2
-20%
Free cash flow (FCFE)3
40.8
59.6
-31%
Net debt
832.8
991.7
-16%
1
Q2 2025 comparable actuals are pro forma. YoY growth rate is compared to Q2 2025 pro forma comparable actuals. Gross profit in this table is calculated based on recurring costs and therefore differs from the gross profit presented in the IFRS P&L. 3 Adjusted for the effects from the 1E acquisition. 2
Business Update Proving the plan, gaining speed The second quarter delivered the proof points management signaled at the start of the year. The DEX business turned around, TeamViewer ONE continued to scale rapidly, Enterprise momentum strengthened, and SMB churn stabilized toward quarter-end as expected. Revenue, as a lagging indicator, still reflects previously disclosed headwinds, while key growth drivers for the second half of the year are showing sequential improvement. The landmark ServiceNow partnership and a series of analyst recognitions reinforce TeamViewer’s strategic position and set the stage for an anticipated growth acceleration in the second half of 2026.
Successful DEX turnaround The DEX business is well through the trough. Churn dropped to its lowest level since the 1E acquisition, and major enterprise customers, including two leading global financial services groups, a large US hospital system, and one of the largest airlines worldwide, recommitted to the platform with multi-year renewals and expanded contracts. A number of renewing TeamViewer customers went a step further by
TeamViewer SE
3
Q2 2026 Press Release and Quarterly Statement
moving onto TeamViewer ONE. This is the cross-sell logic of the 1E acquisition playing out in real deals: large customers buying into TeamViewer's platform strategy around Autonomous Endpoint Management (AEM).
Rapid TeamViewer ONE growth TeamViewer ONE has scaled faster than any prior TeamViewer product launch and is the key driver of double-digit growth in the highest-value Enterprise ARR bucket. This was driven by flagship customer wins including a leading global aviation technology company as well as accelerating upsell momentum in both Enterprise and SMB. Companies across the customer base are consolidating fragmented point tools onto a single AI-driven platform for self-healing IT, confirming the market opportunity TeamViewer ONE was built for.
Compounding AI adoption On 25 July 2026, about 49k customers have used at least one of TeamViewer's AI features, nearly doubling from 26k in the first quarter. Customers summarized more than 516k remote support sessions with AI in June alone, taking the cumulative total past 2.8m. Every session strengthens TeamViewer’s
proprietary knowledge base, a structural data advantage for the delivery of self-healing IT innovation.
TeamViewer ONE can now generate AI-driven remediation scripts, allowing known issues to be resolved automatically the moment they are detected. TeamViewer’s R&D teams are advancing rapidly with their agentic AI roadmap to deliver a leading platform for autonomous IT operations.
Landmark ServiceNow partnership As a milestone endorsement of TeamViewer's technology and market position, TeamViewer and ServiceNow recently announced a multi-year strategic partnership. Under the agreement, TeamViewer's market-leading DEX and Remote Connectivity solutions will be integrated with the ServiceNow AI Platform and offered as a packaged add-on to ServiceNow customers worldwide, supported by implementation and channel partners. Backed by joint dedicated investments, the partnership puts TeamViewer's endpoint technology in front of ServiceNow's global enterprise customer base, with the intent to expand into new use cases and markets. ServiceNow orchestrates workflows and systems of record, while TeamViewer operates at the endpoint, where digital friction occurs and remediation is needed. Together, they close the loop to deliver end-to-end autonomous IT solutions.
Strong external validation TeamViewer DEX was again named a Leader in Gartner’s “Magic Quadrant for Digital Employee Experience Management Tools”, followed shortly by a Leader position in the “IDC MarketScape: Worldwide Digital Employee Experience 2026 Vendor Assessment”: two major analyst endorsements within a month. In July, PAC recognized TeamViewer Frontline as the only best-in-class solution in its “2026 PAC Innovation Radar: Digital Platforms for Connected Workers”, and Frost & Sullivan ranked the solution as market leader among AR-centric platforms in the “Frost Radar: Augmented Connected Worker, AR-Centric Platforms, 2026”. In addition, TeamViewer DEX received the FedRAMP "In Process" designation in late May, sponsored by the U.S. Department of Veterans Affairs, a key milestone toward the U.S. public sector and regulated markets.
TeamViewer SE
4
Q2 2026 Press Release and Quarterly Statement
Financial Highlights Strong profitability in Q2 2026 amid temporary softness in topline Revenue growth in the second quarter was held back by previously disclosed effects temporarily weighing on the topline. 6M 2026 revenue reached €365.9m, which is -0.9% cc yoy on pro forma basis and
+3.6% cc yoy on IFRS basis. Profitability remained strong, with Adjusted EBITDA margin of 43.2%. At the same time, underlying leading indicators: DEX turnaround, accelerating TeamViewer ONE adoption, Enterprise ARR growth, Enterprise NRR, and stabilizing SMB churn drove sequential growth improvement throughout the second quarter. This supports confidence in the expected growth acceleration in the second half of 2026.
ARR and Revenue development Q2 2026
Q2 2025 pro forma
Δ in %
Δ in % cc
Revenue
58.6
58.7
-0.1%
+2.8%
ARR1
235.5
227.1
+3.7%
+8.3%
Enterprise NRR (cc)1
94%
98%
Enterprise NRR (cc)1 adj. for net upsell from SMB
98%
103%
Revenue
124.1
132.0
-6.0%
-3.2%
ARR1
501.4
532.0
-5.8%
-3.6%
Revenue
182.7
190.7
-4.1%
-1.4%
ARR1
736.8
759.1
-2.9%
-0.1%
NRR (cc)1
93 %
97 %
of customers (reporting date) (in thousands)1
611.9
656.4
-7%
100.4
99.8
+0.6%
+1.0%
AMERICAS
64.7
72.7
-10.9%
-5.6%
APAC
17.6
18.2
-3.3%
+2.7%
in € million (unless otherwise stated) Enterprise
SMB
Total
Revenue by region EMEA
1
Q2 2025 comparable actuals and growth rates are non-pro forma.
TeamViewer SE
5
Q2 2026 Press Release and Quarterly Statement
In Q2 2026, ARR remained broadly stable at €736.8m (-0.1% cc yoy). Enterprise momentum strengthened in the second quarter. Enterprise ARR grew by +8.3% cc YoY, driven by new customer wins, particularly in the Americas region, higher customer engagement, and a strengthened go-to-market model. DEX turnaround and rapid TeamViewer ONE adoption fueled +11% cc yoy growth in the highest-value ENT ARR bucket (€ >200,000 ARR). Enterprise NRR improved by 1.4 percentage points sequentially to 94% (Q1 2026: 93%; Q2 2025: 98%2), driven by stronger customer retention and increasing TeamViewer ONE adoption. Adjusted for net upsell of €10.7m (€+0.2m sequentially) in the quarter from SMB to Enterprise, Enterprise NRR (cc) was 98% (Q2 2025: 103%2). The total number of Enterprise customers increased to 5,311 at the end of Q2 2026. SMB ARR was down by 3.6% cc yoy to €501.4m, in line with internal expectations. Strategic coursecorrection measures to revitalize SMB had a negative short-term impact on smaller SMB customers, with SMB ARR < €1.5k down 7.0% cc yoy. Higher-value SMB customers ARR (SMB ARR > €1.5k), remained stable at -0.2% cc yoy. The number of SMB customers amounted to 607k at the end of Q2 2026. In Q2 2026, Revenue decreased by 1.4% cc yoy2 to €182.7m (Q2 2025: €190.7m). Reported Revenue was negatively impacted by foreign exchange movements, resulting in a 2.8 percentage point headwind yoy in the quarter, primarily driven by the USD. The average EUR/USD exchange rate in Q2 2026 was 1.16, compared to 1.13 in Q2 2025. SMB Revenue decreased by 3.2% cc yoy2 to €124.1m (Q2 2025: €132.0m). Enterprise Revenue was up +2.8% cc yoy2 and reached €58.6m (Q2 2025: €58.7m). In Q2 2026, EMEA and APAC delivered revenue growth yoy2 in constant currency. EMEA revenue grew by +1.0% cc yoy2 and reached €100.4m (Q2 2025: €99.8m). APAC revenue grew by +2.7% cc yoy2 to €17.6m (Q2 2025: €18.2m). AMERICAS revenue declined by 5.6% cc yoy2 to €64.7m (Q2 2025: €72.7m), which was impacted by previously disclosed churn effects temporarily weighing on the DEX business.
Adjusted EBITDA In Q2 2026, Adjusted EBITDA was €78.9m, down 6.0% yoy2 (Q2 2025: €84.0m). This decline mainly
reflects lower revenue and a 5.4 percentage point FX headwind in the quarter. Continued cost discipline partly offset these impacts, with total Recurring Cost decreasing by 2.7% yoy2 to €103.8m (Q2 2025: €106.7m). As a result, Adjusted EBITDA margin remained strong at 43.2%, -1 pp yoy2 (Q2 2025: 44.1%). Excluding the negative effect from FX headwinds on the margin, Adjusted EBITDA margin would have
been 44.4%. Total 1E acquisition related material adjustments in EBITDA were €0.8m, which related to ongoing system integrations. Cost of Goods Sold (COGS) decreased by 2.0% yoy2 to €15.1m (Q2 2025: €15.4m), which reflects lower variable costs in line with topline development and lower Frontline related implementation costs. Sales expenses increased by +5.4% yoy2 to €32.0m (Q2 2025: €30.4m), driven by investments to strengthen customer acquisition capabilities and support long-term customer retention. Sales costs as % of Revenue were 18%2 (Q2 2025: 16%). Marketing expenses decreased by 28% yoy2 to €22.3m (Q2 2025: €30.7m), reflecting elevated marketing investments in the prior-year quarter. As previously indicated, marketing activities increased sequentially from Q1 2026, supporting brand and demand generation initiatives. Research & Development (R&D) expenses increased by +12% yoy2 to €24.0m (Q2 2025: €21.4m), reflecting continued investments in product innovation, AI capabilities and the expansion of the combined platform. R&D expenses represented 13%2 of Revenue (Q2 2025: 11%). General & administrative (G&A) expenses increased by 4.4% yoy2 to €9.7m (Q2 2025: €9.3m), primarily reflecting timing effects between quarters. Other expenses amounted to €0.7m, compared to a gain of €0.6m in Q2 2025, primarily reflecting lower positive impacts from derivatives.
Adjusted net income In Q2 2026, Net income increased by +33% yoy to €30.1m (Q2 2025: €22.6m). Total interest expenses were €10.0m in Q2 2026, down by €0.5m yoy, reflecting reduced net debt position. Adjusted net income 2
Q2 2025 comparable actuals are pro forma.
TeamViewer SE
6
Q2 2026 Press Release and Quarterly Statement
was down 4.2% yoy3 and reached €42.5m (Q2 2025: €44.3m). Adjusted (basic) EPS was down 4.7% yoy3 and reached €0.27 (Q2 2025: €0.28).
Financial Position In Q2 2026, cash flows from operating activities amounted to €57.6m, down by 20% yoy, partly reflecting lower topline growth and partly due to a lower contribution from multi-year contracts with upfront payments compared with the prior year. Cash flows from investing activities were €-5.5m. Cash flows from financing activities amounted to €-45.3m and mainly include repayments of borrowings of €55.0m, proceeds from new borrowings of €25.0m and related interest payments of €11.4m. As a result, Cash and cash equivalents were €39.6m (broadly flat yoy) at the end of Q2 2026. Levered Free Cash Flow (FCFE) adjusted for 1E acquisition was €40.8m in Q2 2026, representing a decrease of 31% yoy.4 This development reflects a softer pre-tax net cash flow from operating activities (-21% yoy) driven by softer topline, and less multi-year deals with upfront payments, partially offset by lower expenses for income taxes, and lease payments. Net Debt totaled €832.8m at the end of Q2 2026, which is an improvement of €37.2m compared to €870.0m at 31 March 2026. Net Leverage Ratio remained stable at 2.5x (Net Debt/pro forma Adjusted EBITDA LTM) and it remains in line with TeamViewer’s internal deleveraging target to reach around 2.3x by the end of 2026.
FY 2026 Guidance reaffirmed TeamViewer reaffirms full-year 2026 guidance and continues to expect growth acceleration as temporary topline effects unwind and commercial momentum around TeamViewer ONE and AI continues to build in the second half of 2026. For full-year 2026, TeamViewer expects: ◉
Revenue growth in constant currencies between 0% and 3% yoy (vs. pro forma Revenue FY 2025 of €767.5m); and
◉
Adjusted EBITDA margin of around 43%.
Revenue growth (YoY constant currency vs PY pro forma basis) Adjusted EBITDA Margin (as reported, incl. currency effects)
FY 2025 Pro Forma (comparison base)
FY 2026 Guidance
€767.5m
0% - 3% cc 1,2
44%
~ 43%
Revenue growth in constant currencies vs IFRS Revenue FY 2025 of €746.8m will be higher than the revenue growth in cc vs pro forma Revenue FY 2025 of €767.5m. 2 Constant currency growth including an average exchange rate of 1.13 EUR/USD for FY 2025. 1
While the revenue growth guidance for FY 2026 is in constant currency, actual currency reported revenue is expected to be impacted by currency exchange rate fluctuation. The expected total FX impact on FY 2026 revenue growth guidance in constant currency is negative 2.4 percentage points, primarily driven by the USD. This reflects the actual FX impact recorded in H1 2026, the expected FX impact for H2 2026 based on June 30, 2026 spot rates, and deferred FX effects resulting from 3 4
Q2 2025 comparable actuals are pro forma. Adjusted for the effects from the 1E acquisition.
TeamViewer SE
7
Q2 2026 Press Release and Quarterly Statement
TeamViewer’s centralized invoicing model. Each quarter, TeamViewer will provide expected currency impact on revenue growth in the quarterly earnings presentation. Additionally, TeamViewer will provide the additional expected FX impact that comes from historic deferred revenue release to avoid systematic over/underestimation of currency movements in reported revenue. TeamViewer’s central invoicing model and IFRS treatment fix deferred revenue at the invoice-date FX rate, causing FX effects when historic deferred revenue is released in revenue.
Webcast Oliver Steil (CEO), Michael Wilkens (CFO) and Mark Banfield (CRO) will speak at an analyst and investor conference call at 9:00 am CEST on 28 July 2026 to discuss the Q2 2026 results. The audio webcast can be followed via https://www.webcast-eqs.com/login/teamviewer-2026-q2. A recording will be available on the Investor Relations website at https://ir.teamviewer.com/publications/financial-results. accompanying presentation is also available for download there.
The
About TeamViewer TeamViewer (XETRA: TMV) resolves digital friction before it disrupts productivity. As AI compounds the
sprawl of machines, applications, and agents beyond human reach, TeamViewer restores control: observing endpoint health in real time, acting autonomously to keep technology in its desired state, and guiding operators when human judgment is needed. Its TeamViewer ONE platform unifies endpoint management, digital employee experience, and agentic remote support to lead the shift to autonomous
endpoint management (AEM). Built on a structural data advantage from millions of AI-captured expert resolutions, the platform powers self-healing technology and grows more capable with every issue it fixes. More than 600,000 customers, from small businesses to the world's largest enterprises, rely on TeamViewer to keep their digital and physical operations running. Learn more at www.teamviewer.com.
Half-Year Report
H1 2026
𝍢
2
TeamViewer at a Glance
IMPORTANT NOTICE Interactive PDF This PDF document is optimized for on-screen use. The table of contents can be accessed via the top right navigation icon. The links contained there lead directly to the respective chapters.
H1 2026
H1 2025
Δ YoY
Revenue (IFRS) (in EUR million)
365.9
364.4
0%
Annual Recurring Revenue (ARR) (in EUR million)
736.8
759.1
-3%
Number of customers (reporting date) (in thousands)
612
656
-7%
Net Retention Rate (NRR) (cc ), Enterprise
94%
98%
-4 pp
Definition of TeamViewer TeamViewer refers to the TeamViewer Group, consisting of TeamViewer SE and its consolidated subsidiaries.
Adjusted EBITDA (in EUR million)
161.9
155.1
+4%
Adjusted EBITDA margin (adjusted EBITDA in % of revenue)
44%
43%
+2 pp
TeamViewer SE refers to the individual company or Group parent company.
EBITDA (in EUR million)
145.7
144.4
+1%
EBITDA margin (EBITDA in % of revenue)
40%
40%
0 pp
EBIT (in EUR million)
119.1
117.1
+2%
33%
32%
0 pp
Cash flows from operating activities (in EUR million)
99.3
110.4
-10%
Cash flows from investing activities (in EUR million)
(6.5)
(686.7)
-99%
Levered Free Cash Flow (FCFE) (in EUR million)
64.6
104.0
-38%
Cash conversion (FCFE/adjusted EBITDA)
40%
67%
-27 pp
Cash and cash equivalents (in EUR million)
39.6
40.5
-2%
R&D expenses (in EUR million)
(52.1)
(47.9)
+9%
Employees, full-time equivalents (FTEs) (reporting date)
1,967
1,904
+3%
Earnings per share – basic (in EUR)
0.41
0.33
+22%
Adjusted earnings per share – basic (in EUR)
0.56
0.53
+5%
Sales
1
Profits and margins
EBIT margin (EBIT in % of revenue) Cash flows
Other
1
Constant currency (cc) comparisons eliminate the impact of exchange rate fluctuations between different periods.
TeamViewer SE – Half-Year Report H1 2026
Rounding Percentage changes and totals are calculated based on unrounded figures. Therefore, values may not add up precisely to the totals given, and percentage changes may not reflect those based on rounded figures. Alternative performance measures This document contains alternative performance measures (APMs) that are not defined under IFRS. The APMs are reconcilable to the measures included in the IFRS consolidated financial statements and should not be viewed in isolation. TeamViewer believes that APMs provide a deeper understanding of the Company’s business performance. Gender-related references Care has been taken to use gender-inclusive language when possible. In cases where this is not possible, this in no way implies discrimination against other genders. In the interest of equal treatment, such terms apply equally to all genders.
𝍢
Table of contents
A – Interim Management Report
5
B – Condensed Interim Consolidated Financial Statements
18
C – Further Information
42
TeamViewer SE – Half-Year Report H1 2026
𝍢
4
A – Interim Management Report 1 Group Fundamentals .........................................................................................................................
5
C – Further Information
42
6
1 Financial Calendar ..............................................................................................................................
2 Report on Economic Position ........................................................................................................
8
2 Imprint.......................................................................................................................................................
43
3 Events after the Reporting Date .................................................................................................
16
3 Disclaimer ................................................................................................................................................
44
4 Opportunities and Risks ...................................................................................................................
16
5 Outlook......................................................................................................................................................
17
B – Condensed Interim Consolidated Financial Statements
18
1 Consolidated Statement of Profit and Loss and Other Comprehensive Income from 1 January to 30 June.................................................................................................................
19
2 Consolidated Statement of Financial Position as of 30 June ........................................
20
3 Consolidated Statement of Cash Flows from 1 January to 30 June ...........................
21
4 Consolidated Statement of Changes in Equity ....................................................................
22
5 Notes to the Condensed Interim Consolidated Financial Statements.....................
23
6 Responsibility Statement ................................................................................................................
40
7 Review Report .......................................................................................................................................
41
TeamViewer SE – Half-Year Report H1 2026
43
𝍢
A – Interim Management Report
TeamViewer SE – Half-Year Report H1 2026
6
A – Interim Management Report – 1 Group Fundamentals
1 Group Fundamentals TeamViewer is a global technology company headquartered in Germany. The Company’s product portfolio comprises software solutions infused with artificial intelligence (AI) that support remote access, IT automation, Digital Employee Experience (DEX), secure connectivity, and the digitalization of industrial processes. The solutions are designed to help organizations manage corporate IT environments, smart devices, and nonstandardized operational technology (OT) equipment, including industrial machinery, robotics systems, medical devices, and other specialized infrastructure. TeamViewer also offers augmented reality (AR) and mixed reality (MR) solutions intended to support manual processes in areas such as logistics, manufacturing, and after-sales operations.
resolution of endpoint issues – thereby implementing significantly more proactive and efficient IT management. Alongside TeamViewer ONE, the Company continues to provide its modular solutions in remote connectivity, DEX, and AR/MR‑based frontline workflows to address diverse customer requirements across industries and use cases.
In recent years, TeamViewer has continuously modernized and expanded its product portfolio. This includes the AI features built around the TeamViewer intelligent agent “Tia” and the expanded Digital Employee Experience (DEX) offering following the acquisition of 1E in 2025. These developments led to the introduction of the consolidated IT management platform TeamViewer ONE, enabling autonomous IT operations for TeamViewer’s customer base.
The Group’s parent company is TeamViewer SE, headquartered in Göppingen, Germany. As of 30 June 2026, the Group had a total of 1,967 employees worldwide (FTEs; 31 December 2025: 1,925). TeamViewer SE has been listed on the Frankfurt Stock Exchange since September 2019 and is a member of the German SDAX index.
As the central driver of TeamViewer’s strategy, the TeamViewer ONE platform enables organizations to adopt a “shift-left” approach – meaning the earliest possible detection and
1
In addition to a large number of private users who can access the free version of the Remote software, TeamViewer’s global customer base includes small and medium-sized businesses (SMBs) and large enterprises1 across all industries. These customers primarily use the product portfolio through a subscription model.
The statements made in the Annual Report 2025 with regard to the business model, Group structure, Group management, markets, sales, research and development, security and data protection, and sustainability and governance still applied at the time this Half-Year Financial Report 2026 was prepared.
“SMB customers” means customers with ARR across all products and services of less than EUR 10,000 at the end of the reporting period. If the threshold is exceeded, the customer will be reallocated. “Enterprise customers” means customers with ARR across all products and services of at least EUR 10,000 at the end of the reporting period. Customers who do not reach this threshold will be reallocated.
TeamViewer SE – Half-Year Report H1 2026
𝍢
7
𝍢
A – Interim Management Report – 1 Group Fundamentals
Product offering
TeamViewer ONE - our platform for Autonomous Endpoint Management TeamViewer Remote
Remote support Remote access, control, and management solutions for IT departments. ó ó ó ó
Remote support Remote monitoring & management Endpoint protection Ticketing
TeamViewer SE – Half-Year Report H1 2026
TeamViewer Tensor Scalable, productive and secure connectivity
Advanced remote support, control, and management of enterprise IT, smart devices, and industrial equipment. ó ó ó ó
Large-scale IT management Best-in-class security Smart devices Industrial equipment
(Agentic) AI
TeamViewer DEX
TeamViewer Frontline
Digital Employee Experience
Frontline productivity
Real-time diagnostics and remediation, advanced monitoring and analytics for holistic insights, AI-driven automation.
Digital workflows, instructions, and assistance for smart industrial operations.
ó ó ó ó
Observability Remediation Automation Validation
ó ó ó ó
Digital workflows AR assistance Image recognition Digital twins
8
A – Interim Management Report – 2 Report on Economic Position
2 Report on Economic Position 2.1 Macroeconomic environment
the duration and intensity of the energy price shock, as well as potential second-round effects.8
The year 2026 has been characterized by geopolitical and economic uncertainties. The global economy continues to face subdued prospects, particularly due to heightened geopolitical risks, ongoing trade policy uncertainty, and the conflict in the Middle East.2
Economic developments in the United States remain more robust than in the euro area in 2026, with growth expected at slightly above 2%.9 For Germany, only moderate growth of around 0.5% is anticipated.10
At the same time, global economic activity remains on an upward trajectory across most regions, albeit at a more moderate pace than in the previous year.3 Higher prices for crude oil and liquefied natural gas resulting from the Iran conflict, together with ongoing constraints on key transport routes, are dampening economic activity.4 Against this backdrop, global output growth of 2.8% is expected for 2026, followed by a marked acceleration to approximately 3.3% in 2027. The current pressures are considered largely temporary, assuming a stabilization of the situation in the Gulf region.5
The EUR/USD exchange rate increased noticeably in the first half of 2026 compared to the prior-year level, averaging around USD 1.17 per euro over the first six months, exceeding the full-year 2025 average of approximately USD 1.13 per euro.11 The development of the exchange rate was influenced by changing monetary policy expectations in both the euro area and the United States. In addition, geopolitical factors and energy price developments shaped the market environment.
Monetary policy continues to diverge across major currency areas. While the US Federal Reserve is currently maintaining its target range for policy rates at 3.50–3.75%, the European Central Bank (ECB) has recently increased its key interest rates by 25 basis points. The deposit facility rate now stands at around 2.25%.6 The ECB continues to follow a datadependent, meeting-by-meeting approach and is taking into account, in particular, the impact of rising energy prices resulting from the Middle East conflict on inflation and economic activity. Therefore, elevated inflationary pressures are expected to persist in the short term.7 The ECB projects an average inflation rate of approximately 3.0% in the euro area in 2026, declining to 2.3% in 2027. However, the outlook remains highly dependent on
Following a strong increase in global IT spending in 2025, reaching a volume of approximately USD 5.6 trillion, the international market research firm Gartner, in its current forecast, anticipates continued strong momentum and an increase to around USD 6.15 trillion in 2026, corresponding to growth of 10.8%.12 This development is primarily driven by structural demand factors: investments in AI infrastructure, data centers and software solutions continue to generate additional growth impulses, while growth dynamics in other segments are moderating.
2
Sector environment
IfW Kiel – Kieler Konjunkturberichte Nr. 133 – World Economy in Summer 2026, p. 2f.: https://www.kielinstitut.de/fileadmin/Dateiverwaltung/IfW-Publications/fis-import/c803572d-aaf5-4658-a326-32b5c3956a11-_KKB_133_2026-Q2_Welt_EN.pdf IfW Kiel – Kieler Konjunkturberichte Nr. 133 – World Economy in Summer 2026, p. 2f.: https://www.kielinstitut.de/fileadmin/Dateiverwaltung/IfW-Publications/fis-import/c803572d-aaf5-4658-a326-32b5c3956a11-_KKB_133_2026-Q2_Welt_EN.pdf 4 IfW Kiel – Kieler Konjunkturberichte Nr. 133 – World Economy in Summer 2026, p. 4f.: https://www.kielinstitut.de/fileadmin/Dateiverwaltung/IfW-Publications/fis-import/c803572d-aaf5-4658-a326-32b5c3956a11-_KKB_133_2026-Q2_Welt_EN.pdf 5 IfW Kiel – Kieler Konjunkturberichte Nr. 133 – World Economy in Summer 2026, p. 9f.: https://www.kielinstitut.de/fileadmin/Dateiverwaltung/IfW-Publications/fis-import/c803572d-aaf5-4658-a326-32b5c3956a11-_KKB_133_2026-Q2_Welt_EN.pdf 6 European Central Bank - Combined monetary policy decisions and statement 11 June 2026: https://www.ecb.europa.eu/press/press_conference/monetary-policy-statement/shared/pdf/ecb.ds260611~5b4603b5aa.en.pdf 7 European Central Bank - Combined monetary policy decisions and statement 11 June 2026: https://www.ecb.europa.eu/press/press_conference/monetary-policy-statement/shared/pdf/ecb.ds260611~5b4603b5aa.en.pdf 8 European Central Bank - Combined monetary policy decisions and statement 11 June 2026: https://www.ecb.europa.eu/press/press_conference/monetary-policy-statement/shared/pdf/ecb.ds260611~5b4603b5aa.en.pdf 9 IfW Kiel – Kieler Konjunkturberichte Nr. 133 – World Economy in Summer 2026, p. 10f.: https://www.kielinstitut.de/fileadmin/Dateiverwaltung/IfW-Publications/fis-import/c803572d-aaf5-4658-a326-32b5c3956a11-_KKB_133_2026-Q2_Welt_EN.pdf 10 IfW Kiel – Kieler Konjunkturberichte Nr. 133 – World Economy in Summer 2026, p. 22: https://www.kielinstitut.de/fileadmin/Dateiverwaltung/IfW-Publications/fis-import/c803572d-aaf5-4658-a326-32b5c3956a11-_KKB_133_2026-Q2_Welt_EN.pdf 11 Currency Converter of the European Central Bank: https://www.ecb.europa.eu/stats/policy_and_exchange_rates/euro_reference_exchange_rates/html/eurofxref-graph-usd.en.html 12 Gartner, Inc. - Gartner Forecasts Worldwide IT Spending to Grow 10.8% in 2026, Totaling $6.15 Trillion: https://www.gartner.com/en/newsroom/press-releases/2026-02-03-gartner-forecasts-worldwide-it-spending-to-grow-10-point-8-percent-in-2026-totaling-6-point-15-trillion-dollars 3
TeamViewer SE – Half-Year Report H1 2026
𝍢
9
𝍢
A – Interim Management Report – 2 Report on Economic Position
Across individual market segments, a differentiated picture emerges: spending on the subsegments most relevant to TeamViewer – software (approx. +14.7%) and IT services (approx. +8.7%) – continues to grow strongly. In the devices segment, growth is more moderate at approximately 6.1%. Overall, the IT market remains clearly growth-oriented. This development is driven primarily by increasing spending on software – particularly in connection with AI applications – as well as sustained strong demand for IT services, while growth in certain end markets is slowing.13
TeamViewer sessions were automatically captured and analyzed, with volumes continuing to grow. TeamViewer showcased these and other innovations during the first six months of the year at major industry events such as Hannover Messe, ServiceNow Knowledge, and the Gartner Digital Workplace Summit, as well as at its own partner and customer events across all regions.
2.2 Business development TeamViewer entered 2026 with strong momentum. TeamViewer ONE continues to gain traction across both SMB and enterprise customers. The Company’s development teams are making significant progress in advancing Autonomous Endpoint Management (AEM) capabilities.
TeamViewer’s global sales organization underwent significant structural transformation during the first half of the year. Chief Revenue Officer Mark Banfield reorganized the entire team, Tim Koubek was appointed President of the Americas, and the roll-out of a new sales operating model was brought close to completion. The sales organization is positioned to capitalize on the opportunities related to TeamViewer ONE, DEX, and the upcoming AEM innovation. In May, TeamViewer also announced Peter Ruchatz as its new Chief Marketing Officer. He will lead the marketing organization starting in September and join the Senior Leadership Team.
TeamViewer ONE with positive momentum
Certification and recognition of TeamViewer DEX
Following a comprehensive update in December 2025, TeamViewer has globally launched its new IT management solution TeamViewer ONE. It enables customers to replace fragmented point solutions with a centralized, AI-powered IT management platform. The enterprise version, released in February 2026, also generated immediate customer wins and deal closings. This demonstrates TeamViewer’s ability to successfully cross-sell new solutions to its existing customer base of more than 600,000 clients. Additional AI capabilities and further platform enhancements are planned for the second half of the year to further accelerate TeamViewer ONE’s growth momentum.
AI adoption and AEM innovation drive growth TeamViewer is currently building a learning system for Autonomous Endpoint Management (AEM) that can autonomously resolve IT issues. During the first half of the year, TeamViewer achieved important milestones toward this innovation, including AI-powered scripting and reporting capabilities. The completed system, which is scheduled for launch in the second half of 2026, can detect anomalies at an early stage and automatically initiate the appropriate remediation measures. It builds on TeamViewer’s leadership in remote connectivity and combines it with comprehensive endpoint telemetry and real-time automation. In addition, TeamViewer can rely on a unique data set: customers have already used AI to automatically analyze more than 2.5 million support sessions, with every session further improving the intelligence of the system. In June 2026 alone, more than 500,000 13
Sales and marketing organizations positioned for the future
At the end of May, TeamViewer DEX reached a major milestone in its FedRAMP certification process, enabling US federal agencies to procure TeamViewer’s DEX platform. In mid-June, TeamViewer DEX was once again recognized as a “Leader” in the Gartner Magic Quadrant for Digital Employee Experience Management Tools by the market research and analysis company Gartner. This places TeamViewer among the highest-rated vendors in the category.
Annual General Meeting elects new Supervisory Board member TeamViewer’s Annual General Meeting, held this year on 2 June 2026, was again held as a virtual event. The shareholders approved all agenda items by a large majority and confirmed Andrea Euenheim as an independent member of the Supervisory Board for a four-year term. Andrea Euenheim had been appointed to the Supervisory Board by the court in March 2026.
Gartner, Inc. - Gartner Forecasts Worldwide IT Spending to Grow 10.8% in 2026, Totaling $6.15 Trillion: https://www.gartner.com/en/newsroom/press-releases/2026-02-03-gartner-forecasts-worldwide-it-spending-to-grow-10-point-8-percent-in-2026-totaling-6-point-15-trillion-dollars
TeamViewer SE – Half-Year Report H1 2026
10
𝍢
A – Interim Management Report – 2 Report on Economic Position
2.3 Earnings position
Revenue by customer group1
The presentation that follows addresses both the most important items of the statement of profit and loss in accordance with IFRS and the management view (non-IFRS).
in EUR million
Revenue The Group generally invoices its software products at the beginning of the contract in an amount payable in advance. This amount is recognized in revenue over the contract duration, which usually spans 12 months. Multi-year contracts are also concluded in some cases.
H1 2026
H1 2025
∆ YoY
Total share in H1 2026
Total share in H1 2025
SMB
250.3
262.3
-5%
68%
72%
Enterprise
115.6
102.0
+13%
32%
28%
Total
365.9
364.4
0%
100%
100%
1
Includes 1E starting February 2025.
Total revenue increased in the first six months of 2026 to EUR 365.9 million (H1 2025: EUR 364.4 million). In the EMEA region, revenue increased by 3%. In the AMERICAS region, revenue decreased by 3% and in the APAC region by 3%.
In addition to revenue, TeamViewer also uses annualized recurring revenue as a secondary performance indicator to control and monitor the Group’s development. The Annual Recurring Revenue (ARR) is annualized recurring revenue for all active subscriptions at the end of the reporting period. Enterprise ARR was up 4% year-over-year, while SMB ARR declined 6% year-over-year.
Revenue by region1
ARR – Annual Recurring Revenue by customer group (non-IFRS) H1 2026
H1 2025
∆ YoY
in EUR million
Total share in H1 2026
Total share in H1 2025
EMEA
201.1
194.6
+3%
55%
53%
AMERICAS
129.6
133.3
-3%
35%
37%
APAC
35.3
36.5
-3%
10%
10%
Total
365.9
364.4
0%
100%
100%
1
Includes 1E starting February 2025.
Revenue developed unevenly across customer groups. While the Enterprise business grew significantly by 13%, revenue in the SMB business declined.
TeamViewer SE – Half-Year Report H1 2026
H1 2026
H1 2025
∆ YoY
Total share in H1 2026
Total share in H1 2025
SMB
501.4
Enterprise
235.5
532.0
-6%
68%
70%
227.1
+4%
32%
30%
Total
736.8
759.1
-3%
100%
100%
in EUR million
11
𝍢
A – Interim Management Report – 2 Report on Economic Position
Cost development
Bad debt expenses decreased due to the higher share of Enterprise customers in trade receivables, which have a lower probability of default.
Total costs and other income/expenses in EUR million
H1 2026
H1 2025
∆ YoY
Cost of Goods Sold (COGS)
(49.3)
(49.2)
0%
R&D costs
(52.1)
(47.9)
+9%
Marketing costs
(42.1)
(59.5)
-29%
Sales expenses
(70.4)
(67.1)
+5%
General and administrative costs
(25.7)
(31.3)
-18%
Bad debt expenses
(3.8)
(5.0)
-24%
Other income
1.8
15.1
-88%
Other expenses
(5.1)
(2.5)
+108%
(246.8)
(247.3)
0%
Total
Net other income and other expenses declined significantly compared to the previous year, mainly driven by the decrease in income from foreign currency derivatives, which had been considerably higher in the previous year, primarily due to the depreciation of the US dollar. Overall, total costs and other income/expenses remained stable year-over-year.
EBITDA Depreciation and amortization of tangible and intangible assets amounted to EUR 26.5 million in the first half of 2026 (H1 2025: EUR 27.3 million), representing a year-over-year decrease of 3%. This decrease was primarily due to lower amortization of intangible assets.
Reconciliation of EBITDA to adjusted EBITDA (non-IFRS) in EUR million
H1 2026
H1 2025
∆ YoY
145.7
144.4
1%
40%
40%
0 pp
Cost of Goods Sold (COGS) consists primarily of amortization of intangible assets, router and server costs, personnel expenses and payment fees. Year-over-year, COGS remained at the previous year's level, amounting to EUR 49.3 million (H1 2025: EUR 49.2 million).
EBITDA
Expenses for share-based compensation
2.6
11.3
-77%
R&D costs increased year-over-year, primarily driven by higher personnel expenses.
Other items to be adjusted
13.7
(0.6)
n/a
Adjusted EBITDA (non-IFRS)
161.9
155.1
4%
44%
43%
+2 pp
Marketing costs were significantly lower than in the previous year. This was primarily due to lower marketing spend, reduced personnel costs and lower sponsorship expenses. Sales expenses were slightly above the previous year’s level, mainly due to higher personnel costs. Compared with the previous year, general and administrative costs saw a significant decrease, mainly driven by lower acquisition-related consulting fees.
TeamViewer SE – Half-Year Report H1 2026
EBITDA margin in % of revenue
Adjusted EBITDA margin in % of revenue
12
𝍢
A – Interim Management Report – 2 Report on Economic Position
Earnings before taxes (EBT)
Other items to be adjusted in EUR million
H1 2026
H1 2025
Measurement of financial instruments
5.9
(11.7)
Reorganization expenses
3.7
0.1
IT projects
0.3
0.8
Financing and M&A
2.7
7.5
Expenses for special legal disputes
0.9
2.2
Other
0.2
0.5
Total
13.7
(0.6)
Adjusted EBITDA (non-IFRS) for the first half of 2026 amounted to EUR 161.9 million (H1 2025: EUR 155.1 million), corresponding to a year-over-year increase of 4%. As revenue remained largely unchanged year-over-year, the adjusted EBITDA margin (adjusted EBITDA (non-IFRS) as a percentage of revenue) in the first half of 2026 increased to 44% (H1 2025: 43%).
Operating profit (EBIT) EBIT increased by 2% year-over-year to EUR 119.1 million in the first half of 2026 (H1 2025: EUR 117.1 million). EBIT grew at a faster rate than revenue, resulting in a higher EBIT margin (EBIT relative to revenue) of 33% compared to the previous year (H1 2025: 32%).
EBT rose by 18% year-over-year to EUR 95.3 million in the first half of 2026 (H1 2025: EUR 80.6 million). The higher percentage increase in EBT compared to EBIT was mainly attributable to lower expenses in the foreign currency result.
Items in the finance result in EUR million
H1 2026
H1 2025
∆ YoY
Finance income
0.2
0.2
-4%
Finance costs
(19.5)
(19.2)
+1%
Share of profit/(loss) of associates
(2.4)
(3.2)
-23%
Foreign currency result
(2.1)
(14.4)
-85%
Group net income Income taxes in the first half of 2026 consisted of a current tax expense of EUR 32.1 million (H1 2025: EUR 24.5 million) and a deferred tax benefit of EUR 1.1 million (H1 2025: tax expense of EUR 3.8 million). Overall, tax expense in the first half of 2026 was slightly above the prior-year figure at EUR 31.0 million (H1 2025: EUR 28.3 million). The tax rate (income taxes relative to EBT) for the first half of 2026 was 32.5%, which is lower than the tax rate for the same period in the prior year (H1 2025: 35.1%). This was mainly due to lower non-deductible expenses in H1 2026. Net income increased by 23% year-over-year to EUR 64.3 million (H1 2025: EUR 52.2 million). Earnings per share increased to EUR 0.41 (H1 2025: EUR 0.33). TeamViewer also uses adjusted net income (non-IFRS) to assess its earnings performance.
TeamViewer SE – Half-Year Report H1 2026
13
𝍢
A – Interim Management Report – 2 Report on Economic Position
Reconciliation of net income to adjusted net income (non-IFRS) in EUR million
and deferred tax assets were largely offset by declines in intangible assets, property, plant and equipment, and investments in associates.
H1 2026
H1 2025
∆ YoY
64.3
52.2
+23%
15.5
13.5
+15%
Expenses for share-based compensation
2.6
11.3
-77%
Other items to be adjusted
13.7
(0.6)
n/a
Extraordinary items in finance result
0.2
17.5
-99%
Income tax items to be adjusted
(8.5)
(10.7)
-20%
30 June 2026
+5%
in EUR million
in %
in EUR million
in %
in EUR million
in %
Equity
249.7
15
164.9
10
+84.8
+51
Net income PPA depreciation
1
2
Adjusted net income (non-IFRS)
87.7
1
Depreciation and amortization related to business acquisitions.
2
Refer to adjusted EBITDA (non-IFRS).
83.2
The Group’s current assets as of 30 June 2026 consisted of trade receivables, other assets, tax assets, financial assets, and cash and cash equivalents. Compared to the end of 2025, current assets declined primarily as a result of a tax refund, reducing tax assets to EUR 2.0 million (31 December 2025: EUR 8.4 million).
Equity and liabilities on the balance sheet 31 December 2025
Change
Non-current liabilities
754.9
45
668.4
40
+86.4
+13
Adjusted earnings per share increased by 5% year-over-year to EUR 0.56 (H1 2025: EUR 0.53).
Current liabilities
666.2
40
842.5
50
-176.3
-21
2.4 Net assets and financial position
Total equity and liabilities
1,670.7
100
1,675.8
100
-5.0
0
The Group’s equity increased mainly due to the increase in retained earnings and foreign currency translation reserve.
Capital structure
The Group’s non-current liabilities increased as of 30 June 2026, mainly driven by the increase in non-current financial liabilities to EUR 640.9 million (31 December 2025: EUR 549.9 million), which is related to the utilization of a revolving credit facility (RCF) and to new private placements issued in the first half of 2026.
Assets on the balance sheet 30 June 2026
31 December 2025
Change
in EUR million
in %
in EUR million
in %
in EUR million
in %
1,554.8
93
1,552.1
93
+2.7
0
Current assets
116.0
7
123.7
7
-7.8
-6
Total assets
1,670.7
100
1,675.8
100
-5.0
0
Non-current assets
As of 30 June 2026, the Group’s non-current assets comprised goodwill, intangible assets, property, plant and equipment, financial assets, investments in associates, other assets, and deferred tax assets. Total non-current assets remained almost unchanged as of 30 June 2026 compared to 31 December 2025. Increases in goodwill, other assets, financial assets
TeamViewer SE – Half-Year Report H1 2026
Current liabilities decreased as of 30 June 2026, mainly due to debt repayments, which reduced current financial liabilities to EUR 231.5 million (31 December 2025: EUR 393.1 million). This was further supported by lower deferred and other liabilities.
14
𝍢
A – Interim Management Report – 2 Report on Economic Position
Financing TeamViewer’s debt financing mix is based on various instruments and maturities. In order to reduce volatility and increase predictability, variable interest rates were partly converted into fixed/semi-fixed interest rate structures using interest rate hedges. All liabilities to credit institutions are denominated in euros. The loans and promissory notes utilized amounted to a nominal EUR 847.0 million as of 30 June 2026 (31 December 2025: EUR 908.0 million). As of 30 June 2026, EUR 300.0 million (31 December 2025: EUR 185.0 million) of the revolving credit facility was utilized. A drawdown of the facility is possible up to a total amount of EUR 525 million at any time.
Liabilities to banks as of 30 June 2026
2029
37.5
37.5
Promissory note 2021 10-year fixed
2031
9.0
9.0
Private placement 2025 3-year variable
2028
15.0
15.0
Private placement 2025 5-year variable
2030
15.0
15.0
Private placement 2026 4-year fixed
2030
12.5
—
Private placement 2026 5-year fixed
2031
Private placements
Total 30 June 2026
31 Dec 2025
Year of maturity
Nominal value
Nominal value
DCM bridge facility
2026
145.0
145.0
Term facility loan
2029
225.0
225.0
Syndicated loan 2022 – revolving credit facility1
2029
300.0
185.0
Revolving credit facility 20241
2031
—
—
2026
—
8.0
in EUR million
Promissory note 2024 5-year variable
Money market loan
The amount outstanding as of the reporting date.
2
Short-term loan with a maturity of less than one month. The interest rate is fixed, no transaction costs have been capitalized in relation to the loan.
As of 30 June 2026, the interest payment dates ranged from one to twelve months. The TeamViewer Group’s net financial liabilities decreased to EUR 832.8 million as of 30 June 2026 (31 December 2025: EUR 901.4 million). The net leverage ratio decreased to 2.5x as of 30 June 2026 (31 December 2025: 2.6x).
Promissory notes
Development of net leverage ratio
Promissory note 2021
in EUR million
5-year fixed
Promissory note 2021 5-year variable
Promissory note 2024 3-year fixed
Promissory note 2024 3-year variable
2026
—
118.0
2026
—
75.0
2027
27.5
27.5
2027
21.0
21.0
7-year fixed
2028
13.0
13.0
Promissory note 2024 5-year fixed
2029
14.0
14.0
Promissory note 2021
TeamViewer SE – Half-Year Report H1 2026
— 908.0
1
Loans
1,2
12.5 847.0
30 June 2026
31 Dec 2025
Current financial liabilities
231.5
393.1
Non-current financial liabilities
640.9
549.9
Cash and cash equivalents
(39.6)
(41.6)
Net financial liabilities
832.8
901.4
336.6
340.3
2.5x
2.6x
Adjusted EBITDA (LTM)
1
Net leverage ratio 1
Pro forma
15
𝍢
A – Interim Management Report – 2 Report on Economic Position
Under the terms of the 2022 syndicated loan, 2024 revolving credit facility and the loan for the 1E acquisition in 2025, TeamViewer is required to comply with certain leverage covenants based on the ratio of net financial liabilities to EBITDA, as defined in the respective credit agreements. TeamViewer complied with these covenants at all times during the first half of 2026.
Financial position in EUR million
H1 2026
H1 2025
Change
Change in %
41.6
55.3
-13.7
-25
Cash flows from operating activities
99.3
110.4
-11.1
-10
Cash flows from investing activities
(6.5)
(686.7)
+680.2
-99
Other changes Cash and cash equivalents at the end of the period
(95.3)
563.6
-658.8
-117
0.5
(2.0)
+2.5
-124
39.6
40.5
-0.9
-2
The decrease in cash flows from operating activities in the first half of 2026 was mainly due to lower billings. In addition to the effects of the measures initiated in 2025 to realign the SMB business, this was driven in particular by a lower volume of multi-year contract signings. In the current economic environment, customers increasingly favored shorter contract terms, resulting in lower billings and corresponding advance payments.
TeamViewer SE – Half-Year Report H1 2026
Cash flows from financing activities were negative in H1 2026, primarily due to debt repayments and significantly lower proceeds from borrowings.
Levered free cash flow
Cash and cash equivalents at the beginning of the period
Cash flows from financing activities
Cash outflows for investing activities decreased significantly in the first half of 2026, as the prior-year period was materially impacted by the acquisition of 1E Group, which was completed in 2025.
in EUR million
H1 2026
H1 2025
Change
Change in %
Cash flows from operating activities1
121.5
130.6
-9.1
-7
Income taxes paid
(22.2)
(20.2)
-2.0
+10
Investments in property, plant and equipment, and intangible assets
(3.3)
(3.8)
+0.5
-13
Payments for the redemption portion of lease liabilities
(10.9)
(6.8)
-4.1
+60
Interest paid on borrowed funds and lease liabilities
(23.4)
(19.6)
-3.7
+19
Adjustment for nonrecurring cash outflows2
2.7
23.8
-21.0
-88
Levered free cash flow (FCFE)
64.6
104.0
-39.5
-38
in % of adjusted EBITDA (cash conversion)
40%
67%
1
Before income taxes paid.
2
Adjusted for 1E acquisition-related payments and a one-off payment in connection with special legal disputes.
-27 pp
16
A – Interim Management Report – 3 Events after the Reporting Date – 4 Opportunities and Risks
3 Events after the Reporting Date After 30 June 2026, the following events occurred that could have a material effect on TeamViewer’s future results of operations, financial position and net assets: In relation to the private placements 2026, TeamViewer secured additional loan facilities totalling EUR 15 million, which are planned to be utilized over the coming months. In July 2026, TeamViewer made a partial repayment of EUR 25 million of the loan under the DCM bridge facility. There were no other events of material significance after the 30 June 2026 reporting date.
4 Opportunities and Risks There have been no significant changes in the risk assessment contained in the opportunity and risk report of the Company’s Annual Report 2025. The Management Board continues to be confident that the identified risks do not currently pose a threat to the continued existence of the Group or any of its material subsidiaries, either individually or in the aggregate.
TeamViewer SE – Half-Year Report H1 2026
𝍢
17
𝍢
A – Interim Management Report – 5 Outlook
5 Outlook The Management Board expects demand for TeamViewer solutions to remain solid. TeamViewer will continue leveraging the strong cross-selling and upselling potential of its broad user base. The Management Board reiterates its outlook for the 2026 fiscal year. TeamViewer expects: ó Revenue growth in constant currency between 0% and 3% yoy (vs. pro forma revenue FY 2025 of EUR 767.5 million); and ó Adjusted EBITDA margin of around 43%.
Göppingen, 24 July 2026
Guidance 2026 Guidance 2026
in EUR million
Fiscal year 2025 pro forma (non-IFRS, unaudited), comparison base
Fiscal year 2025 (revenue: IFRS; adj. EBITDA margin: non-IFRS)
Revenue growth (YoY constant currency vs PY pro forma basis)
0%–3% cc1,2
767.5
746.8
Adjusted EBITDA margin (as reported, incl. currency effects)
~43%
44%
44%
1
Revenue growth in constant currencies vs IFRS revenue FY 2025 of EUR 746.8 million will be higher than the revenue growth in cc vs pro forma revenue FY 2025 of EUR 767.5 million.
2
Constant currency growth including an average exchange rate of 1.13 EUR/USD.
TeamViewer SE – Half-Year Report H1 2026
While the revenue growth guidance for FY 2026 is in constant currency, actual reported revenue is expected to be impacted by currency exchange rate fluctuation. Each quarter, TeamViewer will provide the expected currency impact on revenue growth in the quarterly earnings presentation. Additionally, TeamViewer will provide the additional expected FX impact that comes from historic deferred revenue release to avoid systematic over/ underestimation of currency movements in reported revenue. TeamViewer’s central invoicing model and IFRS treatment fix deferred revenue at the invoice-date FX rate, causing FX effects when historic deferred revenue is released in revenue.
The Management Board Oliver Steil
Michael Wilkens
Mei Dent
Mark Banfield
𝍢
B – Condensed Interim Consolidated Financial Statements
TeamViewer SE – Half-Year Report H1 2026
19
𝍢
B – Condensed Interim Consolidated Financial Statements – 1 Consolidated Statement of Profit and Loss and Other Comprehensive Income
1 Consolidated Statement of Profit and Loss and Other Comprehensive Income from 1 January to 30 June in EUR thousands
2026
2025
2026
2025
Revenue
365,918
364,382
Income taxes
(31,010)
(28,309)
Cost of Goods Sold (COGS)
(49,281)
(49,199)
Net income
64,294
52,245
Gross profit
316,636
315,183
Earnings per share, basic (in EUR)
0.41
0.33
(13)
Research and development
(52,108)
(47,912)
Earnings per share, diluted (in EUR)
0.41
0.33
(13)
Marketing
(42,123)
(59,487)
Other comprehensive income
Sales
(70,382)
(67,071)
General and administrative
(25,749)
(31,265)
Bad debt expenses
(3,798)
(4,989)
Other comprehensive income for the period, reclassified to profit or loss in subsequent periods
18,182
(66,225)
Other income
1,813
15,110
1,420
(1,647)
(7)
Other expenses
(5,145)
(2,479)
16,762
(64,578)
(7)
82,476
(13,980)
Operating profit
119,146
117,090
Finance income
231
242
Finance costs
(19,485)
(19,198)
Share of profit/(loss) of associates
(2,442)
(3,165)
Foreign currency result
(2,147)
(14,415)
Profit before tax
95,304
80,554
TeamViewer SE – Half-Year Report H1 2026
Note
(6)
in EUR thousands
Hedge reserve Exchange differences on the
translation of foreign operations Total comprehensive income
Note
20
𝍢
B – Condensed Interim Consolidated Financial Statements – 2 Consolidated Statement of Financial Position
2 Consolidated Statement of Financial Position as of 30 June Assets in EUR thousands
Equity and liabilities 30 June 2026
31 Dec 2025
Note
Non-current assets Goodwill
In EUR thousands
30 June 2026
31 Dec 2025
Note
163,500
163,500
(7)
Equity 1,128,396
1,115,457
Issued capital
Intangible assets
331,184
343,866
Capital reserve
(10,626)
(3,874)
(7)
Property, plant and equipment
43,656
44,905
Retained earnings
210,435
146,141
(7)
Financial assets
7,506
5,640
1,274
(146)
(7)
Investments in associates
11,511
13,763
Foreign currency translation reserve
(38,298)
(55,060)
(7)
Other assets
30,547
27,524
Treasury shares
(76,583)
(85,682)
(7)
Total equity attributable to the shareholders of TeamViewer SE
249,702
164,879
Deferred tax assets
1,987
905
1,554,787
1,552,061
Trade receivables
21,557
27,531
Other assets
45,084
35,404
Tax assets
2,024
8,424
Financial assets
7,691
10,796
39,603
41,569
115,958
123,724
Total non-current assets
(5), (9)
Non-current liabilities
Current assets
Cash and cash equivalents Total current assets
Hedge reserve
Provisions
(5), (9)
988
737
Financial liabilities
640,925
549,879
Deferred revenue
31,228
37,080
859
904
Deferred and other liabilities Other financial liabilities Deferred tax liabilities Total non-current liabilities
—
209
80,865
79,635
754,865
668,443
(8)
(8)
Current liabilities Provisions
3,042
1,768
231,473
393,087
Trade payables
9,911
11,150
Deferred revenue
344,771
346,931
Deferred and other liabilities
51,944
67,645
Other financial liabilities
11,274
10,869
Tax liabilities
13,763
11,012
Financial liabilities
Total current liabilities Total assets TeamViewer SE – Half-Year Report H1 2026
1,670,745
1,675,784
666,178
842,462
Total liabilities
1,421,043
1,510,905
Total equity and liabilities
1,670,745
1,675,784
(8)
(8)
21
𝍢
B – Condensed Interim Consolidated Financial Statements – 3 Consolidated Statement of Cash Flows
3 Consolidated Statement of Cash Flows from 1 January to 30 June in EUR thousands
2026
2025
Profit before tax
95,304
80,554
Depreciation, amortization and impairment of non-current assets
26,510
27,338
Increase/(decrease) in provisions
1,525
Non-operational foreign exchange (gains)/losses
(191)
Note
in EUR thousands
2026
2025
Note
Repayments of borrowings
(281,000)
(130,000)
(8)
Proceeds from borrowings
220,000
720,000
(8)
(8,593)
Payments for the capital element of lease liabilities
(10,877)
(6,783)
(8)
1,075
Interest paid for borrowings and lease liabilities
(23,386)
(19,638)
Cash flows from financing activities
(95,264)
563,579
(2,455)
(12,754)
489
(1,996)
Expenses for equity-settled sharebased compensation
2,346
9,432
Net financial costs
21,696
22,121
Net change in cash and cash equivalents
Change in deferred revenue
(8,012)
37,480
Net foreign exchange rate difference
Changes in other net working capital and other
(17,630)
(38,779)
Cash and cash equivalents at beginning of period
41,569
55,265
Income taxes paid
(22,208)
(20,231)
Cash flows from operating activities
99,339
110,397
Cash and cash equivalents at end of period
39,603
40,515
Payments for tangible and intangible assets
(3,256)
(3,751)
Payments for financial assets
(2,000)
(480)
Payments for acquisitions
(1,274)
(682,500)
Cash flows from investing activities
(6,530)
(686,730)
TeamViewer SE – Half-Year Report H1 2026
(4)
22
𝍢
B – Condensed Interim Consolidated Financial Statements – 4 Consolidated Statement of Changes in Equity
4 Consolidated Statement of Changes in Equity Issued capital
Capital reserve
Retained earnings
Hedge reserve
Foreign currency translation reserve
Treasury shares
Total equity
State as of 1 January 2026
163,500
(3,874)
146,141
(146)
(55,060)
(85,682)
164,879
Profit/(loss) for the period
—
—
64,294
—
—
—
64,294
Other comprehensive income
—
—
—
1,420
16,762
—
18,182
Share-based compensation
—
2,346
—
—
—
—
2,346
in EUR thousands
Reissuance of treasury shares under share-based payments
—
(9,098)
—
—
—
9,098
—
163,500
(10,626)
210,435
1,274
(38,298)
(76,583)
249,702
Issued capital
Capital reserve
Retained earnings/
Hedge reserve
Foreign currency
Treasury shares
Total equity
State as of 1 January 2025
170,000
70,327
27,893
5,822
4,653
(178,211)
100,485
Profit/(loss) for the period
—
—
52,245
—
—
—
52,245
Other comprehensive income
—
—
—
(1,647)
(64,578)
—
(66,225)
Share-based compensation
—
9,432
—
—
—
—
9,432
Reissuance of treasury shares under share-based payments
—
(10,574)
—
—
—
10,574
—
State as of 30 June 2026
(accumulated losses)
in EUR thousands
translation reserve
Reclassification from cash flow
hedge reserve directly to carrying amount of asset/liability State as of 30 June 2025
TeamViewer SE – Half-Year Report H1 2026
—
—
—
(6,095)
—
—
(6,095)
170,000
69,185
80,138
(1,920)
(59,925)
(167,636)
89,842
Note
(4)
Note
(4)
23
B – Condensed Interim Consolidated Financial Statements – 5 Notes to the Condensed Interim Consolidated Financial Statements
5 Notes to the Condensed Interim Consolidated Financial Statements 1.
Company information
TeamViewer SE is a listed stock corporation headquartered in Göppingen, Germany. The Company is registered at the District Court of Ulm under the commercial register number HRB 745906. TeamViewer SE, Göppingen, is the parent company of the TeamViewer Group (“TeamViewer” or the “Group”). TeamViewer SE’s registered office is in Göppingen, Germany. The registered office is located at Bahnhofsplatz 2, 73033 Göppingen, Germany. The Group’s fiscal year is the calendar year. In the following, “Company” refers to TeamViewer SE. TeamViewer is a global technology company headquartered in Germany. The Company’s product portfolio comprises software solutions infused with artificial intelligence (AI) that support remote access, IT automation, Digital Employee Experience (DEX), secure connectivity, and the digitalization of industrial processes. The solutions are designed to help organizations manage corporate IT environments, smart devices, and nonstandardized operational technology (OT) equipment, including industrial machinery, robotics systems, medical devices, and other specialized infrastructure. TeamViewer also offers augmented reality (AR) and mixed reality (MR) solutions intended to support manual processes in areas such as logistics, manufacturing, and after-sales operations. In recent years, TeamViewer has continuously modernized and expanded its product portfolio. This includes the AI features built around the TeamViewer intelligent agent “Tia” and the expanded Digital Employee Experience (DEX) offering following the acquisition of 1E in 2025. These developments led to the introduction of the consolidated IT management platform TeamViewer ONE, enabling autonomous IT operations for TeamViewer’s customer base.
TeamViewer SE – Half-Year Report H1 2026
As the central driver of TeamViewer’s strategy, the TeamViewer ONE platform enables organizations to adopt a “shift-left” approach – meaning the earliest possible detection and resolution of endpoint issues – thereby implementing significantly more proactive and efficient IT management. Alongside TeamViewer ONE, the Company continues to provide its modular solutions in remote connectivity, DEX, and AR/MR‑based frontline workflows to address diverse customer requirements across industries and use cases. In addition to a large number of private users who can access the free version of the Remote software, TeamViewer’s global customer base includes small and medium-sized businesses (SMBs) and large enterprises across all industries. These customers primarily use the product portfolio through a subscription model.
Basis of preparation
The condensed notes to the condensed interim consolidated financial statements do not contain all the information or disclosures required for consolidated financial statements as of the end of the fiscal year and should therefore be read in conjunction with the consolidated financial statements as of 31 December 2025.
(a)
Statement of compliance
These unaudited condensed interim consolidated financial statements comply with the International Financial Reporting Standards (IFRS) issued by the International Accounting Standards Board (IASB) applicable as of the reporting date and as adopted by the European Union (EU) pursuant to EU Regulation No. 1606/2002 of the European Parliament and of the Council on the application of international accounting standards. These condensed interim consolidated financial statements were prepared in accordance with IAS 34 “Interim Financial Reporting” in conjunction with IAS 1 “Presentation of Financial Statements” and were reviewed by PricewaterhouseCoopers GmbH Wirtschaftsprüfungsgesellschaft, Stuttgart (please refer to the chapter “Review Report”).
𝍢
24
B – Condensed Interim Consolidated Financial Statements – 5 Notes to the Condensed Interim Consolidated Financial Statements
(b)
Presentation currency
The condensed interim consolidated financial statements are presented in euros (EUR), which is the Company’s presentation currency. Unless otherwise stated, all amounts are rounded to the nearest thousand euros (EUR thousand), with the effect that rounding differences may occur when individual amounts are added together. The same also applies to the addition of percentages.
Significant accounting policies
The same accounting policies and recognition and measurement methods were applied in the preparation of these financial statements as those prepared as of 31 December 2025. As of 30 June 2026, the income tax expense is determined using the effective tax rate expected for the full year.
(a)
Revenue
Revenue is generated mainly from the provision of connectivity services on the basis of software licenses. In addition, TeamViewer offers services for the implementation of more complex solutions, for example in the enterprise, IoT (Internet of Things), or augmented reality (AR) environments. In 2025, TeamViewer started offering personalized Digital Employee Experience (DEX) solutions. Hardware sales are made in the AR area in order to offer customers a holistic solution. The Group uses direct sales to end customers, indirect sales via sales partners, and sales via original equipment manufacturers (OEMs). Contracts with customers often include various products and services. For connectivity solutions that are based on temporary software licenses (subscription model), the most appropriate method of revenue recognition is on a pro rata temporis, straight-line basis over the term of the contract since the Group has to provide services over the full term of the contract. The subscription period is usually one year, but other periods (i.e., multi-year deals) are also agreed with customers on a case-by-case basis.
TeamViewer SE – Half-Year Report H1 2026
Connectivity solutions based on software product licenses are generally billed at a fixed amount set at the inception of the contract. The line item “deferred revenue” in the statement of financial position therefore includes the amount of revenue still unrealized as the related services have not yet been provided to the customer (contract liability to the customer as defined by IFRS 15). Deferred revenue is usually recognized as revenue on a straight-line basis over the performance period. The Group generally grants customers a payment term of 14 days. Payment terms can also be agreed on individually for larger customers. Revenue from contracts with customers is recognized when it can be assumed that the corresponding contracts will actually be performed. Above all, it must be reasonable to assume that the customer intends to pay the consideration owed. This assessment involves a degree of judgment. Criteria such as the customer’s historical behavior in terms of contract compliance, as well as the intensity of the customer relationship, are used to make this assessment. To arrive at its assessment, the Group uses historical data obtained from contract portfolios but also takes into account expected future developments that differ from past experience. The assessment can sometimes lead to recognizing revenue only after a payment is made for certain contract portfolios. In rare cases, the promised consideration in a contract includes a variable amount. In such a case, TeamViewer uses the expected value approach to estimate the amount of the consideration. To provide additional information on its revenue, TeamViewer also uses billings and Annual Recurring Revenue as a financial performance indicator. Billings represent the value (net) of goods and services invoiced to customers within a specific period and which constitute a contract as defined by IFRS 15. Annual Recurring Revenue (ARR) is annualized recurring revenue for all active subscriptions at the end of the reporting period.
𝍢
25
B – Condensed Interim Consolidated Financial Statements – 5 Notes to the Condensed Interim Consolidated Financial Statements
In distinguishing between the different customer groups, TeamViewer uses the following categories: SMB customers means customers with ARR across all products and services of less than EUR 10,000 at the end of the reporting period. If the threshold is exceeded, the customer will be reallocated. Enterprise customers means customers with ARR across all products and services of at least EUR 10,000 at the end of the reporting period. Customers who do not reach this threshold will be reallocated.
(b)
Foreign currencies
The following relevant exchange rates were applied as of the reporting date: Closing rates
Average rate for year
30 June 2026
31 Dec 2025
Currency
ISO Code
1 Jan to 30 June 2026
1 Jan to 30 June 2025
Armenian dram
AMD
419.71
447.77
436.58
427.99
Australian dollar
AUD
1.65
1.76
1.66
1.72
Canadian dollar
CAD
1.62
1.61
1.61
1.54
Chinese yuan
CNY
7.73
8.23
8.01
7.93
Pound sterling
GBP
0.86
0.87
0.87
0.84
Indian rupee
INR
107.86
105.60
108.51
94.09
Japanese yen
JPY
185.08
184.09
184.43
162.11
Mexican peso
MXN
19.90
21.12
20.39
21.82
Singapore dollar
SGD
1.48
1.51
1.49
1.45
US dollar
USD
1.14
1.18
1.17
1.09
TeamViewer SE – Half-Year Report H1 2026
(c)
Standards, interpretations and amendments to existing published standards issued and applied
TeamViewer has applied all IFRS standards and interpretations published and adopted by the EU as of 30 June 2026. The additions and improvements to standards applied for the first time in the fiscal year did not have material effects on the presentation of the net assets, financial position and results of operations.
(d)
Standards, interpretations and amendments to published standards that have not yet been applied
A number of new standards and amendments to standards and interpretations are effective for fiscal years beginning on or after 1 January 2027. TeamViewer is currently assessing their impact on the consolidated financial statements. Apart from IFRS 18 (Presentation and Disclosure in the Annual Financial Statements), TeamViewer does not expect any material effects on the presentation of the net assets, financial position and results of operations. IFRS 18 is effective for reporting periods beginning on or after 1 January 2027 and will apply retrospectively. TeamViewer is currently assessing all the impacts that this new standard will have on its reporting. The application of the standard will impact the level of detail presented in the statement of profit and loss and other comprehensive income as well as the aggregation of expense items presented. Additional disclosures will be made on Management-Defined Performance Measures.
𝍢
26
𝍢
B – Condensed Interim Consolidated Financial Statements – 5 Notes to the Condensed Interim Consolidated Financial Statements
Personnel expenses
RSU
Personnel expenses consist of the following items:
Personnel expenses in EUR thousands
H1 2026
H1 2025
Wages and salaries
97,884
94,349
Social security contributions
20,310
17,667
2,346
9,432
—
1,998
2,346
7,435
236
1,886
thereof LTIP
188
1,208
thereof PSU
48
493
thereof 1E
—
185
228
189
121,004
123,525
Equity-settled share-based compensation thereof EPP Program thereof RSU Cash-settled share-based compensation
1
Expenses for M&A Total personnel expenses 1
Including RSU social security contributions.
Restricted Stock Unit Plan (RSU) and Phantom Stock Unit Plan (PSU) In 2022, TeamViewer introduced a Restricted Stock Unit Plan (RSU 2022) and a Phantom Stock Unit Plan (PSU 2022) for the performance-based remuneration of employees. In 2023, TeamViewer also introduced a new Restricted Stock Unit Plan (RSU 2023) and a Phantom Stock Unit Plan (PSU 2023). In 2024, the Company implemented a framework to automatically grant eligible employees participation in the respective plans each year. In addition, selected former 1E employees were granted additional compensation under the RSU/PSU plans on a one-time basis in 2025. The plan for the year 2024 is referred to in the following as RSU 2024 or PSU 2024. The plan for the year 2025 is referred to in the following as RSU 2025 or PSU 2025. The purpose of these programs is to attract, retain, and motivate employees by enabling them to participate in the Company’s success. Employees participate in either the RSU or the PSU.
TeamViewer SE – Half-Year Report H1 2026
Plan description The RSU grants the employees the right to receive TeamViewer shares. Beyond this, TeamViewer granted employees additional shares that are subject to a performance condition (2025: achievement of ARR targets – until 2024: billings targets – in the year of granting). Furthermore, one-time RSU programs provide for additional awards of up to 652,999 shares in the 2026 fiscal year (2025: 466,791 shares) to selected employees. These entitlements are granted to the employees in the respective fiscal year and vest in equal tranches after one, two, or four years, each on 31 December (2025: four equal parts every 31 December). After each vesting period, the shares are transferred to the employees. The employees are not entitled to dividends or voting rights before the shares are vested. The employee’s entitlement expires upon termination of the employment relationship. The onetime additional program granted to former 1E employees, which in 2026 comprised 45,000 shares (2025: 213,158 shares), also included a requirement to hold the shares for the entire vesting period. Valuation and accounting The fair value of one share of the RSU is based on the Company’s share price. RSUs granted, whose vesting is dependent on vesting conditions that are not market conditions, are only recognized if it can be assumed at the reporting date, that the vesting conditions will be met. An adjustment for the lack of dividend entitlement was not made, as no dividend payments are expected. The RSU is accounted for as an equity-settled share-based payment transaction. To the extent that TeamViewer incurs expenses for social security contributions upon granting shares, these contributions are accounted for as cash-settled share-based payments.
Share prices for the calculation of the fair value Share price
EUR
RSU 2026
RSU 2025
RSU 2024
RSU 2023
4.90
9.40
13.33
15.37
27
𝍢
B – Condensed Interim Consolidated Financial Statements – 5 Notes to the Condensed Interim Consolidated Financial Statements
PSU
PSU valuation as of 30 June 2025
Plan description The PSU has the same terms and conditions as the RSU but is settled in cash instead of shares. Former 1E employees were granted 1,645 virtual shares in 2025 as part of the additional one-time commitment. The cash settlement is calculated based on the average price of the TeamViewer share over the last 60 trading days before vesting. Valuation and accounting The fair value of a virtual share of the PSU as of the measurement date was determined solely on the basis of the Company’s share price. An adjustment for the missing dividend entitlement of the virtual shares was not made, as no dividend payment is expected. The PSU is accounted for as a cash-settled share-based payment.
PSU 2026
PSU 2025
PSU 2024
PSU 2023
4.91
4.91
4.91
4.91
Share price
EUR
Total carrying amount of liabilities1
in EUR thousands
43
53
123
62
thereof vested
in EUR thousands
—
—
—
—
1
Including RSU social security contributions.
PSU 2023
PSU 2022
EUR
9.56
9.56
9.56
9.56
Total carrying amount of liabilities1
in EUR thousands
336
368
266
35
thereof vested
in EUR thousands
—
—
—
—
1
Including social security contributions RSU.
Development of the number of RSU shares/virtual PSU shares in units
RSU
PSU
2,748,363
92,794
868,049
27,701
Granted
1,904,104
59,725
Forfeited
1,803,229
76,037
31 December 2025 pending
1,981,189
48,781
Exercised (vested 31 December 2025)
828,432
20,873
Granted
652,999
—
Forfeited
110,716
4,251
1,695,040
23,657
thereof vesting 31 December 2026
811,973
15,902
thereof vesting 31 December 2027
504,740
7,618
thereof vesting 31 December 2028
234,735
137
thereof vesting 31 December 2029
143,592
—
Exercised (vested 31 December 2024)
30 June 2026 pending
TeamViewer SE – Half-Year Report H1 2026
PSU 2024
Share price
31 December 2024 pending
PSU valuation as of 30 June 2026
PSU 2025
28
𝍢
B – Condensed Interim Consolidated Financial Statements – 5 Notes to the Condensed Interim Consolidated Financial Statements
Financial assets
As of 30 June 2026 and 31 December 2025, there were only current trade receivables.
Financial assets 2026 30 June 2026 in EUR thousands Derivatives Investment in associates Lease deposits and other assets Total financial assets
Current
Non-current
Total
6,698
1,958
8,656
—
11,511
11,511
993
5,548
6,541
7,691
19,017
26,708
Financial assets 2025 31 December 2025 in EUR thousands Derivatives Investment in associates Lease deposits and other assets Total financial assets
Current
Non-current
Total
9,477
233
9,710
—
13,763
13,763
1,319
5,407
6,726
10,796
19,403
30,199
In June 2026, the Group acquired a call option that provides the right, but not the obligation, to acquire equity instruments of a third party at a predetermined exercise price of EUR 60 million within a defined exercise period from 1 January 2027 to 12 April 2027. The option is classified as a derivative financial asset and is measured at fair value through profit or loss. The fair value is determined using an option pricing model incorporating both observable inputs and significant unobservable inputs (expected volatility, the equity value of the underlying entity and valuation multiple). The instrument is classified within Level 3 of the fair value hierarchy. The carrying amount of the derivative as of the reporting date is EUR 2,000 thousand.
TeamViewer SE – Half-Year Report H1 2026
Trade receivables
Age structure of trade receivables in EUR thousands
30 June 2026
31 Dec 2025
Past due <31 days
16,958
28,286
31–60 days past due
5,273
2,218
61–90 days past due
1,817
1,497
91–120 days past due
1,372
1,301
121–150 days past due
1,283
1,118
More than 150 days past due
7,879
8,187
Total before valuation allowance
34,582
42,608
Valuation allowance
(13,025)
(15,077)
Trade receivables
21,557
27,531
29
𝍢
B – Condensed Interim Consolidated Financial Statements – 5 Notes to the Condensed Interim Consolidated Financial Statements
Expected credit losses on trade receivables 30 June 2026 in EUR thousands Past due
31 December 2025 Expected default rate in %
in EUR thousands
Expected default rate in %
Equity
Equity as of 30 June 2026 in EUR thousands
30 June 2026
31 Dec 2025
Up to 30 days
(1,720)
12
(3,155)
13
Issued capital
163,500
163,500
31–60 days
(1,445)
29
(1,152)
54
Capital reserve
(10,626)
(3,874)
61–90 days
(1,115)
65
(1,121)
78
Retained earnings
210,435
146,141
91–120 days
(993)
76
(1,107)
88
Hedge reserve
1,274
(146)
121–150 days
(980)
81
(974)
90
Foreign currency translation reserve
(38,298)
(55,060)
(6,772)
90
(7,567)
96
Treasury shares
(76,583)
(85,682)
Total equity
249,702
164,879
Issued capital
Treasury shares
170,000
(13,902)
—
868
(6,500)
6,500
163,500
(6,534)
—
828
163,500
(5,705)
More than 150 days Total valuation allowance
(13,025)
(15,077)
Development of valuation allowance on trade receivables in EUR thousands Valuation allowance at the beginning of fiscal year
Number of shares
30 June 2026
31 Dec 2025
(15,077)
(15,493)
31 December 2024 Reissuance of treasury shares under share-based payments
Release/(additions)
(3,798)
(11,540)
Utilization
5,850
11,956
(13,025)
(15,077)
Total valuation allowance at the end of the reporting period
On average, invoices in the first half of 2026 were paid 41 days after invoicing (fiscal year 2025: 45 days).
in thousands
Cancellation of treasury shares 31 December 2025 Reissuance of treasury shares under share-based payments 30 June 2026
Capital reserve – The reduction in capital reserves in the fiscal year resulted mainly from the reissuance of treasury shares under the share-based payment incentives. This was partially offset by share-based compensation (see Note 4 Personnel expenses).
TeamViewer SE – Half-Year Report H1 2026
30
𝍢
B – Condensed Interim Consolidated Financial Statements – 5 Notes to the Condensed Interim Consolidated Financial Statements
Hedge reserve – The reserve for cash flow hedges includes the effects of an interest rate cap, interest rate swap and interest rate collar agreements and a portfolio of FX forwards. The following table shows the movement of the hedge reserve during the year: in EUR thousands
30 June 2026
31 Dec 2025
Hedge reserve at the beginning of fiscal year
(146)
5,822
Total movement during the period in OCI
1,420
127
1,117
57
thereof reclassified to profit and loss (hedged item has affected profit or loss)2
303
70
Reclassification from hedge reserve directly to carrying amount of asset/liability
—
(6,095)
1,274
(146)
thereof change in fair value1
Hedge reserve at the end of the reporting period 1
Including fair value change of FX derivatives of EUR 0 thousand (2025: EUR 141 thousand) and interest rate derivatives of EUR 1,117 thousand (2025: EUR -84 thousand).
2
Relates to interest rate derivatives only.
Foreign currency translation reserve – The foreign currency translation reserve results from the translation of foreign operations into euros. Treasury shares – In the first quarter of 2025, 868,049 shares were transferred to employees under the RSU program, and 828,432 shares were transferred in the first quarter of 2026. As of 30 June 2026, the Company held 5,705,406 treasury shares (31 December 2025: 6,533,838 treasury shares). The item “Treasury shares” as of 30 June 2026 contains the acquisition costs for 5,705,406 treasury shares (31 December 2025: 6,533,838 treasury shares).
TeamViewer SE – Half-Year Report H1 2026
Financial liabilities
Financial liabilities 2026 30 June 2026 in EUR thousands
Current
Non-current
Total
Financial liabilities
231,473
640,925
872,398
thereof from loans
219,872
624,636
844,509
thereof from lease liabilities
11,601
16,288
27,889
11,274
—
11,274
242,747
640,925
883,671
Other financial liabilities Total
Financial liabilities 2025 31 December 2025 in EUR thousands
Current
Non-current
Total
Financial liabilities
393,087
549,879
942,966
thereof from loans
377,573
532,336
909,909
thereof from lease liabilities
15,514
17,542
33,057
10,869
209
11,077
403,956
550,087
954,043
Other financial liabilities Total
31
𝍢
B – Condensed Interim Consolidated Financial Statements – 5 Notes to the Condensed Interim Consolidated Financial Statements
(a)
Maturity and repayment structure
Liabilities to banks as of 31 December 2025 31 December 2025
Liabilities to banks as of 30 June 2026 Currency
Year of maturity
Nominal value
Carrying amount
DCM bridge facility
EUR
2026
145,000
144,937
Term facility loan
EUR
2029
225,000
223,918
Syndicated loan 2022 – revolving credit facility
EUR
2029
185,000
185,356
Revolving credit facility 2024
EUR
2027
—
(194)
Money market loan1
EUR
2026
8,000
8,000
Promissory note 2021 5-year fixed
in EUR thousands
30 June 2026 in EUR thousands
Currency Year of maturity
Nominal value
Carrying amount
Loans DCM bridge facility1
EUR
2026
145,000
144,997
Term facility loan
EUR
2029
225,000
222,730
Syndicated loan 2022 – revolving credit facility
EUR
2029
300,000
299,003
Revolving credit facility 2024
EUR
2031
—
(102)
Promissory notes
Loans
Promissory notes
Promissory note 2024 3-year fixed
EUR
2027
27,500
27,615
EUR
2026
118,000
118,431
Promissory note 2024 3-year variable
Promissory note 2021 5-year variable
EUR
2027
21,000
21,073
EUR
2026
75,000
75,785
Promissory note 2021 7-year fixed
Promissory note 2024 3-year fixed
EUR
2028
13,000
13,045
EUR
2027
27,500
28,222
Promissory note 2024 5-year fixed
Promissory note 2024 3-year variable
EUR
2029
14,000
14,033
EUR
2027
21,000
21,040
Promissory note 2024 5-year variable
Promissory note 2021
EUR
2029
37,500
37,575
EUR
2028
13,000
13,043
Promissory note 2021 10-year fixed
Promissory note 2024
EUR
2031
9,000
9,031
EUR
2029
14,000
14,352
Promissory note 2024
EUR
2029
37,500
37,533
EUR
2031
9,000
9,030
15,000
15,221
Private placements Private placement 2025 3-year variable
7-year fixed
5-year fixed
5-year variable
Promissory note 2021 10-year fixed
EUR
2028
15,000
15,230
5-year variable
EUR
2030
15,000
15,241
Private placement 2026 4-year fixed
Private placement 2025 3-year variable
EUR
2030
12,500
12,519
EUR
2028
Private placement 2025 5-year variable
EUR
2031
12,500
12,520
EUR
2030
Total
847,000
844,509
Private placement 2025
Private placement 2026 5-year fixed Total 1
The maturity has been extended to December 2026. An extension fee of EUR 0.2 million was capitalized and is amortized over the extended term using an effective interest method.
TeamViewer SE – Half-Year Report H1 2026
Private placements
1
15,000
15,236
908,000
909,909
Short-term loan with a maturity of less than one month. The interest rate is fixed, no transaction costs have been capitalized in relation to the loan.
32
B – Condensed Interim Consolidated Financial Statements – 5 Notes to the Condensed Interim Consolidated Financial Statements
The interest payment dates currently range from one to twelve months. The carrying amounts of the respective loans include directly attributable transaction costs that are amortized over the term of the respective loans using the effective interest method. Except for the 7-year and 10-year fixed promissory notes from the year 2021, the 3-year fixed promissory note from the year 2024 and the 4-year and 5-year fixed private placements from the year 2026, the Group has the unconditional right to prepay the loans in part or in full at any time. The revolving credit lines were drawn down in the amount of EUR 300.0 million as of 30 June 2026 (31 December 2025: EUR 185.0 million).
(b)
Private placements 2026
In June 2026, TeamViewer entered into an agreement to issue two private placements in the aggregate amount of EUR 25 million (EUR 12.5 million each) with maturities of 4 and 5 years. The private placements have fixed interest rates. Interest is payable semi-annually. No transaction costs were incurred in relation to the private placements. TeamViewer fully utilized the private placements in June 2026.
TeamViewer SE – Half-Year Report H1 2026
Financial instruments – fair values and risk management
(a)
Classification and fair values
All financial assets and financial liabilities for which a fair value is determined or recognized are categorized as follows: ó Level 1: Quoted prices in active markets for identical assets or liabilities. ó Level 2: Inputs other than quoted prices included within Level 1 that are observable for the asset or liability, either directly or indirectly. ó Level 3: Inputs for the asset or liability that are not based on observable market data. The following table shows the carrying amounts and fair values of financial assets and liabilities with their respective level in the fair value hierarchy.
𝍢
33
𝍢
B – Condensed Interim Consolidated Financial Statements – 5 Notes to the Condensed Interim Consolidated Financial Statements
Carrying amount and fair value level of financial assets and liabilities as of 30 June 2026
Carrying amount and fair value level of financial assets and liabilities as of 31 December 2025
in EUR thousands
in EUR thousands
Classification
Carrying amount At fair value through profit or loss
Fair value level1
At amortized cost
Fair value
Level Classification
Carrying amount At fair value through profit or loss
Fair value level1
At amortized cost
Fair value
Level
Derivatives2
6,656
2
Derivatives2
9,710
2
Derivatives
2,000
3
Other financial assets
1,964
2
Other financial assets
1,773
2
Trade receivables
27,531
Trade receivables
21,557
Cash and cash equivalents
41,569
Cash and cash equivalents
39,603
Other financial assets
4,762
Other financial assets
4,767
Total financial assets
Total financial assets Derivatives Other financial liabilities: Contingent purchase price payments
10,429
65,927
1,262
2
10,000
3
Trade payables
9,911
Lease liabilities
27,889
Liabilities to banks
844,509
Other financial liabilities Total financial liabilities
Derivatives
3
851,058
882,321
1
If no fair value level was noted, the carrying amounts as of the reporting date are almost equal to their fair value.
2
Including EUR 1,810 thousand measured at fair value through OCI due to the application of hedge accounting.
2
73,862
279
2
10,739
3
Trade payables
11,150
Lease liabilities
33,057
Liabilities to banks
12 11,262
Other financial liabilities: Contingent purchase price payments
11,674
909,909
Other financial liabilities Total financial liabilities
919,399
59 11,018
954,175
1
If no fair value level was noted, the carrying amounts as at the reporting date are almost equal to their fair value.
2
Including EUR 196 thousand measured at fair value through OCI due to the application of hedge accounting.
3
Including EUR 237 thousand measured at fair value through OCI due to the application of hedge accounting.
Other financial assets consist mainly of rent deposits for rented office space.
TeamViewer SE – Half-Year Report H1 2026
2
34
𝍢
B – Condensed Interim Consolidated Financial Statements – 5 Notes to the Condensed Interim Consolidated Financial Statements
(b)
Fair value measurement
The fair value of derivatives as of the valuation date is calculated using a pricing model in which the most relevant factors are interest yield curves and, in the case of foreign currency derivatives, the appropriate forward rates. The fair values of financial liabilities allocated to Level 2 are measured using a discounted cash flow model where relevant input factors are the future contractual cash flows and currently applicable interest yield curves and TeamViewer’s current credit spreads. Trade receivables, loan receivables, and cash and cash equivalents generally have shortterm maturities. Trade payables, due liabilities, and other financial liabilities also generally have short-term maturities. For this reason, their carrying amount at the reporting date is almost equal to their fair value.
Valuation of call option to acquire equity instruments of a third party as of 30 June 2026
Call option to acquire equity instruments of a third party
1
Measurement method
Significant unobservable input factors
Relevant value
Sensitivity analysis +/– 10% (in EUR million)1
Black‑Scholes option pricing model
Expected volatility (in %)
50.8
+0.5/-0.5
Equity value (in EUR million)
31.2
+1.0/-0.8
Valuation multiple (in x)
9.1
+1.3/-0.9
Change in call option value with +/– 10% change in each input factor, with other variables held constant.
The fair value of the option to acquire equity instruments of a third party (Level 3) was measured using a Black‑Scholes option pricing model based on significant unobservable inputs. The significant unobservable inputs are expected volatility, the equity value of the underlying entity and the valuation multiple.
Valuation of contingent purchase price payments as of 30 June 2026
The fair value of the outstanding contingent consideration for business combinations (Level 3) was measured using a discounted cash flow model based on significant unobservable inputs. The significant unobservable input is the contractually defined earnout relevant ARR.
Contingent purchase price payment for Exoprise acquisition
As of 30 June 2026, the significant unobservable inputs related to a fair value measurement classified within Level 3 of the measurement hierarchy, together with a quantitative sensitivity analysis, were as follows:
1
Significant unobservable input factors
DCF method
Contractually defined ARR
Earn-out relevant ARR (in EUR million)
Sensitivity analysis +/– 10% (in EUR million)1
61.2
+/-0.0
Change in contingent purchase price liability with +/– 10% change in contractually defined earn-out relevant ARR.
Valuation of contingent purchase price payments as of 31 December 2025
Contingent purchase price payment for Exoprise acquisition 1
TeamViewer SE – Half-Year Report H1 2026
Measurement method
Measurement method
Significant unobservable input factors
DCF method
Contractually defined ARR
Earn-out relevant ARR (in EUR million)
Sensitivity analysis +/– 10% (in EUR million)1
54.5
+/-0.0
Change in contingent purchase price liability with +/– 10% change in contractually defined earn-out relevant ARR.
35
B – Condensed Interim Consolidated Financial Statements – 5 Notes to the Condensed Interim Consolidated Financial Statements
The main input factors are in line with expectations as of the reporting date.
(c)
The estimates of the fair values of the liabilities for the outstanding contingent purchase price payments are also based on the contractually defined input factors that determine future payments and the Group’s expectations regarding these values (Level 3). The Group assesses the probability based on the achievement of the defined targets and their timing. The assumptions made are reviewed at regular intervals.
Foreign currency cash flows are hedged partly with FX forwards/swaps/options. In 2026, the Group entered into additional FX forwards/swaps to further manage expected foreign currency exposures. As of 30 June 2026, the overall portfolio for 2026 amounts to a notional value of EUR 125 million, including instruments in USD (83%), CHF (8%), CAD (3%), JPY (3%), GBP (2%), and CZK (1%). For 2027, the overall portfolio amounts to a notional value of EUR 58 million intended to hedge USD (65%), CHF (31%), JPY (2%) and CAD (2%) cash flows until 31 December 2027. These derivatives are not designated as hedges.
The changes in the fair values of financial instruments classified in Level 3 in fiscal year 2026 are presented below: Outstanding contingent purchase price payments for acquisitions
Call option to acquire equity instruments
10,739
—
317
2,000
—
—
226
—
Payouts
(1,282)
—
30 June 2026
10,000
2,000
in EUR thousands 1 January 2026 Additions (Other income)/other expenses Interest expense
There were no reclassifications between fair value levels in 2026 and 2025.
Derivatives
In August 2024, three interest rate swap agreements were concluded to hedge the interest rate risk of new floating rate promissory notes issued in May 2024 (notional value of promissory notes: EUR 58.5 million; notional value of interest rate swaps: EUR 38.5 million). All contracts swap 6-month EURIBOR for a fixed rate of 2.5% until May 2027, which is inversely proportional to the floating rate promissory notes with the same benchmark rate. These derivatives are designated as hedges. In 2025, additional interest rate swap and collar agreements were entered into to manage exposure to interest rate fluctuations on 1E acquisition debt with a total notional amount of EUR 450 million (term facility: EUR 250 million; a DCM bridge facility: EUR 100 million; and the revolving credit facility 2022: EUR 100 million). The Group elected to hedge the expected future cash flows of these facilities until 10 December 2029, 4 April 2026, and 4 April 2028, respectively. Swap contracts convert 1-month EURIBOR into fixed rates ranging from 2.00% to 2.21%. Collar agreements set an interest rate band with a floor from 1.25% to 1.49% and a cap from 3.00% to 3.01%. As of 30 June 2026, a total notional amount of EUR 325 million is outstanding (term facility: EUR 225 million and the revolving credit facility 2022: EUR 100 million). These derivatives are designated as hedges. In June 2026, the Group acquired a call option that provides the right, but not the obligation, to acquire equity instruments of a third party (see Note 5 Financial assets). This derivative is not designated as a hedge. There is no significant ineffectiveness for any of the designated derivatives.
TeamViewer SE – Half-Year Report H1 2026
𝍢
36
𝍢
B – Condensed Interim Consolidated Financial Statements – 5 Notes to the Condensed Interim Consolidated Financial Statements
- Operating segments
Intangible assets in EUR thousands
The Group is managed as a single-segment company with the TeamViewer platform as the basis for segmentation. The decision for segmentation was based on the internal organization, which is based on the platform as the single reporting line. The platform’s reporting is based on the different geographical regions as reporting units, namely “Europe, Middle East and Africa” (EMEA), “North, Central and South America” (AMERICAS), and “Asia Pacific” (APAC). As there is no other segment, the consolidated statement of profit and loss and other comprehensive income already shows the segment revenue and expenses, while the consolidated statement of financial position already shows the segment assets and segment liabilities. For this reason, there is no further segmentation. All revenue reported in the consolidated statement of profit and loss and other comprehensive income was generated with external customers.
30 June 2026
31 Dec 2025
130,488
133,712
United States (US)
50,176
52,352
United Kingdom
146,473
153,304
Other countries
4,047
4,499
331,184
343,866
Germany
Total
The remaining non-current assets relate mainly to Germany. Management analyzes revenue at regional and customer group levels. The Group’s performance is measured by management based on adjusted EBITDA.
Revenue by region
Non-current assets relate mainly to:
Non-current assets by country Goodwill in EUR thousands
30 June 2026
31 Dec 2025
Germany
636,451
636,451
United States (US)
387,563
375,821
United Kingdom
83,467
82,432
Other countries
20,915
20,753
1,128,396
1,115,457
Total
1 Jan to 30 June 2026
1 Jan to 30 June 2025
EMEA
201,077
194,582
AMERICAS
129,554
133,323
APAC
35,286
36,477
365,918
364,382
in EUR thousands
Revenue
Revenue by country 1 Jan to
1 Jan to
in EUR thousands
30 June 2026
30 June 2025
United States (US)
103,066
105,776
Germany
63,598
60,749
United Kingdom
20,058
20,385
France
19,645
19,377
Other countries
159,551
158,095
Revenue
365,918
364,382
Revenue is allocated to individual countries based on the location of the respective customer. TeamViewer SE – Half-Year Report H1 2026
37
𝍢
B – Condensed Interim Consolidated Financial Statements – 5 Notes to the Condensed Interim Consolidated Financial Statements
Revenue by customer group
Other items for adjustment 1 Jan to 30 June 2026
1 Jan to 30 June 2025
SMB customers
250,270
262,335
Enterprise customers
115,647
102,047
Revenue
365,918
364,382
in EUR thousands
The Group has a very diversified customer base, with no single customer accounting for more than 10% of revenue. Adjusted EBITDA is calculated as follows:
1 Jan to 30 June 2026
1 Jan to 30 June 2025
2,582
11,318
thereof expenses for equity-settled share-based compensation
2,346
9,617
thereof expenses/(income) for cash-settled sharebased compensation to own employees
236
1,701
Further items for adjustment
13,673
(600)
Reorganization expenses
3,671
117
Measurement of financial instruments
5,888
(11,713)
261
847
2,742
7,459
929
2,210
in EUR thousands Expenses for share-based compensation
Expenses from special IT projects
Calculation of adjusted EBITDA in EUR thousands Operating profit (EBIT) Depreciation and amortization EBITDA Other items for adjustment Adjusted EBITDA
TeamViewer SE – Half-Year Report H1 2026
1 Jan to 30 June 2026
1 Jan to 30 June 2025
119,146
117,090
26,510
27,338
145,656
144,428
16,255
10,718
161,911
155,146
Financing & M&A Expenses for special legal disputes Other Total
182
480
16,255
10,718
38
𝍢
B – Condensed Interim Consolidated Financial Statements – 5 Notes to the Condensed Interim Consolidated Financial Statements
-
Related party disclosures
-
Earnings per share
At the Annual General Meeting on 2 June 2026, the shareholders confirmed the election of Ms. Andrea Euenheim as an independent member of the Supervisory Board for a four-year term by a large majority. She had been appointed to the Supervisory Board by the court in March 2026.
For the purpose of calculating basic earnings per share, net income/loss attributable to the parent company’s ordinary shares is divided by the weighted average number of ordinary shares outstanding during the reporting period.
- Events after the reporting date
Earnings per share (basic)
After 30 June 2026, the following events occurred that could have a material effect on TeamViewer’s future results of operations, financial position and net assets: In relation to the private placements 2026, TeamViewer secured additional loan facilities totalling EUR 15 million, which are planned to be utilized over the coming months. In July 2026, TeamViewer made a partial repayment of EUR 25 million of the loan under the DCM bridge facility. There were no other events of material significance after the 30 June 2026 reporting date.
1 Jan to 30 June 2026
1 Jan to 30 June 2025
Net income for the period
64,293,780
52,244,840
Shares issued as of 30 June
163,500,000
170,000,000
(5,705,406)
(13,033,838)
157,794,594
156,966,162
0.41
0.33
in EUR
Weighted effect of treasury shares Weighted average number of shares outstanding Earnings per share (Net income/number of shares)
For the purpose of calculating diluted earnings per share, net income/loss attributable to ordinary equity holders of TeamViewer SE is divided by the weighted average number of ordinary shares outstanding, plus the weighted average number of ordinary shares that would result from the conversion of all potentially dilutive ordinary shares into ordinary shares.
Earnings per share (diluted) 1 Jan to
30 June 2025
Net income for the period
64,293,780
52,244,840
Weighted average number of shares outstanding
157,794,594
156,966,162
512,596
1,090,939
158,307,190
158,057,101
0.41
0.33
Dilutive effect of RSU share-based compensation Weighted average number of shares outstanding adjusted for dilutive effect Earnings per share (Net income/number of shares)
TeamViewer SE – Half-Year Report H1 2026
1 Jan to
30 June 2026
in EUR
39
B – Condensed Interim Consolidated Financial Statements – 5 Notes to the Condensed Interim Consolidated Financial Statements
For the calculation of diluted earnings per share, the weighted average number of shares outstanding is increased by the number of potentially dilutive shares from the RSU sharebased compensation. The number of potentially dilutive shares is determined as the difference between the following two figures: a) the weighted average number of ordinary shares issued but not yet vested under the RSU share-based compensation plan, and b) the number of ordinary shares that would have been issued at their average market price during the period. To determine the latter figure, it is assumed that an amount equal to the future expense still to be incurred from the share-based compensation transaction is used to repurchase the issued ordinary shares at their average market price during the period (so-called treasury stock method). Göppingen, 24 July 2026 The Management Board Oliver Steil
TeamViewer SE – Half-Year Report H1 2026
Michael Wilkens
Mei Dent
Mark Banfield
𝍢
40
B – Condensed Interim Consolidated Financial Statements – 6 Responsibility Statement
6 Responsibility Statement To the best of our knowledge, and in accordance with the applicable reporting principles, the condensed interim consolidated financial statements give a true and fair view of the earnings, assets, and financial position of the Group, and the interim group management report includes a fair review of the development and performance of the business and the position of the Group, together with a description of the material opportunities and risks associated with the expected development of the Group for the remainder of the fiscal year. Göppingen, 24 July 2026 The Management Board Oliver Steil
TeamViewer SE – Half-Year Report H1 2026
Michael Wilkens
Mei Dent
Mark Banfield
𝍢
41
𝍢
B – Condensed Interim Consolidated Financial Statements – 7 Review Report
7 Review Report To TeamViewer SE, Göppingen We have reviewed the condensed interim consolidated financial statements – comprising the consolidated statement of profit or loss and other comprehensive income, the consolidated statement of financial position, the consolidated statement of cash flows, the consolidated statement of changes in equity and notes to the condensed interim consolidated financial statements – and the interim group management report of TeamViewer SE, Göppingen, for the period from 1 January 2026 to 30 June 2026 which are part of the half-year financial report pursuant to § 115 WpHG (“Wertpapierhandelsgesetz”: German Securities Trading Act). The preparation of the condensed consolidated interim financial statements in accordance with the IFRS applicable to interim financial reporting as adopted by the EU and of the interim group management report in accordance with the provisions of the German Securities Trading Act applicable to interim group management reports is the responsibility of the parent Company’s Board of Managing Directors. Our responsibility is to issue a review report on the condensed consolidated interim financial statements and on the interim group management report based on our review. We conducted our review of the condensed consolidated interim financial statements and the interim group management report in accordance with German generally accepted standards for the review of financial statements promulgated by the Institut der Wirtschaftsprüfer (Institute of Public Auditors in Germany) (IDW) and supplementary compliance with the International Standard on Review Engagements “Review of Interim Financial Information Performed by the Independent Auditor of the Entity” (ISRE 2410). Those standards require that we plan and perform the review so that we can preclude through critical evaluation, with moderate assurance, that the condensed consolidated interim financial statements have not been prepared, in all material respects, in accordance with the IFRS applicable to interim financial reporting as adopted by the EU and that the interim group management report has not been prepared, in all material respects, in accordance with the provisions of the German Securities Trading Act applicable to interim group management reports. A review is limited primarily to inquiries of company personnel and analytical procedures and therefore does not provide the assurance attainable in a financial statement audit. Since, in accordance with our engagement, we have not performed a financial statement audit, we cannot express an audit opinion.
TeamViewer SE – Half-Year Report H1 2026
Based on our review, no matters have come to our attention that cause us to presume that the condensed consolidated interim financial statements have not been prepared, in all material respects, in accordance with the IFRS applicable to interim financial reporting as adopted by the EU nor that the interim group management report has not been prepared, in all material respects, in accordance with the provisions of the German Securities Trading Act applicable to interim group management reports. Stuttgart, 24 July 2026 PricewaterhouseCoopers GmbH Wirtschaftsprüfungsgesellschaft Jürgen Schwehr Wirtschaftsprüfer (German Public Auditor)
ppa. Benjamin Mutschler Wirtschaftsprüfer (German Public Auditor)
𝍢
C – Further Information
TeamViewer SE – Half-Year Report H1 2026
43
𝍢
C – Further Information – 1 Financial Calendar – 2 Imprint
1 Financial Calendar 3 November 2026 Q3 2026 Results
2 Imprint Investor Relations [email protected] Public Relations [email protected] Publisher TeamViewer SE Bahnhofsplatz 2
Design HGB Hamburger Geschäftsberichte GmbH & Co. KG
73033 Göppingen Germany
TeamViewer SE – Half-Year Report H1 2026
44
𝍢
C – Further Information – 3 Disclaimer
3 Disclaimer Certain statements in this report may constitute forward-looking statements. These statements are based on assumptions that are believed to be reasonable at the time they are made, and are subject to significant risks and uncertainties, including, but not limited to, those risks and uncertainties described in TeamViewer’s disclosures. You should not rely on these forward-looking statements as predictions of future events. TeamViewer’s actual results may differ materially and adversely from any forward-looking statements discussed in this report due to several factors, including without limitation, risks from macroeconomic developments, external fraud, lack of innovation capabilities, inadequate data security and changes in competition levels. TeamViewer undertakes no obligation, and does not expect to publicly update, or publicly revise, any forward-looking statement, whether as a result of new information, future events or otherwise.
TeamViewer SE – Half-Year Report H1 2026
Percentage change data and totals presented in tables throughout this report are generally calculated on unrounded numbers. Therefore, numbers in tables may not add up precisely to the totals indicated and percentage change data may not precisely reflect the change data of the rounded figures for the same reason. This document contains alternative performance measures (APM) that are not defined under IFRS. The APMs (non-IFRS) can be reconciled to the key performance indicators included in the IFRS consolidated financial statements and should not be viewed in isolation, but only as supplementary information for assessing the operating performance. TeamViewer believes that these APMs provide an additional, deeper understanding of the Company’s performance. For a complete overview of the APMs included in this report and the corresponding definitions, please refer to the Annual Report 2025.
TeamViewer SE Bahnhofsplatz 2 73033 Göppingen Germany www.teamviewer.com
2
Important Notice / APMs (continued) TeamViewer has defined each of the following APMs as follows: •
Adjusted EBITDA is defined as operating income (EBIT) according to IFRS, plus depreciation and amortization of tangible and intangible fixed assets (EBITDA), adjusted for certain business transactions (income and expense) defined by the Management Board in agreement with the Supervisory Board. Business transactions to be adjusted relate to sharebased compensation schemes and other material special items of the business that are presented separately to show the underlying operating performance of the business.
•
Adjusted EBITDA margin means Adjusted EBITDA as a percentage of revenue.
•
Billings represent the value (net) of goods and services invoiced to customers within a specific period and which constitute a contract as defined by IFRS 15.
•
Annual Recurring Revenue (ARR) is annualized recurring revenue for all active subscriptions at the end of the reporting period. It is calculated by multiplying the daily subscription revenue at the end of the reporting period by 365 days (or 366 days for leap years). Daily subscription revenue is calculated as the total active contract value divided by the contract duration in days. The end of the reporting period is defined as the last calendar day of the respective period.
•
Retained ARR is defined as the ARR at the end of the reporting period from customers that were already a customer at the end of the prior-year reporting period.
•
Net Retention Rate (NRR) (cc) is defined as Retained ARR (cc) at the end of the reporting period divided by the total ARR at the end of the prior-year reporting period.
•
Number of customers means the total number of paying customers with an active subscription at the reporting date.
•
SMB customers means customers with ARR across all products and services of less than EUR 10,000 at the end of the reporting period. If the threshold is exceeded, the customer will be reallocated.
•
Enterprise customers means customers with ARR across all products and services of at least EUR 10,000 at the end of the reporting period. Customers who do not reach this threshold will be reallocated.
•
Customer churn rate means the percentage of customers not retained during the last twelve-month period. It is calculated as 100% minus the number of customers that were retained (no new customers) during the last twelve months divided by the total number of customers twelve months ago.
•
Average Selling Price (ASP) is calculated by dividing the total ARR by the total number of customers at the reporting date.
•
Net financial liabilities are defined as financial liabilities (without other financial liabilities) less cash and cash equivalents.
•
Net leverage ratio means the ratio of net financial liabilities to Adjusted EBITDA of the last twelve-month period.
•
Levered Free Cash Flow (FCFE) means net cash from operating activities less capital expenditure for property, plant and equipment and intangible assets (excl. M&A), payments for the capital element of lease liabilities and interest paid for borrowings and lease liabilities.
•
Cash Conversion means the percentage share of Levered Free Cash Flows (FCFE) in relation to the Adjusted EBITDA.
•
Adjusted Net Income is the net income adjusted for certain income and expenses. These adjustments are: share-based compensation, amortization related to business combinations, other non-recurring income and expenses and related tax effects.
•
Adjusted basic earnings per share is calculated in line with basic earnings per share, whereby Adjusted Net Income is used as the basis for the calculation instead of the net income.
•
Constant currency (cc) comparisons eliminate the impact of exchange rate fluctuations between different periods.
•
“Pro forma” refers to TeamViewer group numbers including 1E numbers before closing (unaudited management view at the time of acquisition) as well as a reversal of negative M&A effects on revenue (“haircut”) after closing of the transaction. Pro forma numbers are prepared for comparative purposes and should be read in conjunction with financial statements. They are not necessarily indicative of the results that would have been attained if the transaction had taken place on a different date.
Q2 2026 Results
3
Business Overview
Oliver Steil Chief Executive Officer
The Digital Workplace Company
Mark Banfield Chief Revenue Officer
Q2 2026: DEX turnaround and TeamViewer ONE platform momentum; FY guidance reaffirmed DEX turnaround fueling TeamViewer ONE rapid scaling and Enterprise growth: highest-value ENT ARR bucket up +11% cc yoy
Leading operational indicators moved in the right direction, previously disclosed effects are leveling off
1
Revenue €182.7m (-1.4% cc yoy1); ARR €736.8m (-0.1% cc yoy); growth acceleration expected in H2 2026
2
Profitability remained strong Adjusted EBITDA €78.9m; margin of 43.2%
4 1
Strategic position validated by landmark ServiceNow partnership, leading industry analysts and FedRAMP milestone; reinforcing long-term growth opportunities
3
Full-year guidance reaffirmed: Revenue growth 0% to 3% cc yoy, Adjusted EBITDA margin ~43%
5
6
YoY revenue growth rate is compared to Q2 2025 comparable pro forma Revenue of €190.7m. Q2 2026 Results
5
Enterprise ARR momentum strengthened, DEX turnaround fueled TeamViewer ONE adoption ENT ARR change quarter-over-quarter (in m€ adjusted for FX effects)
Enterprise ARR momentum turned positive in Q2, showing the improving customer adoption and expansion trends
Daily Avg. Billings within month (in k€)
70
34
Oct-25
Nov-25
Dec-25
Jan-26
Feb-26
TMV ONE Standard
Q2 2026 Results
Mar-26
Apr-26
May-26
Jun-26
TMV ONE Advanced
6
Enterprise platform strategy gaining traction: highest-value ARR bucket up +11% cc TeamViewer ONE adoption accelerated, driven by strong cross-sell and upsell momentum across DEX and Tensor, with several strategic DEX customers migrating to TeamViewer ONE and generating meaningful ARR uplift.
227.1
81.7
+8% cc
+11% cc
235.5
Enterprise NRR
Enterprise (ARR view) 85.9
(%; cc; pro forma)
(€m; % yoy cc; pro forma)
€ >200,000 ARR
29.9
+3% cc
31.9
+10% cc
83.5
Q2 2025
+7% cc
29.3 33.5
€ >100,000 ARR € >50,000 ARR € 10,000 - 50,000 ARR
86.8
Q2 2026
Q2 2026 Results
7
Early signs of stabilization in SMB churn churn expected to continue moderating in H2 2026 SMB (ARR view)
SMB ARR change quarter-over-quarter
(€m; % yoy cc; pro forma)
(in m€ adjusted for FX effects)
532.0
-4% cc
501.4
SMB trends showed encouraging sequential improvement in Q2 2026, churn expected to continue moderating in H2 2026
€ 1,500 - <10,000 ARR € 500 - <1,500 ARR € <500 ARR
267.3
0% cc
257.1
163.7
-6% cc
147.0
101.1
-8% cc
97.2
Q2 2025
Q2 2026
Q2 2026 Results
8
Landmark strategic partnership with ServiceNow to deliver autonomous IT “By integrating ServiceNow's AI control tower for business reinvention and TeamViewer’s
Platform Integration: TeamViewer’s market-leading DEX and Remote Connectivity solutions integrated with the ServiceNow AI Platform, enabling end-to-end agentic IT workflows Global Go-to-Market: Distinct benefits with joint dedicated investments and assigned Sales & Marketing resources, supported by implementation and channel partners Multi-year Agreement: Plans to explore deeper integrations and innovation with the intent to expand to new use cases and markets
Q2 2026 Results
endpoint capabilities, we're closing the loop from insight at the edge to outcomes at scale. Together, we are unlocking autonomous operations, accelerating productivity, and delivering a new era of agentic business.“ Bill McDermott Chairman & CEO, ServiceNow
9
We believe the strategic ServiceNow partnership aligns with latest Gartner® research Gartner Innovation Insights: Agentic Remote Support and Digital Workplace Operations Automation
“Gartner defines agentic remote support (ARS) as autonomous IT incident resolution on employee devices, addressing the critical business problems of technology friction and high support costs by transforming traditional remote support tasks into an AI driven, self-learning system. ARS tools combine endpoint telemetry data, real-time screen observations, and analytics with AI agents to accurately diagnose IT issues on endpoints, virtual desktops, or within digital workplace infrastructures.”1 “By 2029, 70% of enterprises will deploy agentic AI as a part of IT infrastructure operations, compared to less than 5% in 2025.”2
TeamViewer view on latest Gartner research
• TeamViewer believes its product and partnership strategy addresses the customer needs in the areas discussed in the Gartner research on Agentic Remote Support (ARS) and Digital Workplace Operations Automation (DWOA). • In our view, TeamViewer is well-positioned to support customers pursuing end-to-end autonomous IT with our Agentic Remote Support (ARS), Digital Employee Experience (DEX), and Endpoint Management capabilities alongside ServiceNow‘s IT Service Management and agentic AI orchestration platform.
1 Gartner®, Innovation Insight: Agentic Remote Support, Stuart Downes, Tom Cipolla, Robin Milton-Schonemann, 15 July 2026 2 Gartner®, Innovation Insight for Digital Workplace Operations Automation Platforms, Tom Cipolla, Stuart Downes, 23 April 2026 GARTNER is a trademark of Gartner, Inc. and its affiliates. The Gartner content described herein (the “Gartner Content”) represents research opinion or viewpoints published, as part of a syndicated subscription service, by Gartner, Inc. ("Gartner"), and is not a representation of fact. Gartner Content speaks as of its original publication date (and not as of the date of this Quarterly Report), and the opinions expressed in the Gartner Content are subject to change without notice.
Q2 2026 Results
10
Recognition by industry analysts and peer reviews in our view reinforces market leadership TeamViewer DEX
TeamViewer Remote / Tensor
TeamViewer Frontline
Gartner® Magic Quadrant™ Digital Employee Experience Management Tools Recognized as a Leader for three consecutive years
G2 Business Software Reviews Recognized as G2 Grid Leader across 4 dedicated categories and ranked no. 1 in >60 G2 reports
Frost Radar™ AR-Centric Augmented Connected Worker Platforms Recognized as a Visionary Leader and ranked no. 1 in Growth and Innovation
IDC MarketScape Worldwide DEX Vendor Assessment Recognized as a Leader
TrustRadius Top Rated Award 5 Top Rated Awards across various categories (incl. RMM, MDM, and UEM)
PAC INNOVATION RADAR™ – Digital Platforms for Connected Workers Recognized as the sole Best-in-Class vendor for three consecutive years
TeamViewer ONE Gartner®, Magic Quadrant™ for Digital Employee Experience Management Tools, Dan Wilson, Stuart Downes, Robin Milton-Schonemann, 8 June 2026 GARTNER and MAGIC QUADRANT are trademarks of Gartner, Inc. and its affiliates. Gartner does not endorse any company, vendor, product or service depicted in its publications, and does not advise technology users to select only those vendors with the highest ratings or other designation. Gartner publications consist of the opinions of Gartner’s business and technology insights organization and should not be construed as statements of fact. Gartner disclaims all warranties, expressed or implied, with respect to this publication, including any warranties of merchantability or fitness for a particular purpose. The Gartner content described herein (the “Gartner Content”) represents research opinion or viewpoints published, as part of a syndicated subscription service, by Gartner, Inc. ("Gartner"), and is not a representation of fact. Gartner Content speaks as of its original publication date (and not as of the date of this Quarterly Report), and the opinions expressed in the Gartner Content are subject to change without notice.
Q2 2026 Results
11
TeamViewer DEX platform reaches key FedRAMP® milestone, opening access to the U.S. Federal market Gateway to the U.S. Federal sector
CERTIFICATION PATH FEDRAMP MODERATE
Federal agencies can often only buy FedRAMP certified cloud services, which defines a market with high security and compliance barriers to entry
✓
A very high bar
✓
“In Process” Designation
Listed on the FedRAMP Marketplace Authority to Operate (ATO) Completion targeted in 2026
The FedRAMP path requires long-term and significant investment with highly specific requirements, security assessments, and thorough sponsor review
One ATO, many agencies
Once completed, federal agencies can re-use the certified package, with TeamViewer already in active pipeline development
Sponsored by the U.S. Department of Veterans Affairs
Q2 2026 Results
12
Tangible customer value, reflected in a strong Voice of the Customer Proactive IT management
Enterprise Integration
Efficiency & Cost Reduction
“TeamViewer AI helped us
“AI-powered analytics
“AI-generated summaries
enterprise IT environments,
manual work, accelerate
and reduce administrative
help reduce downtime and
Head of IT, Enterprise Retail customer (1000+ employees)
IT Manager, Software & IT services (50 employees)
pinpoint the root causes of application instability and
integrate seamlessly into
uncover software that was
helping automate workflows
across our environment.”
overhead at scale.”
creating unnecessary risk
Endpoint Service Manager Amica Mutual Insurance Company (5,000+ employees)
Q2 2026 Results
and diagnostics reduce issue resolution, and travel costs.”
13
Flagship customer wins evidence TeamViewer's compelling value proposition across the portfolio DEX
TeamViewer ONE
Frontline
Leading US building products manufacturer
Leading global aviation technology provider Scale: 60,000 endpoints
Scale: 400 endpoints, expanding
Scale: 100+ users, multiple
Key differentiator: Real-time
MSP footprint into public sector
locations in North America
automation and visibility
Differentiator: Standardizing
Key differentiator: Hands-free
Use Case: Managing global
entire MSP stack on a single
workflows integrating with
airport IT operations at scale to
platform to resell
SAP EWM
ensure seamless passenger
Use Case: Secure, automated IT
Use Case: Increasing warehouse
services, operational continuity,
operations across fragmented
productivity and reducing errors
and high‑performing employee
municipal environments
by vision picking
digital experiences.
Q2 2026 Results
14
Upsell engine in full swing: Renewing DEX customers are moving to TeamViewer ONE with strong ARR uplift ARR Uplift (€)*
Replaced
Endpoints
One of the largest US public sector organizations
2.0m
Big Tech IT platform
~ 600k
A leading global financial services group
1.5m
Big Tech IT platform
~150k
One of the world‘s largest non-profit hospital systems
150k
Enterprise RS/RA
~ 100k
125k
Enterprise RS/RA
~ 50k
One of the world‘s largest airlines
- At FX rate of 1.1785 EUR/USD
Q2 2026 Results
15
TeamViewer‘s fast progressing AEM innovation delivery creates accelerating platform pull General Availability
General Availability in summer 2026
Remote support session
Turning visibility to insights
DEX insights
Multi-year, multi-million strategic commitments by renewing DEX customers moving to TeamViewer ONE with significant ARR uplift is a strong proof point for the platform pull and innovation roadmap around TeamViewer‘s unique proposition for Autonomous Endpoint Management (AEM)
Agentic AI augments experts to resolve case
AI-driven automations August2026 Release
Session summaries
Q2 2026 Results
16
August release brings key innovation toward selfhealing IT with Automations created from AI sessions Launch of Automations: proven break-fix resolutions, captured across more than 2.8 million AI sessions, converted into reusable automations with tangible benefits for IT teams: • Reduce manual effort: the same issue no longer needs to be diagnosed and fixed by hand every time. Fix once, fixed forever. • Accelerate resolution: proven fixes apply automatically when a known issue recurs, collapsing mean-time-toresolution (MTTR). • Scale with control: automations roll out across device groups under approval workflows and policy controls.
Q2 2026 Results
17
AI adoption scales fast with more than 500,000 AI sessions in June alone, fueling our strong data moat
49k
Customers that have used TeamViewer AI1
2.8m
Cumulative AI sessions2
Strong and scaling customer traction continues to underscore structural data advantage for unique AEM innovation
- Total number of customers that have used TeamViewer AI as of July 25th 2026
- Number of cumulative AI sessions summarized as of July 25th 2026
Q2 2026 Results
18
AI safety and hazard incidents are accelerating, driving a growing demand for self-healing IT and Autonomous Endpoint Management AI safety and hazard incidences are accelerating 600
◉ Rising AI safety and governance risks are increasing demand for endpoint intelligence, control and automation platforms
Number of incidents
500
◉ Growing demand for Autonomous Endpoint Management is already visible in high-trust sectors
400
such as government, defense and financial services, where AI governance, security and operational resilience are mission-critical
300 200
◉ TeamViewer is seeing growing pipeline momentum and customer demand in these verticals as organizations invest in platforms that can safely manage and control AI-driven operations at scale
100 0 2020 2020-01
2021 2021-01
2022 2022-01
2023 2023-01
Total Incidents & Hazards
2024 2024-01
2025 2025-01
2026 2026-01
6-month moving average
Source: OECD AI incidents and hazard monitor
Q2 2026 Results
19
Internal
The Self-Healing Agent for IT
Self-Healing control layer for the Autonomous Workplace Every Endpoint continuously observed
ACT
OBSERVE
Autonomously remediate before impact
Real-time intelligence across every endpoint
Employees AI Agents Autonomous Workflows
Prevent friction from slowing productivity Friction detected early
SELF-HEALING AGENT OBSERVE | DECIDE | ACT
Issues predicted & prevented Problems resolved autonomously
Robots & Machines Edge Devices Applications & Devices
DECIDE
Availability & experience protected
Predict & understand issues before they create friction
Real-time Intelligence
Continuously detect friction across devices, apps, employees & AI agents
Automation
Orchestrate action at the scale of the autonomous enterprise
Q2 2026 Results
Remediation
Resolve problems autonomously before productivity is impacted
20
Internal
The Unique Right to Win Autonomous IT
Seven advantages powering the shift to Self-Healing Autonomous IT Largest Remote Access Base
Intelligent Remediation Agent
Proprietary Dual Data Streams
Native Embedded AI Platform
Used by ops teams worldwide to diagnose & fix digital friction; 610k+ customers globally
Detect, diagnose & remediate friction in sub-millisecond real time
Remote sessions + intelligent agents continuously feed TeamViewer ONE
Continuous learning to detect, remediate and optimize IT - securely
Vast Upsell Customer Base
Mature Global Go-To-Market
Proven Transformational Results
Millions of break-fix customers ready for the Autonomous IT journey
Proven value-curve upsell engine, amplified by the ServiceNow partnership
Already delivering in the strategic Autonomous IT platform transition
Q2 2026 Results
21
Financial Overview
Michael Wilkens Chief Financial Officer
The Digital Workplace Company
Q2 2026: Improving operational indicators support confidence in H2 2026 growth acceleration Revenue
ARR
Adjusted EBITDA
-1.4% cc yoy1
-0.1% cc yoy
-6% yoy1
€182.7m
€736.8m
Adjusted EBITDA Margin
Basic EPS / Adjusted EPS
-1 pp yoy1
+32% yoy / -5% yoy1
43.2%
1
€0.19 / €0.27
€78.9m
Net Leverage Ratio
2.5x
YoY growth rate is compared to Q2 2025 comparable pro forma actuals
Q2 2026 Results
23
Key P&L and other financial KPIs development Q2 2026: previously disclosed effects are leveling off in € million
Q2 2026
Q2 2025
∆%
Revenue1
182.7
190.7
-4%
Cost of Goods Sold (COGS)1,2
(15.1)
(15.4)
-2%
Gross profit1,2
167.6
175.2
-4%
1,2
% Margin
92%
92%
0 pp
Total Opex
(88.7)
(91.2)
-3%
Adjusted EBITDA1
78.9
84.0
-6%
% Margin
43%
44%
-1 pp
D&A
-13.3
-14.0
-5%
Operating Profit (EBIT)
57.3
63.9
-10%
Net income
30.1
22.6
+33%
Basic number of shares issued and outstanding in m
157.8
157.0
1%
EPS (basic) in €
0.19
0.14
+32%
0.27
0.28
-5%
Levered Free Cash Flow (FCFE)
40.8
59.6
-31%
◉ Levered Free Cash Flow reflects lower topline growth and less upfront paid multi-year deals
Cash conversion (FCFE / Adjusted EBITDA4)
52%
71%
Net debt
832.8
991.7
-16%
2.5x
2.9x
◉ Net leverage ratio: on track for around 2.3x year-end target
1,2
1
Adjusted EPS (basic)1 in € 3
Net leverage ratio
5
◉ Revenue growth - as a lagging indicator - continued to reflect the effects of previously disclosed headwinds ◉ Underlying operational indicators improved throughout the quarter ◉ Ongoing organic investments in Sales and Research & Development; Marketing cost include Q2 commercial activation
2025 comparable actuals are pro forma. YoY growth rate is compared to 2025 pro forma comparable actuals. | 2 Based on recurring costs. | 3 Adjusted for the effects from the 1E acquisition. | 4 FCFE / Pro forma adjusted EBITDA for 2025. | 5 Net debt / Pro forma adjusted EBITDA LTM. 1
Q2 2026 Results
24
Operating cash flow reflects lower topline growth and less upfront paid multi year deals yoy in € million (unless otherwise stated)
Q2 2026
Q2 2025
∆%
6M 2026
6M 2025
∆%
66.3
84.0
-21%
121.5
130.6
-7%
Capital expenditure (excl. M&A)
(2.3)
(2.8)
-18%
(3.3)
(3.8)
-13%
Lease payments
(3.9)
(5.3)
-26%
(10.9)
(6.8)
+60%
Pre-tax Unlevered Free Cash Flow (pre-tax UFCF)
60.2
75.9
-21%
107.4
120.1
-11%
Interest paid for borrowings and lease liabilities
(11.4)
(10.7)
+7%
(23.4)
(19.6)
+19%
48.7
65.3
-25%
84.0
100.5
-16%
(8.7)
(11.8)
-26%
(22.2)
(20.2)
+10%
Levered Free Cash Flow (FCFE)
40.0
53.5
-25%
61.8
80.2
-23%
Cash Conversion (FCFE / Adjusted EBITDA1)
51%
64%
38%
48%
0.8
6.1
-87%
2.7
12.2
-78%
—
—
n/a
—
11.6
n/a
Levered Free Cash Flow (FCFE) adj. for 1E and legal disputes
40.8
59.6
-31%
64.6
104.0
-38%
Cash Conversion (FCFE / Adjusted EBITDA1) after adjustments
52%
71%
40%
63%
Pre-Tax net cash from operating activities (IFRS)
Pre-tax Levered Free Cash Flow (pre-tax FCFE) Income tax paid
Adjustment for 1E acquisition Adjustment for a one-off payment in connection with special legal disputes
1
◉ Q2 2026 Cash flow was impacted by lower topline growth and by less upfront paid multi year deals compared to last year ◉ In addition, normal anticipated cash flow timing effects from taxes, interest and lease payments during the second quarter ◉ Free cash flow is seasonally stronger in H2
FCFE / Pro forma adj. EBITDA for 2025.
Q2 2026 Results
25
Debt maturity profile as of 30 June 2026 (€m)
Financing Flexibility increased in Q2 2026
450
51.5
145
150
48.5
15
25
25
25
2026
2027
2028
13
2029
75 12.5
15
12.5 12.5 9 9
2030
2031
Term Loan (1E)
Bridge to DCM (1E)
Promissory Note 2021
Promissory Note 2024
Private Placement 2025
Private Placement 2026
2024 Syndicated RCF
2022 Syndicated RCF
Q2 2026 Results
Successfully extended debt maturities and new financing capacity: extended €75m RCF to 2031, secured a new €40m bilateral facility and initiated a new Schuldschein placement
26
FY 2026 Guidance reaffirmed
1 2
FY 2025 Actuals (comparison base)
FY 2026 Guidance
Revenue growth (YoY constant currency vs PY pro forma basis)
€767.5m pro forma
0% - 3% cc1,2
Adjusted EBITDA margin (reported, incl. currency effects)
44% pro forma
~ 43%
FY 2026 guidance for revenue growth is at constant currencies2 Actual currency reported figures are expected to be impacted by currency exchange rate fluctuations through the year TeamViewer’s expected currency impact on revenue growth in FY 2026 is shown on slide 31
Revenue growth in constant currencies vs IFRS Revenue FY 2025 of €746.8m will be higher than the revenue growth in cc vs pro forma Revenue FY 2025 of €767.5m. Constant currency growth including an average exchange rate of 1.13 EUR/USD for FY 2025.
Q2 2026 Results
27
Q&A
Appendix
The Digital Workplace Company
FX impact
The Digital Workplace Company
Expected currency impact: USD represents TeamViewer’s largest topline foreign currency exposure Expected FX impact Q3 & FY 2026 in revenue at spot rate on 30 Jun 2026 (compared to 2025 pro forma revenue)
Q2 2026 (actual)
Q3 2026 (expected)
FY2026 (expected)
Total FX Impact1,2
-2.8pp
-2.1pp
-2.4pp
YoY FX Impact
-1.4pp
-1.2pp
-1.4pp
Additional Deferred Revenue FX Impact2
-1.4pp
-0.8pp
-1.0pp
FY 2026 expected FX impact reflects the actual FX impact recorded in H1 2026, the expected FX impact for H2 2026 based on June 30, 2026 spot rates, and deferred FX effects resulting from TeamViewer’s centralized invoicing model 1
2
The expected additional deferred revenue FX impact in Q4 is -0.3pp.
Q2 2026 (actual average)
Q3 2026 (expected)
EUR/USD
1.16
1.14
EUR/CAD
1.61
1.62
EUR/AUD
1.64
1.65
3 main currencies
3
Constant currency growth including an average exchange rate of 1.05 USD per EUR for Q1 2025, 1.13 USD per EUR for Q2 2025 and 1.13 USD per EUR for FY 2025.
Q2 2026 Results
Currency exposure vs guided YoY growth in cc: ◦ TeamViewer guides YoY revenue growth in constant currency3 ◦ Actual currency reported figures are expected to be impacted by currency exchange rate fluctuations through the year as reflected in the table TeamViewer specific situation: ◦ TeamViewer’s central invoicing model and IFRS treatment fix deferred revenue at the invoice‑date FX rate, causing unavoidable FX effects when historic deferred revenue is released in revenue ◦ Therefore, TeamViewer provides the additional expected FX impact that comes from historic deferred revenue release to avoid systematic over/ underestimation of currency movements in reported revenue
31
Key financials & KPIs
The Digital Workplace Company
Overview Topline KPIs Q2 2026
Q1 2026
Q4 2025 Pro forma
Q3 2025 Pro forma
Q2 2025 Pro forma
124.1
126.2
130.9
134.1
132.0
-3%
-1%
1%
3%
3%
501.4
506.7
518.7
526.3
532.0
SMB Revenue in €m Revenue YoY % cc ARR in €m 1
ARR YoY % cc
-4%
-3%
-1%
0%
+1%
ASP (ARR)1 in €
826
822
822
822
817
606,616
616,598
631,373
640,342
651,221
17%
17%
16%
16%
16%
Revenue in €m
58.6
57.0
63.8
57.9
58.7
Revenue YoY % cc
+3%
0%
+3%
+8%
+15%
1
Number of customers
1
SMB Customer churn rate Enterprise
ARR in €m
235
231
241
230
227
ARR1 YoY % cc
+8%
+8%
+11%
+12%
+13%
44
44
46
44
44
94%
93%
96%
98%
98%
1
ASP (ARR)1 in € thousands 1
NRR (cc)
1
NRR (cc) adj. for net upsell from SMB
98%
96%
99%
102%
103%
Number of customers1
5,311
5,259
5,262
5,216
5,143
Total ARR1 in €m
736.8
737.3
759.7
756.8
759.1
Revenue in €m
182.7
183.2
194.6
192.0
190.7
100.4
100.6
103.1
101.5
99.8
AMERICAS
64.7
64.8
73.4
72.1
72.7
APAC
17.6
17.7
18.2
18.3
18.2
Revenue by region in €m EMEA
1
2025 comparable actuals and growth rates are non-pro forma.
Q2 2026 Results
33
Enterprise platform strategy gaining traction: highest-value ARR bucket up +11% yoy driven by DEX turnaround and TeamViewer ONE adoption SMB (ARR view)
Enterprise (ARR view)
(€m; % yoy cc; pro forma)
532.0
€ 1,500 - <10,000 ARR -4% cc
501.4
(€m; % yoy cc; pro forma)
€ 500 - <1,500 ARR
227.1
€ <500 ARR
€ >200,000 ARR +8% cc
235.5
€ >100,000 ARR € >50,000 ARR € 10,000 - 50,000 ARR
267.3
0% cc
257.1 Net upsell from SMB to Enterprise: €10.7m
163.7
-6% cc
81.7
+11% cc
29.9
+3% cc
31.9
+10% cc
Q2 2025
-8% cc
29.3 33.5
147.0 83.5
101.1
85.9
+7% cc
86.8
97.2 Q2 2026
Q2 2025
Q2 2026 Results
Q2 2026
34
Adjusted P&L management view based on recurring cost Q2 2026
Q2 2025 Pro forma
∆%
6M 2026
6M 2025 Pro forma
∆%
Revenue
182.7
190.7
-4%
365.9
380.9
-4 %
Cost of Goods Sold (COGS)
(15.1)
(15.4)
-2%
(30.0)
(31.6)
-5 %
Gross profit
167.6
175.2
-4%
335.9
% Margin
92 %
92 %
0 pp
92 %
92 %
0 pp
Sales
(32.0)
(30.4)
+5%
(65.0)
(61.5)
6%
% of Revenue
-18%
-16%
-18 %
-16 %
Marketing
(22.3)
(30.7)
(40.6)
(56.3)
% of Revenue
-12%
-16%
-11 %
-15 %
R&D
(24.0)
(21.4)
(47.6)
(43.5)
% of Revenue
-13%
-11%
-13 %
-11 %
G&A
(9.7)
(9.3)
(19.1)
(19.4)
% of Revenue
-5%
-5%
-5 %
-5 %
Other
(0.7)
0.6
(1.6)
(2.8)
% of Revenue
0%
0%
0%
-1 %
Total Opex
(88.7)
(91.2)
(174.0)
(183.7)
% of Revenue
-49%
-48%
-48 %
-48 %
(103.8)
(106.7)
-3%
(204.0)
(215.3)
-5 %
Adjusted EBITDA
78.9
84.0
-6%
161.9
165.6
-2 %
% Margin
43%
44%
-1 pp
44 %
43 %
1 pp
in € million (unless otherwise stated)
1
Total Costs
2
-28% +12% +4% -226% -3%
Q2 2026 Results
349.3
-4 %
-28 % 9% -2 % -43 % -5 %
1
Incl. other income/expenses and bad debt expenses of €-1.7m in Q2 2026 and €-1.9m in Q2 2025 / €-3.8m in 6M 2026 and €-5.4m in 6M 2025. 2 Total Costs are the sum of Cost of Goods Sold (COGS) and Total Opex.
35
Q2 2026: Reconciliation management metrics to IFRS Management view Revenue adj. P&L
in € million Revenue
D&A
Other non-IFRS adjustments
182.7
Cost of Goods Sold (COGS)
(15.1)
Accounting view IFRS P&L 182.7
(9.4)
(0.3)
(24.9)
Gross profit contribution
167.6
157.9
% of Revenue
92%
86%
Sales
(32.0)
(1.4)
(2.2)
(35.6)
Marketing
(22.3)
(0.4)
(0.5)
(23.2)
R&D
(24.0)
(1.5)
(1.1)
(26.6)
(9.7)
(0.5)
(2.7)
(12.9)
Other
(0.7)
0.0
(1.6)
(2.3)
Adj. EBITDA
78.9
% of Revenue
43% (7.7)3
(8.4)
57.3
G&A 1
D&A (ordinary only)2
(5.5)
Adj. EBIT / Operating profit (EBIT)
73.4
% of Revenue
40%
2+3
D&A (total)
31% 13.3
EBITDA
70.6
% of Revenue
39%
1
Incl. other income/expenses and bad debt expenses of €1.7m D&A excl. amortization intangible assets from PPA 3 Amortization intangible assets from PPA 2
Q2 2026 Results
36
6M 2026: Reconciliation management metrics to IFRS Management view Revenue adj. P&L
in € million Revenue
D&A
Other non-IFRS adjustments
365.9
Cost of Goods Sold (COGS)
(30.0)
Accounting view IFRS P&L 365.9
(18.9)
(0.4)
(49.3)
Gross profit contribution
335.9
316.6
% of Revenue
92%
87%
Sales
(65.0)
(2.7)
(2.7)
(70.4)
Marketing
(40.6)
(1.1)
(0.5)
(42.1)
R&D
(47.6)
(2.9)
(1.5)
(52.1)
(19.1)
(1.0)
(5.7)
(25.7)
Other
(1.6)
0.0
(5.5)
(7.1)
Adj. EBITDA
161.9
% of Revenue
44% (15.5)3
(16.3)
119.1
G&A 1
D&A (ordinary only)2
(11.0)
Adj. EBIT / Operating profit (EBIT)
150.9
% of Revenue
41%
2+3
D&A (total)
33% 26.5
EBITDA
145.7
% of Revenue
40%
1
Incl. other income/expenses and bad debt expenses of €3.8m D&A excl. amortization intangible assets from PPA 3 Amortization intangible assets from PPA 2
Q2 2026 Results
37
Non-IFRS adjustments in EBITDA Basis of preparation / definition
Q2 2026
Q2 2025
6M 2026
6M 2025
EBITDA
APM
70.6
77.9
145.7
144.4
In Q2 2026, Non-IFRS EBITDA
Total IFRS 2 charges (expenses for sharebased compensation)
APM
+1.7
+4.8
+2.6
+11.3
adjusted by
TeamViewer LTIP
APM
+0.3
-0.5
+0.2
+1.2
- non-recurring items
RSU/PSU1
APM
+1.4
+4.2
+2.4
+7.9
◦
IFRS2, mainly RSU
M&A related share-based compensation
APM
0.0
+0.1
0.0
+0.2
◦
1E acquisition related items
Share-based compensation by TLO
APM
0.0
+1.1
0.0
+2.0
1E acquisition related integration & transaction costs
◦
Other material items including
APM
+0.8
+1.8
+2.7
+7.3
Other material items
APM
+4.0
+0.7
+5.0
+3.8
Financing
APM
0.0
0.0
0.0
0.0
Other
APM
+4.0
+0.7
+5.0
+3.8
Valuation effects
APM
2.0
(6.2)
5.9
(11.7)
Adjusted EBITDA
APM
78.9
79.0
161.9
155.1
Pro forma adjustment
—
+5.0
—
+10.5
—
—
—
0.0
78.9
84.0
161.9
165.6
43%
44%
44%
43%
in € million (unless otherwise stated)
2
one-off personnel related costs ◦
Valuation effects from fair value derivatives of future USD hedges due to changing EUR/ USD development
Add back: 1E deferred revenue haircut 1E January 2025 Adjusted EBITDA
Pro forma adjustment
3
Adjusted EBITDA
Adjusted EBITDA margin (%)3
APM
Q2 2026 Results
1
Refers to the Restricted Stock Unit Plan (RSU) and Phantom Stock Unit Plan (PSU) introduced by TeamViewer in 2022. 2 Pre-IPO management incentive program provided by Tiger LuxOne S.à r.l. 3 2025 comparables contain pro forma adjustments.
38
EBITDA to net income in € million (unless otherwise stated)
Q2 2026
Q2 2025
∆%
6M 2026
6M 2025
∆%
EBITDA
70.6
77.9
-9%
145.7
144.4
+1%
D&A
(13.3)
(14.0)
-5%
(26.5)
(27.3)
-3%
57.3
63.9
-10%
119.1
117.1
+2%
(10.5)
(26.4)
-60%
(21.4)
(33.4)
-36%
Share of profit/loss of associates
(1.6)
(1.0)
+62%
(2.4)
(3.2)
-23%
Profit before tax (EBT)
45.2
36.5
+24%
95.3
80.6
+18%
Income taxes
(15.1)
(13.9)
+8%
(31.0)
(28.3)
+10%
Net income
30.1
22.6
+33%
64.3
52.2
+23%
Basic number of shares issued and outstanding1 in m
157.8
157.0
+1%
157.8
157.0
+1%
EPS (basic) in €
0.19
0.14
+32%
0.41
0.33
+22%
Adjusted EPS (basic)2 in €
0.27
0.28
-5%
0.56
0.57
-3%
Operating Profit (EBIT) Financial / FX result
1 2
Period average, without treasury shares. 2025 comparables contain pro forma adjustments.
Q2 2026 Results
39
Adjusted net income & EPS Basis of preparation / definition
Q2 2026
Q2 2025
6M 2026
6M 2025
Net income
IFRS
30.1
22.6
64.3
52.2
Expenses for share-based compensation
APM
+1.7
+4.8
+2.6
+11.3
PPA depreciation and amortization
APM
+7.7
+7.4
+15.5
+13.5
Other material items
APM
+6.7
-3.7
+13.7
-0.6
Extraordinary effects in finance result
APM
+0.6
+16.0
+0.2
+17.5
Income tax items to be adjusted
APM
-4.3
-6.5
-8.5
-10.7
Adjusted net income
APM
42.5
40.6
87.7
83.2
1E deferred revenue haircut1
Pro forma adjustment
—
+3.8
—
+7.9
1E January 2025 adjusted net income
Pro forma adjustment
—
0.0
—
-1.1
42.5
44.3
87.7
90.0
in € million (unless otherwise stated)
Add back / deduct:
Adjusted net income2 Basic number of shares issued and outstanding Adjusted earnings per share – basic (in €)2
1 2
Period average, without treasury shares. Pro forma is only calculated for Q4/FY 2025.
157,794,594 156,966,162 157,794,594 156,966,162 APM
0.27
0.28
Q2 2026 Results
0.56
0.57
1
1E revenue haircut Q2 2025 post tax at assumed 25% corporate tax rate. 2 2025 comparables contain pro forma adjustments.
40
Financial Calendar
The Digital Workplace Company
3 November 2026 Q3 2026 Results & Analyst Call
EQS - TeamViewer SE TeamViewer SE - Q1 2026 Results Analyst Call 06th May, 2026 | 09:00 CEST Transcript
Speakers: Oliver Steil Michael Wilkens Mark Banfield Bisera Grubesic
1
Bisera Grubesic
Good morning, ladies and gentlemen, and welcome to TeamViewer's Q1 2026 Earnings Call. I am Bisera Grubesic, Head of IR here at TeamViewer, and today I am joined by our CEO, Oliver Steil; CFO, Michael Wilkens; and CRO, Mark Banfield. Oliver and Mark will run you through the quarterly business update, and Michael will present Q1 financials. The presentation will be concluded by a Q&A session. As per usual, kindly note that you can find the important notice and the APM disclosure on slides 2 and 3. And with this, I hand it over to Oliver to kick off our presentation.
Oliver Steil
Thank you, Bisera. Good morning, everyone. Also welcome from my side. Thank you for joining us today. 2026 is the year of delivery, and Q1 was the first proof point. Top line was broadly stable and profitability was strong, as expected. The building blocks for acceleration in the second half are firmly in place, and we are reaffirming our full year 2026 guidance. The two effects that moderated our Q1 results, the one-off 1E customer churn and our SMB course corrections, have been shaping out as flagged in February. Good visibility gives us confidence in the ARR growth acceleration, which is expected for the second half of the year. Strategically, we are focused on where the highest ROI and future upsides are, while we continue to benefit from strong cash generation in the core SMB business. We are leaning into higher end SMB and enterprise, where we see clear demand and willingness to pay for premium capabilities, including AI. Looking at the underlying business, enterprise ARR grew, despite absorbing the anticipated one-off churn in 1E. If you strip that out, then enterprise ARR would have been up by 11%. The core is performing well. Mark and Michael will take you through the details shortly. TeamViewer ONE is gaining real commercial momentum. Its ARR doubled quarter-over-quarter. The enterprise tier was launched in February and it closed its first deals almost immediately. The value proposition is clearly resonating at the top end of the market. We are building market-leading autonomous endpoint management innovations, which will expand our total addressable market meaningfully. What connects these proof points is the single direction of travel. Customers are moving towards autonomous IT operations, and 2
TeamViewer is the platform they choose to get there. Let me now take you through the details, starting with how we see ARR across our base. I want to take a moment to explain how we are presenting this chart, because we have refined the view from what you have seen before. We have kept the customer groupings that you are familiar with, SMB and Enterprise. And we have broken them down in a way that we think is more useful to understand the underlying dynamics of the business. We wanted to be clear about exactly where we are facing challenges and where we are not. And here you can see that the message is encouraging. Approximately two-thirds of our ARR base is healthy and growing. Let me walk you through the four customer groups. Enterprise, excluding DEX, grew 18% in constant currency year-over-year, representing 24% of total ARR, continuing the strong double-digit momentum that we saw throughout 2025. Higher end SMB accounts, which are between EUR1,500 to EUR10,000, contributed 35% of ARR and grew 1%. This is a large base of customers with real upsell potential. The two areas that face challenges are exactly the ones which we flagged before. DEX ARR was down 16%, driven by the one-off customer churn of 1E, which is confined to Q1. If you strip that out, then enterprise ARR overall would have been growing 11%, not 8%. Within lower end SMB, which are accounts below EUR1,500 ARR, ARR was down 6%. This reflects the impact of our last year's deliberate course corrections to revitalize the business. Both headwinds, the one-off churn in 1E and the SMB course corrections are known, anticipated, and fully reflected in our 2026 guidance. The core of the business is performing well. This is where we've made significant investments, and we have not yet even seen the full commercial impact flow through yet. TeamViewer ONE, autonomous endpoint management, or the TeamViewer Intelligent Agents, these products are still in their early innings commercially. This is a very strong foundation to build on, and we expect the momentum to increase. Notably, net upsell from SMB to Enterprise was EUR10.5 million in the quarter. This demonstrates again that our strategy to migrate the most valuable SMB customers into richer product packages continues to drive growth. And the 3
primary engine of this growth is, and will be, TeamViewer ONE. Let me walk you through TeamViewer ONE, as this is where we are investing significantly, and which is driving the commercial story of 2026 and beyond. What you see on the left of this slide is the product architecture. There are three tiers; standard, advanced, and enterprise, and they span from SMB through to large enterprises. The products are all built on the same core stack of Tensor, DEX, and AI. While the tiers assemble our core offerings for each customer group, across the board we are delivering what our customers are increasingly looking for; a simpler, unified platform that reduces complexity, enables predictive problem solving, and supports the move towards autonomous IT operations. The right side of this slide tells you what is happening commercially, and the trajectory is clear. In October, daily average billings were only EUR4,000. By March, they reached EUR45,000 already. What excites us most is the pace of that rapid increase. Let me point out three key milestones in this chart. First, the December release of the major standard and advanced update gave the first real commercial push, and you can see that billings stepped up meaningfully from that point. Second, in January, dipped as expected with normal seasonality. Third, and excitingly, February and March show clear execution ramp after our sales kick-off. The sales force came out of Munich energized, with a playbook that works and a product that addresses a key need of our customers. That ramp is real and it continues to build. The enterprise tier launched earlier this year, and as you can see in this chart, only two months in, it is already contributing meaningfully to that March number. The fact that we are closing deals this quickly, when sales cycles typically run much longer, is a strong early signal that the value proposition is resonating at the top end of the market. All-in-all, this early commercial momentum confirms customer demand and marks the beginning of our transition to an endpoint-based pricing model from seatbased pricing. To understand where this goes from here, it is worth looking at what we've achieved before. This chart here demonstrates our ability to repeatedly up and cross-sell our products. I want to spend a moment on it, because I
4
think it's one of the most important frames for how to think about TeamViewer ONE's commercial potential. What you are looking at is illustrative annual recurring billings per upsell motions since 2018. Each layer represents a distinct growth wave. We identified an opportunity, built the product and go to market, and executed the upsell at scale. The first wave was perpetual to SaaS. We migrated a large global customer base to recurring SaaS licenses across our products. This was a fundamental commercial transformation. The second wave was driven by corporate channel upgrades. As customers scaled their usage, we grew with them. This sounds straightforward, but it required the right product market fit with continuous innovation and a disciplined sales motion to capture the potential at scale. The third wave is corporate to Tensor and is still very much alive today. A functionality-led migration of corporate customers to our advanced Tensor licenses, purpose-built for enterprise IT environments. This meant higher value and higher stickiness. Tensor went from initial traction to a core share of enterprise ARR within six quarters, driven by a strong value proposition and focused commercial execution. TeamViewer ONE is the fourth wave, and I believe it is the largest and most exciting opportunity we have had. We are at the very beginning of this wave, but early proof points confirm that the journey has started. We know how to do this, as we'll expand on later. What makes this wave different from the prior ones is the AI accelerator. TeamViewer ONE is self-reinforcing in a way superior to any of the prior three product improvements. Every AI session makes the platform smarter, and every automation makes it stickier. The more customers use it, the harder it becomes to replace. This is a genuine differentiator. The shift to endpoint-based pricing means the revenue opportunity scales with the device footprint, not just with the number of users. This is structurally larger and significantly more durable growth engine. When we talk about expanding our growth runway, this is what we mean. We are not relying on market expansion alone. We have a proven internal engine, one we have run multiple times before. We are now running it again, with a highly differentiated product, a larger addressable market,
5
and a data advantage that compounds with every interaction. Let me now explain the mechanics behind that compounding effect. What we call our flywheel for autonomous endpoint management. What you see on this slide is the core of what makes TeamViewer ONE structurally different from anything a competitor can bring to market. The infinity loop shape is deliberate, because it is a self-reinforcing cycle that gets smarter with every single interaction. And it is powered by two proprietary data streams that no competitor owns together. Expert remote support session knowledge and deep endpoint telemetry from DEX. Both data streams are fully integrated into our unified back end, feeding into the core engine. On the right hand side, the loop starts with the remote support session. Our TeamViewer intelligent agents, called Tia, join the session and help the IT expert diagnose and fix the issue, often in seconds rather than minutes, and in an increasingly agentic way. Once the session ends, AI automatically creates a summary, capturing what happened, the root cause, and the resolution. That summary then flows into the left hand side of the loop. Each session becomes a data point. Patterns emerge across thousands of sessions, which our DEX intelligence translates into proactive recommendations for IT teams. The next step is automated and autonomous remediation. Instead of fixing the same issue manually every time, the system creates an automation that resolves it across the entire endpoint estate. And as it says in the middle, fix an issue once and it is fixed forever. The more the platform is used, the smarter it gets, because every session sharpens Tia's intelligence, which enables continuously more automations across the support operations. The result is a self-reinforcing flywheel. More AI sessions mean better detection, faster resolution, and smarter automation, which reduces friction for end users and drives greater adoption and stickiness. This translates directly into measurable productivity gains for our customers. What makes this genuinely hard to replicate is the data. We are the only company in this space that owns both datasets natively. The session data from remote support, and the telemetry data from the endpoint in the moment the issue occurs.
6
We own both at scale, across more than 620,000 customers globally, tens of millions of managed devices, and billions of connections. Our flywheel is not even fully in motion yet. In April, Tia was integrated directly into Tensor. And already, early customer feedback is outstanding, as you see on the right side. The full flywheel capabilities are being unlocked this summer, which will be a major milestone for TeamViewer. This is what drives our confidence in our growth story. TeamViewer ONE is the commercial vehicle. The AEM flywheel is the platform pull. And our data advantage compounds with every session, widening the moat and deepening customer stickiness in a way that directly fuels our path to sustainable growth. Let me zoom into one element of that flywheel, the rapid growth of AI adoption across our products and customers. By the end of April, more than 26,000 customers have already used TeamViewer AI, and cumulatively we have generated more than 1.3 million AI sessions, with over 300,000 added in March alone. These are paying customers, making a deliberate choice to use our integrated AI. That level of active adoption is a strong signal that the customers see real value. This growing customer traction underscores the structural data advantage that powers our autonomous endpoint management innovation. There has been considerable debate in the market about how AI will shape the future of the SaaS industry. For TeamViewer, we have a clear-eyed view on why we see AI as a structural tailwind, organized around three dimensions. The market, our moat, and our business model. Let's start with the market. AI does not shrink our opportunity. In fact, all indications point the other way. As IT shifts from reactive to autonomous management, the number of endpoints that need to be actively managed actually grows. AI moves to the edge. Internet of things penetration accelerates, and every new connected device is a potential TeamViewer endpoint. Gartner estimates more than 50% of organizations will adopt some form of autonomous endpoint management by 2029. That is the market we are moving into, and it is meaningfully larger than the remote support market we are coming from. With our unique AI innovation, we are leapfrogging into that autonomous IT market and its massive opportunity.
7
On TeamViewer's Moat, the reason AI strengthens our position rather than threatening it comes down to data, trust, and integration. We operate at the endpoint, where the friction occurs and where the remediation happens. This gives us two proprietary data streams we described earlier, at scale that no competitor can match. We are also deeply embedded in global IT infrastructures, across more than 620,000 customers and in missioncritical environments around the globe. We have built trust, reputation, and expertise over 20 years as a vendor agnostic software provider. That entrenchment is a structural advantage. This is then amplified by the AI flywheel effect discussed earlier. And on the business model. Our expansion into AEM is driven by our existing go-to-market approach, since we are already selling to the relevant buyers through Tensor and DEX. We are bringing a strong, new best of suite value proposition to a proven upsell motion. The transition from seat-based to endpoint-based pricing is a natural evolution as we sit on the endpoint and do endpoint management. There is substantial upside from this alone in our massive global device footprint. Zooming out and putting all of this together, the shift towards autonomous IT management validates the importance of our proprietary data advantage. If anything, the pace of AI adoption tells us that there is more potential ahead than we initially anticipated. The early commercial data confirms it. For a company with our data, our endpoint footprint, and 20 years of customer trust, AI is not a threat. It is a structural tailwind. Let me give the floor to our customers, because they say it better than we can. You will see three early adopters sharing the real world impact of our market-leading AI innovation. 25% faster resolution on recurring issues. 25 to 50 hours saved per month. Recurring issues identified. Countermeasures defined. Automations written automatically. Instant proof of service at the click of a button. This is what it looks like when AI moves from promise to tangible business impact. Our full AEM capabilities go live this summer, and the compounding effect of this data advantage will only accelerate from there. And with this, I would like to hand it over to Mark to detail how the commercial engine is set up to capture the opportunity in front of us.
8
Mark Banfield
Thank you, Oliver. Let me walk you through what the commercial engine looks like on the ground. We came into 2026 with a clear mandate to accelerate global sales and go to market execution. I want to share the progress that has been made and the early evidence of our efforts. Let me start with the organization, since structure is what makes everything else possible. We took decisive action to level up the organization. We have exceptional new leadership in place, with Tim Koubek as President of Americas and Finn Faldi as our new EVP of Inside Sales, combining deep domain expertise and strong executive presence. Tim and I worked together previously at LogicMonitor, so I know what he is capable of. He has already hit the ground running. Americas is our second largest region, and he and I are fully aligned on the mission to reignite growth in this exciting market. We both see strong upside as the go-tomarket motion matures there. Finn is a TeamViewer veteran rejoining to leave global inside sales. He was the key leader driving the upsell motions discussed earlier, and will now drive the same for TeamViewer ONE in global inside sales. He has already had a material impact in the short time he has been on Board. We have a unified sales in a global organization under my leadership, and rolled out a very highly sophisticated sales playbook operating across SMB and Enterprise. Our revenue operating system will take a further leap forward with the rollout of Salesforce, which is in its final stages. This will give us better pipeline visibility and sales discipline to execute at scale. The organization is truly energized by the new momentum around TeamViewer ONE. This was evident at our global sales kick-off in January, where we set the course for this year. On go-to-market activation, TeamViewer ONE is resonating. The market feedback on the unified value proposition has been very strong. Customers understand the consolidated value proposition, and they are responding to it. We are also strategically scaling our marketing presence, deliberately ramping up brand campaigns and events ahead of the AEM general availability this summer. So the commercial activation and the product milestone arrive together. And the channel motion is stepping up too.
9
We had a fantastic EMEA partner summit in March, with the Americas to come. The partner network is an important multiplier for us, particularly for managed service providers, and we are investing accordingly. On deal momentum, we are very confident in our pipeline. The leading indicators are moving in the right direction, across both segments. In Enterprise, TeamViewer ONE is already winning strategic large deal flagship customers less than a few months into launch. Demonstrating that the value proposition is clearly landing, and the sales motion is effective. In SMB, we can see the course correction is stabilizing the base, which is the foundation for new growth momentum on the back of TeamViewer ONE. TeamViewer ONE ARR more than doubled quarter over quarter in Q1. This is the commercial engine turning. We have the organization, motion activation, and deal momentum. And with the AEM launch ahead of us, the pipeline building across both segments, we believe we are set up for growth. Q1 shows tangible evidence that our strategic positioning is translating into wins on the ground. Three flagship deals stand out. First, a German bicycle retailer with more than 40 local shops. They chose TeamViewer ONE to manage internal IT across a distributed retail and workshop network, ensuring frictionless store operations and excellent customer experience. A clear example of TeamViewer ONE resonating with midmarket customers where simplicity and reliability matter most. Second, a global digital transformation provider with thousands of endpoints. They selected TeamViewer ONE to seamlessly integrate acquired companies into a centralized IT model. With real time automation and response, delivering tangible ROI from day one. This is exactly the unified proposition we have been building towards with TeamViewer ONE. And third, a global leader in agricultural machinery with some of the most iconic brands. They have selected TeamViewer to embed Tensor OT directly into their remote portal across an estate of almost 100,000 connected machines. This is a multi-year strategic partnership built on joint engineering, going well beyond typical software deployment. They plan to use TeamViewer to deliver a new digital service to dealers and farmers. Reduce on-site technician 10
costs and improve uptime in time-sensitive harvest operations. Their CEO described this capability as a quote, must win bet. This is the kind of strategic OEM use case where there are very few credible alternatives to Tensor OT in the market. And looking ahead to Q2, we have already secured a significant contract expansion in one of our flagship DEX accounts. The customer, one of the largest integrated health care systems in the United States, with approximately 600,000 endpoints under management, is scaling their commitment with us. The expanded contract now exceeds $10 million in annual recurring revenue. A clear validation of our DEX platform at mission-critical scale, and a strong indicator of how flagship customers deepen their investment once real time remediation is proven across the fleet. This is an excellent example of how our leading value proposition in digital employee experience and autonomous endpoint management continues to translate into tangible growth. TeamViewer ONE is clearly resonating with our customers. Finally, just last week we announced that the MercedesAMG PETRONAS Formula 1 team has upgraded from Tensor to TeamViewer ONE. This is a textbook example of the upsell motion playing out at the top of the market. A high-performance organization running thousands of critical endpoints across factory, office, and track side with zero tolerance for downtime. And importantly, under the Formula 1 cost cap, sponsor status does not automatically translate into operational deployment. This is particularly true for the Mercedes sponsor roster. The fact that they actively chose to expand with us is therefore a strong validation of the TeamViewer ONE and AEM value proposition at the highest performance tier. Taken together, customers are choosing TeamViewer because we can deliver outcomes at scale that point solutions cannot. That is the value proposition working, and it gives us real confidence in the pipeline ahead. With that, I hand over to Michael for the financial review. Michael Wilkens
Thank you, Oliver and Mark, and good morning, everyone. Let's look at our key financials for the first quarter of 2026. As Oliver already mentioned, everything is tracking to plan. The first quarter reflects the phasing we expected. Top line broadly stable, alongside strong profitability and normal anticipated cash flow timing effect. 11
Let me give you a brief overview of our financial performance, starting with the ARR. We delivered EUR737 million ARR, flat year over year in constant currency. As we explained during our Q4 2025 results, Q1 top line growth was impacted by two factors. One-off 1E churn and strategic SMB course correction measures. Importantly, one-off 1E churn effects are largely complete and the remaining customer base is stable. Enterprise fundamentals remain strong. Enterprise ARR, excluding DEX, increased by 18%, demonstrating continued and strong underlying growth. On the P&L, revenue was EUR183 million, broadly flat year over year in constant currency. This is fully consistent with internal expectations and in line with our 2026 revenue growth guidance. Adjusted EBITDA increased by 2% to EUR83 million, delivering a strong adjusted EBITDA margin of 45.3%. 2.4 percentage points above Q1 last year. I will explain the cost phasing behind this in a moment. Reported net income and EPS both increased by 15% year over year. Adjusted EPS was EUR0.29 this quarter. On the balance sheet, net leverage ratio sequentially improved to 2.5 times, which demonstrates that we are actively deleveraging and remain firmly on track for our around 2.3 times year-end target. Before I share the details, I want to reiterate that Q1 was going to be a soft start as we said in February this year. The one-off 1E churn effect of EUR8 million and the headwinds from the SMB course correction measures were known, disclosed, and anticipated. What you see in Q1 is therefore the phasing we planned for. The numbers are in line with our expectations. And behind that phasing, the leading indicators tell us that we are moving in the right direction. The commercial momentum Oliver and Mark walked you through gives us a clear confidence in the ARR growth acceleration that we have committed to for the second half of 2026. Let me now go through our key financials in more detail on the next slide. Let me start with the P&L. Constant currency revenue was broadly stable and in line with our expectation. Reported revenue was negatively impacted by foreign exchange movements, resulting in a 3.3 percentage point headwind compared to last year. Primarily driven by the US dollar.
12
The actual average FX rates in Q1 are provided on Slide 23. SMB revenue decreased by 1% year-over-year in constant currency to EUR126 million, reflecting the impact of the SMB strategic measures mentioned earlier. Enterprise revenue was flat year-over-year and reached EUR57 million. We saw strong underlying growth in TeamViewer, excluding DEX, which was temporarily offset by the one-off 1E churn effect. Gross profit was EUR168 million with a gross margin of 92%. Broadly stable year-over-year and reflecting the high quality of our subscription revenue base. COGS decreased by 8% year-over-year, reflecting lower variable lower variable costs in line with top line development and lower front line related implementation costs. Total opex decreased by 8% year-over-year to EUR85 million, demonstrating our disciplined cost management, even as we continue to organically invest in growth and innovation. Sales expenses increased 6% year-over-year, driven by investments in the sales organization. This is intentional and ongoing. Marketing costs decreased 28% year-over-year, reflecting deliberate phasing of marketing costs ahead of our major brand and commercial activation, including the autonomous endpoint management innovation launch in Q2. This is not structural, it will normalize. R&D costs were up 7% year-over-year, reflecting continued investment in the combined product offering, AI capabilities, and a higher number of internal developers. We are investing in our innovation capabilities to fuel our next leg of growth. G&A expenses declined 8% year-overyear due to phasing and continued cost synergy realization. Other expenses amounted to around EUR900,000, down year-over-year, reflecting lower bad debt charges. Adjusted EBITDA margin of 45.3% is higher than our full year guidance, and is a Q1 phasing effect. Our full year guidance of around 43% remains the right reference point. Net income was up 15% year-over-year. Total interest expenses were EUR9.5 million in Q1, up EUR0.8 million year-over-year. As in prior quarters, this was driven by 1E financing. Adjusted EPS was EUR0.29 this quarter, stable year-over-year. Then moving on to leverage. Net debt was EUR870 million at the end of Q1 2026, which is an improvement of EUR31 million compared to net debt at year end of 2025. Net 13
leverage ratio sequentially improved to 2.5x. As mentioned, we have a clear path to reach our year end net leverage target of around 2.3x. The details of the free cash flow will follow on the next slide. As I mentioned earlier, Q1 shows normal anticipated cash flow timing effect. Levered free cash flow conversion in the quarter was 29%, which is unusually low and not representative of the full year trajectory. Let me give you a clear picture of cash flow drivers for this quarter. Pre-tax cash from operating activities was EUR55 million, up 18% year-over-year. The step down in growth to levered free cash flow adjusts for 1E acquisition related cash flow timing effects from taxes, interest and lease payments, as well as the temporary negative impact from net working capital. We expect these effects to normalize over the course of the year. I would like to reiterate that for full year 2026, we expect levered free cash flow to be between EUR190 million and EUR210 million, broadly stable in absolute terms and in cash conversion terms compared to 2025. With that picture of Q1 in full, let me close with the guidance on the next slide. We delivered stable top line performance in line with our guidance, and maintained best in class profitability. Our focus remains firmly on driving sustainable, profitable growth, while advancing our strategic roadmap. We are reaffirming our full year 2026 guidance. We anticipate constant currency revenue growth in the range of 0% to 3% versus the pro forma 2025 revenues. ARR growth acceleration in the second half of 2026 is on track. We expect SMB churn to remain elevated in Q2, and then to stabilize in the second half of 2026. SMB headwinds and 1E one-off churn effect are developing as expected, and visibility remains good for the remainder of the year. At March 31st, 2026 spot rates, the expected total FX impact on our guidance is negative 3 percentage points for Q2 2026 and negative 2.5 percentage points for full year 2026. The expected currency impact is shown on Slide 23. We continue to guide for an adjusted EBITDA margin of around 43%. Q1 was higher than that, but the marketing cost normalizes during the year. The margin should move towards the full year guidance level. With that, let me hand back to Oliver to bring together what we have covered today. 14
Oliver Steil
Thank you, Michael. 2026 is the year of delivery, and Q1 was the first proof point. The two effects that moderated our results, the one-off churn in 1E and our SMB course corrections, are developing exactly as we said in February. What is new is the commercial momentum. TeamViewer ONE is gaining real traction. Customers are choosing platform consolidation over fragmented point tools, and AI adoption is compounding. With more than 300,000 session summaries generated in March alone. The early commercial data follows a pattern that we know very well. Tensor went from initial traction to a core share of enterprise ARR within six quarters, and the leading indicators tell us that we are on the same path. We are reaffirming our full year guidance across every metric. The building blocks for second half ARR growth accelerations are firmly in place. We have the right strategy, the right priorities, and a clear path to unlock the next stage of performance. And I now look forward to your questions.
Operator
Ladies and gentlemen, we will now begin the question-and answer-session. Anyone who wishes to ask a question may press star and one on their touchtone telephone. You will hear a tone to confirm that you have entered the queue. If you wish to remove yourself from the question queue, you may press star and two. Participants are requested to use only handsets while asking a question. Anyone who has a question may press star and one at this time. One moment for the first question, please. And the first question comes from Victor Cheng from Bank of America. Please go ahead.
Victor Cheng
Hi, good morning, and thanks for taking my questions. A couple, if I may. Maybe on the recent TeamViewer ONE contracts that you've signed, where you moved from per seat per endpoint. What are the early signs of pricing uplift that you're seeing? And how do we think about the impact to the LTV of a customer when you make such a move, both currently and in the medium term? And then secondly, just a clarifying point on the 45k daily average billings, how should we think of it in ARR terms? And then lastly, a question on EBITDA margins. Obviously, you guided 43%. So how should we think about the phasing of EBITDA margins going forward? Is marketing spend going back up starting Q2 already? Thank you. 15
Michael Wilkens
Yeah. Thank you, Victor. Good morning. Let me start with the last question on the EBITDA margin phasing throughout the year, and then maybe Mark takes the first, and Oliver will take the second on the 45k daily billings to ARR. On the margin, exactly as you thought, 45 was phasing Q1. You should expect something for Q2 in the vicinity between 42 to 43, and then it will level out throughout the year. So for the full year, we are bang on with the around 43 guidance. Maybe Mark the first one on TeamViewer ONE pricing?
Mark Banfield
Sure. Yeah. Yeah, on the pricing, Victor, thanks for the question. So look, we are seeing some good uplift from existing customers where we migrate upsell them to TeamViewer ONE. Of course, there's two sides to the coin, right? It's a way of retaining customers, but also we are seeing some meaningful uplift. So we're seeing some healthy progress there overall. We didn't disclose those numbers, but we're seeing good progress.
Oliver Steil
Yeah, maybe on the on the second question, I mean, I think it's a general topic. The kind of per seat to per endpoint, and then the 45k billing. So generally obviously we are steering the business for ARR firmly as you know from all our disclosure. But the TMV One upsell is mostly happening in inside sales, and they are looking at the daily transaction volume exactly actual invoices. So the invoices for cash that we're sending to customers, and therefore we chose that billings numbers as an indicator here just because it really shows the daily traction, and we expect this to grow significantly from here throughout the year, as you can expect. Typically what we see is an ARR conversion Billings to ARR conversion between 0.7 to 0.9. Sometimes it's a one-to-one conversion. It really depends on the deal. So there is a little bit of a step down typically because there's also a little bit of 2-year deals or so, even in inside sales. But generally speaking, quite close to the Billings. And again, this is just an indicator. And then the upsell depends a lot on the number of devices. There is a -- in most situations there's an inbuilt meaningful upsell because people have more devices under management and want to move to more devices under management than they were paying in seats for remote control and remote support.
16
So this is almost like a mathematical fact of customer footprint. There's also opposite customers that have a different behavior, that have no managed devices and only need to grow from the start. But it typically comes with a nice with a nice uplift. Victor Cheng
Understood. Thank you.
Operator
And the next question comes from Alice Jennings from Barclays. Please go ahead.
Alice Jennings
Hi, good morning. Thanks for taking my questions. A couple for me as well. So just firstly on the SMB KPIs, so thinking about the subscriber numbers and then also churn. How much of this is driven by that decision to abandon the free to paid campaigns? And then I guess therefore, what can we think about as being a more normalized level for these KPIs once that effects has come to an end, I think in Q3? And then the second question is just on 1E. So I mean the acquisition's been integrated for a little over a year now. So wondering how the cross-selling between this is progressing. And I guess how this compares to internal expectations at the time of the acquisition?
Michael Wilkens
Yeah, Alice. Let me start with the second one, the first one, sorry, I didn't hear correctly but someone will help me who takes that one. On the 1E integration. Actually indeed, fully integrated. I'll give you also some synergy elements both on the cost side, but also on the top line side. Costs first. We gained de facto 3 million of savings in 2025. And it will ramp to 6 million this year including the three of last year. So with all of the integration done, number one on the cost side, especially FTE, G&A areas. We gained a lot but also on consolidating contracts. And also in the COGS area we were able to optimize our costs which is good and nice and needed. Moving then to the top line elements. It's a good one. Remember we told the market that we expect a rough cut 10 million revenue synergy on the top line and we see this actually tracking and trending nicely. Number one, the full pipe is rough cut in the vicinity of 70 million. So with a with a conversion ratio of a third, you can expect something in the vicinity of around 20 million and that means 20 million ARR. Then would obviously be bang on kind of on the 10 million revenue synergy. And we mentioned Mark explained it. Yeah, there's just one big deal that we just explained in the US. Of this additional upsell of 2 million ARR, this is 17
obviously already fueling this revenue synergy. And there are many more coming and also came some already. Mark Banfield
Maybe just to add one comment. I think yeah, the examples I explained, pretty much, you know, most of them are really good evidence of cross-sell working. The strategy here of bringing together the 1E DEX proposition with the TeamViewer Remote proposition, and TeamViewer ONE, as we've explained it. And the strategic benefit to customers of that infinity loop that Oliver explained in the presentation, that's what's really fueling our cross-sell opportunity. And that's where we're starting to see significant wins. And it's where we're seeing real significant growth in our pipeline.
Michael Wilkens
And on the free to paid campaign. I think you asked for, what is the normalized motion on the free to paid. So all of the let's call it the hard core free to paid in a commercial blocker has been stopped. And the normal vicinity in there's some normal movements of free to paid and this should be in the vicinity also around one to two million.
Oliver Steil
Yeah, I think the just to add, I think it's also on the subscriber number itself. Look where, if you don't do free to paid, you're missing a few thousand subscribers that you bring in every quarter at the entry level. And that's what we're missing. So obviously, if we see very, very strong usage of free users first we observe them. And then we speak to them and then we convert them into paying customers. So that's the moving, that's the kind of, I would say, the normal conversion funnel that we obviously operate from marketing to paid conversion. But what we're missing is the inflow of a few thousands every quarter. And that's noticeable in the subscriber numbers. So if you would normalize for that, as, if you go back when we still have this running. We're keeping the subscriber number stable. But then we had elevated churn. So that's what we're correcting now. So that's the order of magnitude to think about.
Alice Jennings
Okay, very helpful. Thank you so much.
Operator
The next question comes from Ben Castillo-Bernaus from BNP Paribas. Please go ahead.
Ben Castillo-Bernaus
Hi, good morning. Yeah. Thanks for taking my questions. First one really on TeamViewer ONE enterprise and the momentum that sounds encouraging. Could you just touch really on what's resonating with customers? You know, 18
Tensor is not new, but adding DEX and then the AI overlay and AEM to come. I think you mentioned some sort of consolidation, customers want, you know, cleaner platform. Could you maybe just touch on who you might be replacing there? And then just returning to that conversation around, you know, the pricing moving to an endpoint pricing, clearly a sizeable increase over a typical Tensor ELA. How are the sales cycles different and how are you kind of balancing the direct sales versus channel versus MSP? Mark, you mentioned some investment required in the MSP partner network. So what does that look like and how big can that become in the mix? Thanks. Oliver Steil
Yep. I think these are both for Mark.
Mark Banfield
First one sort of value around TeamViewer ONE enterprise. I mean, so basically the as I -- as we kind of explained in the presentation, the infinity loop, the ability to utilize the remote control sessions that you are doing on a day to day basis across your devices. And then turn them into autonomous capabilities that live on the endpoint. This is completely unique in the market. So there's no one else that can provide that kind of solution. And when you take that proposition to the enterprise, it's somewhat of a no brainer for customers because they're already running a remote control solution which. And very often they're a little bit losing that data that happens. They're not collecting and sort of leveraging that very rich data that could be taken from those sessions. And of course we enable them now using AI to sort of leverage that data. And more importantly turn them into autonomous capabilities. And it I doubt there's any CIO on the planet that isn't really focused on taking their IT organization towards autonomous IT. So that, that's really what's resonating and in terms of who are we replacing? All the usual suspects. I mean, you know, we come with a, a joined up proposition. A single platform, single agent, single price point that allows our customers to invest in a platform for autonomous endpoint management and therefore we're able to swap out the, the existing remote control vendor that's there. Same is true on the other side by the way is if they are, you know, coming from a DEX angle, it's also an opportunity to replace the current DEX vendor. On pricing and sort of investments around channel, maybe just talk 19
about investments around channel. Clearly, yeah, that's a big opportunity for us. It's already a significant part of our market. I mean our, a large part of our customer base are managed service providers. If you break it down, we have the traditional MSP channel which is servicing the SMB market where we already have significant traction and customers today. So there is clearly a very big opportunity there with TeamViewer ONE and that’s where we are seeing a lot of our early success with TeamViewer ONE standard and advanced. And then as you move up the ranks into sort of mid-market and enterprise, there's a different breed of MSP right up to global system integrators. And we're addressing all of them as well with dedicated channel and sales teams focusing on those types of partners… Oliver Steil
Maybe to add on the endpoint base pricing and the sales cycle there, the sales cycle is not, is not different really. I mean, the proposition is very strong as Mark laid out. So it's really a deliberate move of customers to consolidate platforms and have kind of the joined up offering of the infinity loop so to say, from us. So the DEX part, the AI part, and the remote part in one package so to say. That is the decision they're taking and that is a decision which is not a difficult one. As Mark said because people want to consolidate and want to simplify. Then the -- we move with it. You need to have a measure and the measure in this can only be endpoint because it's outcome based, so to say, it's endpoint under management. So that doesn't influence the sales cycle. It's more that it influences the roll out cycle sometimes. So customers move onto the new proposition and then you see how step by step adding end points because they might have a certain number of endpoints under management which they then move to TeamViewer ONE. And then over time, they expanding it or they still have a vendor existing in the base, as Mark just said, and then when that contract comes to an end, then they adding endpoints. So that's more the dynamic at play. There's not so much the sales cycle, it's more a deployment and roll out and, and then land and expand cycle, which is I think the very interesting piece of TeamViewer ONE is that there is much more land and expand opportunity now with the endpoint number growing and proliferating into OT and IoT environments.
Ben Castillo-Bernaus
Very helpful. Thanks for the color. 20
Operator
And the next question comes from Florian Treisch from Kepler Cheuvreux. Please go ahead.
Florian Treisch
Yes, thanks and good morning, gents. I have a question as well on TeamViewer ONE. You flagged the excitement around the mid-term potential of the product or even nearterm potential. So can you maybe provide us, let's call it an end or exit level for the fiscal year, what you believe might be a good approximation for daily run rate at the end of '26 to really get a feeling about how fast you can ramp up this revenue stream? Thank you.
Michael Wilkens
Oliver, do you want to take that?
Oliver Steil
Yes, I can take that. So, obviously, as you point out, early innings. I think we've never seen a run rate, daily run rate increase like this in any product that we have been launching. And clearly we are, we want to be cautious in what we provide as guidance to the market. But we really want to make TeamViewer ONE a doubledigit million contributor as quickly as possible. So with the current run rate, if you do the math on ARR, quite soon, and this is the case, and we want to grow from here clearly throughout the year. I would probably look at it like doubling on the standard advance, which is happening in inside sales. So getting to 100k ARR a day throughout the year is something which we want to do. And then that doesn't include TeamViewer ONE Enterprise, which only started. And it's hard to give a prediction of how many deals we will get there over time. But you can expect a meaningful step up throughout the year.
Mark Banfield
Yeah. And Florian, to add on what Oliver just said on Enterprise, take the one big customer which we just explained also, which is a reverse move to TeamViewer ONE from DEX to Tensor now. I mean, this alone will make the equation explode. So the Enterprise move can be very significant, but very early or too early to indicate anything, as Oliver also outlined.
Florian Treisch
Great, fair points. Thank you very much.
Operator
And the next question comes from Gustav Froberg from Berenberg. Please go ahead.
Gustav Froberg
Good morning, everyone. Thank you for taking mine also. Just two on the lower end side of the SMB customer group, if you like. Could you just give a bit more color on what you are rolling out or the initiatives you're putting in place to bump up growth as you progress through 2026? 21
And sort of in line with that question, how do you see competitors and the rest of the market trying to address this segment and how does your approach differ or compare? Michael Wilkens
Yeah. Maybe I can start, Oliver, you?
Oliver Steil
Okay. No fine, go ahead. I can start, like more generally, I think the -- as we've shown that picture of the different segments. I think what is what is clear is that there is a very, very healthy SMB base which we are addressing and untap grow or generate additional growth. And the initiatives on that one are TeamViewer ONE, AI, AI usage, price ups. So more for more. Over time, when people get to use AI even more, we're focusing on adoption at the moment, but monetization is following suit. So there's a lot going on in this. If you go at the entry level, speak at the entry level, where the usage from customers is quite confined to remote support. We are working to keep the base as stable as possible. We have reduced kind of strategies which are upsetting customers more. So like price increases, as we had mentioned before. But there is not so much upsell motion you can do in this one. So it's all about keeping the base as stable as possible. We don't see a significant change in competitive behavior on this end, quite honestly. And I think, let's say, more of the same, but with the negative effects of price ups and the likes washing out throughout the year. So we'll see improvements towards the second half of the year as well. Sorry Michael, go ahead.
Michael Wilkens
No, I only mini add ons. So Gustav, especially from 2027 onwards when the price ups and the commercial blocker are completely washed out, also in the lower segment that should also keep on stabilizing then more and more. But in the end and you know it and we know it, it's a commoditized business on this -- on the very low end and competition is high. And if we would think about lowering prices or so, the back book effect would just be too high. So keep it as much as we can, but it's difficult on the low end to enrich via features it.
Gustav Froberg
Great, thank you very much.
Michael Wilkens
Thank you, Gustav.
22
Operator
Ladies and gentlemen, this was today's last question. I would now like to turn the conference back over to Oliver Steil for any closing remarks.
Oliver Steil
Yes, thank you operator. Thank you everybody for joining. I know it's a busy morning, so thanks for the interest in TeamViewer and the questions. And hope you have a good day and talk soon. Thank you. Bye-bye.
23
Q1 2026 Press Release and Quarterly Statement GÖPPINGEN, Germany, 6 May 2026
TeamViewer Q1 2026: Revenue in line with expectations, Enterprise ARR up +8% cc, full-year 2026 guidance reaffirmed ◉
Topline broadly stable, in line with expectations: Q1 2026 Revenue €183.2m (-0.4% cc yoy1) and ARR €737.3m (+0.2% cc yoy), in line with 0% to 3% cc full-year 2026 Revenue guidance and consistent with internal phasing expectations
◉
Growth in Q1 impacted by two anticipated effects as disclosed with Q4 2025 results: one-off 1E churn and SMB course correction measures
◉
Healthy underlying Enterprise ARR growth: Enterprise ARR grew +8% cc yoy in Q1 2026. As
disclosed with Q4 2025 results, €8m of one-off churn from 1E was absorbed in the Q1 2026
Enterprise performance. Without one-off 1E customer churn, Enterprise ARR would have been +11% cc yoy. One-off 1E churn effects are now largely complete and remaining customer base is stable. Enterprise ARR excl. DEX was up +18% cc yoy, demonstrating continued and strong underlying growth
◉
Strategic course correction in SMB: performance
SMB churn is tracking as anticipated. Soft SMB
was a direct consequence of SMB course correction measures, especially
impacting small accounts (ARR < €1.5k). SMB churn is expected to remain elevated in Q2 2026 and to stabilize in H2 2026 ◉
Maintaining best-in-class profitability: Q1 2026 Adjusted EBITDA of €83.0m (+2% yoy), with a margin of 45.3%, as anticipated. This reflects deliberate phasing of Marketing cost ahead of Q2 2026 commercial activation, while organic investments in Sales and Research & Development are ongoing
◉
Full-year 2026 guidance reaffirmed: Revenue growth 0% to 3% cc yoy2, Adjusted EBITDA margin unchanged ~43%. SMB headwinds and 1E one-off churn effects developing as expected, visibility remains good for the remainder of the year, H2 ARR growth acceleration on track. Year-end leverage target of ~2.3x on track
◉
AI adoption is scaling rapidly, firmly embedded in customer workflows: Cumulatively, TeamViewer clients have generated more than 1.4m AI session summaries, with more than 300k added in March alone, demonstrating outstanding traction of in-product AI adoption
◉
TeamViewer ONE gains commercial momentum: Average daily billings for TeamViewer ONE have doubled since December 2025, with Enterprise traction already accelerating following the launch of TeamViewer ONE Enterprise. Early commercial momentum confirms customer demand for platform consolidation over fragmented point tools, spearheading the transition to an endpoint-based pricing model
1 2
YoY revenue growth rate is compared to Q1 2025 comparable pro forma Revenue of €190.3m. YoY revenue growth is compared to FY 2025 pro forma Revenue of €767.5m.
TeamViewer SE
1
Q1 2026 Press Release and Quarterly Statement
Oliver Steil, TeamViewer CEO “Q1 played out as expected,” said Oliver Steil. “We delivered stable topline performance in line with our guidance and maintained best‑in‑class profitability. 2026 is a year of delivery, with the first clear proof
points now visible. Enterprise ARR grew despite the anticipated one‑off 1E churn, underlining the strength of our core business. At the same time, TeamViewer ONE is gaining tangible commercial
momentum and our Enterprise product had a great start in February, as customers are choosing platform consolidation over fragmented point tools. Our AI capabilities are scaling rapidly and are firmly embedded in customer workflows, with more than 300,000 AI session summaries generated by our customers in March alone. We are confident in the ARR growth acceleration expected in the second half, and are firmly on track to deliver on our guidance for 2026.”
Michael Wilkens, TeamViewer CFO “Everything is tracking to plan,” said Michael Wilkens. “The first quarter reflects the phasing we
expected: topline broadly stable alongside strong profitability and normal anticipated cash flow timing effects. Net leverage ratio sequentially improved to 2.5x and we remain firmly on track for our around 2.3x year-end target – giving us financial flexibility to invest organically in growth while continuing to deleverage.”
Q1 2026 company results at a glance (consolidated, unaudited) in € million (unless otherwise stated)
Q1 2026
Q1 2025
Δ in %
Δ in % cc
Annual Recurring Revenue (ARR)
737.3
759.5
-2.9%
+0.2%
Revenue1
183.2
190.3
-3.7%
-0.4%
Gross profit1,2
168.2
174.1
-3%
—
Gross profit margin1,2
92%
91%
0 pp
—
Adjusted EBITDA1
83.0
81.7
+2%
—
Adjusted EBITDA margin1
45%
43%
+2 pp
—
EBITDA
75.1
66.6
+13%
—
Operating profit (EBIT)
61.9
53.2
+16%
—
Net income
34.2
29.6
+15%
—
Basic number of shares issued and outstanding (m)
157.8
157.0
+1%
—
Earnings per share – basic (in €)
0.22
0.19
+15%
—
Adjusted net income1
45.3
45.6
-1%
—
Adjusted earnings per share – basic (in €)1
0.29
0.29
-1%
—
Cash flows from operating activities
41.7
38.2
+9%
—
Levered Free Cash Flow (FCFE)3
23.8
44.5
-47%
—
870.0
1,027.7
-15%
—
Net debt 1
Q1 2025 comparable actuals are pro forma. YoY growth rate is compared to Q1 2025 pro forma comparable actuals. Gross profit in this table is calculated based on recurring costs and therefore differs from the gross profit presented in the IFRS P&L. 3 YoY growth rate is compared to prior year Levered Free Cash Flow (FCFE) adjusted for 1E and legal disputes. 2
TeamViewer SE
2
Q1 2026 Press Release and Quarterly Statement
Business Update Executing the plan, building momentum TeamViewer started 2026 with good momentum. TeamViewer ONE is gaining real traction with both SMB and Enterprise customers: growth in daily average billings is accelerating, the pipeline is developing, and early deals are closing faster than expected. The product development team has made serious progress toward the company’s highly anticipated launch of Autonomous Endpoint Management (AEM) innovation, which will drive the next leg of growth. Meanwhile, the Go-To-Market (GTM) overhaul is taking shape, setting up the sales organization to capture the upsell opportunity it has been building toward.
TeamViewer ONE is taking off TeamViewer ONE - the company's unified IT management platform - is moving fast. ARR for the product
more than doubled quarter-over-quarter, a signal that customers are ready to consolidate fragmented point tools onto a single AI-driven platform. The Enterprise version launched and closed its first deals
almost immediately, despite sales cycles that typically stretch for months. That kind of early traction follows a pattern TeamViewer knows well: it has successfully upsold across a customer base of more than
600,000 before. More AI features and expanded platform functionality are coming through the year, which should keep the TeamViewer ONE growth curve steep.
AI adoption and AEM innovation as growth drivers The first quarter delivered critical milestones toward the AEM innovation, due to launch this summer.
TeamViewer is building a closed-loop learning system: it detects anomalies, triggers remediation, and resolves IT issues autonomously, even before they become problems. The system draws on remote
support expertise, deep endpoint telemetry, and real-time automation. TeamViewer has a data advantage that is hard to replicate: in March alone, the platform added more than 300,000 AI session summaries, each one sharpening the system's intelligence. That combination - proprietary data, remote support heritage, and automation capability - builds a genuine moat in autonomous IT and opens up a meaningfully larger addressable market.
The sales engine is being rebuilt TeamViewer's global sales organization went through significant structural change in the first quarter. CRO Mark Banfield streamlined the organization, Tim Koubek joined as President Americas, and a new revenue operating system is nearly fully deployed. The goal is a commercial engine built for the next phase of growth - one that can convert the Enterprise opportunity around TeamViewer ONE, DEX, and the upcoming AEM innovation into closed deals. Early signs are encouraging: pilot and trial activity with prospective customers has picked up. TeamViewer also continued to invest in its partner network and customer outreach to help turn interest into deals. The pipeline is building.
Andrea Euenheim joins the Supervisory Board On March 25, 2026, Andrea Euenheim was appointed to TeamViewer's Supervisory Board, succeeding Hera Kitwan Siu. Euenheim brings more than 20 years of senior HR and transformation experience across Amazon, Metro AG, and General Electric, spanning Europe and the US. She now advises European and US technology companies on people strategy and organizational scaling, and sits on the Supervisory Board of Scout24 SE, where she chairs the compensation committee. Her formal election goes to shareholders at the Annual General Meeting on June 2, 2026.
TeamViewer SE
3
Q1 2026 Press Release and Quarterly Statement
Financial Highlights Broadly stable topline and strong profitability in the first quarter of 2026 Topline in the first quarter was broadly stable year-over-year, with AEM innovation and accelerating TeamViewer ONE platform adoption expected to support building Enterprise and SMB sales momentum through the year. Growth in the first quarter was held back by previously disclosed effects temporarily weighing on the DEX and SMB business. Known one-off churn events in the 1E customer base masked
healthy underlying growth in Enterprise. SMB performance in the first quarter continued to reflect the effects of strategic course-correction measures to revitalize SMB, most notably the discontinuation of short-term monetization activities. Elevated SMB churn reflects the pricing-action cohorts from early 2025, with churn expected to stabilize later in the year. TeamViewer maintained best-in-class
profitability well ahead of full-year guidance, supported by deliberate phasing of marketing costs ahead of upcoming product launches, whilst ongoing organic investments in Sales and Research & Development continued.
ARR and Revenue development Q1 2026
Q1 2025 pro forma
Δ in %
Δ in % cc
Revenue
57.0
59.9
-4.8%
+0.1%
ARR1
230.5
224.4
+2.8%
+7.7%
Enterprise NRR (cc)
93%
103%
Enterprise NRR (cc) adj. for net upsell from SMB
96%
108%
Revenue
126.2
130.4
-3.3%
-0.7%
ARR1
506.7
535.2
-5.3%
-2.8%
Revenue
183.2
190.3
-3.7%
-0.4%
ARR1
737.3
759.5
-2.9%
+0.2%
NRR (cc)
93 %
99 %
of customers (reporting date) (in thousands)1
621.9
663.4
-6%
100.6
97.6
+3.1%
+3.6%
AMERICAS
64.8
74.3
-12.8%
-6.3%
APAC
17.7
18.4
-3.4%
+2.1%
in € million (unless otherwise stated) Enterprise
SMB
Total
Revenue by region EMEA
1
Q1 2025 comparable actuals and growth rates are non-pro forma.
TeamViewer SE
4
Q1 2026 Press Release and Quarterly Statement
In Q1 2026, ARR grew by +0.2% cc yoy to €737.3m. Enterprise ARR grew by +8% cc yoy, and reached €230.5m at the end of the quarter. As disclosed with Q4 2025 results, €8m of one-off churn from 1E was absorbed in the Q1 2026 Enterprise performance. Without one-off 1E customer churn, Enterprise ARR would have been +11% cc yoy. 1E churn effects are now largely complete and remaining customer base is stable. Enterprise ARR excl. DEX increased by +18% cc yoy, demonstrating continued and strong underlying growth. Enterprise NRR (cc) was 93% in the quarter (Q1 2025: 103%3). Adjusted for net upsell of €10.5m (€-1.5m qoq) in the quarter from SMB to Enterprise, Enterprise NRR (cc) was 96% (Q1 2025: 108%3). This NRR trend mainly reflects 1E one-off churn effects. The total number of Enterprise customers increased yoy to 5,259 at the end of Q1 2026. SMB ARR was down by 3% cc yoy to €506.7m, in line with internal expectations. Strategic course-correction measures to revitalize SMB had a negative short-term impact on smaller SMB customers, with SMB ARR < €1.5k down 6% cc yoy. Higher-value SMB customers continued to grow, with SMB ARR > €1.5k up +1% cc yoy. The number of SMB customers amounted to 617k at the end of Q1 2026. In Q1 2026, Revenue decreased by 0.4% cc yoy3 to €183.2m (Q1 2025: €190.3m). Reported Revenue was negatively impacted by foreign exchange movements, resulting in a 3.3 percentage point headwind yoy in the quarter, primarily driven by the USD. The average EUR/USD exchange rate in Q1 2026 was 1.17, compared to 1.05 in Q1 2025. SMB Revenue decreased by 1% cc yoy3 to €126.2m (Q1 2025: €130.4m). Enterprise Revenue was flat (0% cc) yoy3 and reached €57.0m (Q1 2025: €59.9m). In Q1 2026, EMEA and APAC delivered revenue growth yoy3 in constant currency. EMEA delivered a midsingle-digit increase of +4% cc yoy3, and reached €100.6m in Revenue (Q1 2025: €97.6m). APAC grew by +2% cc yoy3 to €17.7m (Q1 2025: €18.4m). AMERICAS Revenue declined by 6% cc yoy3 to €64.8m (Q1
2025: €74.3m), which was impacted by a generally subdued market environment in the US, combined with weaker performance of 1E.
Adjusted EBITDA In Q1 2026, Adjusted EBITDA was €83.0m, up +2% yoy3 (Q1 2025: €81.7m). Adjusted EBITDA margin reached 45.3%, +2 pp yoy3 (Q1 2025: 42.9%). Total 1E acquisition related material adjustments in EBITDA were €2.0m, which related to ongoing system integrations.
In Q1 2026, total Recurring Cost decreased by 8% yoy3 to €100.2m (Q1 2025: €108.6m). Cost of Goods Sold (COGS) decreased by 8% yoy3 to €14.9m (Q1 2025: €16.2m), which reflects lower variable costs in line with topline development and lower Frontline related implementation costs. Sales expenses increased by +6% yoy3 to €33.0m (Q1 2025: €31.1m), driven by investments in the reorganized sales organization. Transition effects were short-term and were managed with strict cost discipline, and with no structural inefficiencies. Sales costs as % of Revenue were 18%3 (Q1 2025: 16%). Marketing costs decreased by 28% yoy3 to €18.3m (Q1 2025: €25.6m), which reflects deliberate phasing of Marketing ahead of major brand and commercial activation in Q2 2026. Research & Development (R&D) expenses increased by +7% yoy3 to €23.6m (Q1 2025: €22.1m), reflecting continued investments in the combined product offering, including data and AI capabilities, as well as a higher number of internal developers. R&D expenses represented 13%3 of Revenue (Q1 2025: 12%). General & administrative (G&A) expenses declined by 8% yoy3 to €9.4m (Q1 2025: €10.2m), mainly due to phasing and continued synergies related cost savings. Other expenses amounted to €0.9m (Q1 2025: €3.4m), reflecting lower bad‑debt charges yoy.
3
Q1 2025 comparable actuals are pro forma.
TeamViewer SE
5
Q1 2026 Press Release and Quarterly Statement
Adjusted net income In Q1 2026, Net income increased by +15% yoy to €34.2m (Q1 2025: €29.6m). Total interest expenses were €9.5m in Q1 2026, up €0.8m yoy. Consistent with the prior quarters, this increase was driven by the financing of the 1E transaction. Adjusted net income was broadly flat yoy3 at €45.3m (Q1 2025: €45.6m). Adjusted (basic) EPS was flat yoy at €0.29 (Q1 2025: €0.29).
Financial Position In Q1 2026, cash flows from operating activities amounted to €41.7m, up +9% yoy. Cash flows from investing activities were €-1.0m. Cash flows from financing activities amounted to €-49.9m and mainly
include net debt repayments of €31m. As a result, Cash and cash equivalents were €32.6m at the end of Q1 2026. Levered Free Cash Flow (FCFE) adjusted for 1E acquisition was €23.8m in Q1 2026, representing a decrease of 47% yoy.4 This development reflects continued strong pre-tax cash flow from operating
activities (+18% yoy), which was more than offset by expected short-term phasing effects from taxes, interest and lease payments, as well as a temporary negative impact from net working capital. These effects are expected to normalize over the course of the year.
Net Debt totaled €870.0m at the end of Q1 2026, which is an improvement of €31.4m compared to €901.4m at 31 December 2025. Net Leverage Ratio sequentially improved to 2.5x (Net Debt/pro forma
Adjusted EBITDA LTM) and it remains in line with TeamViewer’s internal deleveraging target to reach around 2.3x by the end of 2026.
FY 2026 Guidance reaffirmed TeamViewer reaffirms full-year 2026 guidance and continues to expect growth acceleration as temporary topline effects unwind and commercial momentum around TeamViewer ONE and AI continues to build. For full-year 2026, TeamViewer expects:
◉
Revenue growth in constant currencies between 0% and 3% yoy (vs. pro forma Revenue FY 2025 of €767.5m); and
◉
Adjusted EBITDA margin of around 43%.
Revenue growth (YoY constant currency vs PY pro forma basis) Adjusted EBITDA Margin (as reported, incl. currency effects)
FY 2025 Pro Forma (comparison base)
FY 2026 Guidance
€767.5m
0% - 3% cc 1,2
44%
~ 43%
Revenue growth in constant currencies vs IFRS Revenue FY 2025 of €746.8m will be higher than the revenue growth in cc vs pro forma Revenue FY 2025 of €767.5m. 2 Constant currency growth including an average exchange rate of 1.13 EUR/USD. 1
4
YoY growth rate is compared to Q1 2025 Levered Free Cash Flow (FCFE) adjusted for 1E acquisition and legal disputes.
TeamViewer SE
6
Q1 2026 Press Release and Quarterly Statement
While the revenue growth guidance for FY 2026 is in constant currency, actual currency reported revenue is expected to be impacted by currency exchange rate fluctuation. At 31 March 2026 spot rates, the expected total FX impact on FY 2026 revenue growth guidance in constant currency is negative 2.5 percentage points, primarily driven by the USD. Each quarter, TeamViewer will provide expected currency impact on revenue growth in the quarterly earnings presentation. Additionally, TeamViewer will provide the additional expected FX impact that comes from historic deferred revenue release to avoid systematic over/underestimation of currency movements in reported revenue. TeamViewer’s central invoicing model and IFRS treatment fix deferred revenue at the invoice-date FX rate, causing FX effects when historic deferred revenue is released in revenue.
TeamViewer SE
7
Q1 2026 Press Release and Quarterly Statement
Webcast Oliver Steil (CEO), Michael Wilkens (CFO) and Mark Banfield (CRO) will speak at an analyst and investor conference call at 9:00 am CEST on 6 May 2026 to discuss the Q1 2026 results. The audio webcast can be followed via https://www.webcast-eqs.com/login/teamviewer-2026-q1. A recording will be available on the Investor Relations website at https://ir.teamviewer.com/publications/financial-results. accompanying presentation is also available for download there.
The
About TeamViewer TeamViewer provides a Digital Workplace platform that connects people with technology—enabling, improving and automating digital processes to make work work better. In 2005, TeamViewer started with software to connect to computers from anywhere to eliminate travel and enhance productivity. It rapidly became the de facto standard for remote access and support and the preferred solution for hundreds of millions of users across the world to help others with IT
issues. Today, more than 620,000 customers across industries rely on TeamViewer to optimize their digital workplaces—from small to medium sized businesses to the world’s largest enterprises— empowering both desk-based employees and frontline workers.
Organizations use TeamViewer’s solutions to prevent and resolve disruptions with digital endpoints of
any kind, securely manage complex IT and industrial device landscapes, and enhance processes with augmented reality powered workflows and assistance—leveraging AI and integrating seamlessly with
leading tech partners. Against the backdrop of global digital transformation and challenges like shortage of skilled labor, hybrid working, accelerated data analysis, and the rise of new technologies, TeamViewer’s solutions offer a clear value add by increasing productivity, reducing machine downtime, speeding up talent onboarding, and improving customer and employee satisfaction. The company is headquartered in Göppingen, Germany, and employs around 1,900 people globally. In 2025, TeamViewer achieved pro forma revenue of €767.5m. TeamViewer SE (TMV) is listed at Frankfurt Stock Exchange and belongs to the SDAX. Further information can be found at www.teamviewer.com.
2
Important Notice / APMs (continued) TeamViewer has defined each of the following APMs as follows: •
Adjusted EBITDA is defined as operating income (EBIT) according to IFRS, plus depreciation and amortization of tangible and intangible fixed assets (EBITDA), adjusted for certain business transactions (income and expense) defined by the Management Board in agreement with the Supervisory Board. Business transactions to be adjusted relate to sharebased compensation schemes and other material special items of the business that are presented separately to show the underlying operating performance of the business.
•
Adjusted EBITDA margin means Adjusted EBITDA as a percentage of revenue.
•
Billings represent the value (net) of goods and services invoiced to customers within a specific period and which constitute a contract as defined by IFRS 15.
•
Annual Recurring Revenue (ARR) is annualized recurring revenue for all active subscriptions at the end of the reporting period. It is calculated by multiplying the daily subscription revenue at the end of the reporting period by 365 days (or 366 days for leap years). Daily subscription revenue is calculated as the total active contract value divided by the contract duration in days. The end of the reporting period is defined as the last calendar day of the respective period.
•
Retained ARR is defined as the ARR at the end of the reporting period from customers that were already a customer at the end of the prior-year reporting period.
•
Net Retention Rate (NRR) (cc) is defined as Retained ARR (cc) at the end of the reporting period divided by the total ARR at the end of the prior-year reporting period.
•
Number of customers means the total number of paying customers with an active subscription at the reporting date.
•
SMB customers means customers with ARR across all products and services of less than EUR 10,000 at the end of the reporting period. If the threshold is exceeded, the customer will be reallocated.
•
Enterprise customers means customers with ARR across all products and services of at least EUR 10,000 at the end of the reporting period. Customers who do not reach this threshold will be reallocated.
•
Customer churn rate means the percentage of customers not retained during the last twelve-month period. It is calculated as 100% minus the number of customers that were retained (no new customers) during the last twelve months divided by the total number of customers twelve months ago.
•
Average Selling Price (ASP) is calculated by dividing the total ARR by the total number of customers at the reporting date.
•
Net financial liabilities are defined as financial liabilities (without other financial liabilities) less cash and cash equivalents.
•
Net leverage ratio means the ratio of net financial liabilities to Adjusted EBITDA of the last twelve-month period.
•
Levered Free Cash Flow (FCFE) means net cash from operating activities less capital expenditure for property, plant and equipment and intangible assets (excl. M&A), payments for the capital element of lease liabilities and interest paid for borrowings and lease liabilities.
•
Cash Conversion means the percentage share of Levered Free Cash Flows (FCFE) in relation to the Adjusted EBITDA.
•
Adjusted Net Income is the net income adjusted for certain income and expenses. These adjustments are: share-based compensation, amortization related to business combinations, other non-recurring income and expenses and related tax effects.
•
Adjusted basic earnings per share is calculated in line with basic earnings per share, whereby Adjusted Net Income is used as the basis for the calculation instead of the net income.
•
Constant currency (cc) comparisons eliminate the impact of exchange rate fluctuations between different periods.
•
“Pro forma” refers to TeamViewer group numbers including 1E numbers before closing (unaudited management view at the time of acquisition) as well as a reversal of negative M&A effects on revenue (“haircut”) after closing of the transaction. Pro forma numbers are prepared for comparative purposes and should be read in conjunction with financial statements. They are not necessarily indicative of the results that would have been attained if the transaction had taken place on a different date.
Q1 2026 Results
3
Business Overview
Oliver Steil Chief Executive Officer
The Digital Workplace Company
Mark Banfield Chief Revenue Officer
Q1 2026: Revenue in line with expectations, Enterprise ARR up +8% cc, full-year 2026 guidance reaffirmed Topline broadly stable, in line with expectations:
Growth in Q1 impacted by
Revenue €183.2m (-0.4% cc yoy1) ARR €737.3m (+0.2% cc yoy)
one-off 1E churn and SMB course correction measures
1
2
firmly embedded in customer workflows; >1.4m cumulative AI sessions generated
acceleration on track
4
Adjusted EBITDA €83.0m (+2% yoy); margin of 45.3%, as anticipated
3
TeamViewer ONE gains commercial momentum:
AI adoption is scaling rapidly:
Full-year 2026 guidance reaffirmed; H2 ARR growth
1
Maintaining best-in-class profitability:
5
growth is accelerating, early deals closing faster than expected
6
YoY revenue growth rate is compared to Q1 2025 comparable pro forma Revenue of €190.3m. Q1 2026 Results
5
Healthy underlying Enterprise ARR growth DEX temporarily impacted by anticipated effects ARR breakdown Q1 2026
Enterprise ex-DEX (+18% yoy)
In € million
YoY (cc): +1%
SMB 507
Enterprise 231
1.5k-10k
Enterprise non-DEX (>10k)
Continued double digit growth in underlying TMV Enterprise business YoY (cc): +18%
One-off churn effects are now largely complete and remaining customer base is stable
258
(35%)
174
Higher end SMB (+1% yoy)
(24%) YoY (cc): -6%
DEX (-16% yoy)
Large base of customers with significant upsell potential
<1.5k
248
(34%)
10k DEX
56
YoY (cc): -16%
(8%)
Q1 2026 Results
Lower end SMB (-6% yoy) Ongoing course correction measures to revitalize
6
TMV ONE: Early momentum with high-value expansion Daily Avg. Billings within month, in €k TeamViewer ONE Standard
TeamViewer ONE Advanced
TeamViewer ONE Enterprise
TMV ONE Standard
TMV Tensor (MDS included)
TMV Tensor (MDS included)
TMV Tensor (MDS included)
TMV ONE Enterprise
TMV DEX Essentials, Device Monitoring
TMV DEX Essentials, Device Monitoring
TMV DEX Enterprise
TMV AI
TMV AI
TMV AI
Only two months post ENT release
TMV ONE Advanced
Post-SKO execution ramp visible in February / March
Major Standard / Advanced release in December
Asset & Patch Management, SSO, Auditability
SMB
45
January seasonality
- Global Sales Kickoff
4
Mid-Market
Enterprise
<5,000 endpoints
≥5,000 endpoints
Q1 2026 Results
Oct-25
Nov-25
Dec-25
Jan-26
Feb-26
Mar-26
7
TMV ONE: Extending our growth runway, tapping into a proven upsell engine Illustrative Gross Annual Recurring Billings by upsell motion since 2018
TMV ONE illustrative and not to scale
TeamViewer ONE Pattern repetition of proven upsell motions, supported by AI innovation Corporate-2-Tensor Feature-led migration of Corporate customers to advanced Tensor licenses Corporate Channel Upgrades Capacity-driven expansions for customers on a Corporate license Perpetual-2-Saas Product-wide migration of customer base to recurring SaaS licenses
Q1 2026 Results
8
TMV ONE: Upcoming release of market-leading AEM innovation to accelerate platform pull General Availability
General Availability in summer 2026
Turning visibility to insights 4
DEX insights
5
“
Remote support session
DEX Automation
I'm impressed [...], that you can bring [Tia] to each of our problems.
1
Fixed once, fixed forever
Remote Support and Access
6
3
AI-driven automations
Session summaries
Q1 2026 Results
2
Head of Service Desk, MSP
Agentic AI augments experts to resolve case
“
System Engineer, MSP
It's crazy that something like this works and can be done. [Tia will probably make our work really easy in the future.]
Source: Interviews with selected experts from existing customers in February and March 2026
9
Strong AI adoption momentum as evidenced by major milestone of one million AI sessions
26k
Customers that have used TeamViewer AI1
1.4m
cumulative AI sessions2
Strong and scaling customer traction underscoring structural data advantage for unique AEM innovation
Restrictive access & usage observation
- Total number of customers that have used TeamViewer AI as of May 5, 2026
- Number of cumulative AI sessions summarized as of May 5, 2026
Q1 2026 Results
10
AI Opportunity: A structural tailwind for TeamViewer Market
Moat
Model
AI shifts IT gradually from reactive to autonomous management; risk averse I&O leaders stick with trusted vendors as security stakes rise
More than a cloud app: one of the biggest endpoint footprints globally with expansion potential in 620k+ customers moving to managed devices
Expansion into AEM category is driven by existing GTM as we are already selling to the relevant buyer persona with Tensor IT/OT and DEX deals
Human work decreases long-term, but operational IT/OT endpoints continue to grow in number and value as AI moves to the edge and IoT penetration accelerates
Two proprietary data streams at scale, expert RS/RA sessions and deep DEX telemetry, driving a unique AI proposition with compounding flywheel effect
TeamViewer ONE is not an AI add-on feature play but Best-of-Suite with AI-native core, compounding commercial pull for a repeatedly proven upsell play
AI innovation allows TeamViewer to leapfrog into the autonomous IT market and expand TAM meaningfully from remote support to endpoint management
Deeply entrenched in global infrastructure stack as trusted, vendor-agnostic leader across IT/OT domains, evidenced by partnerships and integrations
Strategic transition from seat to endpoint and value pricing anchored in TeamViewer's endpoint footprint and productivity ROI
Q1 2026 Results
11
Strong customer testimonials from early adopters on value delivered ROI & Efficiency
Insight & Knowledge
Audit & Compliance
“Substantial efficiency gain with 25% faster resolution on recurring issues and 25–50h saved a month on manual documentation.”
“Session Insights help to identify recurring issues and define countermeasures — even write automations.”
“Session Summaries provides a lot of value through the delivery of easy proof-of-service and back-up of Service Level Agreements (SLAs).”
Co-President, US-based Managed Service Provider (10+ employees)
IT Manager, Retail Operations (500+ employees)
IT Infrastructure Expert, Large IT Services Provider (5,000+ employees)
Q1 2026 Results
12
GTM Execution: Sharpened commercial engine already driving commercial momentum Well-invested Sales Organization
Intensified GTM Activation
Building Deal Momentum
• New leadership President AMER and EVP Inside Sales with deep domain expertise
• TeamViewer ONE resonating Strong market feedback on unified value proposition
• Accelerating pipeline Strong leading indicators on progression and conversion
• Unified GTM model One global sales organization, one playbook across SMB and ENT
• Scaling market presence Brand campaigns and events ramping ahead of AEM release
• Enterprise TeamViewer ONE winning strategic flagship customers
• Step change in tooling Revenue operating system with Salesforce in final roll-out
• Partner-led growth Channel motion validated at EMEA summit, AMER to follow
• SMB Positive reception of reduced friction and refined monetization
Q1 2026 Results
13
Flagship customer deals evidence strong value proposition across the business TeamViewer ONE
DEX
Tensor OT
Leading German
Global digital
Global leader in
bicycle retailer
transformation provider
agricultural machinery
Scale: 40+ local retail shops
Scale: 2,500 endpoints
Scale: Almost 100,000 endpoints
Key differentiator: Reliable internal IT
Key differentiator: Real-time
Key differentiator: OEM – embedded
for distributed retail operations
automation and response
remote access at scale
Use Case: Managing internal IT across a
Use Case: Integrating acquired
Use Case: Embedding secure remote
distributed retail and workshop
companies into a centralized IT model
access into connected farming
network to ensure stable operations
while maintaining service desk teams,
machinery to enable digital services
and good customer experience.
delivering tangible ROI.
and remote diagnostics at global scale.
Large Q2 Upsell
Contract Expansion in flagship DEX account
One of the largest integrated healthcare systems in US with ~600,000 endpoints now at >$10m ARR
Q1 2026 Results
14
Financial Overview
Michael Wilkens Chief Financial Officer
The Digital Workplace Company
Q1 2026: Revenue in line with expectations, Enterprise ARR up +8% cc, full-year 2026 guidance reaffirmed Revenue
ARR
Adjusted EBITDA
-0.4% cc yoy1
+0.2% cc yoy
+2% yoy
€183.2m
€737.3m
Adjusted EBITDA Margin
Basic EPS / Adjusted EPS
+2 pp yoy
+15% yoy / -1% yoy
45.3%
1
€0.22 / €0.29
€83.0m
Net Leverage Ratio
2.5x
YoY revenue growth rate is compared to Q1 2025 comparable pro forma Revenue of €190.3m.
Q1 2026 Results
16
Key P&L and other financial KPIs development Q1 2026: phasing as expected in € million (unless otherwise stated)
Q1 2026
Q1 2025
∆%
Revenue1
183.2
190.3
-4%
Cost of Goods Sold (COGS)1,2
(14.9)
(16.2)
-8%
Gross profit1,2
168.2
174.1
-3%
1,2
92%
91%
0 pp
Total Opex
(85.3)
(92.4)
-8%
Adjusted EBITDA1
83.0
81.7
+2%
% Margin
45%
43%
+2 pp
D&A
-13.2
-13.4
-1%
Operating Profit (EBIT)
61.9
53.2
+16%
Net income
34.2
29.6
+15%
Basic number of shares issued and outstanding in m
157.8
157.0
1%
EPS (basic) in €
0.22
0.19
+15%
Adjusted EPS (basic) in €
0.29
0.29
-1%
Levered Free Cash Flow (FCFE)
23.8
44.5
-47%
Cash conversion (FCFE / Adjusted EBITDA3)
29%
54%
Net debt
870.0
1,027.7
2.5x
3.1x
% Margin
1,2
1
1
Net leverage ratio
4
◉ Revenue growth (cc) broadly stable yoy alongside strong profitability and normal anticipated cash flow timing effects ◉ Ongoing organic investments in Sales and Research & Development, while deliberately phasing Marketing cost ahead of Q2 commercial activation ◉ Net leverage ratio sequentially improved; remain firmly on track for around 2.3x year-end target
-15%
1
2025 comparable actuals are pro forma. YoY growth rate is compared to 2025 pro forma comparable actuals. | 2 Based on recurring costs. | 3 FCFE / Pro forma adjusted EBITDA for 2025. | 4 Net debt / Pro forma adjusted EBITDA LTM. Q1 2026 Results
17
Continued strong operating cash flow short-term timing effects to normalize over the year in € million (unless otherwise stated)
Q1 2026
Q1 2025
∆%
55.2
46.7
+18%
Capital expenditure (excl. M&A)
(1.0)
(1.0)
+1%
Lease payments
(7.0)
(1.5)
n/a
Pre-tax Unlevered Free Cash Flow (pre-tax UFCF)
47.2
44.2
+7%
Interest paid for borrowings and lease liabilities
(12.0)
(9.0)
+33%
35.3
35.2
0%
(13.5)
(8.4)
+60%
Levered Free Cash Flow (FCFE)
21.8
26.8
-19%
Cash Conversion (FCFE / Adjusted EBITDA1)
26%
33%
2.0
6.1
-68%
—
11.6
n/a
Levered Free Cash Flow (FCFE) adj. for 1E and legal disputes
23.8
44.5
-47%
Cash Conversion (FCFE / Adjusted EBITDA1) after adjustments
29%
54%
Pre-Tax net cash from operating activities (IFRS)
Pre-tax Levered Free Cash Flow (pre-tax FCFE) Income tax paid
Adjustment for 1E acquisition Adjustment for a one-off payment in connection with special legal disputes
1
◉ Continued strong pre-tax cash flow from operating activities (+18% yoy) ◉ Normal anticipated cash flow timing effects from taxes, interest and lease payments, as well as a temporary negative impact from net working capital ◉ These effects are expected to normalize over the course of the year
FCFE / Pro forma adj. EBITDA for 2025. Q1 2026 Results
18
FY 2026 Guidance reaffirmed
1 2
FY 2025 Actuals (comparison base)
FY 2026 Guidance
Revenue growth (YoY constant currency vs PY pro forma basis)
€767.5m pro forma
0% - 3% cc1,2
Adjusted EBITDA margin (reported, incl. currency effects)
44% pro forma
~ 43%
FY 2026 guidance for revenue growth is at constant currencies2 Actual currency reported figures are expected to be impacted by currency exchange rate fluctuations through the year TeamViewer’s expected currency impact on revenue growth in FY 2026 is shown on slide 23
Revenue growth in constant currencies vs IFRS Revenue FY 2025 of €746.8m will be higher than the revenue growth in cc vs pro forma Revenue FY 2025 of €767.5m. Constant currency growth including an average exchange rate of 1.13 EUR/USD.
Q1 2026 Results
19
Q&A
Appendix
The Digital Workplace Company
FX impact & debt maturity profile
The Digital Workplace Company
Expected currency impact: USD represents TeamViewer’s largest topline foreign currency exposure Expected FX impact Q2 & FY 2026 in revenue at spot rate on 31 Mar 2026 (compared to 2025 pro forma revenue)
Q1 2026 (actual)
Q2 2026 (expected)
FY2026 (expected)
Total FX Impact1
-3.3pp
-3.0pp
-2.5pp
YoY FX Impact
-1.8pp
-1.6pp
-1.5pp
Additional Deferred Revenue FX Impact2
-1.5pp
-1.4pp
-1.0pp
Currency exposure vs guided YoY growth in cc: ◦ TeamViewer guides YoY revenue growth in constant currency3 ◦ Actual currency reported figures are expected to be impacted by currency exchange rate fluctuations through the year as reflected in the table TeamViewer specific situation:
1
Expected total FX impact on constant currency growth rate at spot rate on 31 Mar 2026.
2
The expected additional deferred revenue FX impact in Q3 is -0.8pp and Q4 is -0.3pp.
Q1 2026 (actual average)
Q2 2026 (expected)
EUR/USD
1.17
1.15
EUR/CAD
1.61
1.60
EUR/AUD
1.69
1.67
3 main currencies
3
◦ TeamViewer’s central invoicing model and IFRS treatment fix deferred revenue at the invoice‑date FX rate, causing unavoidable FX effects when historic deferred revenue is released in revenue ◦ Therefore, TeamViewer provides the additional expected FX impact that comes from historic deferred revenue release to avoid systematic over/ underestimation of currency movements in reported revenue
Constant currency growth including an average exchange rate of 1.05 USD per EUR for Q1 2025 and 1.13 USD per EUR for FY 2025.
Q1 2026 Results
23
Debt maturity profile as of 31 March 2026 (€m)
Term Loan (1E)
450
Bridge to DCM (1E) Money Market Loans Promissory Note 2021 Promissory Note 2024 15
51.5
Private Placement 2025 2024 Syndicated RCF
145
75
2022 Syndicated RCF 150
25
25
15 15 13 25
2026
2027
2028
48.5
15 15
2029
2030
Q1 2026 Results
9
9
2031
24
Key financials & KPIs
The Digital Workplace Company
Overview Topline KPIs Q1 2026
Q4 2025 Pro forma
Q3 2025 Pro forma
Q2 2025 Pro forma
Q1 2025 Pro forma
126.2
130.9
134.1
132.0
130.4
-1%
1%
3%
3%
2%
506.7
518.7
526.3
532.0
535.2
SMB Revenue in €m Revenue YoY % cc ARR in €m 2
ARR YoY % cc
-3%
-1%
0%
+1%
+2%
ASP (ARR) in €
822
822
822
817
813
616,598
631,373
640,342
651,221
658,327
17%
16%
16%
16%
15%
Revenue in €m
57.0
63.8
57.9
58.7
59.9
Revenue YoY % cc
0%
+3%
+8%
+15%
+21%
2
Number of customers
1
SMB Customer churn rate Enterprise
ARR in €m
231
241
230
227
224
ARR2 YoY % cc
+8%
+11%
+12%
+13%
+20%
44
46
44
44
44
93%
96%
97%
98%
103%
2
ASP (ARR) in € thousands NRR (cc) NRR (cc) adj. for net upsell from SMB
96%
99%
102%
103%
108%
Number of customers1
5,259
5,262
5,216
5,143
5,044
Total ARR in €m
737.3
759.7
756.8
759.1
759.5
Revenue in €m
183.2
194.6
192.0
190.7
190.3
100.6
103.1
101.5
99.8
97.6
AMERICAS
64.8
73.4
72.1
72.7
74.3
APAC
17.7
18.2
18.3
18.2
18.4
Revenue by region in €m EMEA
1
Q1 2025 comparable actuals and growth rates are non-pro forma.
Q1 2026 Results
26
Continued growth in Enterprise across all ARR value ranges SMB (ARR view)
Enterprise (ARR view)
(€m; % yoy cc; pro forma)
535.2
€ 1,500 - <10,000 ARR -3% cc
506.7
(€m; % yoy cc; pro forma)
€ 500 - <1,500 ARR
224.4
€ <500 ARR
€ >200,000 ARR +8% cc
230.5
€ >100,000 ARR € >50,000 ARR € 10,000 - 50,000 ARR
266.9
+1% cc
83.6
258.4 Net upsell from SMB to Enterprise: €10.5m
165.3
-5% cc
28.0 31.2
151.0
81.6 102.9 Q1 2025
-8% cc
+3% cc
+11% cc
82.3
28.5 33.2
+11% cc
+10% cc
86.6
97.4 Q1 2026
Q1 2025
Q1 2026 Results
Q1 2026
27
Adjusted P&L management view based on recurring cost Q1 2026
Q1 2025 Pro forma
∆%
Revenue
183.2
190.3
-4%
Cost of Goods Sold (COGS)
(14.9)
(16.2)
-8%
Gross profit
168.2
174.1
-3%
% Margin
92 %
91 %
0 pp
Sales
(33.0)
(31.1)
+6%
% of Revenue
-18%
-16%
Marketing
(18.3)
(25.6)
% of Revenue
-10%
-13%
R&D
(23.6)
(22.1)
% of Revenue
-13%
-12%
G&A
(9.4)
(10.2)
% of Revenue
-5%
-5%
Other
(0.9)
(3.4)
% of Revenue
0%
-2%
Total Opex
(85.3)
(92.4)
% of Revenue
-47%
-49%
(100.2)
(108.6)
-8%
Adjusted EBITDA
83.0
81.7
+2%
% Margin
45%
43%
+2 pp
in € million (unless otherwise stated)
1
Total Costs
2
-28% +7% -8% -74% -8%
Q1 2026 Results
1 2
Incl. other income/expenses and bad debt expenses of €2.1m in Q1 2026 and €3.5m in Q1 2025. Total Costs are the sum of Cost of Goods Sold (COGS) and Total Opex.
28
Q1 2026: Reconciliation management metrics to IFRS in € million (unless otherwise stated) Revenue
Management view Revenue adj. P&L
D&A
Other non-IFRS adjustments
183.2
Cost of Goods Sold (COGS) Gross profit contribution % of Revenue
(14.9)
Accounting view IFRS P&L 183.2
(9.4)
0.0
(24.4)
168.2
158.8
92%
87%
Sales
(33.0)
(1.3)
(0.4)
(34.8)
Marketing
(18.3)
(0.6)
0.0
(18.9)
R&D
(23.6)
(1.4)
(0.4)
(25.5)
(9.4)
(0.5)
(3.0)
(12.9)
Other
(0.9)
0.0
(3.9)
(4.8)
Adj. EBITDA
83.0
% of Revenue
45% (7.8)3
(7.9)
61.9
G&A 1
D&A (ordinary only)2
(5.5)
Adj. EBIT / Operating profit (EBIT)
77.5
% of Revenue
42%
2+3
D&A (total)
34% 13.2
EBITDA
75.1
% of Revenue
41%
1
Incl. other income/expenses and bad debt expenses of €2.1m D&A excl. amortization intangible assets from PPA 3 Amortization intangible assets from PPA 2
Q1 2026 Results
29
Non-IFRS adjustments in EBITDA Basis of preparation / definition
Q1 2026
Q1 2025
EBITDA
APM
75.1
66.6
Total IFRS 2 charges (expenses for share-based compensation)
APM
+0.9
+6.5
Non-IFRS EBITDA adjusted by
TeamViewer LTIP
APM
-0.1
+1.7
- non-recurring items
RSU/PSU1
APM
+1.0
+3.8
◦
IFRS2, mainly RSU
M&A related share-based compensation
APM
0.0
+0.1
◦
1E acquisition related items
Share-based compensation by TLO
APM
0.0
+0.9
◦
Other material items including
1E acquisition related integration & transaction costs
APM
+2.0
+5.6
Other material items
APM
+1.1
+3.0
Financing
APM
0.0
0.0
Other
APM
+1.1
+3.0
Valuation effects
APM
3.9
-5.5
Adjusted EBITDA
APM
83.0
76.2
Pro forma adjustment
n/a
+5.4
n/a
0.0
83.0
81.7
45%
43%
in € million (unless otherwise stated)
2
costs related to legal disputes ◦
Valuation effects from fair value derivatives of future USD hedges due to changing EUR/ USD development
Add back: 1E deferred revenue haircut 1E January 2025 Adjusted EBITDA
Pro forma adjustment
3
Adjusted EBITDA
Adjusted EBITDA margin (%)3
APM
Q1 2026 Results
1
Refers to the Restricted Stock Unit Plan (RSU) and Phantom Stock Unit Plan (PSU) introduced by TeamViewer in 2022. 2 Pre-IPO management incentive program provided by Tiger LuxOne S.à r.l. 3 2025 comparables contain pro forma adjustments.
30
EBITDA to net income in € million (unless otherwise stated)
Q1 2026
Q1 2025
∆%
75.1
66.6
+13%
D&A
(13.2)
(13.4)
-1%
Operating Profit (EBIT)
61.9
53.2
+16%
Financial / FX result
(10.9)
(7.0)
+56%
Share of profit/loss of associates
(0.8)
(2.2)
-61%
Profit before tax (EBT)
50.1
44.0
+14%
Income taxes
(15.9)
(14.4)
+11%
Net income
34.2
29.6
+15%
Basic number of shares issued and outstanding1 in m
157.8
157.0
+1%
EPS (basic) in €
0.22
0.19
+15%
Adjusted EPS (basic)2 in €
0.29
0.29
-1%
EBITDA
1 2
Period average, without treasury shares. 2025 comparables contain pro forma adjustments.
Q1 2026 Results
31
Adjusted net income & EPS Basis of preparation/ definition
Q1 2026
Q1 2025
Net income
IFRS
34.2
29.6
Expenses for share-based compensation
APM
0.9
6.5
PPA depreciation and amortization
APM
7.8
6.1
Other material items
APM
6.9
3.1
Extraordinary effects in finance result
APM
-0.4
1.5
Income tax items to be adjusted
APM
-4.2
-4.2
Adjusted net income
APM
45.3
42.7
1E deferred revenue haircut1
Pro forma adjustment
n/a
4.1
1E January 2025 adjusted net income
Pro forma adjustment
n/a
-1.1
45.3
45.6
157,794,594
156,966,162
0.29
0.29
in € million (unless otherwise stated)
Add back / deduct:
Adjusted net income2 Basic number of shares issued and outstanding
1
Adjusted earnings per share – basic (in €)2
1 2
Period average, without treasury shares. Pro forma is only calculated for Q4/FY 2025.
APM
Q1 2026 Results
1E revenue haircut Q1 2025 post tax at assumed 25 % corporate tax rate. 2 2025 comparables contain pro forma adjustments.
32
Financial Calendar
The Digital Workplace Company
2 June 2026 Annual General Meeting 28 July 2026 Q2/H1 2026 Results & Analyst Call 3 November 2026 Q3 2026 Results & Analyst Call
Develop applications that integrate TeamViewer functionality into your own corporate environment using the TeamViewer API.
The TeamViewer API
TeamViewer provides a web-based API that allows you to access data and control various aspects of your TeamViewer account. You can use the API to develop apps that integrate TeamViewer functionality into your own corporate environment or you can develop apps that everyone can use. The API uses REST to communicate with your application and the secure authorization standard OAuth 2.0 to manage access to all data.
Features
User management
Methods related to a TeamViewer company profile (e. g. create new company member, modify member information).
Methods related to a TeamViewer company profile (e. g. create new company member, modify member information).
Session management
Methods related to remote control sessions with TeamViewer (e. g. create new session, modify session information).
Methods related to remote control sessions with TeamViewer (e. g. create new session, modify session information).
Online meetings
Methods related to TeamViewer Meetings (e. g. Schedule meetings, start spontaneous meeting).
Methods related to TeamViewer Meetings (e. g. Schedule meetings, start spontaneous meeting).
Web monitoring
Methods related to get monitors, alarms data and create and manage monitors (e.g. get list of all monitors, get monitor check results for specified date and/or interval, or create uptime or page load monitor).
Methods related to get monitors, alarms data and create and manage monitors (e.g. get list of all monitors, get monitor check results for specified date and/or interval, or create uptime or page load monitor).
Group management
Methods related to groups in your TeamViewer Computers and Contacts list (e. g. create group, share group).
Methods related to groups in your TeamViewer Computers and Contacts list (e. g. create group, share group).
Connection reports
Methods related to connection reporting in the TeamViewer Management Console (e. g. list connection reports, export reports).
Methods related to connection reporting in the TeamViewer Management Console (e. g. list connection reports, export reports).
Computers and contacts
Methods related to the TeamViewer Computers & Contacts list (e. g. see who is online, start a remote control session with a contact or device, or batch import new contacts from your address book).
Methods related to the TeamViewer Computers & Contacts list (e. g. see who is online, start a remote control session with a contact or device, or batch import new contacts from your address book).
Monitoring and patch management
Methods related to get list of monitoring and patch management policies and activating the monitoring and patch management services.
Methods related to get list of monitoring and patch management policies and activating the monitoring and patch management services.
Sample use cases
- Create a service case out of a customer’s ticket within your help desk.
- Start a meeting from within a chat app and invite chat partners directly.
- Integrate a “Request a support session” button into your web application.
- Schedule a meeting in a third-party calendar app.
- Extract connection reports from the TeamViewer Management Console into Excel for further processing and generating statistics.
- See if a contact from your CRM is online in TeamViewer and directly ask them to start a remote control session to their computer.
- Automatically export connections reports from the TeamViewer Management Console every night for offline and flexible usage (e. g. for billing).
- Directly connect to a computer from within your favorite asset management system, using the password that is stored in your Computers and Contacts list.
- Quickly import the entire support team into your TeamViewer company profile.
- Automatically create a new TeamViewer account for every new user in your Active Directory.
- Get list of all monitors and based on the monitor ID get the check results for specified date or get alarms data for specified monitor.
- Get list of device and monitoring as well as patch management policy IDs to activate Monitoring and Patch Management services.
GET STARTED
Start developing right now
Developing your own application is easy. Follow the steps below or jump right into the API documentation to get started right away.
In the TeamViewer API, two different ways of using the API are distinguished: Either through Scripts or through Apps.
Apps are developed to be used by many different accounts. Because of this, Scripts and Apps have different ways of accessing TeamViewer data, represented by different types of tokens.
If you want to use the API for your own data only, create a script token. Don’t worry if you change your mind later, you can still migrate to an App with ease. If you want to create an App to be used by other TeamViewer customers, go ahead and create an OAuth 2.0 Client ID.


Create script
- Enter your script name
- Enter a description for your script
- Choose the permissions of your script
- Save the script

Write down token
Write down the token from the properties of the script you created recently. You will need the token in the developing process.
Create app
-
Enter an application name
-
Enter a description for your application
-
Enter the Redirect URI*
-
Choose an access level
-
Choose the permissions of your app
-
Save the app
Write down client ID and client secret
Write down the client ID and the client secret from the properties of the app you created recently. You will need them in the developing process.

Start coding
You can now start writing your own application using the API documentation.
*Users are redirected to the URI after granting your application access to their data. If set, only authorization requests will be granted that use the given Redirect URI. Can be changed later.
API documentation
The documentation of the TeamViewer API provides a detailed description of the available methods (including examples for the method calls) as well as basic information on using the API.
Examples
Our example scripts
We provide some pre-built scripts to help you to get started with developing your own applications. The scripts are available for PowerShell and Python.
Download the scripts for User Management, Reporting and Active Directory or take a look at the examples to get some helpful impressions.
Code example: Service queue
With the service queue, you can manage customer support cases in your TeamViewer and the TeamViewer Management Console.
This example provides an application that creates a service case. Using the attached program code you are able to comprehend how you can integrate the service queue features in your own application environment. You can download the app and C# code below.
Change Region
Products
ONE Platform
Solutions
Partner
Resources
Support
Company
Additional Links
Generate customized TeamViewer modules that contain your own logo and
text free of charge. Give a personal note to interactions with your
customers.
Get started
TeamViewer Remote offers many advanced features that make TeamViewer such a powerful and versatile tool for remote support, access and collaboration.
Included among the features within the TeamViewer Management Console is the ability to design and deploy customized customer modules.
Log in with your TeamViewer account and get started today!
Custom QuickSupport
Your customers use your customized QuickSupport module to allow access to their computers without having to install TeamViewer.
- Include your company logo and custom colors
- Add your own personalized title and text
- Automatically add users to your Computers and Contacts list
- Enable a customer satisfaction form at session close
- Create an SOS button on your customer’s desktop
- Allow customers to start an immediate chat
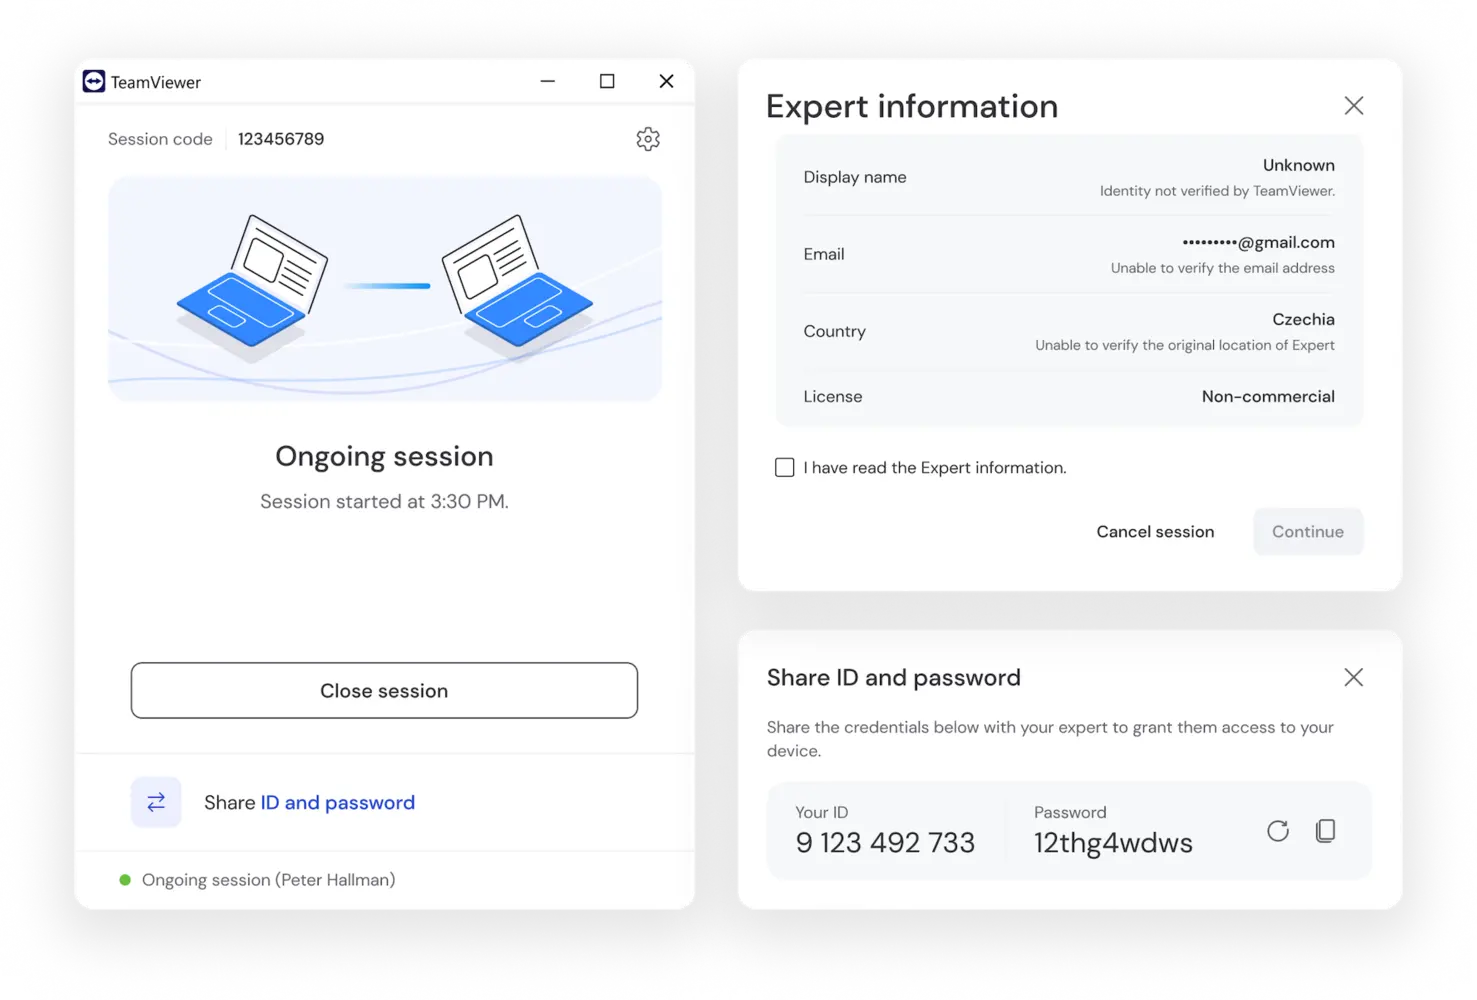
Custom Host
Your customers use your customized QuickSupport module to allow access to their computers without having to install TeamViewer.
- Include your company logo and custom colors
- Add your own personalized title and text
- Automatically add users to your Computers and Contacts list
- Allow customers to initiate a service case
- Apply TeamViewer policies
- Create a custom host module for Android device
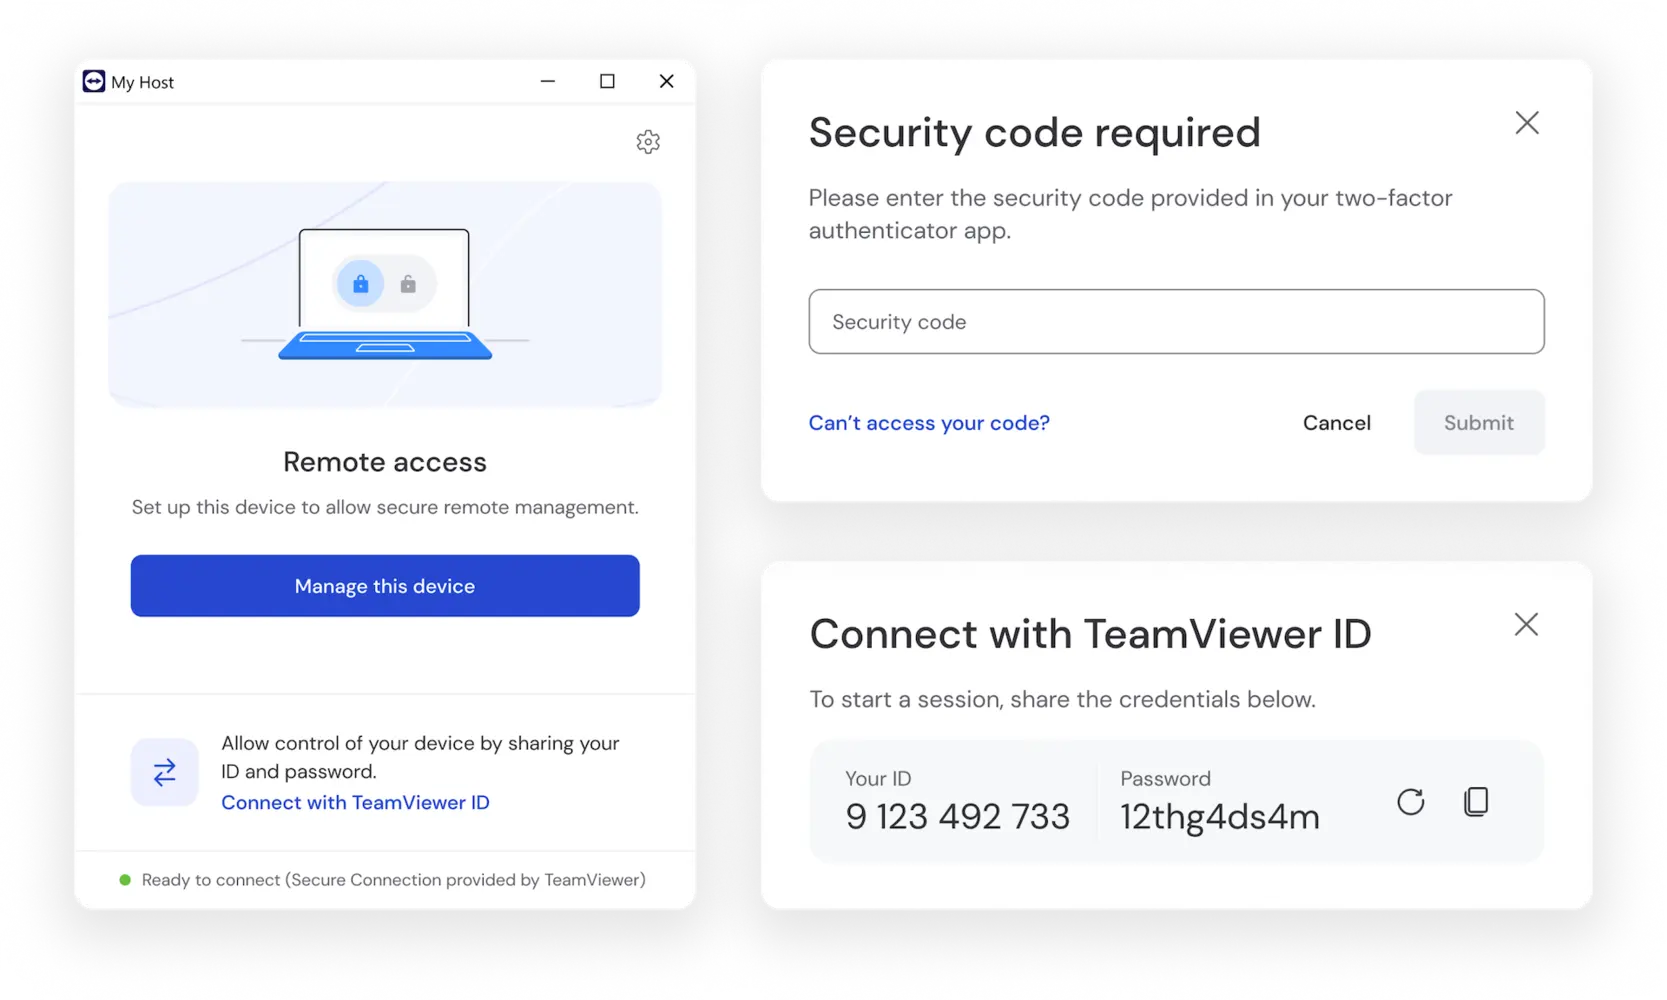
TeamViewer button
Create your own TeamViewer button for your website. It’s easy and free!
Link to TeamViewer or directly to a custom module that you have created.
Change Region
Products
ONE Platform
Solutions
Partner
Resources
Support
Company
Additional Links
Browse support articles or contact our team.](https://www.teamviewer.com/en/global/support/customer-support/)
[
\

TeamViewer Trust Center
TeamViewer goes to great lengths ensuring best-in-class security and privacy for millions of users worldwide.
Industry-leading security
TeamViewer’s IT and product security posture is defined by a global benchmark ambition.
World-class privacy
As a company headquartered in Germany, TeamViewer has data protection in its DNA.
Resolute misuse prevention
TeamViewer sets standards for modern user protection and misuse prevention.
Highlights
-
BitSight Security Rating
TeamViewer is ranked by BitSight Security Rating as top 1% in the tech industry.
-
[
\SecurityScorecard\
TeamViewer is rated by SecurityScorecard with an “A” security rating.](https://securityscorecard.com/security-rating/teamviewer.com) -
[
\YesWeHack\
TeamViewer cooperates with the leading crowdsourced security platform YesWeHack to engage with a large community of security researchers.](https://yeswehack.com/programs/teamviewer-bounty-program) -
CVE
TeamViewer is authorized by the CVE Program as a CVE Numbering Authority (CNA).
-
TISAX
TeamViewer has been awarded the TISAX label, which is designed to streamline high-quality IT security assessments in the automotive industry based on ISO 27001.
-
[
\SOC 2 and SOC 3\
TeamViewer has been audited for full SOC 2 and SOC 3 compliance based on the five trusted service principles (system security, availability, processing integrity, confidentiality, and privacy).](https://media.teamviewer.com/is/content/teamviewergmbh/teamviewer/central-image-hub/pdf/en/teamviewer-type-2-soc-3-report-en.pdf) -
[
\ISO/IEC 27001\
TeamViewer is ISO/IEC 27001 certified, which is the international standard for information security management.](https://media.teamviewer.com/is/content/teamviewergmbh/teamviewer/central-image-hub/pdf/en/teamviewer-align-iso-27001-certificate-en.pdf) -
[
\CSA STAR Registry\
TeamViewer provides STAR Level 1 CAIQ 4.0.3 Self-Assessment for the Remote and Tensor products.](https://cloudsecurityalliance.org/star/registry/teamviewer) -
[
\TX-RAMP\
TeamViewer’s DEX Platform achieves TX-RAMP Level 2 certification, strengthening our security and compliance for Texas public sector customers.](https://compliance.teamviewer.com/) -
[
\VPAT 508\
TeamViewer’s DEX SaaS products meet accessibility requirements outlined in the VPAT™, supporting compliance with Revised 508 Standards.](https://compliance.teamviewer.com/) -
[
\NIST SP 800-53\
TeamViewer’s DEX SaaS platform is NIST SP 800-53 Moderate certified, ensuring rigorous security and privacy controls for customer data protection.](https://compliance.teamviewer.com/) -
Alliance for Cyber Security
TeamViewer participates in the Alliance for Cyber Security by the German Federal Office for Information Security (BSI).
-
FIRST
TeamViewer is an audited member of the Forum of Incident Response and Security Teams (FIRST), a globally leading association for incident responders.
-
Global Anti-Scam Alliance (GASA)
TeamViewer collaborates with GASA to fight against scam.





Additional information
User guidance
Security handbook
Learn about TeamViewer’s advanced security settings.
Deep dive
Security statement
Learn about TeamViewer’s security standards and protocols.
AI transparency
TeamViewer AI Security Stance
See exactly how TeamViewer AI handles data—with clear controls, data flows, and architecture overviews.
Do you want to report a security issue?
TeamViewer’s security team will investigate every submission in our Vulnerability Disclosure Program (VDP).
Please choose your region
Selecting a region changes the language and/or content on teamviewer.com
SUGGESTED REGION
-
Americas
-
Asia Pacific
-
Commonwealth of Independent States
-
Europe
-
Middle East Africa
Change Region
-
Products
-
ONE Platform
-
Solutions
-
Partner
-
Resources
-
Support
-
Company
-
Additional Links

Cookie Consent
To improve your browsing experience on this website, TeamViewer and its partners would like to place cookies and similar technologies (“Cookies”) on your device. That enables us to analyze website usage and optimize our marketing efforts for the best possible user experience. By clicking “Accept Cookies” you agree to Cookie placement and respective use, as well as the subsequent processing of the collected data for the purposes of personalized advertising and marketing. Detailed information about the Cookies, the exact purposes, third-party recipients, Cookie lifetime, and more can be found in our Cookie Policy and Privacy Policy . You can always change your Cookie Settings to your own preference.
Imprint
https://www.teamviewer.com/en/address/
Cookies Settings
Only Necessary Cookies Accept All Cookies

Privacy Preference Center
When you visit our website, we ask you to store or retrieve information on your browser, mostly in the form of cookies. This information might be about you, your preferences or your device and is mostly used to make the website work as you expect it to. The information does not usually directly identify you, but it can give you a more personalized web experience. Because we value your right to privacy, you can choose to allow or not to allow some types of cookies on our website. Click on the different category headings to find out more and change the default settings. Please note, however, that blocking some types of cookies may negatively impact your experience of the site and the services we are able to offer. You will find more information on the cookies used by us in Annex 1 of our Cookie Policy.
Allow All
Manage Consent Preferences
Strictly Necessary Cookies
Always Active
These Cookies are essential in order to enable us to provide you with basic and security features of our website. Without these Cookies, certain services you have asked for cannot be provided, such as the use of areas of our website that are restricted to registered users (a Cookie, which identifies registered users to recognize them throughout the visit and upon return, e.g. within the login area of our Management Console) and webshop related services. They are usually only set in response to actions made by you which amount to a request for services, such as setting your privacy preferences, logging in or filling in forms. These Cookies are not implemented to gather information about you for other purposes such as marketing or analytics.
Cookies Details
Performance Cookies
Performance Cookies
These Cookies are used to collect information about the performance of our website and your visit and use of our website, for example, the number of visitors that used our website and the pages that are popular among our visitors. These Cookies do not collect information that directly identifies a visitor, although they may collect the IP address of the device used to access the site. Such information is used for the purpose of improving our website and the general user experience. Without the performance Cookies we will not be able to improve our website and its functionalities to provide you with the best surfing experience. If you do not allow these Cookies, your visit to our site will not be counted, which will negatively impact us when trying to improve our website.
Cookies Details
Functional Cookies
Functional Cookies
These Cookies allow TeamViewer’s website to remember your preferences, such as your username, language settings, and/or the region you are in. These Cookies help to provide enhanced, more personal features. They can also be used to remember changes you have made to text size, fonts and other parts of web pages that you can customize or provide services you have asked for such as watching a video, using the chat functionality or commenting on a blog. These Cookies do not track your browsing activity across other websites.
Cookies Details
Marketing and Targeting Cookies
Marketing and Targeting Cookies
These Cookies are used to deliver adverts more relevant to you and your interests. They are also used to limit the number of times you see an advertisement as well as help measure the effectiveness of our advertising campaigns. These Cookies collect several pieces of information about your browsing habits. They are usually placed by advertising networks with our permission. They remember that you have visited a website and this information is shared with other organizations, such as media publishers. These organizations do this in order to provide you with targeted adverts more relevant to you and your interests. This type of advertising is called online behavioral advertising. Furthermore, these Cookies allow us to analyze your website browsing behavior and thus allows us to customize our product marketing approach, e.g. help us decide on whether, when, and how to inform or get in touch with you based on your interests.
Cookies Details
Back Button
Cookie List
Search Icon
Filter Icon
Clear
- checkbox label label
Apply Cancel
Consent Leg.Interest
checkbox label label
checkbox label label
checkbox label label
Confirm My Choices

โปรดไปที่เพจท้องถิ่นของคุณเพื่อดูข้อมูลและข้อเสนอเฉพาะสำหรับประเทศของคุณ
Please visit your local page for information and offerings dedicated for your country.
TeamViewer Thailand
Stay at TeamViewer Asia Pacific

-
Products
Personal use and SMB TeamViewer Remote
Fast and secure remote access and IT support.
Enterprise TeamViewer Tensor
Remote connectivity built for secure operations.
Real-time troubleshooting TeamViewer DEX
Resolve issues before they affect users.
Connected worker TeamViewer Frontline
Drive efficiency with industrial augmented reality.
TeamViewer ONE
Get the full power of TeamViewer, unified in one platform.
Key integrations
-
ONE Platform
TeamViewer ONE Platform
Proactively manage and optimize your digital workplace combined in one platform.
-
Frictionless experience Smooth and uninterrupted digital experience -
Seamless IT operations Proactive remediations and exceptional service
Core capabilities
Gartner Report 2026
[
\TeamViewer named a leader in DEX\
TeamViewer named a Leader in 2026 Gartner® Magic Quadrant™ DEX tools.](https://www.teamviewer.com/apac/resources/reports/gartner-magic-quadrant-2026/)Key integrations
-
Solutions
Popular use cases Most popular TeamViewer use cases
-
Remote access and support Manage people, devices, and applications – from anywhere. -
Digital employee experience (DEX) Proactively solve IT issues before they impact productivity.
Other use cases Popular solutions for further use cases
By need Popular solutions for different requirements
-
Freelancers and digital nomads Work securely from any location
-
Non-profit and education 30% discount on TeamViewer technology
By industries Popular solutions sorted by industry
Talk to our sales team
Need help choosing the right solution, placing and order, or upgrading your license?
-
-
Resources
Find out more about TeamViewer

โปรดไปที่เพจท้องถิ่นของคุณเพื่อดูข้อมูลและข้อเสนอเฉพาะสำหรับประเทศของคุณ
Please visit your local page for information and offerings dedicated for your country.
TeamViewer Thailand
Stay at TeamViewer Asia Pacific
-
Products
Personal use and SMB TeamViewer Remote
Fast and secure remote access and IT support.
Enterprise TeamViewer Tensor
Remote connectivity built for secure operations.
Real-time troubleshooting TeamViewer DEX
Resolve issues before they affect users.
Connected worker TeamViewer Frontline
Drive efficiency with industrial augmented reality.
TeamViewer ONE
Get the full power of TeamViewer, unified in one platform.
Key integrations
-
ONE Platform
TeamViewer ONE Platform
Proactively manage and optimize your digital workplace combined in one platform.
-
Frictionless experience Smooth and uninterrupted digital experience -
Seamless IT operations Proactive remediations and exceptional service
Core capabilities
Gartner Report 2026
[
\TeamViewer named a leader in DEX\
TeamViewer named a Leader in 2026 Gartner® Magic Quadrant™ DEX tools.](https://www.teamviewer.com/apac/resources/reports/gartner-magic-quadrant-2026/)Key integrations
-
Solutions
Popular use cases Most popular TeamViewer use cases
-
Remote access and support Manage people, devices, and applications – from anywhere. -
Digital employee experience (DEX) Proactively solve IT issues before they impact productivity.
Other use cases Popular solutions for further use cases
By need Popular solutions for different requirements
-
Freelancers and digital nomads Work securely from any location
-
Non-profit and education 30% discount on TeamViewer technology
By industries Popular solutions sorted by industry
Talk to our sales team
Need help choosing the right solution, placing and order, or upgrading your license?
-
-
Resources
Find out more about TeamViewer

 Sign In

-
Products
Personal use and SMB
TeamViewer Remote
Fast and secure remote access and IT support.
ENTERPRISES
TeamViewer Tensor
Platform solution built for scale, productivity, and security.
REAL-TIME TROUBLESHOOTING
TeamViewer DEX
Resolve issues before they affect users.
Connected worker
TeamViewer Frontline
Drive efficiency with industrial augumented reality
TeamViewer ONE
Get the full power of TeamViewer, unified in one platform.
KEY INTEGRATIONS
-
ONE Platform
TeamViewer ONE Platform
Proactively manage and optimize your digital workplace combined in one platform.
-
Frictionless experience
Smooth and uninterrupted digital experience -
Seamless IT operations
Proactive remediations and exceptional service -

Frictionless experience
Smooth and uninterrupted digital experience -

Seamless IT operations
Proactive remediations and exceptional service
Core capabilities
Gartner Report 2026
Key integrations
-
Solutions
Popular use cases

Remote access and support
Manage people, devices, and applications – from anywhere.
Digital employee experience (DEX)
Proactively solve IT issues before they impact productivity.Other use cases
By need
-
Freelancers and digital nomads
Work securely from any location -
Non-profit and education
30% discount on TeamViewer technology
By industries
Talk to our Sales Team
Need help choosing the right solution, placing and order, or upgrading your license?
-
Resources

License Assistant
Find the license that’s right for you.
Customer stories
Explore results achieved by TeamViewer customers. [
\
 Microsoft Intune
 ServiceNow
 Freshworks
 Jira
 Salesforce
 Slack
 Microsoft Teams


 Zendesk
-
Use cases
-
Industries
TeamViewer Frontline: See it, do it, done with AR
TeamViewer Frontline connects your workers to the information and procedures they need to do their jobs right. Augmented reality (AR) is the key to this.
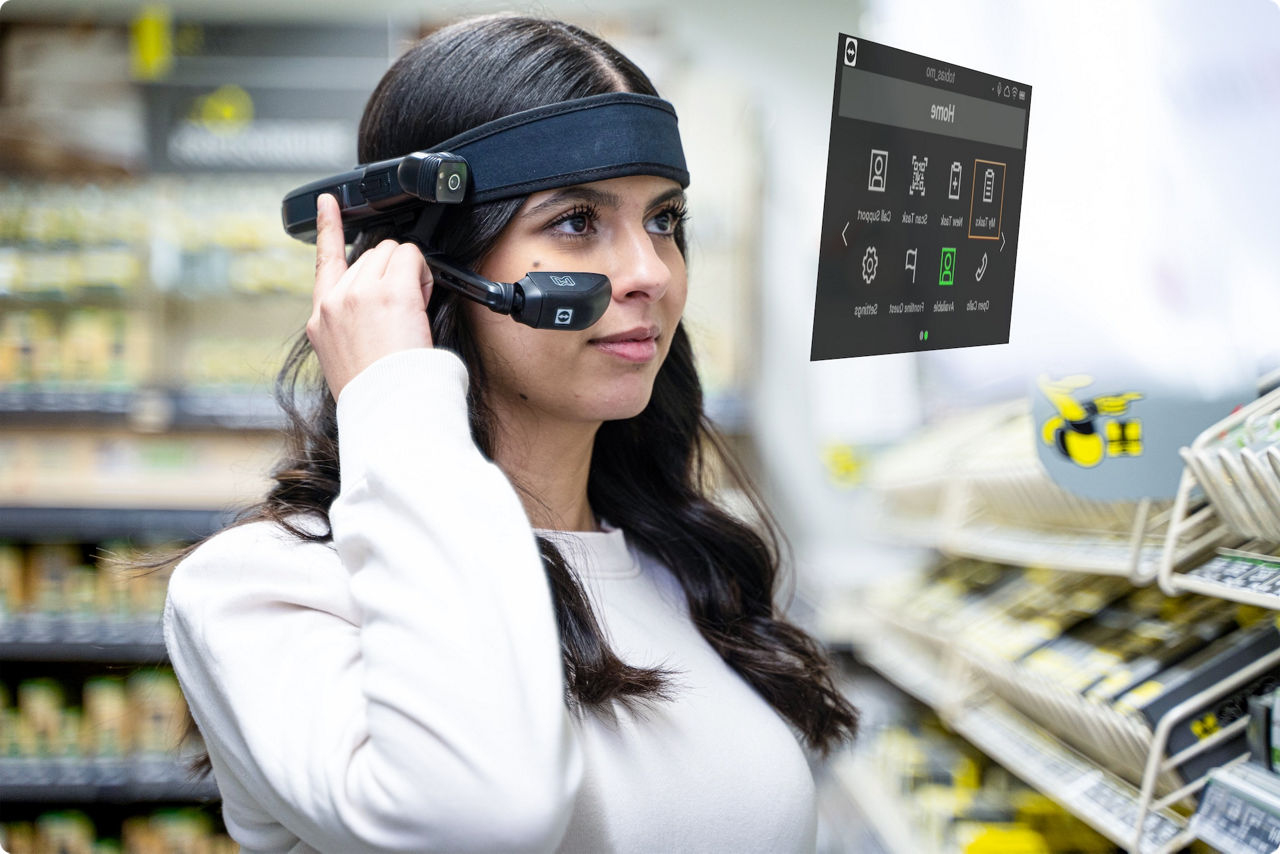

TeamViewer named a Visionary Leader in 2026 Frost Radar™
Frost & Sullivan recognized TeamViewer for its performance across the full frontline value chain.
No matter your use case, Frontline has the right solution for you
- Vision picking
- Assembly and production
- Inspection and maintenance
- Remote assistance
- Training and onboarding
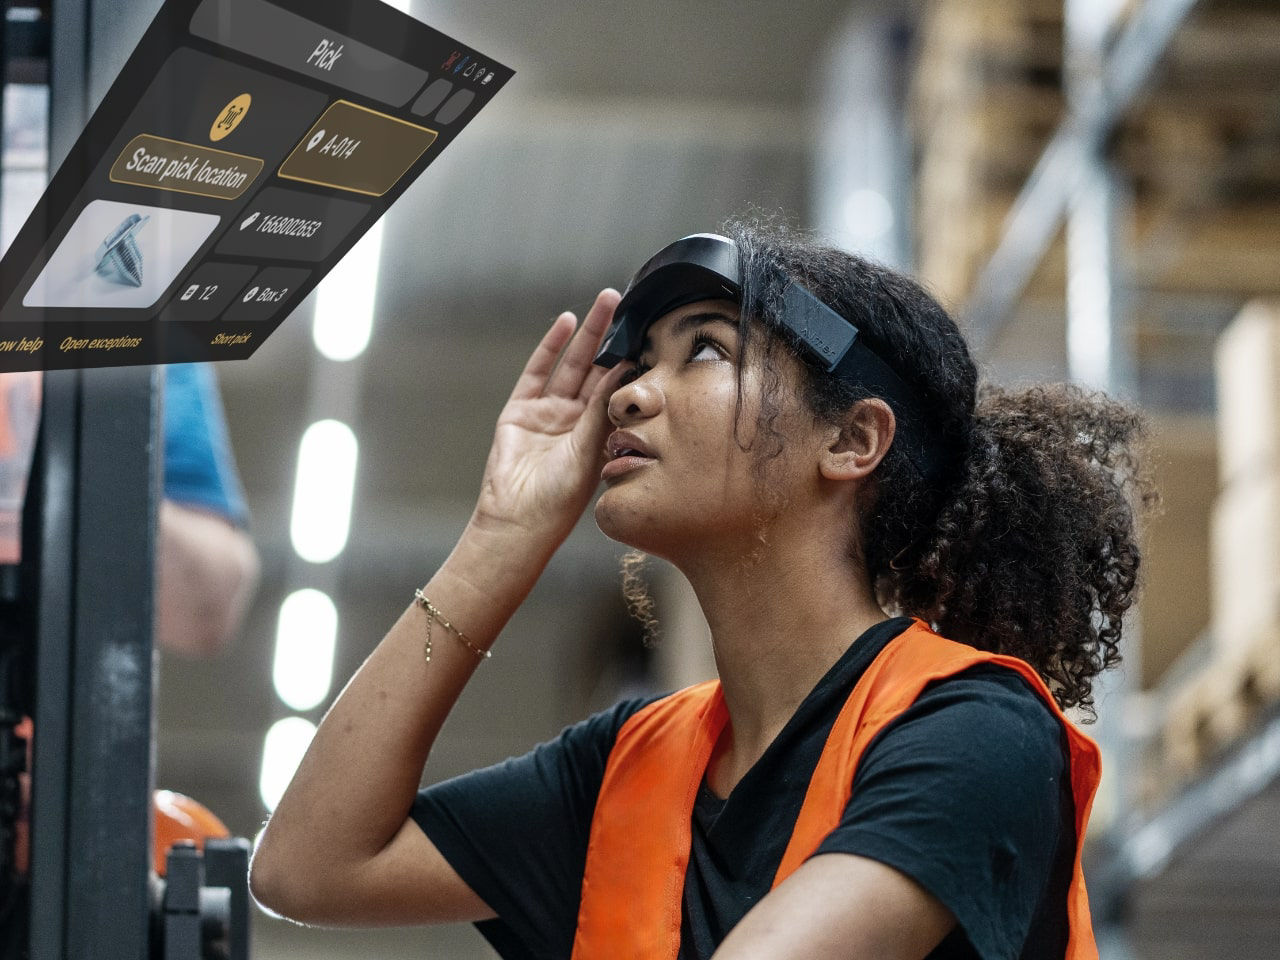
Vision picking
Frontline Pick optimizes core warehouse tasks like order picking, inventory, or sequencing. Visual information, audio cues, and integrated verification cut errors and speed up fulfillment. Frontline helps warehouse workers find and select items faster and more accurately. It guides them through all manual logistic processes step by step.

Assembly and production
Frontline Make simplifies assembly and manufacturing with AR. It provides workers with visual step-by-step instructions to help them assemble and build products. Manual tasks are completed faster and with better quality. Visual guidance also reduces the complexity of training and improves the overall work experience.
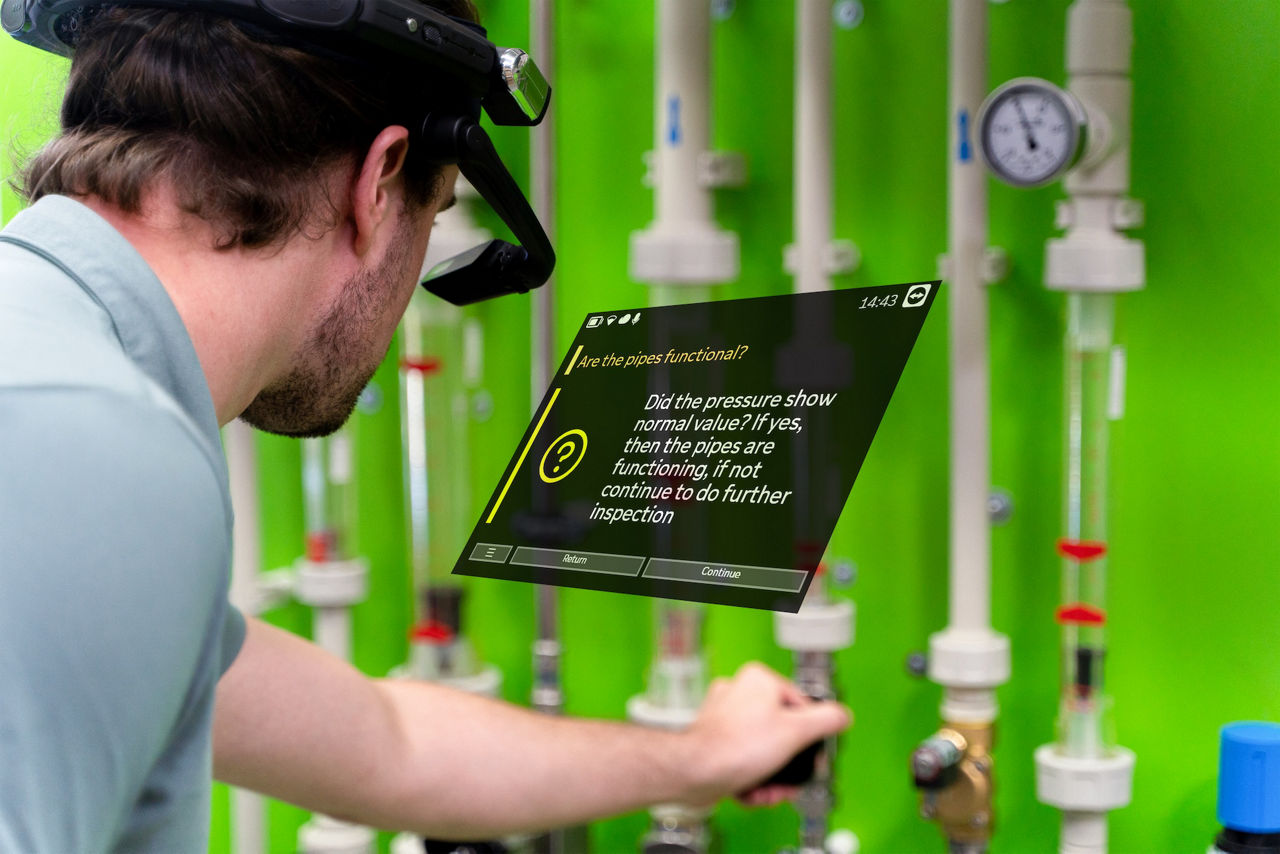
Inspection and maintenance
Frontline Inspect is ideal for maintenance and thorough inspections. Technicians are provided with detailed maintenance steps, checklists, and instructions. They can also document tasks on the job. All with a common mobile device, or hands-free with smart glasses.
The results are reduced downtime, increased precision, and improved overall equipment effectiveness (OEE).

Remote assistance
TeamViewer Frontline Assist provides instant remote assistance. Experts guide workers through complex issues remotely while seeing what they see. Live annotations and instructions take remote troubleshooting and diagnosis to a new level.
Frontline Assist can be standalone or integrated with other Frontline solutions. Either way, it will always cut delays and keep operations running.

Training and onboarding
Frontline Upskill provides an immersive training experience. It allows you to design, update, and deploy true-to-life training sessions using animated 3D models of machinery and equipment.
Highly visual, interactive training sessions make even the most complex procedures and equipment easy to understand, enabling a deeper understanding while keeping the cognitive load low.
These companies already trust in TeamViewer

Your industry—our solution
Automotive
Tailored solutions for your most pressing challenges across the value chain—for OEMs, dealers, and suppliers.
Aerospace
Unlock the power of AR technology for greater precision, higher productivity, and a more agile aviation business.
Food and beverage
Set new standards in F&B. Enhance training, speed up equipment maintenance, and improve logistics.
Retail
Move goods faster and serve customers better. Upgrade your retail operations with augmented reality.
Third-party logistics
Empower your operators to be more effective and efficient. Transform your order processing with vision picking.
Any industry, one solution
We’ve never met an industry we couldn't improve with TeamViewer Frontline. Contact us to discuss your specific use case.
TeamViewer Frontline fast facts
- All the enterprise AR solutions you need. Ready to use, intuitive, and easy to scale.
- Integrate Frontline into existing backend systems, such as PLM, WMS, ERP, and more.
- Use Frontline securely in the cloud or host it on-premises within your own IT infrastructure.
- Get started with TeamViewer Frontline in no trouble at all. Our experienced enterprise AR team will make the set-up process a quick and easy one.
- Our global partners, alliances, and system integrators are there to support you.
- Don’t get locked in. Frontline supports wearables and mobile devices from most leading manufacturers on the market.

Built for scalability. Designed for integration.
TeamViewer Frontline is a robust enterprise platform for developing, managing, and scaling industrial AR solutions.
- Streamline complex workflows with AR-guided task execution and real-time data capture
- Integrate seamlessly with existing IT systems via secure APIs and enterprise-ready architecture
- Support large-scale deployments with performance, reliability, and centralized control
Dig deeper into the platform’s architecture, integration capabilities, and technical advantages.
By your side, every step of the way

Consultation

Configuration

Integration

Deployment

Robust operation

Dedicated support
Ready to start your enterprise AR journey?
15% average increase in productivity at DHL Supply Chain
99.99% picking accuracy at Coca-Cola HBC
25% speed up of processes at GlobalFoundries
93% reduction in time spent for training at Nadro
Partnering with the best in the business



Transforming the AR game: Our impact on industry leaders
- DHL Supply Chain
- Coca-Cola HBC
- Samsung SDS
- Airbus

DHL Supply Chain increases order fulfillment operations productivity by 15%
-
Frontline cuts new hire training by 50-70%, ensuring they are productive from day one
-
Easily scalable Frontline solutions are now used by 1,500 employees at 25 sites daily in the US alone

Coca-Cola HBC reduces picking errors and reaches 99.99% accuracy
-
Frontline helps them tackle labor shortages by boosting productivity by up to 10%
-
In four years, Coca-Cola HBC expanded Frontline to 35 warehouses in 17 countries and more than 1,000 pickers

Samsung SDS increases picking speed by up to 30%
-
Frontline was rolled out in less than four weeks and saw a 20% efficiency increase
-
Workers appreciate the faster, 100% hands-free operation
-
Samsung also seamlessly integrated Frontline with its WMS

Airbus reaches 100% data reliability with Frontline
-
Frontline cuts manual entry errors to zero and gearboxes are inspected 40% faster
-
Airbus also reduces paper waste with digital inspections

PAC Innovation Radar
“TeamViewer has defended its outstanding market position”
TeamViewer Frontline remains the only Best-in-Class vendor in the PAC INNOVATION RADAR 2026.
Frequently asked questions
What are the key business benefits of adopting industrial augmented reality solutions?
Industrial AR solutions empower enterprises to gain a competitive edge and future-proof their operations. By overlaying digital information onto real-world environments, AR enhances productivity, streamlines remote collaboration, and reduces operational costs. It also improves workplace safety, elevates customer service, accelerates training and onboarding, simplifies knowledge sharing, and boosts employee satisfaction.
In which industrial use cases does augmented reality deliver the most value?
Industrial AR solutions excel in complex, human-centered industrial processes where efficiency, accuracy, and safety can be significantly improved. In intralogistics, AR vision picking streamlines tasks like order picking and sequencing, reducing errors. On factory floors, AR guides workers through complex assembly steps with visual instructions, enhancing quality. For inspections, AR speeds up issue identification and enables on-the-spot documentation. The See-What-I-See principle also supports remote troubleshooting, while immersive AR training accelerates onboarding and upskilling.
Is industrial AR suitable for my business processes?
If your processes are human-centered and part of the industrial value chain, the answer is simple: Yes! AR solutions are highly adaptable across industries and departments, helping to digitalize and streamline workflows. Explore the questions on this page to learn more about core use cases.
What essential features should I look for when choosing an industrial AR solution?
When selecting an industrial AR solution, it’s important to focus on key features that will deliver immediate value. Look for a central management tool that offers a single platform to manage devices, user accounts, and content, providing full visibility and control over operations. Self-service workflow tools are essential for empowering non-technical users to create and publish AR content quickly, reducing reliance on specialized skills and speeding up deployment.
Ensure the solution is device-agnostic, compatible with smartphones, tablets, and smart glasses, offering flexibility and minimizing hardware costs. A user-friendly interface will ensure quick adoption, allowing users to leverage AR technology with minimal training.
Finally, choose a trusted partner with a proven track record, bringing solutions built on years of experience and delivering tangible ROI.
Do I need in-house AR specialists to implement industrial AR solutions in my company?
Ideally, no programming skills should be required. Self-service workflow tools for AR wearables are designed to be simple, with drag-and-drop functionality that anyone can use to create workflows. For more complex needs, such as integrating with an existing backend system, a dedicated solution delivery team can support you throughout the process. They’ll assist with scoping use cases, training key users, configuring the solution to fit your needs, and rolling out the project at scale. This ensures smooth deployment and long-term success.
I do not really want to change my existing processes—can industrial AR add value to my business without changing existing processes?
The flexibility of industrial AR solutions is what makes them the perfect fit for supporting, not disrupting, your existing processes. With minimal changes, AR solutions add value by streamlining procedures. Highly configurable, they adapt seamlessly to your current systems. The ability to integrate with existing data is a key advantage, ensuring smooth integration into your business operations.
I believe my company will benefit significantly from AR technology, so where do I start?
Ready to harness the power of industrial AR? Starting your digitalization journey with a proven platform like TeamViewer Frontline ensures you get end-to-end service. Our dedicated AR experts will guide you from project scoping and rollout to installation and ongoing technical support. Let’s work together to empower your frontline workforce.
Have any questions? Get in touch.
Want to know where AR solutions can create the most value in your company? We are here to help.
Please choose your region
Selecting a region changes the language and/or content on teamviewer.com
SUGGESTED REGION
-
Americas
-
Asia Pacific
-
Commonwealth of Independent States
-
Europe
-
Middle East Africa
Change Region
-
Products
-
ONE Platform
-
Solutions
-
Partner
-
Resources
-
Support
-
Company
-
Additional Links
Cookie Consent
To improve your browsing experience on this website, TeamViewer and its partners would like to place cookies and similar technologies (“Cookies”) on your device. That enables us to analyze website usage and optimize our marketing efforts for the best possible user experience. By clicking “Accept Cookies” you agree to Cookie placement and respective use, as well as the subsequent processing of the collected data for the purposes of personalized advertising and marketing. Detailed information about the Cookies, the exact purposes, third-party recipients, Cookie lifetime, and more can be found in our Cookie Policy and Privacy Policy . You can always change your Cookie Settings to your own preference.
Imprint
https://www.teamviewer.com/en/address/
Cookies Settings
Only Necessary Cookies Accept All Cookies
Privacy Preference Center
When you visit our website, we ask you to store or retrieve information on your browser, mostly in the form of cookies. This information might be about you, your preferences or your device and is mostly used to make the website work as you expect it to. The information does not usually directly identify you, but it can give you a more personalized web experience. Because we value your right to privacy, you can choose to allow or not to allow some types of cookies on our website. Click on the different category headings to find out more and change the default settings. Please note, however, that blocking some types of cookies may negatively impact your experience of the site and the services we are able to offer. You will find more information on the cookies used by us in Annex 1 of our Cookie Policy.
Allow All
Manage Consent Preferences
Strictly Necessary Cookies
Always Active
These Cookies are essential in order to enable us to provide you with basic and security features of our website. Without these Cookies, certain services you have asked for cannot be provided, such as the use of areas of our website that are restricted to registered users (a Cookie, which identifies registered users to recognize them throughout the visit and upon return, e.g. within the login area of our Management Console) and webshop related services. They are usually only set in response to actions made by you which amount to a request for services, such as setting your privacy preferences, logging in or filling in forms. These Cookies are not implemented to gather information about you for other purposes such as marketing or analytics.
Cookies Details
Performance Cookies
Performance Cookies
These Cookies are used to collect information about the performance of our website and your visit and use of our website, for example, the number of visitors that used our website and the pages that are popular among our visitors. These Cookies do not collect information that directly identifies a visitor, although they may collect the IP address of the device used to access the site. Such information is used for the purpose of improving our website and the general user experience. Without the performance Cookies we will not be able to improve our website and its functionalities to provide you with the best surfing experience. If you do not allow these Cookies, your visit to our site will not be counted, which will negatively impact us when trying to improve our website.
Cookies Details
Functional Cookies
Functional Cookies
These Cookies allow TeamViewer’s website to remember your preferences, such as your username, language settings, and/or the region you are in. These Cookies help to provide enhanced, more personal features. They can also be used to remember changes you have made to text size, fonts and other parts of web pages that you can customize or provide services you have asked for such as watching a video, using the chat functionality or commenting on a blog. These Cookies do not track your browsing activity across other websites.
Cookies Details
Marketing and Targeting Cookies
Marketing and Targeting Cookies
These Cookies are used to deliver adverts more relevant to you and your interests. They are also used to limit the number of times you see an advertisement as well as help measure the effectiveness of our advertising campaigns. These Cookies collect several pieces of information about your browsing habits. They are usually placed by advertising networks with our permission. They remember that you have visited a website and this information is shared with other organizations, such as media publishers. These organizations do this in order to provide you with targeted adverts more relevant to you and your interests. This type of advertising is called online behavioral advertising. Furthermore, these Cookies allow us to analyze your website browsing behavior and thus allows us to customize our product marketing approach, e.g. help us decide on whether, when, and how to inform or get in touch with you based on your interests.
Cookies Details
Back Button
Cookie List
Search Icon
Filter Icon
Clear
- checkbox label label
Apply Cancel
Consent Leg.Interest
checkbox label label
checkbox label label
checkbox label label
Confirm My Choices
-
Use cases
-
Add-ons

TeamViewer Tensor
Enterprise remote connectivity
Secure by design. Integrated with your world. Flexible for whatever comes next.


TeamViewer named a Leader by Gartner®
TeamViewer is a Leader in the 2026 Gartner Magic Quadrant™ for DEX Management Tools.
What is TeamViewer Tensor
TeamViewer Tensor is enterprise remote connectivity. It provides secure remote access, support, and device management—from traditional IT endpoints to mobile, point‑of‑sale, and operational technology—at global scale.
TeamViewer Tensor delivers fast, reliable remote access with enterprise‑grade security, scalable from thousands to hundreds of thousands of devices. With Tensor, your IT teams can remotely troubleshoot distributed devices, servers, and industrial equipment, resulting in reduced downtime and improved productivity.
Tensor seamlessly integrates with leading enterprise applications, enabling unified remote support and device management across your entire environment.
Secure
Integrated
Flexible
-
- Robust enterprise security: Delivers zero trust access, granular permissions, and enterprise grade controls to keep every remote session secure.
- Full compliance: Provides complete audit trails and session logs allowing teams to track every action and maintain compliance with confidence.
-
- Seamless integrations: Connects smoothly with your IT stack—including identity, service management, and monitoring tools—to streamline and automate workflows.
- Al where it matters: TeamViewer AI helps IT teams diagnose issues faster, execute remediations with human oversight, automate documentation, and resolve problems more efficiently.
-
- Built for IT and OT remote support: Enables secure, reliable remote support across both IT systems and OT environments, from offices to construction sites.
- Cross-platform compatibility: Deployable at scale across any OS, on any device and any platform. Includes mobile and point of sale devices for flexibility, ease of use, and complete control across any environment.



Enterprise integrations
Control every connection. Support any device. Resolve issues faster.
- SSO
- Conditional access
- Auditability
- Agentless access
- Mobile device support
- Multitenancy
Streamlined, secure access through enterprise-grade single sign-on (SSO).
Conditional access for precise, rule-driven access controls to protect critical systems.
Full auditability for comprehensive compliance and accountability.
Agentless access with zero-installation remote connectivity for faster, frictionless support.
Advanced mobile device support to assist users anywhere, on any device.
Controlled isolation and consolidated oversight across multiple subsidiaries, departments, or clients with multitenancy.

TeamViewer AI
Boost productivity and automate IT support
Tensor brings AI-powered troubleshooting and documentation to enterprise IT support, helping teams resolve issues faster, automate documentation, and preserve valuable knowledge. TeamViewer AI integrates with leading ITSM tools to support existing workflows.
Tensor use cases
Organizations are leveraging the power of remote connectivity to provide staff the support they need to stay on top of their work. Unlock the power and potential of remote connectivity in your organization today.
-
[
\Remote IT support: Solve complex technical issues with ease\
TeamViewer Tensor empowers IT teams with fast, secure, and flexible remote support. Whether it’s ad‑hoc assistance for employees who need help on the spot or fully unattended access to devices anytime, anywhere, Tensor reduces downtime and MTTR to keep your operations up and running without disruption.](https://www.teamviewer.com/en/products/tensor/use-cases/remote-it-support/) -
[
\Remote work: The most agile and secure remote work solution for enterprises\
Businesses need employees to be productive wherever they work—in the office, on the factory floor, at home, or on the move. Secure and scalable, Tensor helps enterprises empower their employees to do great work in any environment.](https://www.teamviewer.com/en/products/tensor/use-cases/hybrid-work-enablement/) -
[
\OT: Take control of your shop floor with secure, scalable, unified remote access\
Replace your shop floor’s unmanaged and homegrown remote access tools with unified and standardized remote access across every endpoint in your corporate IT and manufacturing environments. Minimize security risks and ensure regulatory compliance with Tensor for OT.](https://www.teamviewer.com/en/products/tensor/use-cases/operational-technology-support/)


Enterprise-grade security
-
SSO and MFA
Single sign-on simplifies secure access by enabling users to sign in with their corporate credentials. Two-factor authentication adds a second verification step to prevent unauthorized access. These safeguards enable IT to centrally manage access and strengthen security without disrupting employee workflows.
-
End‑to‑end encryption
Enterprise‑grade encryption using RSA‑4096 for key exchange and AES‑256 for session data. Newer versions introduce mutually authenticated TLS 1.3, Perfect Forward Secrecy (PFS), and private keys that never leave the device. This way, only connected endpoints can decrypt session traffic.
-
Conditional access
Conditional access controls remote access based on risk and context, such as identity, device trust, scheduled hours, and authentication, allowing connections only when strict requirements are met.
-
BYOC
Bring Your Own Certificate lets organizations secure remote connections using their own trusted TLS certificates, enabling full control over encryption trust chains.
-
Security Center
Centralized visibility and control enables real‑time monitoring, policy enforcement, and risk detection, helping organizations identify threats, maintain compliance, and strengthen security.
-
Windows LAPS integration
Privileged access controls enable secure, just‑in‑time use of Windows Local Administrator Password Solution (LAPS) for remote connections, reducing credential risk and enhancing support.
Visit the **Trust Center ** to learn how TeamViewer leads the industry in security, privacy, user protection, and misuse prevention.
TeamViewer recognized as a G2 Summer 2026 Leader
Customer successes
TeamViewer is trusted daily by businesses of all sizes. Our remote connectivity provides secure support experiences at scale.
- Specsavers
- RTL Studios
- Pihlajalinna
- Bühler
[
\

Eyewear giant Specsavers leverages TeamViewer for the secure remote support of its 2,300 stores worldwide.](https://www.teamviewer.com/en/success-stories/specsavers/)
[
\

RTL Studios meets the increased demands on production processes with TeamViewer Tensor.](https://www.teamviewer.com/en/success-stories/rtl-studios/)
[
\

Pihlajalinna Oyj maximizes productivity in healthcare IT support.](https://www.teamviewer.com/en/success-stories/pihlajalinna/)
[
\
Bühler relies on digital support processes with TeamViewer Tensor to support its plants and customers.](https://www.teamviewer.com/en/success-stories/buehler/)
Customer stories
TeamViewer is trusted daily by businesses of all sizes. Our remote connectivity provides secure support experiences at scale.
-
[
\M3 Solutions powers healthcare connections with TeamViewer Tensor averaging approximately 25,000 connections per month.](https://www.teamviewer.com/en/success-stories/m3-solutions/)
-
[
\Bakkafrost accelerates NIS2 compliance with TeamViewer Tensor.](https://www.teamviewer.com/en/success-stories/bakkafrost/)
-
[
\Leading payment system provider secures centralized management and remote support for over 4,000 connected devices.](https://www.teamviewer.com/en/success-stories/cielo/)



Frequently asked questions
What security and compliance standards does TeamViewer Tensor support for enterprise deployments?
TeamViewer Tensor is built on enterprise grade security and global compliance frameworks, including:
- ISO/IEC 27001 certification for information security management
- SOC 2 and SOC 3 compliance, ensuring adherence to strict trust principles such as security, availability, and confidentiality
- HIPAA compliance for protecting sensitive health data in regulated industries
- End-to-end encryption (RSA 4096 / AES 256) and brute force protection to safeguard every session
- Bring Your Own Certificate (BYOC) for additional authentication control within enterprise networks
Together, these capabilities ensure Tensor meets the security and auditability requirements expected by CISOs and compliance teams.
How does TeamViewer Tensor enable scalable remote access and support across large, distributed environments?
TeamViewer Tensor scales enterprise support by being device agnostic, enterprise integrated, and optimized for OT and agentless scenarios:
- It is a cloud-based solution covering PCs, mobile, embedded devices, OT machinery, and headless systems, ensuring uniform access across all device types.
- Tensor integrates natively with enterprise ecosystems like ServiceNow, Salesforce, Microsoft Teams, and Intune, allowing support actions directly within existing IT operations workflows.
- It supports OT environments with secure connectivity to PLCs, HMIs, legacy and segmented industrial systems, extending remote operations beyond traditional IT.
- Agentless access enables remote maintenance of industrial systems without installing software, simplifying support for constrained or closed devices.
- Tensor delivers linear scalability, handling hundreds of thousands of devices and heavy remote session volumes across globally distributed environments.
Can TeamViewer Tensor integrate with existing IAM solutions like Microsoft Entra ID, Okta, or other SSO providers?
Yes. Tensor provides broad SSO/IAM compatibility, including:
- SAML 2.0 based single sign-on with identity providers such as Microsoft Entra ID, Okta, OneLogin, ADFS, Google Workspace, and others
- SCIM based automated user provisioning and deprovisioning for centralized identity lifecycle management
- Full Okta SSO integration, including domain verification and attribute mapping controls
This ensures strong access governance and alignment with enterprise IAM policies.
How does zero trust access control work within TeamViewer Tensor?
Tensor incorporates zero trust principles through its advanced access control engine:
- Conditional access defines granular, rule-based permissions for users, groups, and devices, controlling incoming and outgoing connections, file transfers, script execution, and more.
- Time-based and expiration-based rules restrict session windows—ideal for contractors, temporary staff, or project-based access.
- A dedicated conditional access router enforces centralized, policy driven security across enterprise networks.
- Zero trust protection extends into OT environments with segmented network controls, protocol isolation, and full audit logging.
- The Windows LAPS integration enables organizations to securely manage privileged access during remote sessions, reducing errors, improving compliance, and providing just-in-time privilege escalation for authorized system-level support.
TeamViewer Tensor ensures only the right people access the right systems at the right time, with every session verified and never presumed safe.
Looking for a solution that feels just right?
Get in touch with our team and learn more about how TeamViewer Tensor is engineered for enterprises.
Please choose your region
Selecting a region changes the language and/or content on teamviewer.com
SUGGESTED REGION
-
Americas
-
Asia Pacific
-
Commonwealth of Independent States
-
Europe
-
Middle East Africa
Change Region
-
Products
-
ONE Platform
-
Solutions
-
Partner
-
Resources
-
Support
-
Company
-
Additional Links
Cookie Consent
To improve your browsing experience on this website, TeamViewer and its partners would like to place cookies and similar technologies (“Cookies”) on your device. That enables us to analyze website usage and optimize our marketing efforts for the best possible user experience. By clicking “Accept Cookies” you agree to Cookie placement and respective use, as well as the subsequent processing of the collected data for the purposes of personalized advertising and marketing. Detailed information about the Cookies, the exact purposes, third-party recipients, Cookie lifetime, and more can be found in our Cookie Policy and Privacy Policy . You can always change your Cookie Settings to your own preference.
Imprint
https://www.teamviewer.com/en/address/
Cookies Settings
Only Necessary Cookies Accept All Cookies
Privacy Preference Center
When you visit our website, we ask you to store or retrieve information on your browser, mostly in the form of cookies. This information might be about you, your preferences or your device and is mostly used to make the website work as you expect it to. The information does not usually directly identify you, but it can give you a more personalized web experience. Because we value your right to privacy, you can choose to allow or not to allow some types of cookies on our website. Click on the different category headings to find out more and change the default settings. Please note, however, that blocking some types of cookies may negatively impact your experience of the site and the services we are able to offer. You will find more information on the cookies used by us in Annex 1 of our Cookie Policy.
Allow All
Manage Consent Preferences
Strictly Necessary Cookies
Always Active
These Cookies are essential in order to enable us to provide you with basic and security features of our website. Without these Cookies, certain services you have asked for cannot be provided, such as the use of areas of our website that are restricted to registered users (a Cookie, which identifies registered users to recognize them throughout the visit and upon return, e.g. within the login area of our Management Console) and webshop related services. They are usually only set in response to actions made by you which amount to a request for services, such as setting your privacy preferences, logging in or filling in forms. These Cookies are not implemented to gather information about you for other purposes such as marketing or analytics.
Cookies Details
Performance Cookies
Performance Cookies
These Cookies are used to collect information about the performance of our website and your visit and use of our website, for example, the number of visitors that used our website and the pages that are popular among our visitors. These Cookies do not collect information that directly identifies a visitor, although they may collect the IP address of the device used to access the site. Such information is used for the purpose of improving our website and the general user experience. Without the performance Cookies we will not be able to improve our website and its functionalities to provide you with the best surfing experience. If you do not allow these Cookies, your visit to our site will not be counted, which will negatively impact us when trying to improve our website.
Cookies Details
Functional Cookies
Functional Cookies
These Cookies allow TeamViewer’s website to remember your preferences, such as your username, language settings, and/or the region you are in. These Cookies help to provide enhanced, more personal features. They can also be used to remember changes you have made to text size, fonts and other parts of web pages that you can customize or provide services you have asked for such as watching a video, using the chat functionality or commenting on a blog. These Cookies do not track your browsing activity across other websites.
Cookies Details
Marketing and Targeting Cookies
Marketing and Targeting Cookies
These Cookies are used to deliver adverts more relevant to you and your interests. They are also used to limit the number of times you see an advertisement as well as help measure the effectiveness of our advertising campaigns. These Cookies collect several pieces of information about your browsing habits. They are usually placed by advertising networks with our permission. They remember that you have visited a website and this information is shared with other organizations, such as media publishers. These organizations do this in order to provide you with targeted adverts more relevant to you and your interests. This type of advertising is called online behavioral advertising. Furthermore, these Cookies allow us to analyze your website browsing behavior and thus allows us to customize our product marketing approach, e.g. help us decide on whether, when, and how to inform or get in touch with you based on your interests.
Cookies Details
Back Button
Cookie List
Search Icon
Filter Icon
Clear
- checkbox label label
Apply Cancel
Consent Leg.Interest
checkbox label label
checkbox label label
checkbox label label
Confirm My Choices
Prompts
Click prompts to add them under the company line, click again to take one out, then copy the result into your AI chat. Shared by Asian Century Stocks and Uncovered Thai Stocks. Thank you.
ETFs Holding TeamViewer SE
Exchange-traded funds whose newest published daily portfolio holds one of the company's listings, largest weight first.
| ETF | Weight in ETF | Shares | Market value | As of |
|---|---|---|---|---|
| AVDS | 0.04% | 24,967 | $ 130.236K | Nov 16, 2026 |
| DXIV | 0.01% | 5,699 | $ 30.474K | Nov 12, 2026 |
| AVDE | 0.01% | 252,642 | $ 1.318M | Nov 16, 2026 |
| AVSD | 0.01% | 3,705 | $ 19.326K | Nov 16, 2026 |
| DFIS | 0.01% | 76,552 | $ 409.348K | Nov 12, 2026 |
| DFSI | 0.01% | 14,643 | $ 78.301K | Nov 12, 2026 |
| DFIC | 0.00% | 120,613 | $ 644.956K | Nov 12, 2026 |
| DFAI | 0.00% | 94,686 | $ 506.316K | Nov 12, 2026 |
| DFAX | 0.00% | 6,242 | $ 33.378K | Nov 12, 2026 |