|
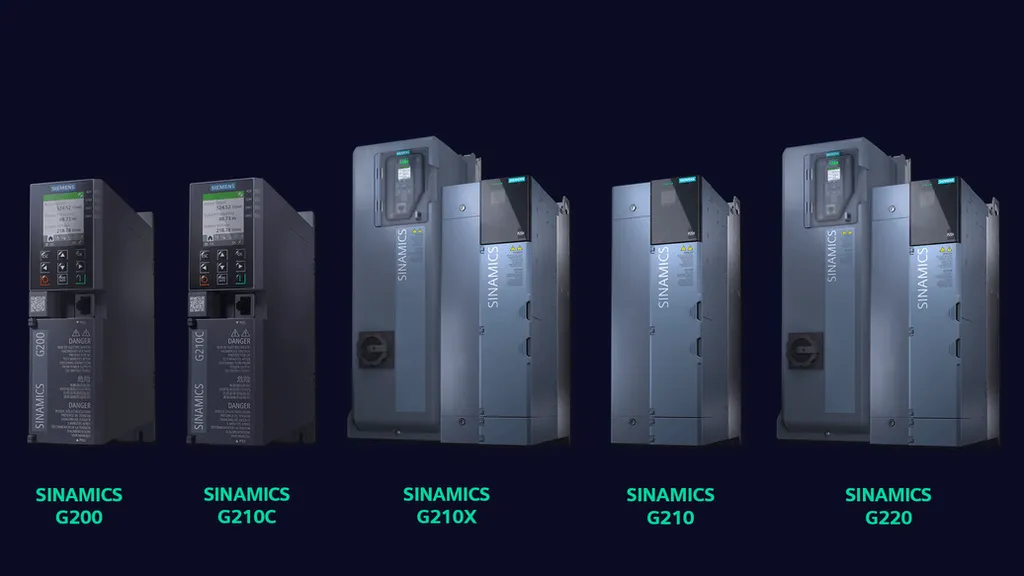
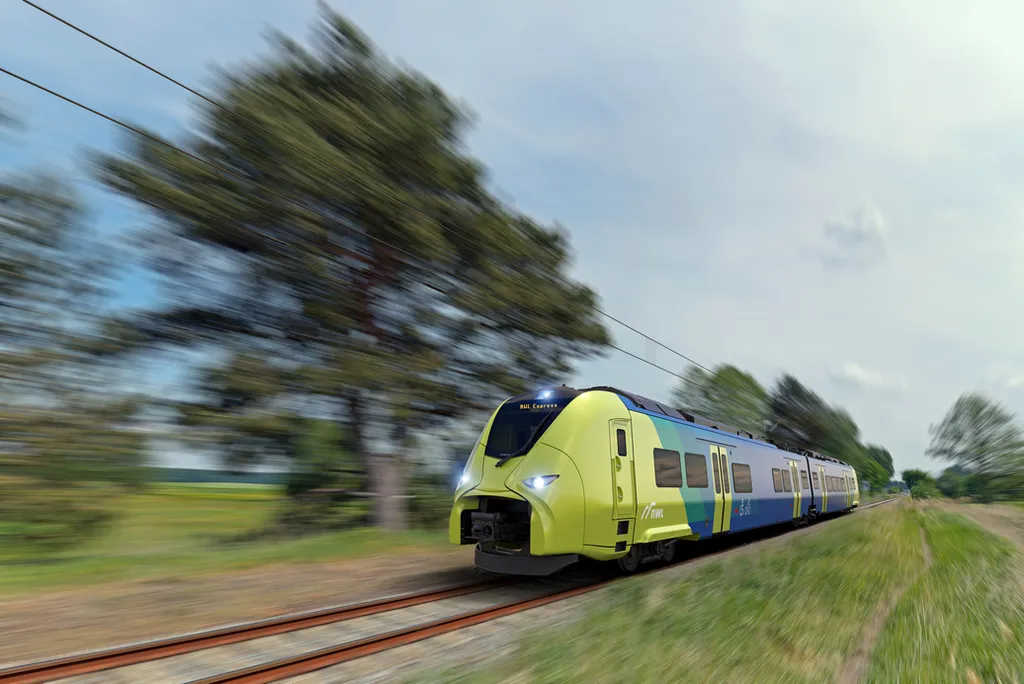
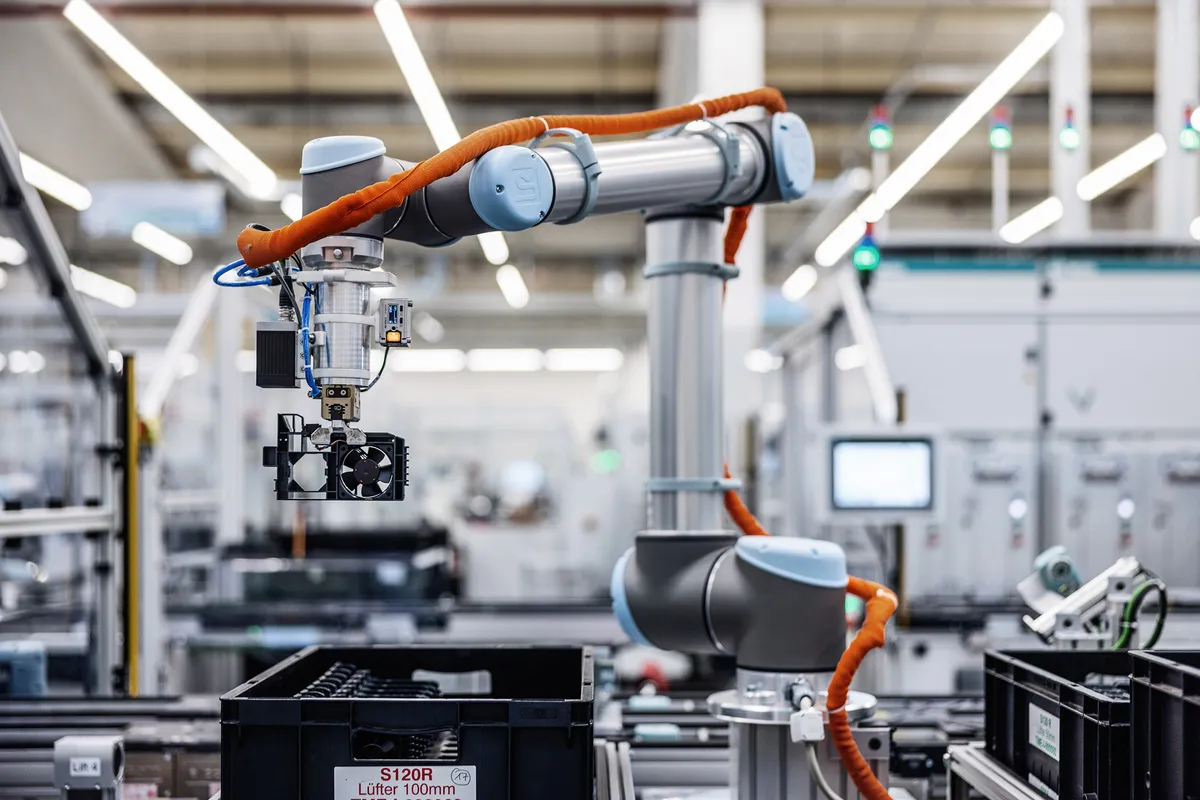
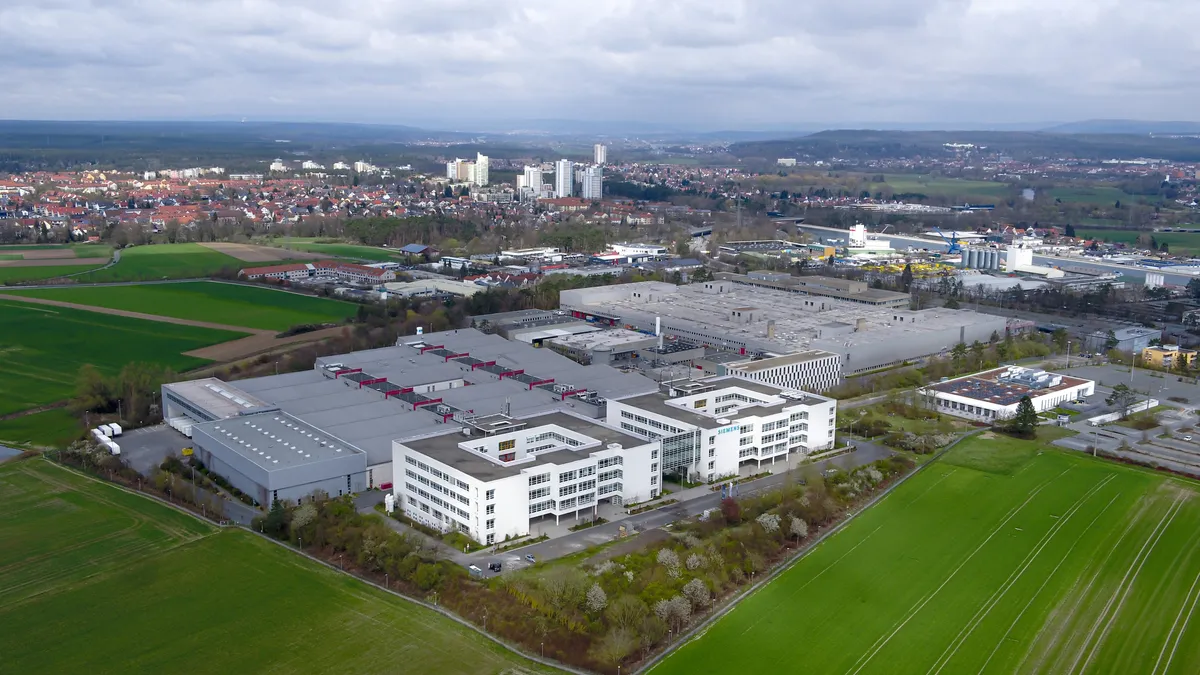
Siemens Aktiengesellschaft is a technology company that provides digitalization, automation, electrification, and software solutions for industrial, infrastructure, and transportation sectors. The company operates through four main business segments: Digital Industries, which offers software and hardware for smart manufacturing and product engineering; Smart Infrastructure, which supplies technologies for buildings, data centers, and energy systems; Mobility, which develops rail transportation systems and electrification solutions; and Siemens Healthineers, which provides medical imaging and diagnostic equipment. Key products and services include the Siemens Xcelerator platform, industrial automation systems, power generation and grid technologies, and high-speed rail trains. The company serves customers in Europe, the Americas, Asia-Pacific, and the Middle East & Africa. Founded in 1847, Siemens collaborates with a global partner ecosystem to support digital and sustainable transformation across industries such as automotive, chemicals, life sciences, and energy. Summarised from the company's own disclosures, fiscal year ended Oct 2026 |
Industry Conglomerates | Homepage siemens.com |
| Sector Industrials | IR page siemens.com/en-us/company/investor-relations | |
|
Tags
industrial automation, digitalization, electrification, rail transportation, medical imaging, smart infrastructure, power generation, software solutions, manufacturing technology, energy systems, Siemens Xcelerator, Siemens Healthineers, Digital Industries, Mobility
|
Press page — |
Metrics
| Valuation | |
|---|---|
| Market cap | € 212.52B |
| Market cap (USD) | $ 234.877B |
| P/E | 21.69 |
| PEG | 0.58 |
| P/BV | 2.83 |
| P/S | 2.69 |
| P/OCF | 16.03 |
| P/FCF | — |
| Dividend yield | — |
| Turnover / mcap | — |
| Returns | |
|---|---|
| ROE | 15.4% |
| ROI | 14.1% |
| ROIC | 14.1% |
| Profit margin | 12.2% |
| Growth | |
|---|---|
| Revenue growing | Yes |
| Profits growing | Yes |
| Revenue up 3y | Yes |
| Revenue up 5y | Yes |
| Earnings growth 3y (net profit CAGR) | 37.2% |
| Quality | |
|---|---|
| Profitable | Yes |
| Margin expanding | Yes |
| Buying back stock | No |
| Diluting (TTM) | No |
| Debt/Equity | — |
| Podcast bulls (TTM) | Sign up |
| Podcast bears (TTM) | Sign up |
| Podcast sentiment (TTM) | Sign up |
| Podcast sentiment % (TTM) | Sign up |
| News sentiment (TTM) | 0 |
| Quality score | 58.8% |
| Insiders | |
|---|---|
| Buys, 1w | Sign up |
| Buys, 1m | Sign up |
| Buys, 1y | Sign up |
| Sells, 1w | Sign up |
| Sells, 1m | Sign up |
| Sells, 1y | Sign up |
Sign up to see this company's insider trades
| Figure | FY 2025 | FY 2024 | FY 2023 | FY 2022 | FY 2021 | FY 2020 | FY 2019 | FY 2016 | FY 2015 | FY 2014 | FY 2013 | FY 2012 | FY 2011 | FY 2010 | FY 2009 | FY 2008 |
|---|---|---|---|---|---|---|---|---|---|---|---|---|---|---|---|---|
| Revenue | 78.914B | 75.93B | 74.882B | 71.977B | 62.265B | 57.139B | 58.483B | 79.644B | 75.636B | 71.227B | 73.445B | 77.395B | 73.275B | 68.978B | — | — |
| Net profit | 9.62B | 8.301B | 7.949B | 3.723B | 6.161B | 4.03B | 5.174B | 5.45B | 7.282B | 5.373B | 4.284B | 4.151B | 6.145B | 3.899B | — | — |
Sign up to see institutional holdings
Sign UpPodcast Mentions
Sign up to see podcast mentions and sentiment
Sign UpAd-hoc releases, corporate news and financial reports published through EQS, newest first, titles as published, directors' dealings, voting-rights notifications and buy-back reports included. The link opens the release. Press releases from the company's own website, newest first.




Prompts
Click prompts to add them under the company line, click again to take one out, then copy the result into your AI chat. Shared by Asian Century Stocks and Uncovered Thai Stocks. Thank you.
ETFs Holding Siemens Aktiengesellschaft
Exchange-traded funds whose newest published daily portfolio holds one of the company's listings, largest weight first.
| ETF | Weight in ETF | Shares | Market value | As of |
|---|---|---|---|---|
| MTRA | 4.20% | 17,919 | $ 5.858M | Jul 31, 2026 |
| MOTO | 3.47% | 1,050 | $ 337.304K | Jun 30, 2026 |
| FBOT | 3.33% | 21,919 | $ 7.271M | Aug 31, 2026 |
| SUPP | 3.19% | 1,169 | $ 381.021K | Jul 31, 2026 |
| DTAN | 3.09% | 2,262 | $ 671.746K | Nov 17, 2026 |
| TXUE | 2.87% | 48,355 | $ 16.042M | Aug 31, 2026 |
| THMZ | 2.37% | 3,981 | $ 1.28M | Jun 30, 2026 |
| JDVI | 2.15% | 47,531 | $ 15.278M | Jun 30, 2026 |
| QUIZ | 1.71% | 4,798 | $ 1.592M | Aug 31, 2026 |
| FENI | 1.61% | 514,610 | $ 165.314M | Jun 30, 2026 |
| FFDI | 1.47% | 875 | $ 285.196K | Jul 31, 2026 |
| CGGO | 1.46% | 568,931 | $ 170.506M | Nov 16, 2026 |
| TOUS | 1.40% | 67,401 | $ 22.084M | Jul 31, 2026 |
| CGIE | 1.31% | 106,669 | $ 31.968M | Nov 16, 2026 |
| THOR | 1.17% | 833 | $ 276.338K | Aug 31, 2026 |
| NTSI | 1.09% | 16,805 | $ 5.402M | Jun 30, 2026 |
| CGIC | 0.94% | 80,041 | $ 23.988M | Nov 16, 2026 |
| DWMF | 0.88% | 931 | $ 299.26K | Jun 30, 2026 |
| TIER | 0.83% | 887 | $ 290.622K | Jul 31, 2026 |
| SROI | 0.80% | 462 | $ 150.583K | Jul 31, 2026 |
| INCM | 0.78% | 39,416 | $ 12.662M | Jun 30, 2026 |
| RGEF | 0.77% | 19,763 | $ 5.928M | Nov 17, 2026 |
| RINT | 0.66% | 2,878 | $ 924.534K | Jun 30, 2026 |
| DFAI | 0.57% | 335,478 | $ 104.583M | Nov 12, 2026 |
| FFGX | 0.57% | 946 | $ 308.337K | Jul 31, 2026 |
| DFSI | 0.50% | 18,933 | $ 5.902M | Nov 12, 2026 |
| CGGE | 0.46% | 50,287 | $ 15.071M | Nov 16, 2026 |
| RAAX | 0.41% | 17,635 | $ 5.483M | Sep 30, 2026 |
| DFIC | 0.27% | 131,964 | $ 41.139M | Nov 12, 2026 |
| RGLO | 0.25% | 2,664 | $ 855.789K | Jun 30, 2026 |
| GEW | 0.22% | 951 | $ 315.483K | Aug 31, 2026 |
| NBIE | 0.21% | 1,574 | $ 522.156K | Aug 31, 2026 |
| AVDE | 0.18% | 118,813 | $ 35.303M | Nov 16, 2026 |
| AVSD | 0.18% | 2,263 | $ 672.406K | Nov 16, 2026 |
| IQSZ | 0.16% | 873 | $ 285.391K | Jul 31, 2026 |
| DFAX | 0.16% | 63,089 | $ 19.668M | Nov 12, 2026 |