RWE Aktiengesellschaft: Release of a capital market information
Bull 1
Bear 0
Routine
|
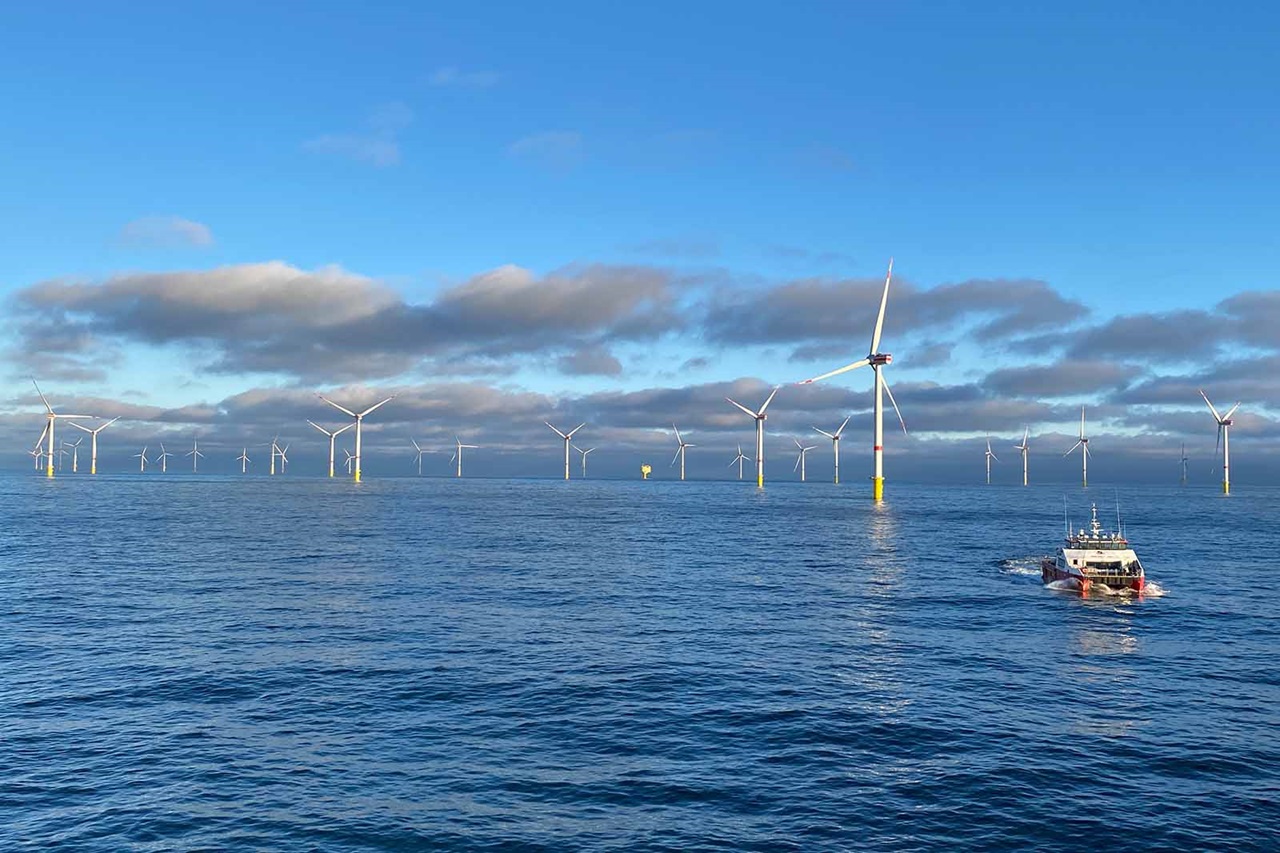
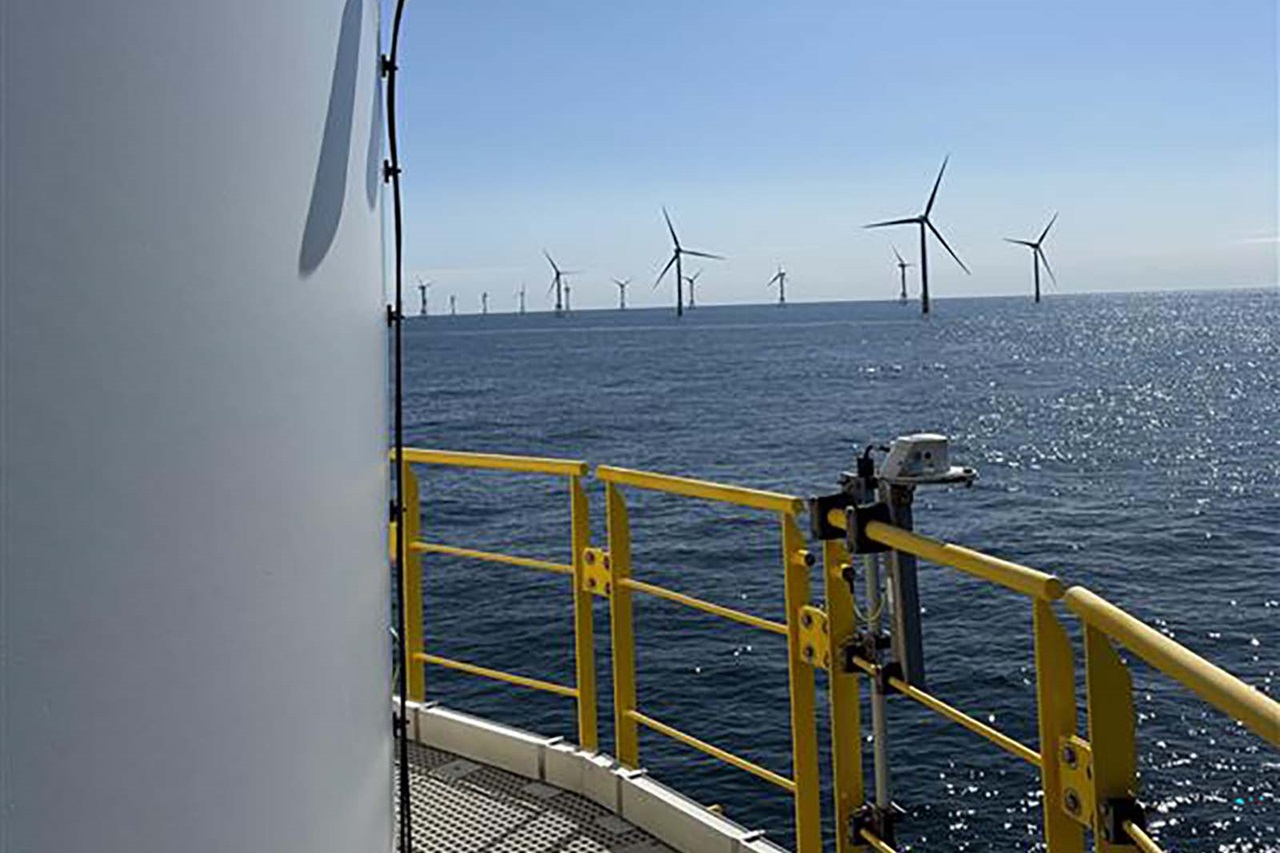
RWE Aktiengesellschaft is an international energy company focused on the generation, storage, and supply of electricity. The company operates across four main business segments: renewable energy, conventional energy, energy trading, and research and development. Its renewable portfolio includes onshore and offshore wind farms, solar power plants, and battery storage facilities, while its conventional segment comprises gas-fired power plants and biomass generation. RWE serves customers in Europe, the Americas, and Asia-Pacific, with significant operations in Germany, the United Kingdom, the United States, Australia, and Spain. The company engages in energy trading through its RWE Supply & Trading division, which operates globally in commodity markets. Notable partnerships include collaborations with HELLENiQ Energy in Greece for solar and offshore wind projects. RWE is transitioning its business model to achieve climate neutrality by 2040, with a strategic focus on expanding renewable capacity and hydrogen technologies. Summarised from the company's own disclosures, fiscal year ended Oct 2026 |
Industry Utilities - Independent Power Producers | Homepage rwe.com |
| Sector Utilities | IR page rwe.com/investor-relations | |
|
Tags
renewable energy, offshore wind, onshore wind, solar power, battery storage, energy trading, gas-fired power, hydrogen, electricity generation, energy transition, RWE Offshore Wind GmbH, RWE Supply & Trading, HELLENiQ Energy
|
Press page — |
Metrics
| Valuation | |
|---|---|
| Market cap | € 42.784B |
| Market cap (USD) | $ 47.606B |
| P/E | 60.57 |
| PEG | 12.51 |
| P/BV | — |
| P/S | 2.43 |
| P/OCF | 8.64 |
| P/FCF | — |
| Dividend yield | — |
| Turnover / mcap | — |
| Returns | |
|---|---|
| ROE | — |
| ROI | 15.9% |
| ROIC | 15.9% |
| Profit margin | 17.8% |
| Growth | |
|---|---|
| Revenue growing | No |
| Profits growing | No |
| Revenue up 3y | No |
| Revenue up 5y | No |
| Earnings growth 3y (net profit CAGR) | 4.8% |
| Quality | |
|---|---|
| Profitable | Yes |
| Margin expanding | No |
| Buying back stock | No |
| Diluting (TTM) | No |
| Debt/Equity | — |
| Podcast bulls (TTM) | Sign up |
| Podcast bears (TTM) | Sign up |
| Podcast sentiment (TTM) | Sign up |
| Podcast sentiment % (TTM) | Sign up |
| News sentiment (TTM) | 0 |
| Quality score | 0% |
| Insiders | |
|---|---|
| Buys, 1w | Sign up |
| Buys, 1m | Sign up |
| Buys, 1y | Sign up |
| Sells, 1w | Sign up |
| Sells, 1m | Sign up |
| Sells, 1y | Sign up |
Sign up to see this company's insider trades
| Figure | FY 2025 | FY 2024 | FY 2023 | FY 2022 | FY 2021 | FY 2020 | FY 2019 | FY 2018 | FY 2017 | FY 2016 | FY 2015 | FY 2014 | FY 2013 | FY 2012 | FY 2011 | FY 2010 | FY 2009 |
|---|---|---|---|---|---|---|---|---|---|---|---|---|---|---|---|---|---|
| Revenue | 17.628B | 24.224B | 28.566B | 38.366B | 24.526B | 13.688B | 13.125B | 13.388B | 42.434B | 43.59B | 46.357B | 46.149B | 51.393B | 50.771B | 49.153B | 50.722B | 46.191B |
| Net profit | 3.131B | 5.135B | 1.45B | 2.717B | 721M | 995M | 8.498B | 335M | 1.9B | -5.71B | -170M | 1.704B | -2.757B | 1.306B | 1.806B | 3.308B | 3.571B |
| Figure | FY 2025 | FY 2024 | FY 2023 | FY 2022 | FY 2021 | FY 2020 | FY 2019 | FY 2018 | FY 2017 | FY 2016 | FY 2015 | FY 2014 | FY 2013 | FY 2012 | FY 2011 | FY 2010 | FY 2009 |
|---|---|---|---|---|---|---|---|---|---|---|---|---|---|---|---|---|---|
| Share price | 46.86 | 41.17 | 42.75 | 43.72 | 38.65 | 35.02 | 28.69 | 22.48 | 23.14 | 15.95 | — | — | — | — | — | — | — |
| Price performance 12m | 0.14 | -0.04 | -0.02 | 0.13 | 0.1 | 0.22 | 0.28 | -0.03 | 0.45 | — | — | — | — | — | — | — | — |
Sign up to see institutional holdings
Sign UpPodcast Mentions
Sign up to see podcast mentions and sentiment
Sign UpAd-hoc releases, corporate news and financial reports published through EQS, newest first, titles as published, directors' dealings, voting-rights notifications and buy-back reports included. The link opens the release. Press releases from the company's own website, newest first.
RWE Aktiengesellschaft: Release of a capital market information
Bull 1
Bear 0
Routine
RWE Aktiengesellschaft: Release of a capital market information
Bull 0
Bear 0
Routine



 +49 201 5179 5008










Prompts
Click prompts to add them under the company line, click again to take one out, then copy the result into your AI chat. Shared by Asian Century Stocks and Uncovered Thai Stocks. Thank you.
RWE Aktiengesellschaft (ticker RWE), listed in Germany.
Copied
ETFs Holding RWE Aktiengesellschaft
Exchange-traded funds whose newest published daily portfolio holds one of the company's listings, largest weight first.
| ETF | Weight in ETF | Shares | Market value | As of |
|---|---|---|---|---|
| CGIE | 1.94% | 724,619 | $ 47.218M | Nov 16, 2026 |
| CGGE | 1.07% | 537,626 | $ 35.033M | Nov 16, 2026 |
| LOPP | 1.04% | 2,624 | $ 169.756K | Jun 30, 2026 |
| FENI | 0.67% | 1,068,050 | $ 69.096M | Jun 30, 2026 |
| CGDG | 0.60% | 550,069 | $ 35.844M | Nov 16, 2026 |
| CGIC | 0.48% | 188,865 | $ 12.307M | Nov 16, 2026 |
| AVDE | 0.33% | 973,637 | $ 63.427M | Nov 16, 2026 |
| FFDI | 0.32% | 940 | $ 61.981K | Jul 31, 2026 |
| DFIV | 0.26% | 899,921 | $ 58.997M | Nov 12, 2026 |
| FFGX | 0.20% | 1,677 | $ 110.577K | Jul 31, 2026 |
| SEIE | 0.20% | 35,663 | $ 2.309M | Jun 30, 2026 |
| QUIZ | 0.20% | 2,758 | $ 187.904K | Aug 31, 2026 |
| FLSP | 0.18% | 26,964 | $ 1.745M | Jun 30, 2026 |
| NTSI | 0.18% | 13,812 | $ 894.101K | Jun 30, 2026 |
| DFAI | 0.17% | 482,099 | $ 31.605M | Nov 12, 2026 |
| DXIV | 0.16% | 6,053 | $ 396.821K | Nov 12, 2026 |
| DFIC | 0.14% | 325,292 | $ 21.325M | Nov 12, 2026 |
| DFAX | 0.08% | 149,454 | $ 9.798M | Nov 12, 2026 |
| TIER | 0.07% | 376 | $ 24.734K | Jul 31, 2026 |