A 1 Key share data ISIN DE000A3H2200 WKN A3H220 Symbol NA9 Stock market exchange Frankfurt Stock Exchange Stock market segment Prime Standard Specialist Baader Bank AG Designated sponsor Oddo BHF Number of shares 12,922,297 Class of shares No-par…
A
1
Key share data
ISIN
DE000A3H2200
WKN
A3H220
Symbol
NA9
Stock market exchange
Frankfurt Stock Exchange
Stock market segment
Prime Standard
Specialist
Baader Bank AG
Designated sponsor
Oddo BHF
Number of shares
12,922,297
Class of shares
No-par value registered
shares
Free float as of
December 30, 2025
c. 55.3%
First day of trading
December 16, 2020
Opening price (Xetra)
on January 2, 2025
€ 78.90
Closing price (Xetra)
on December 30, 2025
€ 76.25
Market capitalization
on December 30, 2025
€985.33 million
Highest price (Xetra)
€89.60 (February 18, 2025)
Lowest price (Xetra)
€43.22 (November 7, 2025)
Average daily volume (Xetra) 38,674 shares
Average daily volume (Xetra)
€ 2,537,942.00
in €
Notes:
- Free float is calculated by deducting the shareholdings notified to us by way of voting rights notifications pursuant to Section 40 (1) of the German Securities Trading Act (WpHG) from
the total number of outstanding shares
- Average daily volume in € is calculated by multiplying the average daily volume on the Xetra trading platform by the volume-weighted average price (VWAP) of €84.96 over this time period
- Highest and lowest price are based on the daily closing rates for the year 2025
- Market capitalization is based on the issued shares
2
Nagarro group
Key figures − annual
Twelve months period ended December 31
2025
2024
Change
kEUR
kEUR
%
Revenue
999,296
971,987
2.8%
Cost of revenues
678,145
676,494
0.2%
Gross profit
321,278
295,752
8.6%
Adjusted EBITDA
138,204
147,464
-6.3%
North America
346,827
347,665
-0.2%
Central Europe
298,034
278,774
6.9%
Rest of Europe
125,951
119,050
5.8%
Rest of World
228,484
226,498
0.9%
Germany
232,568
214,931
8.2%
US
344,257
342,309
0.6%
248,648
219,794
13.1%
Revenue by geography
Revenue by country
Revenue by industry
Automotive, Manufacturing and Industrial
Energy, Utilities and Building Automation
66,488
73,544
-9.6%
Financial Services and Insurance
123,573
124,757
-0.9%
Horizontal Tech
50,868
61,489
-17.3%
Life Sciences and Healthcare
71,399
70,893
0.7%
Management Consulting and Business Information
75,895
60,509
25.4%
Public, Non-profit and Education
90,184
88,876
1.5%
Retail and CPG
135,136
132,417
2.1%
Telecom, Media and Entertainment
44,679
54,180
-17.5%
Travel and Logistics
92,427
85,529
8.1%
3
Nagarro group
Key figures − quarterly
Q4
Q4
YoY
Q3
QoQ
2025
2024
Change
2025
Change
kEUR
kEUR
%
kEUR
%
Revenue
245,867
246,630
-0.3%
254,569
-3.4%
Cost of revenues
168,102
174,412
-3.6%
170,368
-1.3%
Gross profit
77,791
72,291
7.6%
84,208
-7.6%
Adjusted EBITDA
33,408
38,186
-12.5%
44,035
-24.1%
North America
86,672
86,971
-0.3%
88,383
-1.9%
Central Europe
72,362
72,481
-0.2%
76,203
-5.0%
Rest of Europe
30,571
30,123
1.5%
31,750
-3.7%
Rest of World
56,262
57,055
-1.4%
58,232
-3.4%
Germany
55,405
56,816
-2.5%
59,716
-7.2%
US
85,735
85,429
0.4%
88,117
-2.7%
Automotive, Manufacturing and Industrial
62,068
59,780
3.8%
65,038
-4.6%
Energy, Utilities and Building Automation
13,754
16,647
-17.4%
15,430
-10.9%
Financial Services and Insurance
29,962
30,170
-0.7%
32,424
-7.6%
Horizontal Tech
11,192
14,587
-23.3%
12,933
-13.5%
Life Sciences and Healthcare
18,068
18,181
-0.6%
18,105
-0.2%
Management Consulting and Business Information
19,056
16,494
15.5%
20,233
-5.8%
Public, Non-profit and Education
22,669
23,078
-1.8%
22,968
-1.3%
Retail and CPG
35,085
32,637
7.5%
33,784
3.8%
Telecom, Media and Entertainment
10,940
12,763
-14.3%
10,739
1.9%
Travel and Logistics
23,073
22,292
3.5%
22,914
0.7%
Revenue by geography
Revenue by country
Revenue by industry
4
Twelve-month period ended December 31
2025
2024
%
%
Top 5
15.5%
14.4%
Top 6-10
8.8%
9.1%
Outside of Top 10
75.7%
76.5%
Revenue concentration (by customer)
Gross profit, gross margin and Adjusted EBITDA margin are neither required by, nor presented in accordance with IFRS. Non-IFRS measures should not be considered in isolation
or as a substitute for results under IFRS.
Gross profit is calculated on the basis of total performance which is the sum of revenue and own work capitalized.
Rounding differences may arise when individual amounts or percentages are added together.
5
Dear fellow shareholders,
In our last annual report, we articulated Nagarro’s strategy of “Up, Across, Together” to capitalize on the AI opportunity:
Up: To elevate our positioning, from our traditional foundation of engineering excellence, to advising client CXOs on the
strategic interplay between technology and business value.
Across: To encourage and empower our industry teams to capture business across key regions, rather than focusing on one or
the other region for legacy reasons.
Together: To enhance collaboration and cross-selling, while reducing duplication of effort, particularly in AI topics.
Since then, we have made steady progress on these three dimensions. We now complement our technical AI solutioning with
AI advisory services at an enterprise, CXO-level. We have secured a few lighthouse examples where we are executing this model for
major global enterprises. While advisory will not immediately contribute significantly to revenue (or to costs), it will expand our
influence, footprint, pricing power and revenue opportunities at each client. We intend to scale advisory services significantly in 2026
and 2027.
We have also moved to support our global business units with centralized, growth-focused functions. Our global business units
have historically been entrepreneurial and self-organizing, which is a major strength. Yet, we have decided that, in a tempered demand
environment, we cannot afford to leave untapped the growth potential of standardized growth motions, such as structured
partnerships and programmatic cross-selling. This shift represents a major strategic unlock once fully implemented.
To improve collaboration and efficiency, we are simplifying the organization by consolidating our global business units into just
six “industry BUs” and four “capability BUs.” These larger units provide better geographical coverage and capture improved economies
of scale and scope. This leaner structure is also far easier to steer through the current transformation. Two of the capability BUs are
completely focused on AI, namely, “AI in Change” (advisory, solutions, platforms) and “AI in Run” (testing and managed services). With
these steps, we are keeping pace with the emerging opportunities and challenges of the AI era.
Our strong engineering DNA cements our “right to win” in the changed context, especially as story after story emerges of
enterprise crises due to sloppy engineering with AI. Meanwhile, our carefully cultivated expertise in various industry and regional
contexts, is coming together excellently with our lean, small-teams approach, to deliver advisory-led transformation to our clients. AItransformation will not be so different from digital transformation, but this time around, we want a seat at the top table. These are early
days, but the direction is clear, and we are executing with conviction.
Sincerely,
Manas Human
Co-Founder & Chairperson of the Management Board
6
Index
Section A ..........................................................................................................................................................8
Combined Management Report ....................................................................................................................8
I.
General information about this combined management report ....................................................9
II.
Fundamental information about the Group ................................................................................... 10
III.
Economic report ................................................................................................................................ 14
IV.
Corporate governance statement ................................................................................................... 26
V.
Takeover-related disclosures .......................................................................................................... 33
VI.
Supplementary report ...................................................................................................................... 36
VII.
Comments on the financial statements of Nagarro SE .................................................................. 36
VIII.
Report on expected developments ................................................................................................. 41
IX.
Risks and opportunities report ........................................................................................................ 43
Section B ....................................................................................................................................................... 55
Consolidated Financial Statements of Nagarro SE .................................................................................. 55
Consolidated statement of financial position ........................................................................................... 58
Consolidated statement of comprehensive income ................................................................................ 60
Consolidated statement of changes in equity .......................................................................................... 62
Consolidated statement of cash flows ...................................................................................................... 64
Notes to the consolidated financial statements ....................................................................................... 65
Section C ..................................................................................................................................................... 164
Important Information .............................................................................................................................. 164
I.
Report of the Supervisory Board for the 2025 financial year .................................................... 166
II.
Responsibility statement of the legal representative ................................................................. 174
III.
Financial calendar ............................................................................................................................ 175
IV.
Legal notice ...................................................................................................................................... 176
V.
Independent auditor’s report......................................................................................................... 177
Section D ..................................................................................................................................................... 182
Non-financial Group Statement of Nagarro SE ....................................................................................... 182
7
Section A –Combined Management Report
The terms “Nagarro”, “company”, “the group” and “we” in this report refer to “Nagarro SE and its subsidiaries”.
Section A
Combined
Management
Report
of Nagarro SE and the Nagarro Group
8
Section A –Combined Management Report
I. General information about this combined
management report
Basis of preparation
This combined management report by Nagarro (collectively, “we,” “us,” “our,” “Nagarro,” “Group,” or “Company”) and the
management report of Nagarro SE have been prepared in accordance with sections 289, 289a, 289b, 289f, 298, 315, 315a, 315b, and
315d of the German Commercial Code (HGB), the German Stock Corporation Act (AktG) and German Accounting Standard (GAS)
No. 20.
The combined management report presents the Management Board’s assessments and evaluation of Nagarro’s business
performance, including its results of operations and overall situation, and focuses on the material information for understanding
Nagarro’s net assets, financial position and results of operations and the expected development. A separate non-financial report is
published as Section D in our 2025 annual report in the Company Register and on our website.
The figures presented throughout this report are rounded, which may result in minor discrepancies with the presented totals
and percentages.
External audit
This combined management report has been subject to an annual independent audit by KPMG AG
Wirtschaftsprüfungsgesellschaft, Munich (“KPMG” or “Auditor”). Cross-references to the non-financial report, the Nagarro Constitution
and the whistleblower policy, and the information to which the cross-references refer, are not audited by the auditor. Further unaudited
sections are marked accordingly.
Forward-looking statements
The combined management report contains forward-looking statements. A forward-looking statement is any statement that
does not relate to historical facts or events or to facts or events as of the date of publication of this combined management report. This
applies, in particular, to statements in this combined management report containing information on our future earnings capacity, plans
and expectations regarding business growth and profitability, and the general economic conditions to which we are exposed.
Statements using words such as “predicts”, “assumes”, “estimates”, “forecasts”, “plans”, “intends”, “endeavors”, “expects” or “targets”
may be an indication of forward-looking statements.
The forward-looking statements contained in this combined management report are subject to risks and uncertainties, as they
relate to future events, and are based on estimates and assessments made to the best of our present knowledge. These forward-looking
statements are based on assumptions, uncertainties and other factors, including, but not limited to, those described in the sections on
expected developments and associated material opportunities and risks in the Combined Management Report. The occurrence or
non-occurrence of these assumptions, uncertainties and other factors could cause our actual results, including our financial condition
and profitability, to differ materially from, or fail to meet, the expectations expressed or implied in the forward-looking statements.
9
Section A –Combined Management Report
II. Fundamental information about the Group
A. Organizational and legal structure
Nagarro SE, based in Munich, Germany, is the parent company of the Nagarro Group. To the extent that no separate disclosures
are made, the information provided for the Nagarro Group shall be deemed applicable to Nagarro SE. The Financial Statements of
Nagarro SE are drawn up in accordance with the provisions of the HGB and the relevant supplementary provisions contained in the
AktG.
Nagarro SE oversees the operations of its global subsidiaries. These subsidiaries are spread across 38 countries, with a focus on
delivering superior digital engineering services to clients around the world.
The Nagarro Group is organized into more than 20 Global Business Units (GBUs), which may be specific to an industry, a
particular service expertise or business achieved through a sales channel. GBUs are periodically added or retired, reflecting changes in
business priorities. Our organizational model fosters autonomy within business units, empowering them to remain responsive to client
needs and evolving market conditions, which allows the Company to quickly adapt to changes and seize opportunities in various
sectors. The GBUs leverage the Company’s global talent pool and also frequently collaborate with each other to win and service clients.
The GBUs are supported by central functions such as finance, enterprise data, legal, risk and compliance, and by the regionwise administrative units called Service Regions. Notably, talent allocation and planning is also centralized and global.
At year-end, the total number of professionals employed by Nagarro was 18,003 in 2025 [2024: 17,825 (previously reported:
17,695*)], while the number of professionals in engineering was 16,429 in 2025 [2024: 16,453 (previously reported: 16,192*)]. This also
includes non-engineers, such as designers, contributing to our engineering efforts and are therefore within professionals in
engineering. At year-end, the top five countries in terms of professionals in engineering were India (12,264), Germany (916), Romania
(723), United States of America (481) and Philippines (456).
*up to the year 2024, Nagarro had considered only on-roll employees under the category of “Professionals” for the purpose of
headcount disclosure. The Company has certain so-called W-2 employees in USA who are employed on a contractual basis but their
payroll is processed through same payroll cycle with social security and tax deductions similar to any other full time employee. Their
cost is also charged to staff costs. Accordingly, effective 2025, Nagarro has included these W-2 employees within category of
“Professionals”, and the comparative figures for previous years have been restated accordingly.
B. Business model
Nagarro is a global provider of digital engineering services to other businesses.
We harness the power of digital engineering, data and AI to help our clients run their businesses more intelligently and
efficiently. We use the term “fluidic intelligence” to denote what our services aim to deliver to our clients. This encompasses improved
human-AI collaboration, connected enterprise data and grounded AI models, and the smooth flow of information, decisions and actions
across process and organizational boundaries.
To deliver these results, we advise on, develop, test, integrate, deploy, secure, upgrade, maintain and manage digital products,
digital commerce and customer experience solutions, Big Data and AI solutions, ERP, or other third-party applications. Our expertise
extends across sectors, leveraging industry-specific insights to achieve strategic goals in complex, evolving and competitive digital and
AI landscapes. The industries we serve include:
Automotive, Manufacturing and Industrial: Our technology services enable automotive clients to navigate market shifts and
accelerate innovation in connected cars, autonomous driving, and customer experience. For manufacturing and industrial clients, we
provide technology solutions that create connected, intelligent enterprises, and drive efficiency and innovation across operations.
Energy, Utilities and Building Automation: We enable the industry’s vision of digital, decentralized, and sustainable energy by
driving innovation. Our services help energy and utility companies optimize their operations, ensure sustainability, and embrace digital
transformation in response to an evolving energy landscape. Our integrated experiences for smart buildings ensure operational
efficiency, enhanced user comfort, and improved sustainability.
Financial Services and Insurance: Nagarro’s services help banks, fintech companies and insurers enhance customer experience,
security, regulatory compliance and operational efficiency.
10
Section A –Combined Management Report
Horizontal Tech: Nagarro partners with leading Independent Software Vendors (ISVs) to help them accelerate their product
vision and roadmap, adopt new business models, and deliver innovative solutions. Our long experience in software product
development and digital engineering makes us a reliable engineering partner for ISVs.
Life Sciences and Healthcare: Technology is transforming the healthcare industry—from wearables collecting health data to AIpowered diagnostics. We help clients drive innovation in patient care, research, and medical device development while ensuring
compliance with regulatory standards. Our solutions contribute to improved patient outcomes and enhanced operational efficiency.
Management Consulting and Business Information: We help these companies build internal systems as well as data products
for sale. Our strategic partnerships with management consulting firms can drive client referrals and position us as a preferred partner
to execute digital transformation initiatives.
Public, Non-profit and Education: We enable public sector organizations to make smarter, data-driven decisions, enhance
citizen engagement, and accelerate innovation. We support nonprofits and educational institutions in embracing digitization,
leveraging data, and improving engagement with stakeholders.
Retail and CPG: We help retail and consumer goods companies address an ever-evolving consumer landscape by leveraging
data and AI to personalize experiences, improve supply chain efficiency, and increase business agility.
Telecom, Media and Entertainment: In telecom, we help clients use AI and data to personalize services, boost loyalty, and
improve operations. In the field of entertainment, we focus on data-driven engagement and smooth user experiences, especially in
gaming. In media and publishing, we support digital innovation and new content platforms.
Travel and Logistics: Our services help airlines, airports, public transport operators, hotel chains, railroads, freight carriers and
other travel and logistics companies stay safe, predictable, efficient and customer friendly.
Clients mostly engage us for provision of services on a time and expense basis, periodic basis or through fixed-price contracts.
During the year 2025, Nagarro had revenues of €685.7 million (68.6% of total revenue) from time and expense projects, €199.6 million
(20.0% of total revenue) from periodic services, €107.4 million (10.7% of total revenue) from milestone-based fixed-price projects, and
€6.7 million (0.7% of total revenue) from license sale and other sources.
Revenue for time and expense contracts is recognized over the course of the project as services are performed.
Revenue from fixed-price, fixed-timeframe contracts, where the performance obligations are satisfied over time is recognized
using the input method. Efforts or costs expended are used to determine progress towards completion as there is a direct relationship
between input and productivity. Progress towards completion is determined based on the ratio of costs or efforts incurred to date
relative to the estimated total costs or efforts. The transaction price and estimated costs are reviewed and updated regularly throughout
the duration of the contract. Any revisions to estimates are recognized in the period in which they are identified. Provisions for expected
losses, if any, are recognized immediately.
Contracts that establish a fixed monthly billing amount for continuous service delivery are recognized as revenue over time,
reflecting the transfer of services to the customer as they are performed. These contracts typically involve recurring services, such as
maintenance activities, where services are delivered through an indefinite number of repetitive acts over a specified period. In such
cases, revenue is recognized on a straight-line basis as the pattern of service delivery and the customer's receipt of benefits are uniform
over the contract term, and there is no significant judgment required in measuring progress.
Revenue from the rental of datacenter resources is recognized on periodic basis based on the monthly fixed or monthly usage
basis. Further, Nagarro also sells its own and third-party licenses, which is currently not a significant part of Nagarro’s business model.
Nagarro serves a diverse portfolio of over 1,000 clients across 72 countries, mostly engaging with them directly without reliance
on intermediaries. While much of our revenue from any client comes from individual projects, our relationships with larger clients are
typically long-term and include numerous individual projects. The total number of clients with whom we do more than €10 million of
business annually in 2025 was 20 (2024: 18). The average length of our relationship with these clients was 13.2 years (2024: 12.8 years).
The total number of clients at between €5 million and €10 million revenue in 2025 was 15 (2024: 18) with an average relationship of
11.3 years (2024: 8.6 years). The total number of clients at between €1 million and €5 million revenue in 2025 was 145 (2024: 150), with
an average relationship of 6.8 years (2024: 6.1 years). Our strong technological expertise and extensive domain knowledge allow us to
deliver customized solutions to our clients. While Nagarro maintains partnerships with leading technology providers, we remain
technology-agnostic, focusing on recommending the most suitable solutions based on each client’s needs. [Note: the data presented
in this paragraph has not been audited.]
Our largest sales markets are Europe and North America, which together account for approximately three-quarters of our 2025
revenue. Germany is the largest contributor to European revenue, while nearly all of our North American revenue is derived from the
US. We service each client using an appropriate mix of professionals from one or more of our locations, Rest of World being the largest
contributor. Within the Rest of World region, India represents our primary delivery hub.
11
Section A –Combined Management Report
C. Strategy and objectives
This section describes Nagarro’s medium (2 to 5 years) and long-term (>5 years) objectives and the strategies used to work
towards these objectives.
Nagarro’s growth strategy emphasizes a balance between driving revenue and Adjusted EBITDA growth. The Company has
been successful with this strategy in the medium-term, driving revenue growth at a CAGR of 18.4% and Adjusted EBITDA growth at a
CAGR of 12.6% from 2020 to 2025. Growth within existing accounts is typically driven by extending services across various divisions or
geographic regions. New clients are often acquired through a strong foundation of testimonials, case studies, and referrals from
existing clients. Nagarro seeks to use its collaborative structure to turn collective expertise into client success, especially when solving
complex, interdisciplinary challenges.
Nagarro continuously works to enhance its future capabilities and its future standing at clients, by prototyping with new
technologies, running ideation workshops with clients, and investing in proof-of-concept projects. While these efforts are not expected
to drive short-term growth, they are crucial to supporting the Company’s medium-term strategic objectives.
We also seek inorganic growth through mergers and acquisitions (M&A). Nagarro’s acquisitions team actively identifies
businesses that complement its operations, particularly those that provide specialized expertise or access to new clients and talent
pools. The cultural fit of potential acquisitions is also considered to ensure successful integration and alignment with Nagarro’s values.
Through 2025, Nagarro has completed 4 M&A transactions.
Nagarro's Mission Statement is: "To make distance and difference irrelevant between intelligent people."
This mission reflects Nagarro's commitment to fostering seamless collaboration among talented individuals, regardless of their
physical locations or diverse backgrounds. The IT industry today is a global industry, with talent, clients and partners distributed across
the world. Many of our clients are also multinationals, and many have grown through M&A just like Nagarro has. Many of our projects
are interdisciplinary. We drive client value by integrating diverse perspectives from our employees to ensure seamless execution of
complex digital transformations. We expect to enhance the collaboration between our employees and teams, improving efficiencies
and reducing frictions.
Central to Nagarro's culture are its core values, encapsulated in the acronym CARING:
•
•
•
•
•
•
Client-centric: Prioritizing client success and building lasting partnerships.
Agile: Embracing responsiveness and swift adaptation to change.
Responsible: Taking ownership of actions and their outcomes.
Intelligent: Valuing knowledge, results, and boldness over hierarchy.
Non-hierarchical: Empowering individuals to be creative and entrepreneurial.
Global: Embracing diversity and collective intelligence across geographies.
These values derive from the Mission Statement and Vision Statement. They collectively define Nagarro's organizational ethos
and guide its interactions with clients, colleagues, and society.
As a people-driven industry, Nagarro focuses on deploying skilled professionals, most of whom are software experts. These
professionals are equipped with the necessary tools, such as technology assets and ongoing training, to continually enhance their
capabilities. Nagarro also prioritizes creating a fulfilling work environment, fostering long-term employee satisfaction and engagement.
We connect our diverse workforce of more than 18,000 professionals across 38 countries with culture. We cultivate a nonhierarchical, globally connected, informal work culture. This shared informal culture makes working in Nagarro like working with friends.
It keeps the Company agile, entrepreneurial and global, and propels us towards our goals and our mission. It also helps us attract and
retain top talent in a competitive market for talent.
We emphasize the responsible use of technology, embedding sustainability into our operations and client projects to support
a greener, more inclusive future.
12
Section A –Combined Management Report
D. Internal management system and performance indicators
Nagarro is steered by its Management Board pursuant to the AktG and supported by a senior management team responsible
for the individual business units.
Effective management and decision-making are supported by a well-defined set of key performance indicators (KPIs) that align
with our strategic objectives. These KPIs enable us to monitor performance, assess progress, and make data-driven decisions across all
levels of the organization.
The Company’s chosen key financial KPIs are revenue, gross margin and Adjusted EBITDA margin. Gross margin and Adjusted
EBITDA margin are non-IFRS alternative performance measures, selected to provide supplemental information for a meaningful
comparison of the Company’s financial performance with industry peers and across reporting periods.
Our success depends on building long-term relationships with our clients. In any year, the majority of our revenue comes from
existing clients. Referrals from existing clients are also a significant source of new client acquisitions. Therefore, our key non-financial
KPIs are our client satisfaction (CSAT) score and our Net Promoter Score (NPS), both of which are measured via a standardized client
satisfaction survey.
The Company’s employees are financially incentivized on the Company’s overall performance and not only on the performance
of their individual area of responsibility. This is achieved through an “organization bonus,” which is linked to Adjusted EBITDA, and stock
options. Individual under-performance may lead to interventions such as performance improvement plans, a change of responsibilities,
or even dismissals.
The Company’s KPIs are described in greater detail in III.B. Business performance for 2025 of section A.
E. Market position and competitive landscape
Nagarro competes for client projects with global Tier-1 IT service providers, mid-sized digital engineering specialists, and niche
software solution providers. Among these, we see ourselves as most similar to mid-size digital engineering specialists in terms of our
value proposition.
Compared to the global Tier-1 IT services providers, Nagarro seeks to differentiate itself through greater responsiveness and
client-centricity, which allows us to consistently deliver good project outcomes as reflected in our CSAT and NPS scores. We aim to
surpass the service levels and match the global footprint that these larger service providers may offer.
Compared to the mid-sized digital engineering specialists, we seek to differentiate ourselves through robust engineering in
complex products and intricate technology landscapes. Clients also appreciate that we can service their requirements locally as well as
remotely from locations across the globe.
Compared to the niche software solution providers, we seek to differentiate ourselves by demonstrating a better understanding
of the broader client context and bringing more tools to address their requirements in a holistic and bespoke way.
Overall, Nagarro has positioned itself as a trusted, strategic partner for digital transformation.
F. Research and development
While we work with the latest technology, we do not spend significant sums on traditional R&D. Rather, as a services Company,
we work with the technology products created by companies such as Adobe, Amazon, Anthropic, Databricks, Google, Microsoft,
OpenAI, Salesforce, SAP, ServiceNow, Siemens and Snowflake, as well as those created by niche software vendors. In this, we are similar
to most of our peer group. However, we do occasionally capitalize some smaller assets related to R&D which are not material. In 2025,
we amortized €0.2 million (2024: €0.4 million) of such assets. The closing value of intangible assets related to R&D on our balance sheet
as of December 31, 2025, was €0.3 million (2024: €0.5 million).
13
Section A –Combined Management Report
III. Economic report
A. The business environment in 2025
Global economy
The global economy experienced moderate but steady growth, with OECD projecting that global GDP will increase by 3.2% in
2025 as higher tariffs and ongoing policy uncertainty slow down investment and trade. In the United States, growth is projected to fall
from 2.8% in 2024 to 1.8% in 2025 due to higher tariff rates, moderating net immigration and reductions in the federal government
workforce. In the Euro area, GDP growth is expected to be even more modest at 1.2% in 2025 with increased trade frictions and
geopolitical uncertainty somewhat offset by stronger public investment and easier credit conditions.
IT services industry
Gartner forecasts worldwide IT services spending to grow 6.4% in 2025 in US dollar terms. Economic uncertainty and focus on
delivering returns on companies’ IT investments has led to a cautious approach towards discretionary digital projects. This landscape
is complicated by AI and its unclear future role in enterprise IT. Chief Information Officers (CIOs) are facing scrutiny over the ROI and
safety of projects built on this complex and nascent technology. We believe this uncertainty has caused a temporary slowdown in new
IT services engagements as budget holders seek assurance of robust implementations and tangible outcomes.
Impact on Nagarro
Nagarro’s geographic and industry diversification helped drive growth in a challenging business environment. Emerging
markets, such as the Middle East, continued to offer promising opportunities for expansion, given their robust investments in
technology infrastructure and AI development. Similarly, Nagarro was able to continue to grow significantly in 2025 in the “Automotive,
Manufacturing and Industrial” industry. On the negative side, Independent Software Vendors (ISVs) in our “Horizontal Tech” industry
appeared significantly affected by technology disruption and were more aggressive in reducing their spend on IT services with us. In
many other industries in between, like “Management Consulting and Business Information” and “Travel and Logistics,” we were able to
use our expertise to continue to grow even in a challenging industry environment.
On the talent side, attrition and wage inflation remained moderate. The requirements for working remotely, in the office, or at
client locations typically varied from team to team with many Nagarrians working remotely in 2025.
B. Business performance for 2025
In this section, we compare the achieved results for 2025 with the outlook presented in the Combined Management Report
for 2024. A detailed analysis can be found in the section on the result of operations.
Revenue
In our Combined Management Report for 2024, we had projected Nagarro’s revenue for 2025 to be between €1,020 million
and €1,080 million, when calculated at the currency exchange rates then prevailing, as against €972 million in 2024. Our actual revenue
in local currencies was approximately at the midpoint of our range of expectations, however, the strengthening of the Euro against the
US dollar – from 1.039 on January 1, 2025 to a yearly average rate of 1.130 on December 31, 2025 – significantly reduced our Eurodenominated top line. Further, the demand was lower than expected due to some customers scaling back a few projects. It may also be
noted that the rate of growth in global IT services spending in 2025 was lower than projected. Gartner’s public estimates for the yearon-year growth in 2025 in the world-wide spend on IT services, denominated in US dollars, decreased from a forecast of 9.0% on January
21, 2025, to an estimate of 6.4% on February 3, 2026. Nagarro’s final actual revenue for 2025 is €999 million.
Gross margin and Adjusted EBITDA
Gross margin is the ratio of gross profit to revenue, where gross profit is calculated as the difference between total
performance and cost of revenues. Total performance includes customer revenue and own work capitalized. Cost of revenues
comprises direct costs attributable to customer revenue delivery, including personnel costs for employees and freelancers, related
travel expenses, software licenses, and further customer‑related costs (reimbursable and non‑reimbursable). Cost of revenues excludes
Global Business Unit (GBU) management costs and expenses related to consultative sales and thought‑leadership activities across
Centers of Excellence and GBUs.
Personnel costs are classified between Cost of revenues and Selling, General & Administrative expenses (SG&A) in accordance
with a structured, time‑based allocation policy. Costs are allocated based on actual timesheet entries and the nature of work performed.
14
Section A –Combined Management Report
Costs directly attributable to customer delivery are classified under cost of revenues, while costs related to core support functions such
as finance, HR, sales etc are classified under SG&A.
In our Combined Management Report for 2024, we had targeted gross margin in the region of 30% for 2025. Nagarro’s
enhanced execution drove a solid gross margin of 32.2% in 2025. The improvement in gross margin was primarily driven by focused
operational efficiencies, including optimization of bench strength, disciplined wage management measures, and enhanced project
utilization across the organization. These initiatives collectively contributed to stronger execution and improved overall cost efficiency.
The table below shows the achieved gross margin for 2025 and 2024:
Revenue
2025
2024
mEUR
mEUR
999.3
972.0
Own work capitalized
0.1
0.3
Total performance
999.4
972.2
Cost of revenues
(678.1)
(676.5)
Gross profit
321.3
295.8
Gross margin (as % of revenue)
32.2%
30.4%
The items “Costs of revenues” and “Selling, General and Administrative expenses”, both not including depreciation and
amortization, reconcile to income and expense presented in consolidated statements of comprehensive income as follows:
2025
thereof
Costs by
nature
Cost of
revenues
Selling, General and
Administrative
expenses
mEUR
mEUR
mEUR
Special
items*
Total
mEUR
mEUR
Cost of freelancers and other direct cost
82.9
82.9
82.9
Staff costs
706.2
573.2
116.6
16.5
706.2
Other operating expenses
101.1
22.1
74.9
4.1
101.1
Impairment of trade receivables and contract
assets
(0.4)
(0.4)
(0.4)
Other operating income
(9.1)
(8.0)
(1.1)
(9.1)
Total
880.7
678.1
183.1
19.5
880.7
2024
thereof
Costs by
nature
Cost of
revenues
Selling, General and
Administrative expenses
Special
items*
Total
mEUR
mEUR
mEUR
mEUR
mEUR
Cost of freelancers and other direct cost
68.9
68.5
0.4
68.9
Staff costs
703.0
585.8
107.0
10.3
703.0
Other operating expenses
93.9
22.3
66.1
5.5
93.9
Impairment of trade receivables
and contract assets
3.0
3.0
3.0
Other operating income
(30.6)
(28.3)
(2.3)
(30.6)
Total
838.2
676.5
148.3
13.4
838.2
15
Section A –Combined Management Report
*The details of special items can be found in the below table relating to reconciliation between Adjusted EBITDA and EBITDA.
Cost of revenues increased slightly by €1.6 million to €678.1 million (67.9% of revenue) in 2025 from €676.5 million (69.6% of
revenue) in 2024. The increase in cost of revenues was significantly lower than the growth in revenues, resulting in a reduction in cost
of revenues as a percentage of revenue. This development was primarily driven by focused operational efficiencies, including
optimization of bench strength, disciplined wage management measures, and enhanced project utilization across the organization.
These initiatives collectively contributed to stronger execution and improved overall cost efficiency.
Other operating expenses included within cost of revenues primarily comprise travel expenses incurred by delivery
professionals, costs related to software licenses, and certain other reimbursable and non-reimbursable cost components from the
customers. The remaining other operating expenses are recognized within selling, general and administrative expenses or special
items, as appropriate.
Selling, general and administrative expenses increased by €34.8 million to €183.1 million in 2025 from €148.3 million in 2024.
The increase was primarily driven by higher expenses from currency translation and foreign exchange forward transactions amounting
to €26.6 million. In addition, expenses rose due to continued investments in building capabilities in artificial intelligence and other
emerging technologies, including the development of internal expertise, platforms, and solutions to support future growth. These
investments are in line with Nagarro’s long-term strategic priorities and are expected to strengthen its innovation capabilities and
competitive position.
We define Adjusted EBITDA as earnings before interest, taxes, depreciation and amortization (EBITDA) adjusted to exclude
effects that we consider extraordinary, such as impairment of goodwill, purchase price adjustments, badwill, foreign exchange effects
on purchase price, sale of equity investments, share based payment arrangements cost, transaction costs related to business
combinations, retention bonus and non-capitalized earn-out expenses related to acquisitions, expenses relating to the strategic review
of Company’s listing and privatization choices and subsequent exploration of the take-private option and, from current year, additional
employee benefits expense related to statutory impact of new Labour Codes in India, additional audit fees and independent
investigation expenses following past external allegations. The Adjusted EBITDA is more suitable for comparing operating performance
over several periods. It is calculated according to economic criteria and is independent from IFRS rules. A more detailed definition can
be found in the consolidated financial statements.
In our Combined Management Report for 2024, we had targeted Adjusted EBITDA margin between 14.5% and 15.5%. Despite
positive underlying operational performance of the Company, on account of revaluation loss of €15.5 million on intra-group loans
within Nagarro Group because of the weakening of the US dollar against the Euro by 13% that we do not historically adjust for to arrive
at Adjusted EBITDA, we revised the guidance for Adjusted EBITDA margin to be between 13.5% and 14.5% in August 2025. The table
below shows calculations for achieved Adjusted EBITDA for the year 2025 of 13.8%. The reconciliation between Adjusted EBITDA and
EBITDA is as follows:
2025
2024
mEUR
mEUR
118.7
134.0
Income from purchase price adjustments
(1.1)
(2.3)
Exchange (gain) / loss on purchase price components
EBITDA
Adjustment for special items
(0.0)
0.0
Share based payment arrangements cost
0.1
3.8
Transaction costs related to business combinations
0.9
0.3
Retention bonus expense as part of share purchase agreement of the acquired entities
2.7
3.4
Non-capitalized earn-out expense relating to acquisitions
1.3
3.1
Independent investigation expenses following past external allegations
2.0
Expenses relating to strategic review of listing and privatization choices
1.2
Expenses relating to the exploration of the take-private option
3.9
Additional employee benefits expense related to statutory impact of new Labour Codes in India
12.4
Additional audit expenses
1.3
Total adjustment for special items
19.5
13.4
Adjusted EBITDA
138.2
147.5
Revenues
999.3
972.0
Adjusted EBITDA (as % of revenues)
13.8%
15.2%
16
Section A –Combined Management Report
The most significant adjustment to EBITDA for the year relates statutory impact of new Labour Codes in India amounting to
€12.4 million which represents cumulative statutory impact of new Labour Codes implemented in India with effect from November 21,
2025. The impact is primarily on account of defined benefit obligations due to change in wage definition which has been clubbed in
staff costs in the consolidated statement of comprehensive income. The previous year’s figures included expenses relating to strategic
review of listing and privatization choices of €3.9 million and expenses relating to the exploration of the take-private option of
€1.2 million that were not incurred in 2025.
CSAT and NPS scores
Our key non-financial KPIs are our client satisfaction (CSAT) score and Net Promoter Score (NPS). Both the CSAT and the NPS
are measured via a standardized client satisfaction survey. This survey is sent every quarter to the person responsible for project success
on the client side – excluding very small engagements, defined since Q1 2025 as projects with no more than 3 FTEs of average monthly
staffing in the quarter. Before Q1 2025, the projects excluded from the survey were defined as those with staffing in only one month, or
in two months with no more than 1 FTE in each. The threshold for sending out the survey was changed based on client feedback and
the low response levels for these small projects.
This survey also does not cover engagements via acquisitions in up to 5 quarterly cycles after the completion of their integration
into Nagarro’s systems and processes. Despite these caveats, the CSAT and NPS results are very central to our management system.
Each CSAT survey asks clients to indicate how frequently they are satisfied with specific aspects of our services. Each survey
consists of six questions, and for each question clients can respond with “Always”, “Mostly”, “Sometimes”, or “Never”. The CSAT score
represents the proportion of responses marked as “Always” or “Mostly” across all surveys conducted during the reporting period.
Responses are monitored closely at multiple levels — in aggregate, by individual question, and at the project level. While minor
fluctuations are expected, any significant trends are analyzed and corrective internal actions are then taken to address it accordingly.
At the aggregate level, the CSAT score reflects the percentage of responses rated as “Always” or “Mostly”. Our CSAT score for 2025 was
93.4% with the new exclusion policy for very small engagements (2024: with the new policy: 93.8%; with the old policy: 91.8%). In our
Combined Management Report for 2024, we had targeted a CSAT in the region of 90% (with the new policy) for 2025, so the goal was
achieved.
The NPS question posed in the survey is: “On a scale of 1-10, how likely are you to recommend Nagarro to a friend or colleague?”
Promoters are those who give a score of 9 or 10, Passives are those who give a score of 7 or 8, and Detractors are those who respond
with a score below 7. The NPS score is calculated as (number of Promoters – number of Detractors) * 100/ (total number of NPS
responses) and rounded to the nearest whole number. Nagarro’s NPS score for 2025 was 68 with the new exclusion policy for very small
engagements (2024: with the new policy: 68; with the old policy: 62). In our Combined Management Report for 2024, we had targeted
an NPS in the region of 60 (with the new policy) for 2025, so the goal was achieved.
C. Result of operations
Revenue
Nagarro’s revenues grew to €999.3 million in 2025 from €972.0 million in 2024, up 6.1% in constant currency and up 2.8% in
Euro terms. This was lower than our updated guidance on August 14, 2025. 2025 revenues were lower than the original forecast ranging
between €1,020 million and €1,080 million provided on January 23, 2025, when calculated at the currency exchange rates then
prevailing. Revenues were lower mainly due to strengthening of the Euro against the US dollar. Further, revenues were negatively
impacted due to lower than expected demand and scale-backs in a few projects by the customers. Organic YoY revenue growth, which
excludes revenue contribution from acquisitions happened during the reporting and comparative period, was 5.3% in constant
currency, which translated to 2.0% organic YoY revenue growth in Euro terms. The difference between organic constant curreny growth
of 5.3% and reported organic growth of 2.0% YoY growth was primarily dirven by adverse foreign exchange movements, primarily in
USD/EUR and INR/EUR, which had modest negative impact on reported revenues.
Nagarro generated 68.6% of its revenue from services on time and expense basis (2024: 69.8%), 20.0% of its revenue from
periodic services basis (2024: 16.2%), 10.7% of its revenue from services on fixed-price basis (2024: 13.4%), and 0.7% of its revenue
from other services (2024: 0.6%) in 2025. Revenues across billing types in 2025 reflect both underlying business trends and a refinement
in contract classification undertaken during the year to ensure consistent application of an organization-wide framework. As a result,
certain engagements have been reclassified across billing categories, and changes in revenue mix should be viewed in this context.
Revenues from time and expense services have decreased by 1.1% to €685.7 million in 2025 from €678.4 million in 2024 mainly
due to drop in Financial Services and Insurance (in Middle East countries) and Telecom, Media and Entertainment sector (primarily
United States of America). The drop was offset with growth in Automotive, Manufacturing and Industrial sector (mainly Germany and
United States of America) and Management Consulting and Business Information sector (primarily India). Revenues from fixed-price
services decreased by 17.4% to €107.4 million in 2025 from €130.0 million in 2024 mainly due to decline in revenues from Retail and
CPG sector (primarily United States of America). Revenues from periodic services increased by 26.6% to €199.6 million in 2025 from
€157.6 million in 2024 mainly due to increase in revenues from the Financial Services and Insurance sector (in United Arab Emirates and
17
Section A –Combined Management Report
Austria), Retail and CPG sector (Germany and United States of America). Revenues from other services, mainly license sales, increased
by 12.8% to €6.7 million in 2025 from €5.9 million in 2024.
Further, current year revenue includes the positive hyperinflationary impact in Türkiye of €1.9 million in 2025 compared to
€2.7 million in 2024 because of a lower inflation in 2025 than 2024.
Industries with robust global growth in 2025 over 2024 included “Management Consulting and Business Information” (25.4%),
“Automotive, Manufacturing and Industrial” (13.1%) and “Travel and Logistics” (8.1%). Robust growth in “Management Consulting and
Business Information” is mainly due to growth from customers in Rest of World and North America regions. Growth in “Automotive,
Manufacturing and Industrial” is mainly due to growth in customers from Central Europe and North America regions.
Industry with the least growth in 2025 over 2024 was in “Life Sciences and Healthcare” (0.7%).
Industries with negative growth in 2025 over 2024 included “Telecom, Media and Entertainment” (-17.5%), “Horizontal Tech” (17.3%), and “Energy, Utilities and Building Automation” (-9.6%). Negative growth in “Telecom, Media and Entertainment” is mainly due
to decrease in customers in Central Europe and Rest of Europe. Revenue decrease in “Horizontal Tech” is mainly due to revenue drop
from customers in Rest of World and North America regions.
In 2025, in the geographical revenue distribution based on client region, Nagarro generated 34.7% of its revenue from North
America (2024: 35.8%), 29.8% of its revenue from Central Europe (2024: 28.7%), 22.9% of its revenue from Rest of World (2024: 23.3%)
and 12.6% of its revenue from Rest of Europe (2024: 12.2%).
The revenue from our top 5 clients as a percentage of total revenue increased to 15.5% in 2025 from 14.4% in 2024. Revenue
from the next 5 largest clients declined to 8.8% compared to 9.1% in 2024, while revenue from clients outside the top 10 decreased to
75.7% from 76.5%.
Our clients in 72 countries chose to pay us in various currencies. The top 5 currencies that contributed significantly to our
revenues are listed below (in € million).
Revenue
currency
2025
mEUR
2024
mEUR
USD
364.4
373.7
EUR
388.1
356.8
INR
90.4
92.4
AED
33.2
30.5
GBP
25.0
21.2
999.3
972.0
Figures in €m
32.2%
321.3
Revenue
30.4%
295.8
Gross profit
2025
Gross margin
13.8%
15.2%
138.2
147.5
Adjusted EBITDA
2024
Adjusted EBITDA (as % of revenue)
18
Section A –Combined Management Report
Other operating income
Other operating income decreased by €21.5 million to €9.1 million in 2025 from €30.6 million mainly due to decrease in
income from currency translation by €16.3 million and foreign exchange forward transactions by €4.0 million on account of net
presentation of foreign exchange gains and loss in current year as explained in below note. Further, there has been a decrease in net
monetary gain by €1.0 million, decrease in write back of earnout payable of €1.2 million (mainly due to Telesis and APSL which has been
offset by write back of earnout payable relating to RipeConcepts).
Note:
Until December 31, 2024, Nagarro presented income and expenses from currency translation and foreign exchange forward
transactions on a gross basis. Effective 2025, Nagarro presents these items on a net basis i.e., net income/(expense) from currency
translation and net income/(expense) from foreign exchange forward transactions under other operating income or other operating
expenses as the case may be. Management believes that this presentation better reflects the nature of these items as part of the Group’s
overall foreign currency risk management activities and provides more relevant information to users of the financial statements. The
change represents a voluntary change in presentation in accordance with IAS 1. The change affects presentation only and has no impact
on profit before tax, net profit or equity. Had the net presentation been applied in 2024, net income from currency translation would
have been €6.0 million and net income from foreign exchange forward transactions would have been €0.3 million. Accordingly, total
other operating income would have been reduced by €14.0 million with a corresponding reduction in other operating expenses.
Cost of freelancers and other direct costs
Cost of freelancers and other direct costs grew by €14.0 million to €82.9 million in 2025 from €68.9 million in 2024 mainly due
to more involvement of third party contractors on the projects and increase in purchase of software and licences used to deliver the
projects.
Staff costs
Staff costs have increased by €3.2 million to €706.2 million in 2025 from €703.0 million primarily due to statutory impact of
new Labour Codes in India of €12.4 million. The same has been offset by net decrease in share based payment arrangements cost
amounting to €3.6 million mainly on account of decrease in fair value of the underlying cash-settled employee stock options and lesser
number of equity-settled employee stock options in 2025 as compared to 2024 as these were converted into cash-settled in November
2024. The decrease in employee stock options has been offset by increase in expense related to performance-based restricted stock
units as these have been granted in 2025 to the members of management board. Further, there is a decrease in bonuses by €3.3 million,
decrease in earn-out expense as part of share purchase price agreement (SPA) by €1.8 million, and decrease in payroll cost by
€1.7 million (pay increments offsets by decline of around 576 average number of professionals in comparison to 2024). Current year
staff costs also include the positive hyperinflationary impact in Türkiye of €1.4 million in 2025 compared to €1.7 million in 2024,
resulting in a net decrease of €0.3 million.
Gross profit/Gross margin
Gross profit grew to €321.3 million in 2025 from €295.8 million in 2024. Gross margin was 32.2% in 2025 as compared to
30.4% in 2024 and expected gross margin of around 30.0% as per the guidance issued on January 23, 2025. Gross margin has improved
by 1.7 percentage points compared to 2024 mainly due to improvement in project utilization.
Other operating expenses
Other operating expenses have increased by €7.2 million to €101.1 million in 2025 from €93.9 million in 2024 mainly due to
expenses relating to the currency translation and foreign exchange forward transactions by €6.3 million. These mainly relate to
unrealized foreign exchange losses arising from the remeasurement of intra-group loans within the Nagarro group. As explained above,
starting in 2025 Nagarro presents income and expenses from currency translation and foreign exchange forward transactions on a net
basis. Accordingly, the above-mentioned expenses are partially offset by corresponding income from currency translation. Further,
legal, consulting and audit fees increased by €5.2 million, and independent investigation expenses following past external allegations
by €2.0 million. The increase has been offset by decrease in expenses relating to the exploration of the take-private option by
€3.9 million and expenses relating to strategic review of Company’s business by €1.2 million as no such expenses have been incurred
during the year.
Adjusted EBITDA
Adjusted EBITDA was €138.2 million (13.8% of revenue) in 2025, against €147.5 million (15.2% of revenue) in 2024 and is in
line with our updated guidance issued on August 14, 2025. Our original targeted adjusted EBITDA margin as per the guidance issued
on January 23, 2025 was between 14.5% and 15.5% of revenue. Despite positive underlying operational performance of the Company,
on account of the revaluation loss on intra-group loans because of the weakening of the US dollar against the Euro, we modified our
targeted adjusted EBITDA margin on August 14, 2025 to be between 13.5% - 14.5%.
19
Section A –Combined Management Report
Adjusted EBITDA and EBITDA were influenced by the cost impact of measures (such as reduction in people on the bench)
taken to align capacity with demand during the year. Despite positive underlying operational performance of the company, due to the
revaluation loss on intra-group loans within Nagarro Group because of the weakening of the US dollar against the Euro, Adjusted
EBITDA, as a percentage of revenues, has declined by 1.3 percentage points compared to 2024.
Further, current year Adjusted EBITDA includes the positive hyperinflationary impact in Türkiye of €1.2 million for 2025
compared to €1.7 million in 2024, resulting in a net decrease of €0.5 million.
Our net adjustments to EBITDA, as explained in III.B. Business performance for 2025 of section A, in 2025 amount to
€19.5 million (2024: €13.4 million) and the most significant adjustments were statutory impact of new Labour Codes in India amounting
to €12.4 million (2024: Nil), retention bonus amounting to €2.7 million (2024: €3.4 million), independent investigation expenses
following past external allegations amounting to €2.0 million (2024: Nil), earnout expense amounting to €1.3 million (2024:
€3.1 million), additional audit fee of €1.3 million (2024: Nil), and share based payment arrangements cost amounting to €0.1 million
(2024: €3.8 million). This has been offset by purchase price adjustments of €1.1 million (2024: €2.3 million) from past acquisitions.
EBITDA, depreciation, amortization and impairment and EBIT
EBITDA was €118.7 million in 2025, down by €15.4 million from €134.0 million in 2024 due to above-mentioned effects.
Depreciation, amortization and impairment has decreased by €1.6 million to €35.7 million in 2025, as against €37.3 million in 2024,
mainly due to decrease in amortization of right of use assets. The decrease in EBITDA was largely passed on to the EBIT. EBIT was
€83.0 million (8.3% of revenue) in 2025, down by €13.7 million from €96.7 million (10.0% of revenue) in 2024.
Interest expense, net
Interest expense was €20.1 million in 2025, down by €1.1 million from €21.1 million in 2024 mainly due to decrease in interest
expense on syndicated loan on account of repayments and decrease in interest rate during the year. This has been offset by increase in
lease liabilities in 2025 primarily on account of new office space taken on lease in India.
Interest income was €2.5 million in 2025, down by €1.0 million from €3.5 million in 2024 mainly due to decrease in cash
balances primarily on account of purchase of treasury shares and repayment of syndicated loan during the year.
Income taxes
Income tax expense was €26.0 million (39.7% of EBT) in 2025, down by €4.0 million from €29.9 million (37.9% of EBT) in 2024.
Deferred tax income has increased by €10.5 million mainly on account of increase in deductible temporary differences arising from
provision of post-retirement benefits due to the implementation of new Labour Codes in India, interest carryforwards and unrealized
foreign exchange loss on intra-group loans within Nagarro Group. This has been offset by increase in current tax expense by €6.5 million
mainly on account of non-creditable tax withholding on payment of intra-group transfer of dividend within the Nagarro Group
amounting to €5.5 million.
Net profit
Net profit was €39.5 million in 2025, down by €9.7 million from €49.2 million in 2024.
Earnings per share
Basic earnings per share based on weighted average of shares outstanding decreased to €3.08 in 2025, compared to €3.69
in 2024. Basic earnings per share based on total shares outstanding decreased to €3.18 in 2025, compared to €3.69 in 2024. Diluted
earnings per share based on weighted average of shares outstanding decreased to €3.08 in 2025, compared to €3.69 in 2024. Diluted
earnings per share based on total shares outstanding decreased to €3.18 in 2025, compared to €3.69 in 2024. Dilution effect is mainly
due to share-based payment arrangements, wherein the exercise price of equity-settled share options is higher than the average market
price for the years 2025 and 2024.
20
Section A –Combined Management Report
Nagarro has operations in 38 countries in which it pays its colleagues and vendors in various currencies. The top 5 currencies
based on the domicile of respective entities that contributed significantly to our expenses (net of operating income) including taxes
but excluding foreign currency income and expenses are listed below (in € million).
Expenses
currency
2025
mEUR
2024
mEUR
INR
373.4
379.6
EUR
245.6
232.7
USD
112.1
123.0
RON
54.7
58.1
TRY
26.9
27.9
D. Financial position
Fundamentals of financial management
Financial management is designed to ensure financial stability, flexibility and, in particular, the Group's liquidity at all times. It
includes the management of the financing structure, liquidity management and the monitoring and management of market price risks
such as exchange rate and interest rate risks.
Capital structure
For the purpose of Nagarro’s capital management, capital includes issued capital, and all other equity reserves attributable to
the equity holders of Nagarro. The primary objective of Nagarro’s capital management is to maximize the shareholder value. Nagarro
manages its capital structure and makes adjustments in light of changes in economic conditions and the requirements of the financial
covenants. To maintain or adjust the capital structure, Nagarro may adjust the dividend payment to shareholders or buy-back its own
shares and redemption of treasury shares.
As such, Nagarro has retained flexibility to improve investors’ participation in the Company’s operational successes via
opportunistic share buy-backs and the intention to pursue a sustainable dividend policy of distributing 10-20% of Nagarro’s IFRS EBIT
every year. Redemption of treasury shares does not have any impact on the capital structure. For further details on equity, refer
C.11. Equity of section B.
Since September 23, 2022, Nagarro SE has had a Euro-denominated revolving syndicated credit facility agreement with five
European credit institutions amounting to €350 million with an option to further increase the loan facility amount to €450 million. The
term of the financing arrangement is five years, which can be extended twice by one year each (5+1+1). This loan carries a floating
interest rate based on three-month or six-month Euribor (depending upon the interest period) plus an applicable margin based on
total net leverage. The applicable margin as at December 31, 2025 was 1.75% (2024: 1.75%). The unutilized portion of the loan carries
interest at 35% of the margin interest rate of the utilized loan.
Nagarro’s syndicated loan has a covenant package which includes customary restrictions on total net leverage, minimum
equity thresholds for pre-agreed milestones, permitted disposal and acquisitions, permitted financial indebtedness, guarantees,
dividend payments, change of control and timely submission of the consolidated group financial statements to the banks together with
a covenant statement by April 30 following the end of financial year. In general, a breach of financial covenants, non-payment of interest
amounts payable, any non-compliance with the provisions of the loan agreement and insolvency of the Company, carry the risk of
breaching the covenant package, which if not cured within the remedy period, will lead to a default on the credit facility. The covenant
for net leverage i.e., the ratio of net debt to Adjusted EBITDA, as defined in the loan agreement, requires that net leverage should not
exceed 3.5 and that a minimum equity of €100 million should be maintained, both of which the Company monitors to ensure its
compliance. There is currently no breach of either of the two covenants.
Also, the facility has the possibility to issue Schuldscheine (promissory notes) or similar instruments for a volume of up to
aggregate €125 million. Further, the non-recourse factoring is limited to 15% of the value of assets of the Group.
The unutilized credit from the revolving syndicated credit facility amounted to €45.5 million (December 31, 2024:
€30.5 million). Further, there is an option to increase the loan by an additional €100 million. There are also bilateral credit lines related
to non-recourse factoring, as mentioned above, amounting to €111.4 million (December 31, 2024: €119.4 million), of which
€34.3 million (December 31, 2024: €25.3 million) had been drawn down as of December 31, 2025.
21
Section A –Combined Management Report
We target a balanced debt-to-equity ratio and equity-to-total assets ratio that preserves flexibility for the Company, allowing
it to react to business opportunities and to changes in macroeconomic conditions.
Net debt is total liabilities to banks plus lease liabilities less cash. Net debt to adjusted EBITDA is net debt divided by adjusted
EBITDA. The net debt increased by €66.0 million to €257.5 million (net debt to adjusted EBITDA ratio of 1.9x) as of December 31, 2025,
as against €191.5 million (net debt to adjusted EBITDA ratio of 1.3x) as of December 31, 2024.
Debt-to-equity ratio is calculated as total liabilities divided by equity. The debt-to-equity ratio was 3.8 as of December 31,
2025, as against 2.6 as of December 31, 2024. Equity to total assets ratio is calculated as equity divided by total assets. The equity to
total assets ratio has decreased by 7 percentage point to 21% as of December 31, 2025, as against 28% as of December 31, 2024. Equity
decreased mainly due to purchase of treasury shares amounting to €67.8 million, dividend payment amounting to €12.6 million and
negative other comprehensive income (OCI) amounting to €27.4 million (mainly due to negative impact of foreign currency related to
translation of group entities’ balance sheet items from their functional currency to the Group’s presentation currency on the reporting
date) which has been offset by positive current year’s profits amounting to €39.5 million.
The details for net debt, debt ratio, debt-to-equity ratio and equity ratio are below:
Dec 31, 2025
Dec 31, 2024
mEUR
mEUR
Liabilities to banks
310.1
329.6
Lease liabilities
72.1
54.5
Cash
(124.6)
(192.6)
Net debt
257.5
191.5
Adjusted EBITDA
138.2
147.5
1.9
1.3
Total liabilities
587.9
573.0
Equity
155.0
222.7
3.8
2.6
Total assets
743.0
795.7
Equity
155.0
222.7
Equity ratio
(% of total assets)
21%
28%
Debt ratio (Net debt to Adjusted EBITDA)
Debt-to-equity ratio (Debt to equity)
Capital expenditure
We target a low capital expenditure as a ratio of revenues and take the benefit of leasing services for procuring computers
and equipment, and for buildings. Our cash outflow on net capital expenditure was €7.7 million (0.8% of revenue) in 2025 against
€7.2 million (0.7% of revenue) in 2024.
22
Section A –Combined Management Report
Liquidity
Net cash inflow/ (outflow) for the period:
(55.4)
79.5
102.8
86.5
9.9
(22.1)
(16.8)
(136.2)
2024
2025
Investing
activities
Financing
activities
Operating
activities
Our total cash outflow was €55.4 million in 2025 against an inflow of €79.5 million in 2024.
Our operating cash flow increased by €16.3 million from €86.5 million in 2024 to €102.8 million in 2025. Main impact for this
increase comes from other non-cash income and expenses amounting to €15.6 million (majorly due to unrealized foreign exchange
loss on intra-group loans within Nagarro Group amounting to €13.6 million, expenses for foreign exchange forward transactions
amounting to €2.8 million, offset by decrease in share based payment arrangements cost amounting to €3.6 million) and change in
long-term employee benefits liabilities amounting to €9.9 million mainly due to the implementation of new Labour Codes in India.
Further, better collections in 2025 increased operating cash flows from changes in net working capital by €7.5 million. The increase in
operating cash flows has been offset by increase in payment of income taxes amounting to €10.2 million mainly due to withholding
taxes paid on intra-group transfer of dividend within Nagarro Group.
Further, we increased the utilization of funds under the non-recourse factoring program by €8.8 million in 2025 compared to
2024 (increase in factoring utilization of €2.3 million in 2025 against reduction of €6.5 million in 2024). Operating cash flow adjusted
for changes in factoring (including interest on factored amounts) was €100.5 million in 2025 as compared to €93.1 million in 2024.
Days of sales outstanding, calculated based on quarterly revenue and including both contract assets and trade receivables, has
improved from 88 days on December 31, 2024 to 82 days on December 31, 2025. This also reflects the increase in factoring volume.
The cash outflow from investing activities in 2025 was €22.1 million as compared to an outflow of €16.8 million in 2024. Cash
outflow increased mainly on account of decrease in cash inflow from fixed deposits amounting to €5.5 million. Cash outflow in 2025 is
mainly due to the payment for acquisition obligations of €16.1 million after adjusting for cash acquired from the acquisitions
(€10.8 million for acquisition of CHTS group, €1.0 million for acquisition of IDS group, €0.6 million for acquisition of Marlo, Australia,
€0.3 million for Notion Edge, France and payment of acquisition obligations of €3.5 million from older acquisitions - Infocore:
€1.8 million, RipeConcepts: €1.1 million and FWD View: €0.6 million), and purchase of intangible assets and property, plant and
equipment of €7.8 million. This outflow has been offset by interest received on fixed deposits amounting to €2.5 million.
The cash outflow from financing activities in 2025 was €136.2 million as compared to an inflow of €9.9 million in 2024. Cash
outflow increased in 2025 primarily on account of purchase of treasury shares amounting to €67.8 million, net repayment of bank loans
by €67.2 million (as in 2025 there is a net repayment of bank loans amounting to €15.6 million against net inflow of €51.6 million in
2024) and dividend paid during the year amounting to €12.6 million.
23
Section A –Combined Management Report
Countries with the top 5 bank balances are listed below:
Countries
Dec 31, 2025
Dec 31, 2024
mEUR
mEUR
Germany
53.4
93.5
United States of America
14.6
11.4
India
6.2
36.8
Austria
5.9
4.3
Romania
5.1
5.8
E. Net assets
Figures in €m
795.7
743.0
43.4
44.4
53.3
69.9
56.9
78.2
192.6
124.6
573.0
48.2
46.2
72.1
54.5
157.6
142.7
310.1
329.6
214.2
206.4
235.3
219.4
2025
587.9
Assets
2024
Trade receivables & contract assets
Goodwill
Cash and cash equivalents
Other assets
Right of use assets
Intangible assets
2025
Liabilities
2024
Loans and borrowings
Other liabilities
Lease liabilities
Other financial liabilities
Total assets declined by €52.7 million to €743.0 million as of December 31, 2025, as against €795.7 million as of December
31, 2024. Of these, non-current assets increased by €20.7 million to €361.3 million as of December 31, 2025, as against €340.7 million
as of December 31, 2024. Within non-current assets, right of use assets from leases increased by €16.7 million (addition of €51.0 million,
mainly leased properties of €37.8 million, servers and laptops of €8.5 million and leased vehicles of €4.7 million, hyperinflationary
adjustment in Türkiye of €0.4 million, offset by depreciation of €22.7 million, net disposals of €8.9 million and currency translation loss
of €4.7 million). Addition to leased properties primarily represents new office space taken on lease in India. Further, deferred tax assets
increased by €10.4 million to €26.9 million as of December 31, 2025, as against €16.5 million as of December 31, 2024 mainly on
account of increase in provision of post-retirement benefits due to the implementation of new Labour Codes in India, interest
carryforwards and unrealized foreign exchange loss on intra-group loans within Nagarro Group. This increase has been offset by
decrease in goodwill of €7.9 million (primarily on account of currency differences mainly because of weakening of the US dollar against
the Euro, offset by goodwill recognized on acquisition of CHTS amounting to €9.6 million, IDS amounting to €0.9 million, Marlo
amounting to €0.7 million, and Notion Edge amounting to €0.3 million). Further, intangible assets increased by €1.0 million to
€44.4 million (mainly due to increase in assets from business acquisitions of €7.9 million, additions of €5.2 million of intangible assets
and hyperinflationary adjustment in Türkiye of €1.7 million which has been offset by currency differences amounting to €6.0 million on
24
Section A –Combined Management Report
account of translation of assets because of strengthening of Euro against the currencies in which these assets are held and amortization
of €7.8 million).
Current assets declined by €73.4 million to €381.6 million as of December 31, 2025, as against €455.0 million as of December
31, 2024, mainly on account of decrease in cash and cash equivalents by €68.0 million to €124.6 million as of December 31, 2025 as
against €192.6 million as of December 31, 2024. Further, trade receivables also decreased by €21.1 million primarily due to decrease in
receivables from certain public sector customers due to collection of aged receivables and on account of increase in net factoring
utilization of €9.0 million. The same has been offset by increase in contract assets by €5.2 million (mainly related to public sector
customers), increase in income tax receivables by €5.0 million to €11.5 million as of December 31, 2025 as against €6.4 million as of
December 31, 2024 due to advance tax payments in 2025, and increase in other current financial assets by €3.8 million primarily on
account of increase in receivable from factor.
Total liabilities grew by €14.9 million to €587.9 million as of December 31, 2025, as against €573.0 million as of December 31,
2024. Out of these, non-current liabilities increased by €16.1 million to €420.0 million as of December 31, 2025, as against €403.9 million
as of December 31, 2024 mainly on account of increase in non-current lease liabilities by €17.7 million primarily on account of new
office space taken on lease in India. Further, employee benefits liabilities increased by €11.2 million mainly on account of increase in
provision of post-retirement benefits in India due to the implementation of new Labour Codes. This increase has been offset by net
repayment of part of the bank loan amounting to €15.6 million.
Current liabilities decreased by €1.2 million to €167.9 million as of December 31, 2025, as against €169.1 million as of
December 31, 2024 primarily due to decrease in factoring liabilities by €6.5 million, decrease in short term employee benefits liabilities
by €1.8 million (mainly on account of reduction in fair values of cash-settled SOPs and earnout liabilities), and other current liabilities
by €1.3 million. This has been offset by increase in liabilities from acquisitions by €2.5 million, trade payables by €2.0 million, other
financial liabilities by €1.8 million and income tax liabilities by €0.8 million.
The Company’s liquidity position at the end of 2025 was comfortable. The current assets were €381.6 million, of which cash was
€124.6 million. The current liabilities were €167.9 million, yielding a working capital of €213.7 million.
Net assets represented by total equity declined by €67.6 million to €155.0 million as of December 31, 2025, as against
€222.7 million as of December 31, 2024. Equity decreased mainly due to purchase of treasury shares amounting to €67.8 million,
dividend payment amounting to €12.6 million and negative other comprehensive income (OCI) amounting to €27.4 million (mainly
due to negative impact of foreign currency related to translation of group entities’ balance sheet items from their functional currency
to the Group’s presentation currency on the reporting date) which has been offset by positive current year’s profits amounting to
€39.5 million.
F. Overall statement on the economic situation
Throughout the 2025 fiscal year and into the current reporting period, Nagarro demonstrated positive operational
performance. While the macroeconomic environment remained relatively stable, the company performed well and leveraged its
diversified portfolio and high talent retention rates to navigate market headwinds. Nagarro’s performance was tempered by broader
industry challenges, including sustained spending pressures and a continued slowdown in new project commissions.
25
Section A –Combined Management Report
IV. Corporate governance statement
(pursuant to Section 289f HGB for Nagarro SE and Section 315d HGB for the Group as part of the combined management report,
unaudited)
A. Our approach to corporate governance
The prime objective of Nagarro’s corporate governance is to facilitate the ethical, effective, agile and pragmatic management
of the Company to deliver sustainable long-term success for all stakeholders.
As a global company, Nagarro places a strong emphasis on responsible corporate governance. Our core values, based on the
acronym “CARING” are our guiding principles across the globe. CARING stands for a humanistic way of thinking and nurturing, with a
strong emphasis on ethics.
The Nagarro Constitution is our code of conduct, which is designed to be easy to understand and easy to apply. It is written in
the form of a declaration in the first-person, and includes sections on our core values, dealing with personal data and privacy, intellectual
property, discrimination and harassment, conflicts of interest, unfair competition and corruption, and the special responsibility of
management. The Nagarro Constitution is meant to circumscribe and guide the actions of every Nagarrian. The Company has its internal
controls and internal compliance assessments, and encourages whistleblowers to speak up, whether openly or anonymously.
The Nagarro Constitution and the Whistleblower Policy can both be found on Nagarro's website under Corporate Governance.
Nagarro’s management sees itself as a trustee of the shareholders and is committed to building value in the Company in a
sustainable manner. It is also committed to keeping shareholders well-informed through frequent, reliable, and transparent
communication. Nagarro has three formal bodies – the Management Board, the Supervisory Board and the Annual General Meeting.
The responsibilities and powers of these governing bodies are determined by the law on the implementation of the European Council
Regulation on the Statute for a European company (Societas Europaea or SE), the SE Implementation Act and the SE Participation Act,
the AktG, the recommendations of the German Corporate Governance Code to the extent we comply with it, the Articles of Association,
and the rules of procedure of the Management Board and Supervisory Board. While Nagarro is a European company, features of a
German stock corporation have been retained, in particular, the dualistic management system consisting of a management board and
a supervisory board.
The cooperation between the Management Board and the Supervisory Board is characterized by trust and dialogue.
B. Declaration of conformity with the German Corporate
Governance Code
Declaration of Conformity pursuant to Sec. 161 of the German Stock Corporation Act (AktG):
The Management Board and Supervisory Board of Nagarro SE (hereinafter referred to as the “Com-pany”) declare pursuant to
Sec. 161 para. 1 sentence 1 of the German Stock Corporation Act (AktG) that the Company, since the issuance of the last declaration of
conformity in April 2025 and since the update and supplementation of the declaration of conformity in July 2025, has complied with
the recommendations of the German “Government Commission on the German Corporate Governance Code”, as published by the
Federal Ministry of Justice and Consumer Protection in the official section of the German Federal Gazette, as amended on April 28, 2022
and published in the German Federal Gazette on June 27, 2022 (“GCGC”), with the following deviations:
1.
B.5, C.2 (Age limit for Management Board and Supervisory Board)
Decisions on the selection of suitable candidates for appointment as members of the Management Board or Supervisory Board
are made exclusively on the basis of professional qualification in accordance with the principle of equal treatment. There are no age
limits for the members of the Management Board (recommendation B.5 GCGC) and the Supervisory Board (recommendation C.2
GCGC) and, accordingly, these are not specified in the Corporate Governance Statement. The Management Board and Supervisory
Board consider it appropriate for the corporate body responsible for appointments to consider the age of the candidates at the time
of their initial appointment or reappointment and to have the option of drawing on the particular professional and life experience of
older candidates, without being bound by strict age limits.
26
Section A –Combined Management Report
2.
F.2 (Publication of consolidated financial statements and group management report)
The consolidated financial statements and the group management report are not yet publicly availa-ble within 90 days of the
end of the financial year. This is not yet possible due to the necessary con-solidation of a large number of subsidiaries in Germany and
abroad. For this reason, this was also not yet possible for the consolidated financial statements and the group management report for
the 2025 financial year. However, the Management Board and Supervisory Board aim to publish the consoli-dated financial statements
and group management reports in the future within the recommended period of 90 days after the end of the financial year.
3.
G.9 sentence 1 (Determination of the amount of variable remuneration)
Given the structure of the remuneration system, the amount of the remuneration components to be granted individually is not
determined for all remuneration components after the end of each financial year. Short-term variable remuneration in the form of the
organizational bonus is granted on a quarterly basis, using exclusively objectively measurable criteria. This ensures a corresponding
synchronization of the remuneration of the Management Board with the quarterly organizational bonus program, which has been
introduced for the majority of employees throughout the Nagarro Group. For the long-term variable remuneration in the form of
Performance Based Restricted Stock Units (PB RSUs), target achievement is only determined after the end of the four-year performance
period. This serves to focus on a long-term and sustainable development of the Company and aligns the targets for Management Board
remuneration with the interests of the shareholders.
4.
G.11 sentence 2 (Retention and reclamation of variable remuneration)
The existing Management Board service contracts do not contain provisions regarding the retention or reclamation of variable
remuneration components that go beyond the statutory requirements. The Supervisory Board is of the opinion that the statutory
provisions, in particular the statutory provisions according to which members of the Management Board are obliged to pay damages
in the event of breaches of duty and to surrender any unjustified payments, are sufficient and that additional interventions are therefore
currently not necessary.
The Management Board and Supervisory Board of the Company further declare pursuant to Sec. 161 para. 1 sentence 1 AktG
that the Company will continue to comply in the future with the recommendations of the GCGC, with the exception of the deviations
from recommendations B.5, C.2, F.2, G.9 sentence 1 and G.11 sentence 2, as described above.
Munich, April 2026
For the Management Board:
For the Supervisory Board:
Annette Mainka
Member of the Management Board of
Nagarro SE
Christian Bacherl
Chairperson of the Supervisory Board of
Nagarro SE
C. Shareholders and Annual General Meeting
The shareholders of Nagarro exercise their rights at the Annual General Meeting (“AGM”).
The Annual General Meeting of Nagarro SE’s shareholders will ordinarily be held within the first six months of each financial year
and can be convened by the Management Board or the Supervisory Board.
Per the Articles of Association, all shareholders who have registered prior to the general shareholders’ meeting and are
registered in the share register are entitled to participate in the general shareholders’ meeting and exercise their voting rights. Each
share confers one vote at the general shareholders’ meeting of Nagarro SE. Voting rights may be exercised by proxy.
The chairperson of the Supervisory Board or another person appointed by him or her, who is not a member of the Management
Board, chairs the general shareholders’ meeting.
The resolutions of the Annual General Meeting are generally passed by a simple majority vote. This also applies to resolutions
on amendments to the Articles of Association if at least half of the capital stock is represented at the Annual General Meeting, otherwise
a majority of two thirds is required. Certain resolutions of fundamental importance mandatorily require a majority of at least 75% of the
share capital represented at the vote. Such resolutions include but are not limited to, creation of authorized capital, reduction of capital,
and liquidation, etc. Neither German or European law nor the Articles of Association limit the right of foreign shareholders or
shareholders not domiciled in Germany to hold shares or exercise the associated voting rights.
Notice of the meeting along with relevant documents are published in the German Federal Gazette and are available on the
Company’s website.
27
Section A –Combined Management Report
The AGM was held in Munich on June 30, 2025.
In accordance with the Exchange Rules of the Frankfurt Stock Exchange, the Company is obliged to prepare, continuously
update, publish and transmit a Financial Calendar with information on the AGM, analyst meetings, participation in conferences and
roadshows, and various other publications. The Financial Calendar can be accessed on Nagarro’s website.
D. Composition and working of the Management Board
Nagarro follows a dualistic system in its corporate governance structure, whereby the Management Board manages the
Company independently and the Supervisory Board focuses on its fundamental role as a supervisory body for the activities of the
Management Board. The members of the Management Board are appointed by the Supervisory Board, which in turn is appointed by
the Annual General Meeting. The Management Board is obliged to report regularly to the Supervisory Board about the Company’s
business, and at least once a year on key topics such as business activities, corporate planning, and budgeting. The Management Board
is obliged to take into consideration the shareholders’ rights to equal treatment and equal access to information
Composition and Diversity
Under the Articles of Association, the Management Board consists of one or more persons. The Supervisory Board determines
the specific number of members of the Management Board. The Supervisory Board may appoint members of the Management Board
for a maximum term of up to six years. Reappointments or extensions, each for a maximum term of up to six years, are permissible. The
Supervisory Board may revoke for good cause the appointment of a member of the Management Board prior to the expiration of the
relevant member’s term.
The members of the Management Board must possess all qualifications and competencies required to properly fulfil its legal
and statutory obligations. Therefore, personal qualifications, professional suitability and expertise are the decisive factors for the
appointment of members of the Management Board. In addition, Nagarro believes that a focus on diversity and inclusion is required
for the continued successful development of the Company and of the society. The composition of the Management Board is meant to
reflect to some extent the Company’s underlying diversity. As its target for the proportion of women on the Management Board by
December 31, 2027, the Supervisory Board has stipulated that the Management Board should continue to include at least one female
member. During the year 2025, the Management Board at all times had at least one female member and at least one male member.
When selecting new members for the Management Board, the Company is committed to considering qualified female candidates – a
continuation of its existing practice of promoting women to senior positions.
On this basis, the Supervisory Board works together with the Management Board to ensure long-term succession planning. In
the event that candidates for the position of member of the Management Board are sought, the abovementioned factors are the
decisive selection criteria, in addition to the legal requirements and the recommendations of the German Corporate Governance Code.
The succession planning process particularly includes the Supervisory Board’s consideration of the composition of the Management
Board, the definition of position-specific requirement profiles, and the structured identification and assessment of potential candidates.
Both internal development opportunities and external search processes are taken into account. The Management Board is responsible
for the operational execution of search processes, particularly with regard to external candidates, and is supported by external advisors
where appropriate. The Supervisory Board closely oversees the process and makes the final decision on appointments.
Women form 28% of the total organization, 26% among engineers, and our leadership is comprised of 20% women as of the
end of the reporting year 2025 (2024 year-end: 21%). We target women making up 25% of our leadership by December 31, 2026, where
leadership is defined as the management level below the Management Board. Nagarro's organizational structure provides for only one
leadership and management level below the Management Board.
Rules of procedure
The rules of procedure of the Management Board define, among other things, the principles of management to be followed,
the overall responsibility of the Management Board, the allocation of responsibilities of the various members, and the Management
Board’s internal organization.
The members of the Management Board are jointly responsible to the shareholders and to the Supervisory Board for the
Company’s overall management and for working towards its long-term success. Beyond this joint responsibility, each member of the
Management Board independently assumes personal responsibility for specific areas. Notwithstanding the allocation of
responsibilities, the principle of joint responsibility of the Management Board continues to apply.
Nomenclature is used to reinforce culture for the Management Board roles. The Chairperson of the Management Board is the
Custodian of Entrepreneurship in the Organization and will be usually referred to as such externally. The Custodian of Entrepreneurship
in the Organization is responsible for the coordination of all executive functions in line with the objectives of the Company and with the
Nagarro Constitution. The Custodian of Entrepreneurship in the Organization also coordinates with the Chair of the Supervisory Board,
28
Section A –Combined Management Report
represents the Company to the public, and decides on the roles, remuneration, hiring and relieving of senior management personnel
outside the Management Board.
The member of the Management Board designated as the Custodian of Operational Excellence in the Organization decides on
topics related to the preparation of the annual budgets, where required by the Supervisory Board or by law, and the financial
statements.
The member of the Management Board designated as the Custodian of Regulatory Compliance in the Organization decides on
topics related to compliance with regulations.
Since the Management Board currently consists of only three members, it was decided not to establish separate committees.
The relevant committee topics were managed by the members of the Management Board. The Management Board is obliged to carry
on the business of the Company in compliance with the respective applicable legal regulations, the German Corporate Governance
Code in its most current version (except with deviations disclosed in the declaration of conformity in accordance with section 161 of
the AktG), the Articles of Association of the Company, the Nagarro Constitution (our internal code of conduct) in its most current version,
the management contracts, and the resolutions of the Supervisory Board and the Annual General Meeting. In doing so, the Management
Board is bound by the Company’s interests and obligated to work towards increasing the Company’s lasting value.
The Management Board coordinates with the other senior management members to define the Company’s strategic direction,
coordinates it with the Supervisory Board and again coordinates with the other senior management members to ensure its
implementation.
Service agreement and remuneration
Each of the three members of the Management Board entered into a service agreement with the Company in 2020 governed
by German law and based on substantially similar terms. These agreements were extended in 2023 for three more years, beginning on
November 1, 2023 and expiring on October 31, 2026.
The Management Board members have undertaken to not work for or participate in any business for their own or third-party
account with any competitor in the Company’s line of business in accordance with Section 88 of the AktG. They shall dedicate their
working capacity and their best efforts to promote achievement of the Company’s objectives. Any other occupation, including
assumption of any office of supervisory boards or advisory bodies, with or without remuneration, will require approval by the
Supervisory Board.
For further details on the remuneration of the Management Board - in particular the individual payments made in and for the
financial year 2025 please refer to the detailed Nagarro remuneration report 2025. The remuneration report was subject to a formal
audit by the auditor. The Nagarro remuneration report 2025 and the auditor’s report are available on Nagarro’s website under
https://www.nagarro.com/en/investor-relations/financial-reports-and-publications.
Shareholdings in Nagarro SE
As of December 31, 2025, no member of the Management Board held, directly and indirectly, more than 10.00% of the shares
in the Company.
Information regarding any reportable securities transactions, pursuant to Article 19 of the EU Market Abuse Regulation, by any
Management Board member is made public promptly and disclosed on the Company’s website.
E. Composition and working of the Supervisory Board
Composition
The Supervisory Board consisted of seven members on 31 December 2025 following the expansion of the Supervisory Board
and appointment of three new members by the AGM on June 30, 2025. They represent the shareholders and are appointed by the
shareholders for staggered terms until the Annual General Meeting in 2026, 2027 and 2028. Members may be re-elected. A substitute
member may be appointed to replace any Supervisory Board member who leaves prior to the end of his/her term. It may be noted that
Nagarro is not required to establish a co-determined Supervisory Board (i.e., with worker participation).
The Company targets that the Supervisory Board includes at least one female member in the period until December 31, 2027.
This target was met in 2025.
29
Section A –Combined Management Report
Proposals by the Supervisory Board to the Annual General Meeting take the specific objectives determined by the Supervisory
Board for its composition into account and simultaneously aim at fulfilling the overall profile of required skills and expertise for the
entire Supervisory Board. The implementation status is hereinafter disclosed in the form of a qualification matrix:
Dr. Martin
Enderle
Period of affiliation Member since
Personal suitability
Diversity
Dr. Shalini
Sarin
Dr. Hans-Paul Jack Clemons
Bürkner
Carl Georg
Dürschmidt
Feb-2020 until
Apr-2025 and
again since Jul2025
Nov-2022
Jun-2023
Oct-2020
Jul-2025
Jul-2025
Independence2
No overboarding2
Year of birth
1965
1973
1972
1965
1952
1966
1958
Gender
Male
Male
Male
Female
Male
Male
Male
German
German
US-American
Indian
German
Swiss, British
German
Europe
North/South/Central
America
India
Asia/Pacific
Financial expert3
Professional
suitability
Vishal Gaur
Jul-2025
Nationality
International
experience
1
Christian
Bacherl
Management
experience
Technology
Digitalization/IT
Transformation
Innovation/R&D
Finance
Legal/Compliance
Risk management
Personnel/
Employee
commitment
Business area/
Sector familiarity
M&A
ESG/ Sustainability
reporting
1
Dr. Martin Enderle has resigned from his office as member and Chairperson of the Supervisory Board with effect as of the expiry of 31 December 2025.
Within the meaning of the GCGC.
3
Within the meaning of Section 100 (5) AktG and Recommendation D.3 of the GCGC.
✓ = Criterion fulfilled; based on a self-assessment by the Supervisory Board and taking into account the respective individual assessment of the proposed candidates, a tick means
at least "good knowledge" and therefore the ability to understand the relevant issues well and make informed decisions on the basis of existing qualifications, the knowledge and
experience acquired as part of their work as a Supervisory Board member (e.g. many years of work on the audit committee) or the training measures regularly attended by all
Supervisory Board members.
2
30
Section A –Combined Management Report
The Supervisory Board consists exclusively of shareholder representatives. In the Supervisory Board’s opinion, it includes an
appropriate number of independent members as defined by the GCGC. The ownership structure of the company was taken into
account.
Out of seven members by 31 December 2025, six members are considered independent by the company and the Management
Board. Independence was assessed in accordance with recommendations C.6 and C.7 of the GCGC.
Dr. Shalini Sarin, Christian Bacherl, Dr. Hans-Paul Bürkner, Jack Clemons, Dr. Martin Enderle, and Vishal Gaur are considered
independent. Carl Georg Dürschmidt is not considered independent due to his position as a major shareholder.
The Supervisory Board shall elect a chairperson and a deputy chairperson from among its members to serve for the duration of
those members’ terms.
The Supervisory Board has formed an audit committee, a strategy committee and a nomination & remuneration committee.
The audit committee is assisting the Supervisory Board in its monitoring of various financial aspects of Nagarro, in particular the
accounting process, the effectiveness of the internal control system, the risk management system, internal audit as well as the audit of
the financial statements and the selection and independence of the auditor. The audit committee is constituted by three Supervisory
Board members and Jack Clemons serves as its Chairperson. In accordance with the applicable legal requirements and further in line
with the recommendations of the GCGC, the committee members have the required expertise in accounting, auditing, and
sustainability reporting, including the audit thereof. The members of the Audit Committee, Jack Clemons and Christian Bacherl, are
each considered experts in accounting and auditing within the meaning of Section 100 (5) AktG. Jack Clemons is a Chartered
Accountant (ICAEW) and holds an M.A. and an MBA. He works as an independent advisor with extensive international experience in
finance, strategy and corporate governance. He previously served as CEO and CFO and began his career as an auditor at an international
consulting and audit firm. Christian. Bacherl, Deputy Chairperson, has a degree in business administration. He is a former banker
specializing in equity capital markets and board member of a German banking institution, where he gained expertise in financial topics
including accounting and auditing, including sustainability reporting and its audit. Vishal Gaur is the audit committee’s third member
and brings expertise in the areas of technology and digitalization/IT as well as extensive business area and sector familiarity, particularly
in supply chain and e-commerce.
The audit committee maintains a regular dialogue with the auditor. The auditor reports on significant findings arising from the
audit. In particular, the audit committee discusses the audit strategy, audit planning and key audit matters as well as the results of the
audit with the auditor. The Chairperson of the audit committee also maintains regular contact with the auditor between meetings and
reports to the audit committee on the progress of the audit. In addition, the audit committee regularly meets with the auditor without
the Management Board.
The strategy committee supports the Supervisory Board in overseeing Nagarro’s long-term strategic direction and evaluating
key initiatives that shape the Company’s future positioning. Its responsibilities include reviewing and advising on corporate strategy,
market positioning, mergers and acquisitions (M&A) and emerging industry trends, particularly in areas such as AI, digital
transformation, and global service delivery. The strategy committee acts as a sounding board for the Management Board, providing
guidance and challenge on strategic proposals while ensuring alignment with shareholder interests. Dr. Hans-Paul Bürkner serves as
Chairperson of the strategy committee, bringing decades of international experience in strategic consulting for global companies,
particularly in the financial services sector. He studied economics, holds an M.A., and previously served as CEO and Global Chair of a
top-tier strategy consulting firm. His expertise includes global transformation, governance, corporate strategy, and organizational
scaling, which he now contributes in his leadership role within the committee. Christian Bacherl serves as Deputy Chairperson of the
strategy committee, bringing entrepreneurial and board-level experience with a strong focus on capital markets and corporate
development. Also Dr. Martin Enderle was a member of the strategy committee until 31 December 2025.
The nomination & remuneration committee assists the Supervisory Board in matters related to board composition, succession
planning, and the design and oversight of executive remuneration systems. Its responsibilities include identifying and recommending
candidates for appointments to the Management Board and Supervisory Board, evaluating board diversity and skills matrices, and
ensuring that compensation structures are aligned with long-term Company performance and shareholder value. The committee also
oversees the implementation and ongoing evaluation of the remuneration system, including fixed and variable components, long-term
incentives, and compliance with the GCGC. Dr. Martin Enderle chaired the nomination & remuneration committee. Dr. Shalini Sarin
serves as Deputy Chairperson of the committee. She holds a doctorate in Organization Behavior and double Masters in Sociology and
Human Resource Management, along with certifications in Advanced Human Resources, Executive Coaching, and Psychometrics. With
over three decades of corporate experience — including roles as global chief people officer, head of global foundation, and business
leader — she brings deep expertise in organizational behavior, human resources, and corporate social responsibility, which are central
to the committee’s mandate. Also Jack Clemons is a member of the nomination & remuneration committee.
No further committees were in place and relevant committee topics were covered by the Supervisory Board members directly.
The Supervisory Board also regularly reviews its working methods and the cooperation within the committees. In the reporting year,
the Supervisory Board conducted a structured self-assessment and, based on its results, resolved to propose to the Annual General
Meeting an expansion of the Board to include additional competencies.
31
Section A –Combined Management Report
On January 7, 2026, the Supervisory Board of Nagarro SE appointed Christian Bacherl as Chairperson and Jack Clemons as
Deputy Chairperson after Dr. Martin Enderle resigned as Chairperson and member of the Supervisory Board with effect from December
31, 2025 due to health reasons. The Supervisory Board also initiated the process of searching for a candidate to fill the vacant seat on
the Supervisory Board.
The nomination & remuneration committee and the strategy committee of the Supervisory Board were also reappointed. Dr.
Shalini Sarin is the new Chairperson of the nomination & remuneration committee, Christian Bacherl is the new Deputy Chairperson,
and Jack Clemons remains a member. The strategy committee will continue to be chaired by Dr. Hans-Paul Bürkner, with Jack Clemons
as the new Deputy Chairperson and Vishal Gaur. The audit committee remains unchanged, with Jack Clemons as Chairperson, Christian
Bacherl as Deputy Chairperson, and Vishal Gaur.
Remuneration
Information on the Supervisory Board’s remuneration can be found in the Nagarro remuneration report 2025. The remuneration
report was subject to a formal audit by the auditor. The remuneration report 2025 and the auditor’s report are available on Nagarro’s
website under https://www.nagarro.com/en/investor-relations/financial-reports-and-publications.
Shareholding in Nagarro SE
As of December 31, 2025, Carl Georg Dürschmidt indirectly holds a stake of 18.9% of the total number of outstanding shares of
Nagarro SE. Information regarding any reportable securities transactions, pursuant to Article 19 of the EU Market Abuse Regulation, by
any Supervisory Board members is made public promptly and disclosed on the Company’s website.
F. Remuneration report
The remuneration report, the auditor's report in accordance with Section 162 of the AktG, the applicable remuneration system
in accordance with Section 87a (1) and (2) sentence 1 of the AktG and the last remuneration resolution in accordance with
Section 113 (3) of the AktG are shown on the Nagarro remuneration report 2025.
32
Section A –Combined Management Report
V. Takeover-related disclosures
(pursuant to Section 289a and Section 315a HGB) and explanatory report (part of the Combined Management
Report)
Composition of subscribed capital
On the reporting date of December 31, 2025, the subscribed capital of Nagarro SE of € 12,922,297.00 was divided into
12,922,297 no-par value registered shares with a notional nominal amount of EUR 1.00 per share. All the shares are of the same class
and confer the same rights and obligations. The shares are fully paid in.
Rights and obligations associated with Nagarro SE’s shares are defined in its Articles of Association, supplemented by the
Regulation (EC) No 2157/2001 on the Statute for a European company (SE), the German SE Implementation Act (SEAG) and the AktG
as well as other laws applicable to stock corporations.
Shareholdings exceeding 10 percent of the voting rights
As of December 31, 2025, Lantano Beteiligungen GmbH, Munich, Germany, directly holds a stake of 18.9% and hence 18.9% of
the voting rights in Nagarro SE. The voting rights of Lantano Beteiligungen GmbH are attributable to Carl Georg Dürschmidt (member
of the Supervisory Board), Germany (indirectly 18.9%); to Laura Maximiliane Pirkl-Dürschmidt, Germany (indirectly 18.9%); to Linda
Viktoria Müller-Dürschmidt, Germany (directly and indirectly 18.9%); and to Dr. Christa Kleine-Dürschmidt, Germany (directly and
indirectly 20.6%). No other direct or indirect stakes that exceed 10 percent of the voting rights were reported to the Company nor are
otherwise known.
Statutory regulations and provisions of the articles of association on appointing and
dismissing Management Board members and amending the articles of association
The requirements for appointing and removal of members of the Management Board and amending the Articles of Association
are defined in the provisions of the Articles of Association, the Council Regulation on the Statute for a European company, the SEAG
and the AktG. Pursuant to article 9.1 of the Articles of Association, the Management Board can be comprised of one or more members.
The number of members of the Management Board is determined by the Supervisory Board according to article 9.1 of the Articles of
Association and section 84 of the AktG.
According to article 9.3 of the Articles of Association and section 84 of the AktG, the Supervisory Board can appoint a
chairperson of the Management Board. If a required member is not present, pursuant to section 85 of the AktG, the court shall appoint
the member in urgent matters on application of a party involved.
Pursuant to article 39 of the Council Regulation on the Statute for a European company and section 84 of the AktG, the
Supervisory Board can revoke the appointment of members of the Management Board and the chairperson for cause. According to
article 9.2 of the Articles of Association, members of the Management Board are appointed for a maximum duration of six years.
Reappointments, each for a maximum of six years, are permitted.
Unless the Articles of Association or the law provide otherwise, resolutions of the Annual General Meeting shall be adopted by
a simple majority of the votes cast, pursuant to article 23.1 of the Articles of Association.
Resolutions on amendments to the Articles of Association require a majority of two thirds of the votes cast or, if at least half of
the capital stock is represented, a simple majority of the votes cast, unless mandatory statutory provisions provide otherwise.
Authorization of the Management Board to issue or repurchase shares
Authorized Capital
The general shareholders’ meeting held on June 30, 2025, authorized the Management Board to, subject to the consent of the
Supervisory Board, in the period ending on June 29, 2030, increase the registered share capital in one or more tranches by up to
€4,132,795 in the aggregate by issuing up to 4,132,795 new no-par value registered shares against cash contribution and/ or
contributions in kind.
In principle, new shares must be offered to shareholders for subscription; they may also be acquired by banks and other issuing
entities with the obligation to offer them to shareholders for subscription (indirect subscription right) [pursuant to section 186 (5) AktG].
However, the Management Board is authorized, with the approval of the Supervisory Board, to exclude shareholders' subscription rights
in whole or in part, in particular:
a)
insofar as this is necessary for fractional amounts resulting from the subscription ratio,
33
Section A –Combined Management Report
b)
in the event of capital increases in return for contributions in kind, in particular as part of business combinations or for the
(also indirect) acquisition of companies, operations, parts of companies, equity interests or other assets or claims to the
acquisition of assets including claims against the Company or its group companies - including claims by members of the
Company's Management Board under existing or future regulations on Management Board remuneration or existing or
future remuneration programs,
c)
to grant subscription rights to the holders or creditors of conversion or option rights to shares in the Company or
corresponding conversion or option obligations under bonds issued or guaranteed by Nagarro SE or its group companies
to compensate for dilution to the extent to which they would be entitled after already exercising these conversion or option
rights or fulfilling these conversion or option obligations, and
d)
if the issue price of the new shares in a capital increase against cash contributions is not significantly lower than the market
price of the Company's shares already listed on the stock exchange. The arithmetical proportion of the share capital
attributable to shares issued against cash contributions with the exclusion of subscription rights in accordance with Section
186 (3) sentence 4 AktG may not exceed 10% of the share capital. The share capital at the time this authorization becomes
effective or - if this value is lower - at the time this authorization is exercised is decisive. Shares that are issued or sold during
the term of this authorization up to the time it is exercised in direct or analogous application of this provision are to be
counted towards this limit. Shares issued or granted or to be issued or granted on the basis of a convertible bond or bond
with warrants issued during the term of this authorization with the exclusion of subscription rights in accordance with
Section 186 para. 3 sentence 4 AktG are also to be counted towards this limit.
The proportion of the share capital represented by the shares issued against cash and/or non-cash contributions in accordance
with this authorization with the exclusion of subscription rights may not exceed a total of 20% of the share capital at the time this
authorization comes into effect. This limit shall include shares that were (i) issued from conditional capital or (ii) are to be issued or
granted on the basis of a convertible bond or bond with warrants issued during the term of this authorization with the exclusion of
subscription rights.
Treasury shares
The shareholders’ meeting held on June 30, 2025 authorized the Management Board to purchase treasury shares until June 29,
2030, up to a total of 10% of the share capital existing at the time of the resolution or - if this value is lower - at the time the authorization
is exercised. The shares acquired in accordance with this authorization, together with other treasury shares previously acquired and still
held or that are attributable in accordance with Sections 71d and 71e AktG, may at no time account for more than 10% of the respective
share capital.
The purchase of shares is carried out at the discretion of the Management Board as a purchase on the stock exchange, by means
of a public purchase offer or by means of a public exchange offer for shares in a listed company within the meaning of Section 3 (2)
AktG. Public offers or public exchange offers may also be made by means of an invitation to submit offers.
If the purchase of the shares is effected on the stock exchange, the purchase price per Nagarro share (excluding ancillary
purchasing costs) may not exceed the price of a Nagarro share determined by the opening auction in Xetra trading (or a comparable
successor system) on the relevant stock exchange trading day by more than 10% or fall below it by more than 20%.
If a purchase is effected via a public purchase offer, the purchase price per Nagarro share (excluding ancillary purchasing costs)
may not exceed the average closing price of a Nagarro share in Xetra trading (or in a comparable successor system) on the fourth, third
and second stock exchange trading day prior to the decision of the Management Board on the offer or the acceptance of offers from
shareholders by more than 10% and may not fall be-low it by more than 20%.
If the acquisition is made via a public exchange offer for shares in a listed company within the meaning of Section 3 (2) AktG,
the exchange price per Nagarro share in the form of exchange shares (excluding ancillary purchasing costs) may not exceed the
relevant value of a Nagarro share by more than 10% or fall below it by more than 20%. The average closing price in Xetra trading (or in
a comparable successor system) on the fourth, third and second trading day prior to the decision of the Management Board on the
offer or the acceptance of offers from shareholders is to be used as the basis for calculating the relevant value for the Nagarro shares
and for the exchange shares. If the exchange shares are not traded in Xetra trading, the closing price of the stock exchange on which
the exchange shares achieved the highest trading volume in the previous calendar year is decisive.
The acquisition for the purpose of trading in own shares is excluded. In all other respects, the Management Board shall be
responsible for determining the purpose of the acquisition.
As of December 31, 2025, Nagarro SE held 519,600 (2024: 453,867) treasury shares. See note C.11. Equity of Section B of the
consolidated financial statements.
The Management Board is authorized to use the treasury shares purchased on the basis of the current or a previous
authorization pursuant to section 71 (1) no. 8 AktG. In accordance with the resolution of the Annual General Meeting on June 30, 2025,
34
Section A –Combined Management Report
the Management Board is authorized to use the shares purchased on the basis of the authorization for any legally permissible purpose,
in particular the following:
a)
they can be redeemed without further resolution by the Annual General Meeting. In principle, the redemption results
in a capital reduction. In accordance with Section 237 para. 3 no. 3 AktG the Management Board may also decide that
the registered share capital remain unchanged and that instead the proportion of the remaining shares in the
registered share capital be increased as a result of the cancellation pursuant to section 8 (3) AktG. In this case the
Management Board is authorized to adjust the corresponding number in the Articles of Association;
b)
they may be used in connection with share-based remuneration or employee share programs of the Company and
issued to persons who are or were in an employment relationship with the Company, as well as to members of
executive bodies of Nagarro group companies;
c)
with the approval of the Supervisory Board, they may be offered and transferred in return for contributions in kind, in
particular as part of business combinations or for the (also indirect) acquisition of companies, operations, parts of
companies, equity interests or other assets or claims to the acquisition of assets, including receivables from the
Company;
d)
they may be sold for cash with the approval of the Supervisory Board if the selling price is not significantly lower than
the market price of a Nagarro share, provided that the notional interest in the share capital attributable to the shares
used in this way may not exceed 10% of the share capital and the limit of 20% of the share capital set out in Section
186 para. 3 sentence 4 AktG is observed;
e)
they can be used to service or secure acquisition obligations or acquisition rights to Nagarro shares, in particular from
and in connection with convertible bonds or bonds with warrants issued by the Company. In addition, the
Management Board is authorized to exclude subscription rights in order to grant subscription rights to the holders or
creditors of conversion or option rights to shares in the Company or corresponding conversion or option obligations
to compensate for dilution to the extent to which they would be entitled after already exercising these rights or
fulfilling these obligations, and to use treasury shares to service such subscription rights.
The Supervisory Board is authorized to use the treasury shares acquired on the basis of this or previous authorizations pursuant
to Section 71 (1) No. 8 AktG or pursuant to Section 71d sentence 5 AktG or otherwise to service purchase obligations or purchase rights
to Nagarro shares that have been or will be agreed with members of the Management Board of Nagarro SE under existing or future
regulations on Management Board remuneration or existing or future remuneration programs.
Significant agreements of the Company subject to a change of control resulting from
a takeover bid
Certain financing agreements of Nagarro contain customary change-of-control clauses. A change of control generally occurs if
a person or group acting in concert acquires, directly or indirectly, more than 30% of the Company’s voting rights or share capital, or if
all or substantially all assets of the Group are sold outside the Group.
In such event, the Company must notify the lenders. Lenders may refuse further utilizations (other than roll-over loans) and may,
within a specified period, cancel their commitments and require early repayment of their share of all outstanding loans, including
accrued interest and other amounts due.
Potential economic effects
The exercise of these rights could result in early repayment of financial liabilities and withdrawal of committed but undrawn
facilities, which may adversely affect liquidity and financial flexibility and could require refinancing under less favorable conditions.
As of the reporting date, outstanding financial liabilities subject to such clauses amounted to €304.5 million (December 31,
2024: €319.5 million), with undrawn committed facilities of €45.5 million (December 31, 2024: €30.5 million). Accordingly, the
maximum potential liquidity impact would amount to €350.0 million (December 31, 2024: €350.0 million), plus accrued interest and
fees.
Company’s compensation agreements with Management Board members or
employees in the event of a takeover bid
Nagarro SE has not entered into any compensation agreements with members of the Management Board or employees that
especially apply in case of a takeover bid.
35
Section A –Combined Management Report
VI. Supplementary report
Please refer F.13. Events after the balance sheet date in Section B- Consolidated Financial Statements of Nagarro SE.
VII. Comments on the financial statements of
Nagarro SE
Nagarro SE, based in Munich, Germany, is the parent company of the Nagarro Group. The comments on the Nagarro Group
in earlier sections apply to Nagarro SE, unless presented differently in the following section. The Financial Statements of Nagarro SE are
drawn up in accordance with the provisions of the HGB and the relevant supplementary provisions contained in the AktG.
Nagarro SE acts as the listed managing holding company of the Nagarro Group. Cash position at year-end and retained
earnings at year-end are considered as the financial KPIs of Nagarro SE.
Business environment and review of operations
The general and sector-specific environment of Nagarro SE is essentially the same as that of the Nagarro Group and is
described in III.A. The business environment in 2025 of section A of the Combined Management Report.
Nagarro SE serves as the holding company for the global digital engineering group in the IT and software services sector. The
business activities of Nagarro SE are to provide strategic direction and centralized services to its subsidiaries like financial management,
compliance, and risk management. Nagarro SE, being listed on the Frankfurt stock exchange, manages the stock exchange related
compliance and manages the stock options’ plans (equity-settled and cash-settled) and stocks under the employee share participation
program (ESPP) for all Nagarro subsidiaries. The subsidiaries align their operations with the Group’s overall strategy and operating
model.
In our Combined Management Report for 2024, we had projected Nagarro SE’s cash position and retained earnings at the end
of 2025 to be in the region of €20 million - €40 million and €90 million - €110 million respectively. The Management Board of Nagarro
SE considers that the overall performance of Nagarro SE (excluding the acquisition of treasury shares) against its 2025 KPIs was in line
with the planning. At the reporting date, Nagarro SE’s cash position amounted to €27.3 million and retained earnings to €49.7 million.
The cash position was therefore within the projected range. Retained earnings, however, were below the guidance, primarily due to
expenses of €66.8 million incurred in connection with the acquisition of treasury shares. Excluding this effect, retained earnings would
have amounted to €117.4 million and thus slightly exceeded the projected range.
Capital structure
The basic principles of financial management at Nagarro SE are financial prudence and stability, ensuring a reasonable
profitability and assuring adequate liquidity. The Management Board works to ensure we have the right capital structure in place, that
we are managing cash and liquidity carefully, and that we are managing financial risks such as currency risks with the appropriate
instruments.
Since September 23, 2022, Nagarro SE had a Euro-denominated revolving syndicated credit facility agreement with five
European credit institutions amounting to €350 million with an option to further increase the loan facility amount to €450 million. The
terms of this syndicated credit facility and its status as of December 31, 2025, are described in detail in Section III.D. Financial position
at the end of the year.
We target a balanced debt-to-equity ratio and equity-to-total assets ratio that preserves flexibility for the Company, allowing
it to react to business opportunities and to changes in macroeconomic conditions.
Equity has increased by €27.6 million to €296.2 million as of December 31, 2025, as against €268.6 million as of December 31,
2024. Equity increased by current year’s profits amounting to €108.0 million which has been offset by purchase of treasury shares
amounting to €67.7 million and dividend payment amounting to €12.6 million.
Net debt is total liabilities to banks less cash. The net debt increased by €33.4 million to €277.2 million as of December 31,
2025, as against €243.8 million as of December 31, 2024. Net debt increased on account of decrease of €48.4 million in cash balances
to €27.3 million as of December 31, 2025, as against €75.7 million as of December 31, 2024 which has been offset by decrease in
liabilities to bank by €15.0 million to €304.5 million as of December 31, 2025, as against €319.5 million as of December 31, 2024.
Debt-to-equity ratio is calculated as total liabilities divided by equity. The debt-to-equity ratio has improved to 1.1 as of
December 31, 2025, compared to 1.5 as of December 31, 2024 due to decrease in total liabilities by €79.6 million and increase in equity
by €27.6 million. Total liabilities decreased mainly on account of decrease in amounts payable to affiliated enterprises by €60.9 million
to €2.7 million as of December 31, 2025, as against €63.6 million as of December 31, 2024. Further, provisions have also decreased by
€1.8 million to €17.7 million as of December 31, 2025, as against €19.5 million as of December 31, 2024.
Equity to total assets ratio is calculated as equity divided by total assets. The equity to total assets ratio has increased by 8
percentage points to 48% as of December 31, 2025, as against 40% as of December 31, 2024 due to decrease in total assets by
€52.0 million and increase in equity by €27.6 million. Total assets decreased mainly on account of decrease in loans receivables from
affiliated enterprises by €28.0 million to €137.9 million as of December 31, 2025, as against €165.9 million as of December 31, 2024.
Further, cash balances have also decreased by €48.4 million to €27.3 million as of December 31, 2025, as against €75.7 million as of
36
Section A –Combined Management Report
December 31, 2024. The decrease has been offset by increase in accounts receivables from affiliated enterprises by €17.3 million mainly
on account of receivables from profit transfer agreements.
The details for net debt, debt-to-equity ratio and equity ratio are below:
Dec 31, 2025
Dec 31, 2024
mEUR
mEUR
Liabilities to banks
304.5
319.5
Cash
(27.3)
(75.7)
Net debt
277.2
243.8
Total liabilities
326.7
406.2
Equity
296.2
268.6
1.1
1.5
Total assets
622.8
674.8
Equity
296.2
268.6
Equity ratio
(% of total assets)
48%
40%
Debt-to-equity ratio (Debt to equity)
Capital expenditure
There is no capital expenditure incurred by Nagarro SE in the current year. In previous year, Nagarro SE’s capital expenditure
represented an investment in a newly incorporated company in Ireland amounting to €0.1 million.
Liquidity
The Company’s liquidity position at the end of 2025 was comfortable. The current assets were €62.5 million, of which cash
was €27.3 million. The current liabilities were €21.1 million, yielding a working capital of €41.4 million.
37
Section A –Combined Management Report
Results of operations
Profit or Loss
2025
2024
0
0
0.2
6.2
Personnel expenses
(1.4)
(1.3)
Other operating expenses
(15.4)
(26.8)
Income from investments
103.6
79.6
Income from profit transfer agreements
32.2
13.0
Income from long-term loans
7.5
4.4
Other interest and similar income
1.2
0.2
Depreciation of financial assets
(10.3)
Interest and similar expenses
(12.7)
(17.0)
Result before taxes
105.1
58.3
Taxes on income
2.9
(1.4)
in mEUR
Revenue
Other operating income
Result after taxes = Net income for the year
108.0
56.9
(34.8)
9.5
(66.8)
0.9
Allocation to capital reserves pursuant to Section 237 (5) AktG
(0.9)
Expense from the elimination of treasury shares
(0.9)
Accumulated profits
49.7
22.1
Loss carryforward
Release of retained earnings due to the acquisition of treasury shares*
Set-off from retained earnings on acquisition of treasury shares**
Income from capital reduction
*In accordance with the resolution passed at the Annual General Meeting on June 30, 2025, an initial amount of €9.5 million was transferred to retained earnings for the planned
repurchase of treasury shares in fiscal year 2025. These reserves were used in connection with the share buyback, resulting in retained earnings of zero as of December 31, 2025.
**The amount set off is attributable to the difference between the acquisition cost of the treasury shares and the nominal value of the treasury shares, which, pursuant to § 272 (1a)
sentence 2 HGB, must be offset against freely available reserves.
Other operating income declined by €6.0 million from €6.2 million in 2024 to €0.2 million in 2025 mainly due to decrease in
realized foreign exchange gain by €3.6 million and decrease in reversal of earnout liabilities by €1.7 million.
Personnel expenses has increased marginally by €0.1 million from €1.3 million in 2024 to €1.4 million in 2025.
Other operating expense decreased by €11.4 million from €26.8 million in 2024 to €15.4 million in 2025 primarily due to
decrease in prior period expenses by €12.1 million, expenses relating to the exploration of take-private option by €3.9 million and
expenses relating to strategic review of listing and privatization choices by €1.2 million, as these were one-off expenses incurred in
2024. The decrease in other operating expenses has been offset by increase in audit fee by €2.0 million, and increase in consulting
charges by €2.1 million.
Income from investments increased by €24.0 million from €79.6 million in 2024 to €103.6 million in 2025 due to increase in
dividend income from affiliated enterprises.
Income from profit and loss transfer agreements increased by €19.2 million from €13.0 million in 2024 to €32.2 million in
2025, due to increase in profits transferred by the two German group companies.
Income from other investments and long-term loans increased by €3.1 million from €4.4 million in 2024 to €7.5 million in 2025
due to the increase in interest income on the loans to affiliated enterprises.
Other interest receivables and similar income increased by €1.0 million mainly due to interest received from banks in 2025.
Depreciation of financial assets increased by €10.3 million due to the recognition of impairment loss on loans to affiliated
enterprises in accordance with the lower-of-cost-or-market principle (Niederstwertprinzip), reflecting unrealized foreign exchange
losses.
Interest and similar expenses have decreased by €4.3 million mainly due to decrease in interest rates on the term loan and
decrease in term loan from €319.5 million in 2024 to €304.5 million in 2025.
38
Section A –Combined Management Report
Profit after tax has increased by €51.1 million from €56.9 million in 2024 to €108.0 million in 2025 mainly due to the abovementioned effects. Income tax income of €2.9 million comprises deferred tax income of €5.2 million, trade tax expense of €1.8 million,
corporate tax expense of €0.3 million and withholding tax expense of €0.1 million on dividend income received from one of its
subsidiaries.
Statement of financial position
Assets
2025
2024
Shares in affiliated enterprises
415.4
415.4
Loans to affiliated enterprises
137.9
165.9
Non-current assets
553.3
581.2
Amounts owed by affiliated enterprises
32.8
15.5
Other assets
2.4
0.5
Cash in hand, deposits with Deutsche Bundesbank, bank balances, and cheques
27.3
75.7
Current assets
62.5
91.7
Prepayments
0.9
0.9
Deferred tax assets
6.1
0.9
Total assets
622.8
674.8
Equity and liabilities
2025
2024
12.9
13.8
in mEUR
in mEUR
Share capital
Treasury shares
(0.5)
(0.5)
Capital reserve
234.0
233.2
Accumulated profit
49.7
22.1
Equity capital
296.1
268.6
Provisions
17.7
19.5
Liabilities to banks
304.5
319.5
Trade payables
0.8
2.3
Payables owed to affiliated enterprises
2.7
63.6
Other payables
1.0
1.4
Liabilities
309.0
386.7
Total equity and liabilities
622.8
674.8
Shares in affiliated enterprises remained steady at €415.4 million as no new entity has been incorporated/acquired during
the year. No impairment has been recognized during the current year and previous year.
Loans to affiliated enterprises decreased by €28.0 million to €137.9 million as of December 31, 2025, as against €165.9 million
as of December 31, 2024 due to repayment of loans of €93.6 million and provision for impairment thereof amounting to €10.3 million.
Since these loans are primarily denominated in US Dollar (USD) and the fact that USD has weakened against the Eur during the year,
this has resulted in a provision for impairment amounting to €10.3 million that has been recognized during the year. This has been
offset by additional loans of €75.9 million provided during the year.
39
Section A –Combined Management Report
Accounts owed by affiliated enterprises have increased by €17.3 million to €32.8 million as of December 31, 2025, as against
€15.5 million as of December 31, 2024 primarily on account of increase in receivables pertaining to income from profit transfer
agreements.
Other assets increased by €1.9 million to €2.4 million as of December 31, 2025, as against €0.5 million as of December 31,
2024 mainly due to increase in VAT, withholding, trade and corporate taxes recoverable.
Cash and bank balances decreased by €48.4 million to €27.3 million as of December 31, 2025, as against €75.7 million as of
December 31, 2024 mainly due to purchase of treasury shares of €67.7 million, net repayment of liabilities to bank of €15.0 million, net
repayment of liabilities to affiliate enterprises of €60.9 million, payment of dividend of €12.6 million, interest paid of €12.7 million and
cash used in operating activities amounting to €19.0 million. The same has been offset mainly by cash inflow from income from
investments in affiliated enterprises (dividend income) of €103.6 million, receipt on account of net repayment of loans to affiliated
enterprises of €28.0 million and interest income from long-term loans to affiliated enterprises of €7.5 million.
Deferred tax assets and liabilities have been presented on a net basis. Deferred tax assets increased by €5.2 million to
€8.1 million as of December 31, 2025, as against €2.9 million as of December 31, 2024. Deferred tax liabilities remained constant at
€2.0 million as of December 31, 2025 and 2024 resulting in a net deferred tax asset of €6.1 million as of December 31, 2025 against
€0.9 million as of December 31, 2024.
The increase in deferred tax assets is primarily on account of increase in deductible temporary differences arising from
interest carryforwards and unrealized foreign exchange losses on the loans to affiliated enterprises. This has been offset by partial
utilization of brought forward corporate tax losses against current year taxable profits. Further, deferred tax assets and liabilities have
been remeasured at revised expected future tax rates due to the enacted gradual reduction in the German corporate income tax rate
effective January 1, 2028, from the current 15% declining by 1% annually to 10% by 2032.
Equity has increased by €27.6 million to €296.2 million as of December 31, 2025, as against €268.6 million as of December 31,
2024. Equity increased by current year’s profits amounting to €108.0 million which has been offset by purchase of treasury shares
amounting to €67.7 million and dividend payment amounting to €12.6 million.
Provisions have decreased by €1.8 million to €17.7 million as of December 31, 2025, as against €19.5 million as of December
31, 2024 mainly on account of reduction in provision for expenses relating to strategic review of listing and privatization and expenses
relating to the exploration of the take-private option by €2.5 million and reduction in fair value of cash-settled share based arrangement
by €1.5 million. The same has been offset by increase in provision for the preparation and audit of the annual and consolidated financial
statements by €1.2 million and PB RSUs by €0.9 million.
Liabilities to banks have decreased by €15.0 million to €304.5 million as of December 31, 2025, as against €319.5 million as of
December 31, 2024 due to net repayment of loan of €15.0 million during the year.
Payables owed to affiliated enterprises have decreased by €60.9 million to €2.7 million as of December 31, 2025, as against
€63.6 million as of December 31, 2024 mainly due to repayment of loans given by the affiliated enterprises.
Other payables have decreased by €0.4 million to €1.0 million as of December 31, 2025, as against €1.4 million as of
December 31, 2024 mainly because of decrease in accrued interest.
Nagarro SE’s expected developments, opportunities and risks
As the listed parent entity performing central financing, governance and capital allocation functions, Nagarro SE’s financial
position and expectations regarding its key financial performance indicators are largely dependent on the business performance and
outlook of the Nagarro Group. This is described in detail in the Section A.VIII. Report on expected developments of the Combined
Management Report. Further, the financial position of Nagarro SE is expected to be stable in 2026. Its main income will be derived from
dividend income from affiliated enterprises, profit-sharing agreements, interest income from loans given and other operating income
with group companies. For Nagarro SE, the cash position at the end of 2026 is expected to be in the region of €20 million - €40 million.
The retained earnings at the end of 2026 is expected to be in the region of €80 million - €100 million (excluding impact of any potential
share buyback in 2026).
The Nagarro SE’s financial statements for the financial year 2025 will be submitted to the operator of the electronic version of
the German Company Register and can be obtained via the Company’s registered website.
Nagarro SE’s performance is essentially dependent on the same set of risks and opportunities that affect the Nagarro Group,
and which are described in detail in Section A.IX. Report on the accounting-related internal control system and risk management system
and on risks and opportunities of the Combined Management Report. As a general rule, Nagarro SE participates in the risks entered
into by Group companies in proportion to the respective shareholding percentage. At the same time investments have a significant
impact on the earnings of Nagarro SE which could impact its ability to pay down debt, and participate in M&A. There is also a potential
risk of impairment of subsidiaries, which might affect Nagarro SE’s net income for the year and consequentially, its retained earnings,
and could impact its ability to pay out dividends and share buyback.
Nagarro SE is integrated in the group-wide risk management and internal control systems of the Nagarro Group. Further
information is provided in the sub-section of Internal control system of Section A.IX. Report on the accounting-related internal control
system and risk management system and on risks and opportunities. of the Combined Management Report.
40
Section A –Combined Management Report
VIII. Report on expected developments
Overall economic expectation
The OECD Economic Outlook published in December 2025 cites that Global GDP growth is projected to slow from 3.2% in 2025
to 2.9% in 2026, as higher tariffs and ongoing policy uncertainty slow down investment and trade.
In the United States, growth is projected to slow from 1.8% in 2025 to 1.5% in 2026 owing to higher tariff rates, moderating net
immigration and reductions in the federal government workforce. In the Euro area, GDP growth is expected to experience a smaller but
steady slowdown, from 1.2% in 2025 to 1.0% in 2026 with increased trade frictions and geopolitical uncertainty somewhat offset by
stronger public investment and easier credit conditions.
Expectations for the IT sector
Global Information Technology spending is on track to surpass $6 trillion for the first time in 2026, according to projections by
Gartner in February, 2026. Total worldwide spending is expected to hit approximately $6.16 trillion, representing 10.8% growth over
2025.
Despite the overall spending increase, growth is expected to be uneven across different segments. Gartner anticipates that Data
Center Systems will see the strongest growth, while it expects IT Services spending to increase 8.7% in US dollar terms in 2026, up from
6.4% in 2025.
Geopolitical re-assessment Middle East war
Nagarro’s future business development continues to be influenced by geopolitical uncertainties, in particular the ongoing
Middle East war and its potential impact on economic conditions in certain regions.
Based on the information currently available, management does not expect any material adverse impact on the Nagarro’s
business development and key performance indicators within the next 12 months. This assessment is primarily supported by the
Nagarro’s diversified business model.
Nevertheless, it cannot be ruled out that temporary demand fluctuations, project delays, or changes in client investment
decisions may occur in certain regions, particularly in the Middle East and the United Arab Emirates (UAE).
At the same time, Nagarro expects selective positive effects in certain areas, particularly due to additional demand from the
public sector, defense-related projects, and technology-driven solutions, especially in the field of artificial intelligence.
Management will continue to closely monitor developments and adjust its planning assumptions as necessary.
Expectations of Nagarro
Taking the above context into account, we expect FY2026 revenue, based on 2026 average foreign exchange rates available
until the date of forecast (including for currencies that contribute significantly to our revenues: USD/EUR - 1.172; INR/EUR - 106.886 and
GBP/EUR - 0.869) and not including future acquisitions, to be between €1,000 million and €1,060 million. At the mid-point, this
corresponds to an increase of approximately 5% over 2025 local revenues translated to Euro at current foreign exchange rates. We
target gross margin in the region of approximately 32%, which roughly corresponds to the gross margin for 2025 (32.2%). Our target
adjusted EBITDA margin is between 14.5% and 15.5%, compared to 13.8% in 2025. Potential acquisitions in 2026 are not included in
these forecasts. These projections are subject to risk and uncertainties as described in the Risk section below risks and opportunities.
The key assumptions underlying our estimate of 2026 performance are:
1)
Improved spending on IT services: In line with the predictions by Gartner, we expect the global spending on IT services
to grow between 5% and 10%.
Availability of reasonably priced talent, especially in our most important talent hubs: We expect wage inflation and
attrition to be close to historical averages and expect Nagarro’s ability to hire strong talent to continue as before.
Nagarro continues to evaluate potential acquisition targets. Acquisitions, if any, are more likely to be bolt-on in nature, rather
than transformative. The primary strategy is to acquire for client access and better leverage our existing capabilities and case studies.
However, there is always the possibility of an opportunistic transaction that deviates from our current strategy.
41
Section A –Combined Management Report
Our most important non-financial KPIs are our client satisfaction (CSAT) score and our Net Promoter Score (NPS). Our CSAT
score for 2025 was 93.4% and our NPS was 68 (refer III.B. Business performance for 2025) of section A. Since we do not expect any major
changes in 2026 to the way we provide services to our clients, we expect the CSAT score and NPS for 2026 to be at approximately the
same levels as in 2025, with the CSAT score in the region of 92% and the NPS in the region of 65. There is a possibility that clients joining
us through the integration of acquired entities may have higher or lower levels of satisfaction than the existing client base, which may
result in some movements in the CSAT and NPS.
Overall, we expect 2026 to be a good year for the Company as the long-term market drivers remain intact and we have
positioned the Company to take advantage of them. Nagarro intends to continue its sustainable dividend policy of distributing between
10% and 20% of the IFRS EBIT of the group every year.
All of the above management forecasts are expectations and may be proved wrong and are especially uncertain because of the
multidimensional and unpredictable effects of the global economic situation. The actual development of Nagarro and its business units
may be better or worse than the expected figures due to the opportunities and risks listed below or in the event that our expectations
and assumptions do not materialise.
42
Section A –Combined Management Report
IX. Risks and opportunities report
A. Key features of the Risk Management System and Internal
Control System
Corporate Governance and Organization
Nagarro’s governance structure integrates the Risk Management System (RMS), the Internal Control System (ICS) and the
Compliance Management System (CMS) into a cohesive framework. In alignment with the legal requirements, the Management Board
bears overall accountability for design, implementation, continuous improvement, and effectiveness of these governance systems with
the support of the Risk & Compliance team and the ICS team. The systems are designed to meet the requirements of sections 91(2), (3)
and 93 (1) AktG to ensure early identification and monitoring of developments that could endanger the Company’s continued
existence. Within the RMS, in accordance with Nagarro’s organizational structure and the defined responsibilities, senior management
members as risk owners are required to identify risks in their areas and regularly review the risks assigned to them, to monitor related
developments within their business units and internal functions, to implement appropriate mitigation measures, and to report these to
the Risk & Compliance team.
The Risk & Compliance team is responsible for preparing the enterprise risk reports on a bi-annual basis. It also assists the
Management Board in reporting to the Supervisory Board.
Nagarro’s Internal Control System (ICS) focuses on the effectiveness and transparency in key business processes and is aimed
at identifying and prioritizing risks along with the achievement of business objectives. The ICS at Nagarro is based on the internationally
recognized COSO standards for corporate governance and is aligned with the principles set out in the German Corporate Governance
Code (Deutscher Corporate Governance Kodex – DCGK).
The CMS is a core element of Nagarro’s governance, steering and control framework and complements the RMS and the ICS. It
establishes a framework for compliant conduct and supports the systematic identification and management of compliance risks,
through clearly defined rules, responsibilities and standards of behavior.
Nagarro’s governance envisions an independent monitoring through internal audit. The internal audit framework is currently
being designed to enable independent evaluations of the design and effectiveness of the RMS, ICS, and CMS. Its implementation will
further enhance objective assurance and strengthen overall risk oversight.
Key characteristics of the accounting related Internal Controls and Risk Management System for the
Group
Nagarro’s accounting related Internal Control and Risk Management System is embedded within the Company’s broader
corporate governance framework. It is designed with the objective to provide reasonable assurance on the reliability of external
financial reporting and to ensure consistent compliance with International Financial Reporting Standards (IFRS) and the requirements
of the German Commercial Code (HGB) and the German Stock Corporation Act (AktG).
The Management Board holds overall responsibility for establishing and continuously monitoring an appropriate Internal
Control and Risk Management System for the consolidated financial statements and the disclosures in the combined management
report. This system is designed to identify, assess, mitigate, and report risks that may arise during the process of preparing the annual
and consolidated financial statements. A clear segregation of duties is defined and implemented across all relevant functions to ensure
accuracy, transparency, and integrity in financial reporting.
Additionally, the Audit Committee of the Supervisory Board meets regularly with the Management Board, the Risk & Compliance
team, and the ICS team to review updates related to the Internal Control and Risk Management System.
The Internal Control and Risk Management System and the Compliance Management System serve the purpose of preventing
or detecting errors and manipulations in accounting, identifying risks that threaten the Company's going concern at an early stage,
evaluating them appropriately and controlling them by means of appropriate measures, and avoiding financial losses to the detriment
of the Company. However, the systems cannot guarantee absolute certainty that all material risks are effectively addressed and
controlled. Nevertheless, they ensure a high degree of transparency and controllability of the risks relevant to the Company.
Risk Management System
Nagarro’s RMS is designed to ensure a structured approach to identify, assess, manage, and monitor risks, i.e. potential future
developments or events that could impact the Group’s forecasts or objectives. The aim is to effectively address the diverse risks
associated with global business operations as well as the early identification of opportunities, i.e. potential future developments or
43
Section A –Combined Management Report
events that could lead to a positive deviation from the Group’s forecasts or objectives, arising from market, technological or strategical
developments that can strengthen Nagarro’s market position and drive long term value creation. Its risk management practices adhere
to internationally recognized standards and accepted frameworks, including the COSO Enterprise Risk Management Framework (2017)
and ISO 31000:2018. The risk strategy is anchored on three core pillars: Risk Principles, Risk Management Process and Organization and
Strategic Risk Metrics.
During the reporting year, Nagarro has significantly enhanced its risk identification and assessment methodology to ensure
greater accuracy and consistency in evaluating identified risks. It also includes the redefinition of risk categories such as strategy,
operations, financial, and compliance in alignment with the COSO framework, enabling a more structured approach in accordance with
international standards. This refinement ensures a focus on risks that are most relevant to the organization’s strategic objectives.
Additionally, the enterprise risk reporting cycle is initiated on a bi-annual basis, aligning with common industry practices and improving
the timeliness of risk communication. All these changes have been implemented with the overarching goal of making risk management
more targeted and effective, thereby strengthening governance and supporting proactive decision-making.
Internal Control System
Nagarro also has an integrated Internal Control System based on the internationally recognized COSO standards and the
German Corporate Governance Code (Deutscher Corporate Governance Kodex – DCGK). It intends to ensure the effectiveness and
efficiency of business processes, the reliability and accuracy of financial reporting, and compliance with applicable laws, regulations
and internal policies. The ICS comprises clear roles and responsibilities, standardized control matrices, risk assessments, control
activities, information and communication, and monitoring across all relevant areas and processes of the Company. The ICS team
defines the methodological standards and the design for internal controls, supports and advises the process owners with the
implementation of controls, and performs independent monitoring and reporting to the Management Board on a quarterly basis. The
Management Board, in turn, reports directly to the Audit Committee of the Supervisory Board. The ICS has a preventive and detective
function to prevent both errors within the operational processes and fraudulent acts. For each business area, essential controls are
defined based on risk factors which can arise in a business process. Controls are tested for design or operating effectiveness to
safeguard assets and information from loss, theft or misuse.
Accounting related Internal Control System
Nagarro’s accounting-related Internal Control System is designed to provide a proper, accurate, and reliable base for the
Group’s consolidated assets, its financial position and its results of operations. Group-wide binding guidelines and regulations serve as
the foundation for a uniform, orderly, and continuous financial reporting process. This process aims to ensure the accurate recognition,
processing and assessment of all business transactions, ensuring their complete and seamless integration into financial reporting and
management processes, free from errors. For an accurate and reliable group financial reporting, specific control activities are carried
out at group level. In addition, various control mechanisms are implemented which are designed to be process-integrated and processindependent. The process-integrated measures are specifically designed to address operational risks related to the preparation of
financial reports to help in checking that the financial data is accurate, complete, and consistent across all levels of the organization.
The Group’s ICS is largely centrally coordinated. The Group has a standardized approach to identify risks. The ICS is a blend of
entity-level controls and process-level controls. Entity-level controls are high level controls that help the organization to address errors
and fraud risk which may arise from an overall governance and a weak control environment. Process-level controls are more granular
and focus on specific operational processes that are vulnerable to fraud and errors in the consolidated and annual financial statements.
In FY25, Nagarro adopted a risk control-based ICS approach with operating effectiveness testing across in-scope entities for the
Nagarro Group. This approach enhances reliability and the control environment. This includes the testing of controls at regular intervals
and the provision of continuous improvement suggestions to designated process owners and teams which helps in improving the
effectiveness of the ICS. A group-wide ICS handbook governing the responsibilities and processes related to the approach, execution,
and monitoring of the ICS has been developed and is in the final stages of completion.
Compliance Management System
Nagarro has a group‑wide Code of Conduct that serves as a framework for compliant behavior, as well as a confidential
whistleblowing system with defined review and escalation procedures. In addition, group‑wide policies covering key compliance topics
and targeted training programs support the consistent application of these requirements across the organization.
During the past reporting year, Nagarro initiated the targeted enhancement of its existing CMS structures. The starting point is
a structured relevance and risk analysis based on recognized topic clusters (DICO “honeycomb” model designed by the German
Institute of Compliance), considering the specific characteristics of Nagarro’s decentralized group structure. On this basis, existing
elements are consolidated, priority compliance risk areas are identified, and corresponding measures are further developed. The CMS
is designed in accordance with IDW PS 980 and reflects the core elements of a compliance management system as defined therein.
The objective is to further develop an overarching compliance framework that connects existing structures across the Group
and is progressively enhanced by clearer responsibilities, consistent documentation and transparent reporting mechanisms. In this way,
the interaction between CMS, RMS and ICS is further integrated. The ongoing development aims to sustainably strengthen the
effectiveness, traceability and group‑wide consistency of the CMS in line with the applicable statutory framework.
44
Section A –Combined Management Report
B. Risk management Framework - Policy, Strategy, Principles and
Process
Risk Management Policy, Strategy & Principles
The Risk Management Policy, issued by the Risk & Compliance team and approved by the Management Board, governs how
risks are managed in alignment with the Company’s risk appetite. It establishes a uniform methodology to be applied consistently
across all regions of the organization. The policy underscores that risk management at Nagarro is a shared responsibility - without
exception. Every Nagarrian is expected to actively participate in the risk management process and to continuously identify risks within
their day-to-day operations.
Nagarro’s RMS is designed to fulfill the core objectives of ensuring compliance with regulatory and internal requirements,
enabling early risk warnings, and fostering accountability and responsible decision making across the organization. It embeds risk
considerations into strategic and operational planning and supports the proactive management of potential disruptions through
controls. Aligned with Nagarro’s corporate strategy and guided by the CARING values, the risk strategy is built on three key pillars - Risk
Principles, Risk Management Process and Organization, and Strategic Risk Metrics, that assess risk bearing capacity and tolerance to
ensure overall risk exposure remains within acceptable limits.
Our risk principles are established based on Nagarro’s fundamental approach to risk management, as defined by the TRUST
framework, ensuring a consistent and open risk culture across all levels of the organization. The TRUST framework – Transparency,
Responsibility, Uniformity, Sustainability, and Timeliness – forms the foundation of our risk management approach. It encourages that
all risks are reported and establishes accountability with every Nagarro team member responsible for adhering to consistent risk
management practices. The framework is continuously enhanced to maintain its effectiveness. Risks are identified, assessed, and
communicated openly to support an informed decision-making.
Risk Management Process
Risk management is an integral part of the strategic planning and implementation of Nagarro’s business model and is
embedded across the organization through a risk-oriented management approach. Our RMS covers all entities and provides a
comprehensive view of risks across the areas of strategy, operations, financial, and compliance in accordance with the COSO
framework.
Our RMS comprises various components such as risk strategy and planning, risk identification, risk assessment, risk aggregation,
risk steering, risk reporting and risk monitoring and improvement. These structures established by the Management Board are intended
to enable an early identification, a thorough analysis, an assessment and an appropriate treatment of potential risks.
Risk Identification
Risks are identified in a structured way through a combination of both top-down and bottom-up approaches to ensure that
potential new risks are discussed at management level and included in the enterprise risk reporting process. The risk identification
process also covers extreme risks, defined as risks with a very low likelihood of occurrence, combined with a potentially significant or
critical impact in the event they materialize.
The Risk & Compliance team regularly works with Business Unit heads and supports function heads that primarily deal with risk
topics, such as the Security Council, the Global Privacy Council, Finance and the legal team, which manages customer contracts. The
team collaborates with risk owners to assess risks associated with business operations and internal processes, and it monitors the
implementation and effectiveness of measures to mitigate these risks. All identified risks are tracked and monitored. Furthermore, the
Risk & Compliance team is responsible for the regular maintenance and implementation of our Risk Management System, as well as the
standardized internal and external risk reporting.
Risk Assessment
Risks are evaluated using quantitative risk assessments individually on both a gross basis (before the consideration of mitigation
measures) as well as a net basis (remaining risk after risk response measures), providing a comprehensive view of Nagarro’s risk
landscape. The assessment process ensures that management attention and resources are directed toward significant risks and their
mitigation plans. All existing and emerging risks are reassessed on a bi-annual basis by evaluating likelihood and impact and
considering the most probable expected loss across different time horizons, defined as short term (one year), medium term (two to
three years), and long term (four or more years).
Risk Aggregation & Risk Bearing Capacity Analysis
Building on these inputs, Nagarro applies a risk aggregation approach to assess whether identified risks individually or in
combination could pose a threat to the Company’s continued existence. The aggregated risk profile is derived from net risks, reflecting
45
Section A –Combined Management Report
the impact after implementing mitigation measures. Additionally, interdependencies (incl. correlations) among risks are also included,
as these may trigger and/or amplify the occurrence of other risks. The resulting aggregate risk exposure is compared with the available
risk-bearing capacity derived from equity and liquidity using a Monte Carlo simulation in order to assess the company’s risk-bearing
capacity. This assessment covers both, the overall risk position and the individual risk categories, with forecasting activities spanning a
one-year horizon. The approach provides a forward-looking risk profile, highlighting the urgency and scale of additional mitigation
measures that are required to keep risks within acceptable thresholds.
Risk Steering
Nagarro applies a structured approach to address identified and assessed risks. It encompasses four established risk response
strategies: avoidance, mitigation, transfer, and acceptance, designed to reduce the expected impact, the likelihood, or both, for
material risks to a tolerable level for Nagarro, or to accept certain risks where appropriate. In addition, continuous risk monitoring is
conducted by risk owners to track changes in the risk landscape, to evaluate the effectiveness of implemented measures, and to ensure
that emerging risks or shifts in likelihood and impact are promptly identified and addressed. This ongoing monitoring helps
maintaining transparency, supports timely decision making, and ensures that risk responses remain aligned with Nagarro’s risk appetite
and overall strategic direction. Risk responses are documented and reviewed, monitored, and updated bi-annually by the Risk Owners
in coordination with the Risk & Compliance Team. To ensure continuous improvement, those responsible for implementing and
overseeing the measures assess their adequacy and effectiveness.
Risk Reporting
The Risk Management process at Nagarro is structured to provide the Management Board and the Supervisory Board with
timely and comprehensive insights into significant risks that could impact the organization. The Enterprise Risk Report ensures focused
visibility into all significant risks across Nagarro. It covers significant changes to the RMS process, newly identified risks, updates to
existing risks, and the distribution of risks across various categories. Additionally, the report includes a detailed risk-bearing capacity
analysis, supporting informed decision-making on risk mitigation and strategic planning. While risk reporting follows a bi-annual cycle,
it is reinforced by an ad-hoc reporting mechanism designed to escalate critical issues promptly, ensuring that emerging risks or urgent
developments are communicated without delay. This integrated approach strengthens governance and supports proactive risk
management across the enterprise.
RMS Monitoring and Improvement
The primary objective of monitoring is to verify that the risk management framework remains robust, consistent, and aligned
with both internal and external developments. Our RMS is evaluated on a periodic basis to ensure its adequacy and effectiveness.
Identified gaps are addressed in a timely manner, and lessons learned are incorporated on an ongoing basis.
Risk Matrix
Our risk management approach involves evaluating risk factors to determine their classification and net expected loss on
business objectives. Risks are categorized into four profiles: very High, high, moderate, and low, based on two key dimensions:
likelihood (i.e., probability of occurrence within the assessment period) and potential impact (deviation from strategic and operational
objectives relative to EBIT as reference value). The guidelines for these indicators are detailed in the following tables, which serve as the
basis for a consistent and transparent risk evaluation across the organization.
Category Probability of Occurrence Probability of Occurrence from
Category Impact
Impact from / to
Very Unlikely
up to 5 %
Insignificant
up to €1 million
Unlikely
5 % to 25 %
Minor
€1 million to €5 million
Likely
25 % to 50 %
Moderate
€5 million to €10 million
Very Likely
50 % to 75 %
Significant
€10 million to €30 million
Almost Certain
75 %
Critical
€30 million
46
Section A –Combined Management Report
Based on the assessment of likelihood and impact, risks are classified within a risk matrix. This matrix enables comparison of
relative risk priorities and illustrates the effect of mitigation measures on a risk’s likelihood and/or impact.
C. Risks
This section outlines the identified risks that could adversely affect our business operations, financial position, earnings
capacity, and reputation based on the recent risk assessment conducted during the reporting period. No significant changes have been
identified up to the date on which the annual and consolidated financial statements were prepared. In addition, risks and opportunities
that are not yet known or are currently considered less significant can also have a negative impact and jeopardize our business
objectives, future earnings, financial and asset position. Newly identified significant risk areas include Socioeconomic Trends,
Operational Environmental Risks, and AI risks. Risks are categorized into four main groups: Strategic, Compliance, Operational, and
Financial. These categories are further subdivided into areas such as Market Dynamics & Competition, Planning & Resource Allocation,
Socioeconomic Trends, Mergers & Acquisitions, Financial Crime, Legal, Business Partner & Third Parties, Operational Personnel &
Human Resources, Operational Environmental Risks, Project, Information technology, AI Risks, Financial markets, and Capital Structure.
Overview of Risks by Category
The following table provides a structured overview of our risk landscape for the twelve-months period beginning on the
balance sheet date. Individual risks are grouped into defined categories and ranked in accordance with the risk classification. None of
the identified risks were classified as ‘very high’. Risks assessed as ‘low’ are not presented. If individual risks within a subcategory fall into
different risk classes, the risk with the highest classification determines the classification of the entire subcategory.
47
Section A –Combined Management Report
The following section presents all significant risks, taking into account the measures implemented, categorized and, within each
category, ordered by their currently assessed potential impact on Nagarro, starting with the highest risk classification.
Categories
Trend compared to 2024*
Risk Class
Strategic Risks
Market Dynamics & Competition
↗
High
Planning & Resource Allocation
↗
Moderate
Socioeconomic Trends
New
Moderate
Mergers & Acquisitions
↗
Moderate
Financial Crime
↗
Moderate
Legal
↗
Moderate
Business Partner & Third Parties
↗
Moderate
Operational Personnel & Human Resources
↗
Moderate
Operational Environmental Risks
New
Moderate
Project
↗
Moderate
Information Technology
↗
Moderate
AI Risks
New
Moderate
Financial Markets
↗
Moderate
Capital Structure
↗
Moderate
Compliance Risks
Operational Risks
Financial Risks
- as per new assessment methodology.
Strategic Risks
Market Dynamics & Competition
With respect to market dynamics and competition, Nagarro is exposed to risks arising from political instability, global crises
and geopolitical conflicts and potential changes in the geopolitical situation which can lead to revenue loss and reduced business
opportunities in affected regions. To mitigate these risks, the Company has implemented a robust business continuity plan and
geographic diversification across services and product portfolios. In addition, it has conducted multiple crisis simulations and
established long-term strategic workforce planning. The Company has also invested in developing emerging markets to create
recurring opportunities and ensure a steady pipeline of work, even the event of global or regional fragmentation.
The war in the Middle East represents a geopolitical risk factor that may affect economic conditions as well as business activities
in certain regions. Potential impacts may arise from increased client uncertainty, potential project delays, and weaker demand
development in affected markets. This also applies to the Company’s business activities in the United Arab Emirates (UAE), which are
generally characterized by project-based revenues. Given the Company’s diversified business model across regions, industries, and
clients, management currently does not expect any material adverse impact on the Group’s net assets, financial position, and results of
operations within the next 12 months. Management continuously monitors the development and regularly assesses the resulting risks
and opportunities.
Certain market risks exist due to factors such as dependence on key industries which may restrict marketing and talent
acquisition opportunities. These challenges could adversely impact the demand for services and jeopardize Nagarro’s market position.
To address these risks, Nagarro has enhanced adaptability through targeted hiring in response to changing business priorities,
diversifying its offerings, and strengthening learning and development initiatives, including new programs such as AI Dominance. In
addition, Nagarro ensures the fungibility of talent across industries to maintain competitiveness.
The AI hype may lead to market overvaluation, potentially affecting customer satisfaction and financial performance if
expectations are not met, resulting in potential financial losses. To mitigate this risk, Nagarro monitors market developments and
trends, provides targeted training, and aims to increase productivity by 20% through effective AI adoption.
48
Section A –Combined Management Report
Planning and Resource Allocation
Nagarro has identified risks where cost estimates, cash flow estimates and revenue estimates could be incorrect. Such mis
judgments may lead to incorrect strategic decisions and jeopardize the financial stability of the Company. To mitigate the impact of
this risk, there is a yearly cost planning process as well as continuous forecast updates done by Business Units (BUs) in line with revenue
movements and the Finance team conducts periodic reviews and tracking across all business units, and Sales & Marketing. Additionally,
revenue forecasting is supported by key drivers such as FTE, working days, billing rates, utilization, and annual cost planning.
Socioeconomic Trends
In the area of socioeconomic trends, Nagarro has identified geo-localized risks arising from publicly funded R&D programs
as most governments offer subsidies to stimulate R&D activity. However, if Nagarro does not actively pursue such programs, its R&D
investments may become comparatively more costly, potentially affecting its competitiveness. To mitigate these risks, Nagarro
monitors local requirements and market developments, and assesses the feasibility and availability of public R&D funding
opportunities.
Mergers & Acquisitions
To support our growth strategy, Nagarro actively pursues acquisitions of businesses and technologies and expects to continue
doing so in the future. These activities expose Nagarro to integration-related risks which include difficulties in integrating new
acquisitions or prolonged integration delays that could lead to compliance issues and missed opportunities, ultimately disrupting
operations and reducing anticipated synergies. To address these risks, Nagarro has implemented measures including cultural fit
evaluation during M&A, structuring deals with earn out components over several years and designating contact persons for seller
relationships. In addition, Nagarro is establishing time-bound integration framework with maximum allowed deferment periods for
critical functions and is introducing interim risk controls to ensure immediate compliance coverage
Compliance risks
As a listed company with registered office in Germany and a global presence, Nagarro is subject to a wide range of regulatory
requirements. Our top priority is strict compliance with German company and capital markets law and regulations, including
requirements relating to ad-hoc disclosures, regular reporting on quarterly results, and notifications of proprietary transactions and
changes in voting rights. Nagarro must also comply with the provisions of the European Market Abuse Regulation (MAR), which
prohibits insider trading and market manipulation. Nagarro monitors compliance with these regulatory requirements through its legal
team, supported by external legal counsel.
Financial Crime
A potential risk within this subcategory relates to bribery, corruption involving authorities or clients, which may lead to
violations of anti-corruption laws and result in significant penalties. This includes the possibility of unauthorized or illegitimate
payments, such as disbursements to ghost employees or fake contractors from Nagarro bank accounts, which could result in financial
loss and reputational harm. To mitigate these risks, Nagarro has implemented financial control mechanisms, including the requirement
of two signatures for payments, which was improved and standardized across the group to prevent and eliminate process gaps, the
four-eyes principle (“two-person principle”) for key business decisions, the monitoring and auditing of expenditures, and clearly
defined approval and workflow processes.
Legal
As a global software provider, Nagarro is required to comply with local data privacy laws. One of the relevant European data
protection regulations is the General Data Protection Regulation. These regulations require Nagarro to treat its customers’ personal
data and sensitive information with the utmost care and to protect them from unauthorized access or misuse. However, differences in
local understanding, awareness, and enforcement – particularly with respect to data retention, deletion, and handling – may result
in privacy breaches, regulatory issues, and reputational damage. To mitigate these risks, Nagarro has established a global privacy
governance framework and conducts regular awareness and training programs. In addition, employees are required, through the
Nagarro Constitution, to recognize and act in accordance with this framework. At the same time, Nagarro requires its suppliers and
business partners to comply with its Code of Conduct for Suppliers and Business Partners. These measures are intended to ensure that
all parties involved act in accordance with Nagarro’s ethical principles and the applicable legal requirements.
Business Partners and Third Parties
The unauthorized conclusion of contracts, or customer contracts misaligned with our risk posture, could result in legal claims
and reputational damage. These risks are mitigated through strict contractual safeguards, including predefined liability caps under
Nagarro’s legal standards, mandatory legal reviews, execution via the contract management tool by authorized signatories, and CEO
pre-approval for any exceptions involving unlimited liability. The process is further reinforced by the four-eyes principle, role-based
access controls, and full audit-trail functionality. Additionally, periodic awareness campaigns and training, third party due-diligence,
49
Section A –Combined Management Report
and periodic reviews and enhancements of authorization processes are conducted to minimize risk. Digital signing is implemented
through access-restricted tools with clear authorization protocols, supported by comprehensive tracing and logging mechanisms.
Operational Risks
Operational Personnel and Human Resources
A central element of Nagarro’s business is the delivery of software and service solutions. Nagarro faces risks related to the loss
of key personnel, high employee turnover, and dependency on highly specialized talent, particularly in the areas of technology and
management, which could adversely affect operations and service delivery. To mitigate these risks, Nagarro’s business model is not
dependent on individual personnel but is based on a broad portfolio of expertise across the organization. Attracting and retaining top
talent is critical, and the Company supports this through competitive remuneration models, retention initiatives such as ESOP
appreciation, flexible working arrangements, and comprehensive learning and development programs via Nagarro University
(NagarroU). Also, Nagarro fosters employee satisfaction through its CARING culture and the promotion of a positive corporate
environment. The Company continues to strengthen its employer branding to support sustainable growth as well as talent attraction
and retention. Nagarro also faces risks related to senior talent misalignment, inefficient utilization of bench resources, and a shortage
of future senior talent, which could impact the effective deployment of its skilled workforce and overall business performance. To
mitigate these risks, Nagarro is implementing measures such as prioritizing redeployment of bench resources over external hiring and
investing in training and upskilling programs to develop junior talent into future senior roles. Furthermore, the Company actively
manages its skills and capabilities to generate new business opportunities and develop tooling and accelerators. These initiatives
support optimal resource utilization and strengthen Nagarro’s future leadership.
Operational Environmental Risks
Compliance with environmental, social, and governance (ESG) laws and regulations, as well as sustainability and human rights
requirements, presents increasing complexity and risk. Certain risks include environmental factors such as extreme weather
conditions, which may lead to health issues among the workforce, including heat stress or sudden changes in weather patterns. These
factors may result in increased sick days and reduced productivity. To mitigate these impacts, Nagarro has implemented flexible
working hour arrangements that allow colleagues to adjust their working hours to more suitable periods of the day. In addition, the
Company has enhanced workplace environments and implemented awareness programs on health management to support employee
well-being and sustain productivity.
In addition to the above, there is a risk associated with high energy consumption during the deployment of digital solutions,
which may shift customer preferences toward companies offering low-carbon alternatives. This trend could create pressure to invest in
sustainable digital solutions. To address this, Nagarro engages with clients to gain timely insights into their expectations and ensures
that delivered solutions meet the required sustainability performance standards.
Risks may also cascade to Nagarro through supply-chain partners, such as cloud service providers. To mitigate these risks, the
Company engages early with cloud providers to anticipate potential disruptions and develop contingency plans. Additionally, Nagarro
has rolled out programs to raise awareness of sustainability and resilience criteria in the selection of cloud solutions to ensure longterm stability and alignment with its ESG objectives.
Project
There is a risk that client dissatisfaction could lead to refusal of payment or claims for damages, potentially impacting Nagarro’s
reputation and projected revenue. To mitigate this, the Company establishes clear role expectations and responsibilities before
initiating any engagement, maintains multiple communication platforms and escalation pathways, and conducts regular weekly and
monthly meetings with clients to address concerns promptly. Early warning signals of dissatisfaction are managed through a defined
escalation process and a structured feedback loop to close expectation gaps. In addition, Nagarro performs client satisfaction (CSAT)
surveys and milestone-based check-ins to ensure quality and alignment, enabling the continuous monitoring and improvement of client
satisfaction.
Information Technology
As a technology-driven organization, Nagarro is exposed to risks related to data security and data loss resulting from
technology outage or security breaches. Nagarro’s mitigation measures include a comprehensive Business Continuity plan designed
to minimize the impact on client services and ensure employees’ safety. In addition, the Company has a redundant power infrastructure
for critical systems, redundant power supply on the data centers, and uninterrupted power supply (UPS) for servers. Further measures
include enterprise storage solutions, strict separation of development, testing, production environments with no cross-account sharing,
least-privilege access controls for delivery teams, and advanced technical security controls such as multi-factor authentication,
encryption, firewall and network segmentation, data loss prevention, vulnerability scanning and 24/7 monitoring of critical systems.
50
Section A –Combined Management Report
AI risks
The rapid advancement of AI technologies presents significant opportunities for Nagarro but also entails risk. Short innovation
cycles, unclear industry standards, differing approaches to regulation and varying legal requirements increase the challenges for
business operations and risks of non-compliance. To address these risks, Nagarro has introduced a dedicated AI task force, Responsible
AI principles and training programs.
Financial Risks
The financial instruments of Nagarro are subject to various risks, such as liquidity risks, credit risks and market risks from changes
in market prices and exchange rates. For the identification, evaluation and limitation of these risks, tiered risk management and control
systems are used. Nagarro also implements safeguards and concludes hedges for the avoidance, early identification and mitigation of
risks arising from financial instruments. With regard to financial instruments, only liquidity risks and market risks from changes in
exchange rates have been identified as material.
Financial markets
Nagarro is exposed to foreign currency risk arising from its international operations. Key examples include exchange-rate risks,
as currency fluctuations may affect the Company’s results. Currency risk arises when transactions are denominated in currencies other
than the respective functional currencies of the Nagarro group entities. Since Nagarro operates globally, it frequently invoices
customers in non-euro currencies and incurs personnel costs in other currencies. As a result, currency movements can impact Nagarro’s
revenue, expenses and profitability. The primary currencies to which Nagarro is exposed include, among others, the Euro, US Dollar,
and Indian Rupee. Nagarro’s objective is to manage foreign currency risk in a prudent manner and to minimize adverse effects on
profitability. Exposures are monitored on an ongoing basis. To this end, the Company can often renegotiate billing rates to offset for
unfavorable exchange-rate movements. In addition, measures to reduce the impact of intercompany loans on profit and loss are
currently under evaluation. Nevertheless, short-term currency risks remain. These are partially mitigated through hedging activities,
particularly with respect to Nagarro’s currency exposures in its largest service region, India, across five other currencies.
A natural hedge is achieved to some extent through the alignment of revenues and costs in the same currencies. We have a
natural hedge in high-turnover regions such as the USA and Germany. A significant proportion of our revenue and expenses are
denominated in the respective local currency. Hence there is minimal currency risk in these geographies.
In addition, Nagarro selectively uses derivative financial instruments to hedge foreign currency risk. To ensure the intended
effectiveness, the currency hedging follows a documented policy. Hedging activities are primarily focused on exposures in India, which
represents Nagarro’s primary delivery hub and where a significant portion of foreign currency-risk arises. The policy involves a monthly
process to hedge a fixed fraction (typically 1/12) of the expected receivable for each month up to one year in the future if still unhedged.
There is also a mechanism allowing some room for hedging beyond that, with adequate oversight and amount limits. The maximum
term is one year.
This hedging is not carried out at the level of individual transactions, but on the basis of the aggregate receivables of the Indian
entities. In 2025, we mainly hedged five (2024: five) currency pairs over the course of the year: USD-INR [USD 194.6 million hedged]
(2024: USD 160.5 million hedged), EUR-INR [EUR 59.5 million hedged] (2024: EUR 48.4 million hedged), SEK-INR [SEK 43.4 million
hedged] (2024: SEK 51.6 million hedged), AUD-INR [AUD 10.2 million hedged] (2024: AUD 8.3 million hedged) and GBP-INR [GBP 9.8
million hedged] (2024: GBP 11.2 million hedged).
Nagarro concludes foreign exchange forward transactions to hedge foreign currency risks of future cash flows.
In the Nagarro Indian companies, the Euro (EUR), US dollar (USD), the Swedish krone (SEK), the British pound (GBP), and the
Australian dollar (AUD) are the currencies that were hedged with respect to the Indian rupee (INR), since the customer receivables are
mainly in these currencies while purchasing costs (staff costs and the purchase of third-party services) are incurred in Indian rupees
(INR).
In each case, the maturity of the foreign exchange forward contract is less than one year.
Capital Structure
Financial risks exist in connection with potential breaches of loan covenants and the adequacy of insurance coverage, which
Nagarro continuously monitors. Non-compliance with loan covenants may cause a termination and the cancellation of credit facilities
and the repayment of amounts drawn under the loan. These risks are mitigated through ongoing monitoring and regular
communication with financial stakeholders regarding compliance with the covenants. The agreed leverage, EBITDA and equity ratios
are continuously reviewed based on financial performance and key performance indicators. In the event of inadequate insurance
coverage, there is a risk that potential liabilities or other damages may not be sufficiently covered. Nagarro therefore reviews regularly
whether existing coverage levels are appropriate in relation to its business activities in order to mitigate this risk.
51
Section A –Combined Management Report
Liquidity risk is the risk that Nagarro may not be able to meet obligations associated with its financial liabilities. Nagarro’s aim
is to have sufficient liquidity to conduct our business smoothly. Liquidity is managed by continuously monitoring it, forecasting and
monitoring cash inflows and outflows and taking appropriate measures as required. In order to ensure sufficient liquidity at all times,
bank loans, leasing and rental agreements (for the procurement of computers and equipment as well as for buildings) and factoring
options are utilized to finance business operations and investment activities. On December 31, 2025, the financial liabilities of Nagarro
amounted to €458.6 million (December 31, 2024: €453.3 million), of which €86.4 million (December 31, 2024: €86.1 million) are due
within one year.
As of December 31, 2025, 100% of the current financial liabilities (December 31, 2024: 100%) were covered by current financial
assets in the amount of €334.6 million (December 31, 2024: €419.7 million).
Current net liquidity from financial assets and liabilities decreased by €85.5 million, from €333.6 million as at December 31,
2024 to €248.1 million as at December 31, 2025. Nagarro has sufficient factoring agreements in the USA and Germany. Nagarro also
has a syndicated revolving credit facility totaling €350.0 million. These euro-denominated loans under the syndicated loan facility
amounted to a total of €304.5 million (December 31, 2024: €319.5 million). These revolving loans have a variable interest rate based on
the three-month or six-month Euribor (depending on the interest period) plus a margin of 1.75 (December 31, 2024: 1.75) percentage
points as at December 31, 2025. The unutilized portion of the loan carries interest at 35% of the margin rate of the utilized loan. In the
financial year 2025, the loans had an average interest rate of 4.02% p.a. (2024: 5.54% p.a.). The unutilized portion of the loan was subject
to an average interest rate of 0.61% p.a. (2024: 0.61% p.a.). At the end of 2025, Nagarro had unutilized balance of syndicated loan facility
amounting to €45.5 million (December 31, 2024: €30.5 million).
D. Opportunities
As Nagarro navigates an evolving digital landscape, it has identified opportunities that could position it for sustained growth
and continued market leadership. The Company believes that strategic investments in emerging technologies, geographic expansion,
penetration of key industries, partnerships, and M&A could help accelerate its growth trajectory. The following opportunities outlined
below, presented in descending order of significance, are expected to support Nagarro's next phase of growth, building on its core
strengths in digital engineering, its CARING culture, and its Fluidic Intelligence vision
Digital transformation & Agentic AI
For years, Nagarro has served as a trusted digital transformation partner to its clients, guiding them through complex
architectural shifts. Nagarro anticipates continued enterprise investment in cloud migration, legacy modernization, ERP transformation,
and platform consolidation across the industries it serves. Nagarro also expects its role to deepen as the technological landscape
evolves from basic automation towards autonomous intelligence. Agentic AI is expected emerge as an additional growth driver over
the coming years, representing a fundamental shift in how clients operate. These agents will be able to reason, plan, and execute multistep workflows independently. By integrating these capabilities into its service offerings, Nagarro is enhancing efficiency and enabling
a new generation of proactive, self-optimizing enterprises that can contribute to its long-term ambitions. Nagarro’s designation as an
OpenAI Services Partner marks a significant milestone in its AI journey. This partnership, combined with the Company’s proprietary
Fluidic Intelligence framework, positions Nagarro well to benefit from accelerating enterprise AI adoption. The market opportunity is
substantial, as organizations worldwide transition from AI experimentation to production-scale deployment and increasingly seek
partners capable of delivering this transformation.
Nagarro’s proprietary platforms, including NIA for intelligent agents, Forcastra for sales and operations planning, and Ginger
for employee support, are ready-to-deploy accelerators that can compress implementation timelines from years to months. These
platforms provide Nagarro with the opportunity to establish market-leading positions through vertical-specific agentic solutions across
the industries it serves.
Geographic expansion
Nagarro’s global expansion strategy has been, and will continue to be, focused on high-margin, high-growth corridors where
digital transformation is a cornerstone of national economic policy. Nagarro is positioning itself to capture increased market share by
aligning its localized delivery capabilities with the sovereign and enterprise needs of the world’s most resilient economies. Combined
with strategic local partnerships, this approach creates a diversified revenue base designed for long-term value creation.
• Middle East: Nagarro is capitalizing on the Middle East’s multi-billion-dollar shift toward digital diversification. Beyond
expanding its footprint in the UAE, its forward-looking roadmap includes the establishment of dedicated Centers of Excellence in Saudi
Arabia and Qatar. This infrastructure can position Nagarro to capture high-value sovereign cloud and government digitalization
contracts that require deep, onsite expertise.
• Asia Pacific: In the Asia Pacific region, Nagarro is prioritizing deep-market penetration over broad-market presence. Its
strategic alliance with Marubeni provides a high-barrier-to-entry gateway into the Japanese manufacturing and financial sectors, while
its expanded operations in Australia and Singapore position it to lead the region’s public sector modernization. The Company also
continues to evaluate strategic M&A opportunities for systems integrators to further accelerate its regional velocity.
52
Section A –Combined Management Report
• North America: Nagarro’s recent acquisitions, including Charles Hudson Technology Solutions, demonstrate its commitment
to strengthening its US capabilities. To drive growth in its largest revenue market, Nagarro is embracing a high-touch, innovation-led
delivery model. By leveraging U.S.-based AI and data-engineering teams, Nagarro is moving up the value chain to serve key government
and enterprise clients in resilient sectors such as retail, CPG, fintech and healthcare. This targeted approach allows Nagarro to act as a
transformational partner for mid-market leaders, ensuring stable, long-term recurring revenue streams.
Vertical market penetration
Nagarro’s performance in 2025 underscores the resilience of its diversified portfolio, with strategic vertical penetration serving
as a significant opportunity to drive long-term shareholder value. By aligning our deep digital engineering expertise with industryspecific imperatives, Nagarro is transitioning from a broad provider to a specialized transformational partner in several growth sectors
including:
• Automotive, Manufacturing & Industrial: Our roadmap centers focus on the evolution of software-defined vehicles and
sustainable manufacturing. Nagarro is moving beyond individual features to build enterprise-grade connected vehicle platforms and
autonomous systems. In parallel, its Edge-AI partnerships enable predictive, circular-economy solutions for the global industrial base.
• Public, Non-Profit and Education: The public sector represents a significant opportunity for high-governance digital services.
Leveraging our GDPR expertise, Nagarro is capturing demand for sovereign cloud migrations and digital citizen identity platforms in
markets that prioritize data security over traditional offshore models. For the Non-Profit sector, it is enabling mission-driven
organizations to scale its impact through intelligent automation and CRM modernization, as demonstrated by its partnership with
UNICEF and major healthcare foundations. In Education, Nagarro is transforming learning ecosystems through AI-powered interactive
platforms, like conversational AI tools and smart campus management systems.
• Retail and CPG: In a challenging consumer landscape, Nagarro focuses on operational efficiency and unified commerce. Its
future opportunities lie in composable commerce architectures and Agentic AI-driven personalization, helping retailers eliminate data
silos and optimize last-mile fulfillment through intelligent, autonomous systems.
• Financial Services & Insurance: The fundamental shift toward embedded finance and core banking modernization remains a
core priority for clients. Nagarro is deploying Agentic AI to automate complex regulatory compliance (RegTech) and legacy mainframe
transformations, ensuring our financial partners remain agile in an increasingly decentralized market.
-
Strategic partnerships
Nagarro believes that its growth trajectory can be significantly amplified through a robust ecosystem of strategic partnerships,
which act as force multipliers for its Fluidic Intelligence vision. The Company is moving beyond traditional implementation roles to
position itself as a co-innovation partners to world’s leading technology platforms. By deepening its AWS Advanced Consulting practice,
it is capturing the shift toward industry-specific cloud architectures and GenAI integration through Amazon Bedrock. Simultaneously,
Nagarro’s position as an OpenAI Services Partner allows it to offer AI transformation consulting and responsible deployment
frameworks across global markets.
Nagarro’s legacy of excellence that spans over a decade with Salesforce and a premier Oracle NetSuite alliance is now pivoting
toward Agentic AI solutions. By integrating these best-of-breed technologies into vertical-specific solutions for industries it serves,
Nagarro expects to enable its clients to scale at the speed of innovation while securing long-term, high-margin revenue streams.
M&A
Nagarro’s approach to M&A remains a cornerstone of our long-term value creation strategy, serving as a high-velocity engine
for geographic expansion, technical leadership, and client access. Nagarro’s proven integration framework allows it to onboard
specialized firms and rapidly scale its capabilities across its global delivery network. Nagarro continues to focus on geographic
expansion by acquiring firms like Infocore to anchor its Middle Eastern footprint and Inaho Digital Solutions to unlock the high-barrier
Japanese market. Looking ahead, its pipeline remains active, targeting capability enhancement through the acquisition of niche firms
in high-demand sectors. Furthermore, it continues to prioritize client access acquisitions that bring established relationships with
Fortune 500 leaders and a localized presence in key economies around the world.
These opportunities mentioned have been identified across multiple dimensions including technology leadership, geographic
expansion, vertical penetration, ecosystem partnerships, and M&A. Nagarro enters 2026 with confidence in its strategy, excitement
about its prospects, and commitment to creating value for all stakeholders including its employees, its clients, its shareholders, and the
local communities it serves.
53
Section A –Combined Management Report
E. Overall Assessment of Group’s Risks and Opportunities
In overall assessment of our risk situation, Nagarro considers the measures and provisions to be appropriate for addressing the
identified risks. The Company’s financial resources are stable, and its liquidity requirements are covered through existing liquidity and
available financing instruments. Based on the assessed financial impact and likelihood of occurrence, together with current business
outlook and financial position and at the time of preparing the consolidated financial statements, no risks have been identified that,
individually or collectively, could jeopardize Nagarro's continued existence. At the same time, Nagarro has sufficient resources available
to take advantage of opportunities that may arise from changes in market environment.
F. Appropriateness and effectiveness of ICS,RMS and CMS (not
audited by the auditor)
Nagarro is continuously working on enhancing its Risk Management System (RMS), its Internal Control System (ICS) and its
Compliance Management System (CMS) in order to identify and eliminate any weaknesses and to optimize the systems and their
processes. As part of this ongoing review process, we identified the need for further adjustments and improvement opportunities in
the existing systems during the reporting year. We have initiated target measures to enhance the system, supported by external
advisors and partially improved in financial year 2025. At the time of reporting, there is no evidence in any material respect to suggest
that the RMS, ICS and CMS are generally inadequate or ineffective. The Management Board intends to continue driving these measures
forward in financial year 2026, with the aim of further strengthening the effectiveness and efficiency of corporate governance structure
as well as the Risk Management System, the Internal Control System and the Compliance Management System.
Munich, April 27, 2026
For the Management Board of Nagarro SE:
Manas Human
Annette Mainka
Vikram Sehgal
Chairperson
Member
Member
54
Section B – Consolidated Financial Statements
Section B
Consolidated
Financial
Statements
of Nagarro SE
for the financial year 2025 in
accordance with IFRS
55
Section B – Consolidated Financial Statements
Index
Consolidated statement of financial position ........................................................................................... 58
Consolidated statement of comprehensive income ................................................................................ 60
Consolidated statement of changes in equity .......................................................................................... 62
Consolidated statement of cash flows ...................................................................................................... 64
Notes to the consolidated financial statements ....................................................................................... 65
A.
General information .................................................................................................................................................... 65
1.
Corporate information .................................................................................................................................................................................................................................. 65
Basis of accounting ......................................................................................................................................................................................................................................... 65
B.
Material accounting policies...................................................................................................................................... 66
1.
New and amended standards adopted ................................................................................................................................................................................................. 66
Standards and interpretations not yet applied................................................................................................................................................................................... 66
Basis of consolidation .................................................................................................................................................................................................................................... 68
Currency translation ....................................................................................................................................................................................................................................... 70
Notes to the consolidated statement of financial position ............................................................................................................................................................ 73
Notes to the consolidated statement of comprehensive income ............................................................................................................................................... 83
Estimates and assumptions......................................................................................................................................................................................................................... 85
Measurement of fair values ......................................................................................................................................................................................................................... 86
C.
Notes to the consolidated statement of financial position ................................................................................. 87
1.
Intangible assets .............................................................................................................................................................................................................................................. 87
Goodwill .............................................................................................................................................................................................................................................................. 89
Property, plant and equipment ................................................................................................................................................................................................................. 90
Right-of-use assets and lease liabilities .................................................................................................................................................................................................. 91
Other financial assets ..................................................................................................................................................................................................................................... 95
Other assets ....................................................................................................................................................................................................................................................... 95
Income taxes ..................................................................................................................................................................................................................................................... 96
Contract assets and liabilities ..................................................................................................................................................................................................................... 99
Trade receivables ......................................................................................................................................................................................................................................... 101
Cash and cash equivalents ....................................................................................................................................................................................................................... 102
Equity ................................................................................................................................................................................................................................................................ 103
Loans and borrowings ............................................................................................................................................................................................................................... 107
Employee benefits liabilities .................................................................................................................................................................................................................... 109
Liabilities from acquisitions ..................................................................................................................................................................................................................... 113
Other financial liabilities ............................................................................................................................................................................................................................ 114
Other provisions ........................................................................................................................................................................................................................................... 114
Other liabilities .............................................................................................................................................................................................................................................. 116
Financial instruments .................................................................................................................................................................................................................................. 116
D.
Notes to the consolidated statement of comprehensive income .................................................................. 125
1.
Revenue ............................................................................................................................................................................................................................................................ 125
Other operating income............................................................................................................................................................................................................................ 126
Cost of freelancers and other direct cost ........................................................................................................................................................................................... 127
Staff costs ........................................................................................................................................................................................................................................................ 127
Other operating expenses........................................................................................................................................................................................................................ 128
Depreciation, amortization and impairment .................................................................................................................................................................................... 129
Finance income ............................................................................................................................................................................................................................................. 129
Finance costs .................................................................................................................................................................................................................................................. 130
56
Section B – Consolidated Financial Statements
9.
E.
Earnings per share (EPS) ........................................................................................................................................................................................................................... 130
Notes to the consolidated statement of cash flows........................................................................................... 132
1.
Reconciliation of cash flows from changes in net working capital .......................................................................................................................................... 132
Reconciliation of net cash flows from non-recourse factoring ................................................................................................................................................. 132
Reconciliation of financial liabilities ..................................................................................................................................................................................................... 133
Net cash flows from business combinations ..................................................................................................................................................................................... 134
F.
Other disclosures...................................................................................................................................................... 136
1.
Business combinations .............................................................................................................................................................................................................................. 136
Related party transactions ........................................................................................................................................................................................................................ 140
Adjusted EBITDA ........................................................................................................................................................................................................................................... 142
Gross profit and gross margin ................................................................................................................................................................................................................ 143
Segment information ................................................................................................................................................................................................................................. 144
Contingent liabilities and guarantees .................................................................................................................................................................................................. 145
Capital management .................................................................................................................................................................................................................................. 145
Share-based payment arrangements .................................................................................................................................................................................................. 146
Financial risk management ...................................................................................................................................................................................................................... 152
Governing bodies of Nagarro SE ........................................................................................................................................................................................................... 159
Publication ...................................................................................................................................................................................................................................................... 162
Corporate governance code ................................................................................................................................................................................................................... 162
Events after the balance sheet date ...................................................................................................................................................................................................... 162
57
Section B – Consolidated Financial Statements
Consolidated statement of financial position
Assets
Note
December 31, 2025
December 31, 2024
Intangible assets
C.1.
44,434
43,396
Goodwill
C.2.
206,362
214,242
Property, plant and equipment
C.3.
8,312
10,029
Right-of-use assets
C.4.
69,942
53,274
Non-current contract assets
C.8.
399
432
Other non-current financial assets
C.5.
3,902
2,133
Other non-current assets
C.6.
1,133
663
Deferred tax assets
C.7.
26,864
16,491
361,349
340,660
in kEUR
Non-current assets
Current contract assets
C.8.
20,725
15,529
Trade receivables
C.9.
198,263
219,332
Other current financial assets
C.5.
11,686
7,850
Other current assets
C.6.
14,866
13,324
11,456
6,440
124,617
192,567
Current assets
381,614
455,041
Total assets
742,963
795,701
Income tax receivables
Cash and cash equivalents
C.10.
58
Section B – Consolidated Financial Statements
Equity and liabilities
Note
December 31, 2025
December 31, 2024
Share capital
C.11.
12,922
13,776
Treasury shares, at cost
C.11.
(40,213)
(39,757)
Capital reserve
C.11.
241,794
241,030
Profit carried forward
C.11.
185,624
215,631
Net profit for the period
C.11.
39,492
49,156
Changes in equity recognized directly in equity
C.11.
(260,612)
(260,612)
Other comprehensive income
C.11.
(23,984)
3,436
155,024
222,660
in kEUR
Total equity
Non-current loans and borrowings
C.12.
307,112
320,835
Non-current lease liabilities
C.4.
53,818
36,086
Long-term employee benefits liabilities
C.13.
33,827
22,581
Other long-term provisions
C.16.
212
434
Other non-current financial liabilities
C.15.
5,861
5,743
Non-current liabilities from acquisitions
C.14.
5,349
4,468
Deferred tax liabilities
C.7.
13,869
13,785
420,048
403,932
Non-current liabilities
Current loans and borrowings
C.12.
2,948
8,777
Current lease liabilities
C.4.
18,269
18,396
Short-term employee benefits liabilities
C.13.
14,315
16,085
Other short-term provisions
C.16.
26,989
26,365
Current contract liabilities
C.8.
14,285
14,105
19,036
17,076
Trade payables
Current liabilities from acquisitions
C.14.
3,871
1,405
Other current financial liabilities
C.15.
42,305
40,478
Other current liabilities
C.17.
15,711
17,022
Income tax liabilities
10,163
9,399
Current liabilities
167,891
169,108
Total liabilities
587,939
573,041
Equity and liabilities
742,963
795,701
59
Section B – Consolidated Financial Statements
Consolidated statement of comprehensive income
Profit or loss
Note
2025
2024
D.1.
999,296
971,987
127
259
9,085
30,597
in kEUR
Revenue
Own work capitalized
Other operating income
D.2.
Cost of freelancers and other direct costs
D.3.
(82,869)
(68,879)
Staff costs
D.4.
(706,247)
(703,022)
Reversal of impairment/(impairment) of trade receivables, contract assets and other financial
assets
F.9.
380
(3,015)
Other operating expenses
D.5.
(101,076)
(93,878)
118,694
134,049
(35,688)
(37,317)
Earnings before interest, taxes, depreciation and amortization (EBITDA)
Depreciation, amortization and impairment
D.6.
Earnings before interest and taxes (EBIT)
83,007
96,732
Finance income
D.7.
2,503
3,500
Finance costs
D.8.
(20,062)
(21,133)
65,448
79,099
(25,955)
(29,943)
39,492
49,156
Note
2025
2024
C.13.
1,701
559
Earnings before taxes (EBT)
Income taxes
C.7.
Profit for the period
Other comprehensive income
in kEUR
Items that will not be reclassified to profit or loss
Actuarial gains (losses)
Tax effects
(329)
(336)
1,373
223
(29,205)
14,223
412
(720)
(28,793)
13,503
Other comprehensive income for the period
(27,420)
13,726
Total comprehensive income for the period
12,072
62,882
Items that may be reclassified to profit or loss
Foreign exchange differences
Tax effects
60
Section B – Consolidated Financial Statements
Basic earnings per share ('Basic EPS') in EUR:
D.9.
- based on weighted average
3.08
3.69
- based on outstanding shares
3.18
3.69
- based on weighted average
3.08
3.69
- based on outstanding shares
3.18
3.69
Diluted earnings per share ('Diluted EPS') in EUR:
D.9.
61
Section B – Consolidated Financial Statements
Consolidated statement of changes in equity
Capital reserves
Profit carried forward
Net profit for the period
Changes in equity recognized
directly in equity
(39,757)
241,030
215,631
49,156
(260,612)
6,539
(3,102)
222,660
Profit for the year
–
–
–
–
39,492
–
–
–
39,492
Other comprehensive
income for the year
–
–
–
–
–
–
(28,793)
1,373
(27,420)
Total comprehensive
income for the year
–
–
–
–
39,492
–
(28,793)
1,373
12,072
Transfer of profit or loss
for the previous year to
profit carried forward
–
–
–
49,156
(49,156)
–
–
–
–
Purchase of treasury
shares
–
(67,835)
–
–
–
–
–
–
(67,835)
Dividends
–
–
–
(12,638)
–
–
–
–
(12,638)
(854)
67,379
–
(66,525)
–
–
–
–
–
Share capital issued
–
–
–
–
–
–
–
–
–
Stock option (SOP) and
employee share
participation program
expense
–
–
765
–
–
–
–
–
765
12,922
(40,213)
241,794
185,624
39,492
(260,612)
(22,255)
(1,729)
155,024
Total equity
Treasury shares
13,776
Foreign exchange differences
Share capital
Actuarial gain or loss on pension
provisions
Other comprehensive
income
in kEUR
Balance at January 1,
2025
Redemption of treasury
shares
Balance at December 31,
2025
62
Section B – Consolidated Financial Statements
Treasury shares
Capital reserves
Profit carried forward
Net profit for the period
Changes in equity recognized
directly in equity
Foreign exchange differences
13,776
(39,757)
251,717
166,476
49,155
(260,612)
(6,964)
(3,325)
170,466
–
–
–
–
49,156
–
–
–
49,156
Total equity
Share capital
Actuarial gain or loss on pension
provisions
Other comprehensive
income
in kEUR
Balance at January 1, 2024
Profit for the year
Other comprehensive income for the year
–
–
–
–
–
–
13,503
223
13,726
Total comprehensive income for the year
–
–
–
–
49,156
–
13,503
223
62,882
Transfer of profit or loss for the previous year to
profit carried forward
–
–
–
49,155
(49,155)
–
–
–
–
Purchase of treasury shares
–
–
–
–
–
–
–
–
–
Dividends
–
–
–
–
–
–
–
–
–
Share capital issued
–
–
–
–
–
–
–
–
–
Transfer of capital reserves to provisions on
modification of equity-settled SOP to cash-settled
SOP
–
–
(13,893)
–
–
–
–
–
(13,893)
Stock option and employee share participation
program expense
–
–
3,206
–
–
–
–
–
3,206
13,776
(39,757)
241,030
215,631
49,156
(260,612)
6,539
(3,102)
222,660
Balance at December 31, 2024
63
Section B – Consolidated Financial Statements
Consolidated statement of cash flows
Cash flows
Note
2025
2024
EBIT
83,007
96,732
Depreciation, amortization and impairments of non-current assets
35,688
37,317
Change in long-term employee benefits liabilities
13,237
3,346
Other non-cash income and expenses
20,834
5,263
(43,045)
(32,885)
(9,221)
(16,723)
in kEUR
Cash flows from operating activities
Income taxes paid
Cash flows from changes in net working capital
E.1.
Net cash (outflows) / inflows from non-recourse factoring
E.2.
2,310
(6,530)
102,809
86,520
(7,765)
(7,372)
34
141
Investment in fixed deposits
(728)
4,761
Interest received
2,526
3,843
Net cash inflow from operating activities
Cash flows from investing activities
Payments for property, plant and equipment and intangible assets
Proceeds from sale of property, plant and equipment
Acquisition of subsidiaries, net of cash acquired
E.4.
Net cash outflow from investing activities
(16,126)
(18,216)
(22,059)
(16,842)
(12,637)
Cash flows from financing activities
Dividend paid
Purchase of treasury shares
C.11.
(67,835)
Proceeds from bank loans
E.3.
19,758
56,229
Repayment of bank loans
E.3.
(35,339)
(4,587)
Payment of principal portion of lease liabilities
E.3.
(22,600)
(23,895)
(17,528)
(17,885)
Net cash (outflow)/ inflow from financing activities
(136,182)
9,862
Total cash flow
(55,431)
79,540
(8,464)
(438)
(63,896)
79,102
Interest paid
Effects of exchange rate changes on cash and cash equivalents
Total changes in cash and cash equivalents
Cash and cash equivalents at the beginning of the period
C.10.
186,879
107,777
Cash and cash equivalents at the end of the period
C.10.
122,984
186,879
64
Section B – Consolidated Financial Statements
Notes to the consolidated financial statements
A. General information
-
Corporate information
The consolidated financial statements comprise Nagarro SE (the “parent company”) and its subsidiaries (together referred to
as “Nagarro”) and are prepared in compliance with International Financial Reporting Standards (IFRS), as endorsed by the European
Union (EU) and the additional requirements pursuant to Section 315e (1) of the German Commercial Code (Handelsgesetzbuch – HGB).
Nagarro SE’s registered office is Baierbrunner Str. 15, 81379 Munich, Germany. It is registered with the commercial register of the District
Court of Munich under commercial register sheet number HRB 254410. Nagarro’s bouquet of specialized services includes digital
product engineering, digital commerce and customer experience, Big Data and AI services, new-gen ERP consulting and managed
services. The shares of Nagarro SE are traded under ISIN DE000A3H2200 in the Prime Standard (Regulated Market) in Frankfurt a. M.
(Xetra) and in the over-the-counter markets in Berlin, Düsseldorf, Hamburg, Munich, Stuttgart and Tradegate Exchange.
-
Basis of accounting
Nagarro SE, Munich, is the company that prepares the consolidated financial statements for the largest and smallest group of
companies. The consolidated financial statements are published in the company register and are available online at
https://www.nagarro.com/en/investor-relations/financial-reports-and-publications.
The consolidated financial statements of Nagarro SE were prepared in compliance with the International Financial Reporting
Standards (IFRS) as issued by the International Accounting Standards Board (IASB) and as adopted by the European Union (EU) and
according to the commercial law regulations pursuant to Section 315e of the German Commercial Code (HGB).
These consolidated financial statements of Nagarro SE, prepared in accordance with IFRS, consist of the consolidated statement
of financial position, consolidated statement of comprehensive income, consolidated statement of changes in equity, consolidated
statement of cash flows and notes to the consolidated financial statements. The consolidated financial statements of Nagarro SE are
based on the going concern assumption.
The consolidated financial statements are presented in euros, which is Nagarro SE’s functional currency. Amounts are stated in
thousands of euros (kEUR), except where otherwise indicated. Decimal values of 0.5 or greater are rounded upward and decimal values
below 0.5 are rounded downward. Rounding differences may arise when individual amounts or percentages are added together. The
figures reported in the consolidated financial statements for the financial year are presented with comparative figures from the
previous year.
The consolidated financial statements were prepared on April 27, 2026 by the Management Board of Nagarro SE and approved
for publication.
Details of Nagarro’s accounting policies, including changes thereto, are included in Note B. Material accounting policies.
65
Section B – Consolidated Financial Statements
B. Material accounting policies
Nagarro has consistently applied the following material accounting policies to the whole period presented in these
consolidated financial statements.
- New and amended standards adopted
The group applied for the first time the below amendments to IFRS Standards and Interpretations issued by the International
Accounting Standards Board (IASB) that are effective for an annual period that begins on or after January 1, 2025:
Standard / interpretation
Title of the standard, interpretation or amendment
Amendments to IAS 21
Lack of exchangeability
Amendments to IAS 21
For annual reporting periods beginning on or after 1 January 2025, Lack of Exchangeability – Amendments to IAS 21 The Effects
of Changes in Foreign Exchange Rates specifies how an entity should assess whether a currency is exchangeable and how it should
determine a spot exchange rate when exchangeability is lacking. The amendments also require disclosure of information that enables
users of its financial statements to understand how the currency not being exchangeable into the other currency affects, or is expected
to affect, the entity’s financial performance, financial position and cash flows.
The amendments did not have an impact on Nagarro's consolidated financial statements.
- Standards and interpretations not yet applied
The IASB and IFRIC have issued the standards as detailed in the table below, the application of which was not yet mandatory for
the periods presented in the consolidated financial statements according to the EU regulations.
Nagarro has not applied for early adoption of any of the standards/interpretations that were allowed.
Standard / interpretation
Title of the standard, interpretation or amendment
First time application
Amendments to IFRS 9 and IFRS 7
Classification and measurement of financial instruments and
Contracts referencing nature-dependent electricity
January 1, 2026
Annual Improvements - Volume 11
Amendments to:
January 1, 2026
Endorsed by the EU
IFRS 1 First-time adoption of International Financial Reporting
Standards;
IFRS 7 Financial Instruments: Disclosures and its accompanying
Guidance on implementing IFRS 7;
IFRS 9 Financial Instruments;
IFRS 10 Consolidated financial statements; and
IAS 7 Statement of cash flows
IFRS 18
Presentation and disclosure in financial statements
January 1, 2027
IFRS 19
Subsidiaries without public accountability: Disclosures
January 1, 2027
Amendments to IAS 21
IAS 21 The effects of changes in foreign exchange rates: Translation to a
hyperinflationary presentation currency
January 1, 2027
Not yet endorsed by the EU
66
Section B – Consolidated Financial Statements
Amendments to IFRS 9 and IFRS 7
The amendments will be effective for annual reporting periods beginning on or after 1 January 2026, with early application
permitted. The amendments are not expected to have a significant impact on Nagarro's consolidated financial statements.
Annual improvements – Volume 11
Annual improvements contain amendments to IFRS 1, IFRS 7, IFRS 9, IFRS 10, and IAS 7. The amendments are intended to
improve the consistency of the standards by clarifying wording, correcting errors, and simplifying the standards. The amendments will
be effective for annual reporting periods beginning on or after 1 January 2026. The annual improvements are not expected to have a
significant impact on Nagarro's consolidated financial statements.
IFRS 18
IFRS 18 will replace IAS 1 Presentation of Financial Statements and the new standard introduces the following key new
requirements.
• Nagarro will be required to classify all income and expenses into five categories in the statement of profit or loss, namely the
operating, investing, financing, discontinued operations and income tax categories. Nagarro will also be required to present a newlydefined operating profit subtotal. Nagarro’s net profit will not change.
• Management-defined performance measures (MPMs) will be disclosed in a single note in the financial statements.
• Enhanced guidance will be provided on how to group information in the financial statements.
In addition, Nagarro will be required to use the operating profit subtotal as the starting point for the statement of cash flows
when presenting operating cash flows under the indirect method.
Nagarro is still in the process of assessing the impact of the new standard, particularly with respect to the structure of Nagarro's
statement of profit or loss, the statement of cash flows and the additional disclosures required for MPMs. Nagarro is also assessing the
impact on how information is grouped in the financial statements.
The amendments will be effective for annual reporting periods beginning on or after 1 January 2027, with early application
permitted.
IFRS 19
IFRS 19 will allow eligible entities to elect to apply its reduced disclosure requirements while still applying the recognition,
measurement and presentation requirements in other IFRS accounting standards. To be eligible, at the end of the reporting period, an
entity must be a subsidiary as defined in IFRS 10, cannot have public accountability and must have a parent (ultimate or intermediate)
that prepares consolidated financial statements, available for public use, which comply with IFRS accounting standards.
IFRS 19 will become effective for reporting periods beginning on or after 1 January 2027, with early application permitted.
As Nagarro’s equity is publicly traded, it is not eligible to elect to apply IFRS 19.
Amendments to IAS 21
The amendments clarify the translation requirements when an entity presents its financial statements in a hyperinflationary
presentation currency. As Nagarro’s presentation currency is the Euro (EUR), which is not a hyperinflationary currency, the amendments
are not expected to be applicable. Accordingly, Nagarro does not expect the amendments to have a material impact on its consolidated
financial statements.
The amendments will become effective for reporting periods beginning on or after 1 January 2027, with early application
permitted.
67
Section B – Consolidated Financial Statements
- Basis of consolidation
Consolidation
The consolidated financial statements of Nagarro group include Nagarro SE and its subsidiaries (together “Nagarro”).
Subsidiaries are entities which are controlled by Nagarro. Nagarro controls an entity, in particular, if and only if it possesses all of the
following characteristics:
- the power of disposal over the investee company (i.e., Nagarro has the possibility to control those activities of the investee
company that have a significant influence on its return on the basis of currently existing rights),
- a risk burden due to or entitlement to fluctuating returns from its involvement in the investee company, and
- the ability to use its power of disposal over the investee company in such a way that the return of the investee company is
thereby influenced.
If Nagarro does not hold a majority of the voting rights or comparable rights in an investee company, it takes all facts and
circumstances into account when assessing whether it has the power of disposal of this investee company. These include:
- a contractual agreement with the other voters,
- rights resulting from other contractual agreements,
- voting rights and potential voting rights of the Group.
The financial statements of the subsidiaries are prepared in accordance with uniform accounting policies, on the same reporting
date as the financial statements of Nagarro SE and the financial statements of Nagarro group. The financial statements of subsidiaries
are included in the consolidated financial statements from the date on which control commences until the date on which control ceases.
In the event of loss of control, deconsolidation takes place at that time. Intra-group balances and business transactions and the resulting
unrealized intra-group gains and losses as well as dividends are eliminated in full. The tax deferrals required by IAS 12 are applied to
temporary differences from consolidation.
The same consolidation methods were used for the 2025 and 2024 consolidated financial statements.
Business combinations
Business combinations are accounted for using the acquisition method when the acquired set of activities and assets meet the
definition of a business and control is transferred to Nagarro. In determining whether a particular set of activities and assets is a business,
Nagarro assesses whether the set of assets and activities acquired includes, at a minimum, an input and substantive process and
whether the acquired set has the ability to produce outputs.
Nagarro has an option to apply the ‘concentration test’ that permits a simplified assessment of whether an acquired set of
activities and assets is not a business. The optional concentration test is met if substantially all of the fair value of the gross assets
acquired is concentrated in a single identifiable asset or group of similar identifiable assets.
The consideration transferred in the acquisition, for the identifiable net assets acquired, is measured at fair value. Any goodwill
that arises is tested annually for impairment. Any gain on a bargain purchase price is recognized in the consolidated statement of profit
or loss. Transaction costs are expensed as incurred and included in other operating expenses.
Any contingent consideration is measured at fair value at the date of acquisition. If an obligation to pay contingent
consideration that meets the definition of a financial instrument is classified as equity, then it is not remeasured, and settlement is
accounted within equity. Otherwise, other contingent consideration is remeasured at fair value at each reporting date and subsequent
changes in fair value of the contingent consideration are recognized in the consolidated statement of profit or loss. If the obligation to
pay contingent consideration to the selling shareholders, who become employees of Nagarro, is forfeited upon termination of
employment subject to the assessment of the likelihood of this happening, the contingent consideration, whether earnout or retention
payments, is remuneration for post-combination services and not part of the consideration for the acquisition and accordingly not
capitalized. These post-combination services are accounted for as an expense as staff costs, based on best estimates to meet the agreed
targets for the reporting period and satisfy the earnout and retention criteria.
Subsidiaries
The financial statements of subsidiaries are included in the consolidated financial statements from the date on which control
commences until the date on which control ceases.
68
Section B – Consolidated Financial Statements
The following table presents an overview of the legal entities that are in scope of consolidation for the reporting periods
presented in the consolidated financial statement.
December 31,
2025
2024
100.00%
100.00%
100.00%
100.00%
Nagarro Software Pvt. Ltd., Gurugram, India
100.00%
100.00%
Nagarro Software S.A. De C.V., Monterrey, Mexico
100.00%
100.00%
Nagarro Software Inc., Fishers, USA
100.00%
100.00%
Nagarro Software Solutions (Beijing), Inc. (China)
100.00%
100.00%
Advanced Technology Consulting Service Inc., San Jose, USA
100.00%
100.00%
100.00%
100.00%
Ace Outsource LC, Salt Lake City, USA
100.00%
100.00%
RipeConcepts Incorporated, Cebu, Philippines
100.00%
100.00%
Nagarro GS Inc., San Jose, USA
100.00%
100.00%
Telesis7 LLC, Missouri, USA
100.00%
100.00%
100.00%
100.00%
100.00%
100.00%
100.00%
100.00%
100.00%
100.00%
Nagarro SDN. BHD., Kuala Lumpur, Malaysia
100.00%
100.00%
Nagarro K.K., Tokyo, Japan
100.00%
100.00%
100.00%
100.00%
100.00%
100.00%
Nagarro SE, Munich, Germany
Nagarro Inc., San Jose, USA
Advanced Technology Consulting Service Canada Inc., Toronto, Canada
Charles Hudson Technology Solutions Inc., Cambridge, USA
CH Technology Solutions India Private Limited, Karnataka, India
Nagarro Global Services Asia Pte. Ltd., Singapore
Nagarro Enterprise Services Pvt. Ltd., Gurugram, India
Advanced Technology Consulting Service Private Limited, Jaipur, India
Inaho Digital Solutions Co. Ltd., Tokyo, Japan 1)
Nagarro (Private) Limited, Colombo, Sri Lanka
Techmill Global Pte Ltd, Singapore
Tech Mills (Australia) Pty Ltd, Sydney, Australia
100.00%
100.00%
Nagarro Software AB, Stockholm, Sweden
100.00%
100.00%
Nagarro GmbH, Vienna, Austria
100.00%
100.00%
Nagarro LLC, Almaty, Kazakhstan 4)
Nagarro ATCS GmbH, Stuttgart, Germany
100.00%
100.00%
100.00%
Nagarro SRL, Cluj-Napoca, Romania
100.00%
100.00%
Nagarro iQuest Schweiz AG, Zurich, Switzerland
100.00%
100.00%
iQuest SPZOO, Warsaw, Poland
100.00%
100.00%
100.00%
100.00%
100.00%
100.00%
Nagarro AS, Oslo, Norway
100.00%
100.00%
Nagarro Pty. Ltd., Sydney, Australia
100.00%
100.00%
100.00%
Nagarro Ltd., Valetta, Malta
100.00%
100.00%
Nagarro Pty. Ltd., Pretoria, South Africa
100.00%
100.00%
Nagarro Company Ltd., Bangkok, Thailand
100.00%
100.00%
Nagarro Ltd., Port Louis, Mauritius
100.00%
100.00%
Nagarro MENA LLC, Dubai, UAE
100.00%
100.00%
Nagarro Software Co. W.L.L, Manama, Bahrain
100.00%
100.00%
Nagarro for Information Technology, Riyadh, Saudi Arabia
100.00%
100.00%
100.00%
Nagarro GmbH, Munich, Germany
Nagarro Software Ltd., London, United Kingdom
FWD View Ltd., London, United Kingdom
Nagarro Oy, Espoo, Finland 3)
Nagarro Software FZCO, Dubai, UAE 3)
69
Section B – Consolidated Financial Statements
Nagarro Software Co. W.L.L, New Cairo, Egypt
100.00%
100.00%
100.00%
Nagarro ES GmbH, Kronberg im Taunus, Germany
100.00%
100.00%
Nagarro ES France SAS, Entzheim, France
100.00%
100.00%
Nagarro Denmark A/S, Herlev, Denmark
100.00%
100.00%
Nagarro S.A.S., Quito, Ecuador
100.00%
100.00%
Nagarro Software S.A.S., Bogotá D.C., Colombia
100.00%
100.00%
Nagarro, UNIPESSOAL LDA, Funchal, Portugal
100.00%
100.00%
100.00%
Nagarro Co., Ltd., Taipei, Taiwan
100.00%
100.00%
Infocore Engineering & IT Services GmbH, Kronberg im Taunus, Germany
100.00%
100.00%
Advanced Programming Solutions, S.L., Palma de Mallorca, Spain
100.00%
100.00%
M.B.İ.S Bilgisayar Otomasyon Danışmanlık ve Eğitim Hizmetleri Sanayi ve Ticaret A.Ş.,
Istanbul, Türkiye
100.00%
100.00%
Novaline Bilişim Teknolojileri Danışmanlığı A.Ş., Istanbul, Türkiye
100.00%
100.00%
Analytica Bilgi Teknolojileri A.Ş., Istanbul, Türkiye
100.00%
100.00%
Nagarro Korlátolt Felelősségű Társaság, Budapest, Hungary
100.00%
100.00%
Nagarro Software Limited, Dublin, Ireland
100.00%
100.00%
Nagarro AI Limited, Dubai, United Arab Emirates
Nagarro Software, S.L., Madrid, Spain 6)
These companies were acquired in 2025
This company was merged with Nagarro Global Services Asia Pte. Ltd., Singapore in 2025
These companies were closed in 2025
These companies were incorporated in 2025
This company was merged with Nagarro GmbH, Germany in 2025
This company was merged with Advanced Programming Solutions, S.L., Spain in 2025
Nagarro has merged the following legal entities during the year:
(i)
Nagarro Software, S.L., Spain has been merged with Advanced Programming Solutions, S.L., Spain with an effective merger
date of January 1, 2025.
(ii) Nagarro ATCS GmbH, Germany, merged with Nagarro GmbH, Germany. The merger became legally effective on August 7,
2025 and applies retroactively to January 2, 2025 for internal and accounting purposes.
(iii) Techmill Global Pte Ltd, Singapore has been merged with Nagarro Global Services Asia Pte. Ltd., Singapore with an effective
merger date of December 24, 2025.
- Currency translation
The functional currency of the entities located in the Eurozone is the Euro. The functional currency of all other entities is the
respective local currency. As part of the preparation of the consolidated financial statements, the annual financial statements of the
entities prepared in a foreign currency were translated into Euro, the reporting currency of Nagarro.
Transactions and balances
Transactions in foreign currencies different from the functional currency of the respective Nagarro company are translated at
the exchange rate on the transaction date.
Monetary assets and liabilities denominated in foreign currencies are translated at the functional currency exchange rate at the
reporting date. If it results in exchange rate gains or losses due to payments or measurements of monetary assets and liabilities at later
points in time, these are recognized in profit or loss of the respective Nagarro company. These incomes and expenses from currency
translation are shown on a net basis in these consolidated financial statements.
Non-monetary items that are measured in terms of historical cost in a foreign currency are translated using the exchange rates
at the dates of the initial transactions of the respective Nagarro company. Non-monetary items measured at fair value in a foreign
currency are translated using the exchange rates at the date when the fair value is determined by the respective Nagarro company. The
gain or loss arising on translation of non-monetary items measured at fair value is treated in line with the recognition of the gain or loss
on the change in fair value of the item (i.e., translation differences on items whose fair value gain or loss is recognized in Other
70
Section B – Consolidated Financial Statements
Comprehensive Income (“OCI”) or profit or loss are also recognized in OCI or profit or loss, respectively) of the respective Nagarro
company.
Non-Eurozone Nagarro entities
The results and financial position of foreign operations that have a functional currency different from the presentation currency
are translated into the presentation currency as follows:
(i)
At the consolidation level, items of the statement of comprehensive income are translated at the yearly average rate (unless
this is not a reasonable approximation of the cumulative effect of the rates prevailing on the transaction dates, in which
case income and expenses are translated at the dates of the transactions) from the respective functional currency of the
subsidiaries to Euro.
(ii) The closing rates at the period end were used for the translation of assets and liabilities.
(iii) Differences arising from translation to Nagarro’s reporting currency are reported directly in other comprehensive income
not impacting profit or loss.
Any goodwill arising on the acquisition of a foreign operation and any fair value adjustments to the carrying amounts of assets
and liabilities arising on the acquisition are treated as assets and liabilities of the foreign operation and translated at the exchange rate
at the reporting date.
When a foreign operation is disposed of in its entirety or partially such that the control, significant influence or joint control is
lost, the cumulative amount in the translation reserve related to that foreign operation is reclassified to consolidated statement of profit
or loss as part of the gain or loss on disposal. If Nagarro disposes of part of its interest in a subsidiary but retains control, then the relevant
proportion of the cumulative interest is reattributed to non-controlling interests.
71
Section B – Consolidated Financial Statements
The following exchange rates are applied for the translation of annual financial statements prepared in foreign currencies:
Average rate
Period-end rate
per 1 EUR
per 1 EUR
Currency
2025
2024
Dec 31, 2025
Dec 31, 2024
Australian Dollar
AUD
1.752
1.640
1.757
1.674
Bahraini Dinar
BHD
0.426
0.408
0.443
0.392
Canadian Dollar
CAD
1.579
1.482
1.609
1.493
Chinese Yuan Renminbi
CNY
8.121
7.777
8.213
7.581
Colombian Peso
COP
4573.092
4405.814
4418.540
4578.940
Danish Krone
DKK
7.463
7.459
7.469
7.458
Egyptian Pound
EGP
55.624
52.807
55.991
52.807
Indian Rupee
INR
98.534
90.531
105.518
88.906
Japanese Yen
JPY
169.076
163.822
183.926
162.897
Malaysian Ringgit
MYR
4.836
4.949
4.764
4.642
Mauritian Rupee
MUR
51.741
49.980
54.248
48.817
Mexican Peso
MXN
21.674
19.813
21.128
21.553
Norwegian Krone
NOK
11.724
11.632
11.823
11.788
Philippine Peso
PHP
64.975
61.974
69.162
60.320
Polish Zloty
PLN
4.241
4.306
4.229
4.274
Romanian Leu
RON
5.041
4.975
5.096
4.976
Saudi Riyal
SAR
4.240
4.060
4.403
3.902
Singapore Dollar
SGD
1.476
1.446
1.509
1.415
South African Rand
ZAR
20.192
19.827
19.469
19.559
Sri Lankan Rupee
LKR
340.079
326.680
363.953
304.454
Swedish Krona
SEK
11.067
11.437
10.814
11.460
Swiss Franc
CHF
0.947
0.964
0.937
0.947
Thai Baht
THB
37.125
38.163
37.027
35.620
UAE Dirham
AED
4.151
3.974
4.312
3.815
United Kingdom Pound
GBP
0.857
0.847
0.872
0.829
US Dollar
USD
1.130
1.082
1.174
1.039
Hungarian Forint
HUF
397.831
395.327
385.084
411.275
Turkish Lira
TRY
50.544
36.802
50.544
36.802
New Taiwan Dollar
TWD
35.177
34.738
36.839
34.036
Kazakhstani Tenge
KZT
598.802
0.000
595.238
0.000
72
Section B – Consolidated Financial Statements
- Notes to the consolidated statement of financial position
The consolidated statements of financial position are prepared in accordance with IAS 1 Presentation of Financial Statements.
Assets that are realized within the next twelve months and liabilities that are due within one year are generally reported as current.
a.
Goodwill
Goodwill arising on the acquisition of subsidiaries is measured at cost less any accumulated impairment losses. For the purpose
of impairment testing, goodwill acquired in a business combination is aligned to the single cash-generating unit.
Where goodwill has been aligned to the single cash-generating unit (CGU) and part of the operation within that single unit is
disposed of, the goodwill associated with the disposed operation is included in the carrying amount of the operation when determining
the gain or loss on disposal. Goodwill disposed of in these circumstances is measured based on the relative values of the disposed of
operation and the portion of the cash-generating unit retained.
b.
Intangible assets
Orders on hand, customer lists, websites, and products acquired in business combinations are initially recognized at fair value
and subsequently measured at its cost less accumulated amortization and any accumulated impairment. Orders on hand are amortized
on a straight-line basis over one to four years. Acquired products are amortized on a straight-line basis over four years. Customer lists
are amortized on a straight-line basis over four to fifteen years.
In-house developments are recognized as intangible assets, if the development costs can be measured reliably, and from which
an economic benefit from a sale of the services anticipated in the future is probable. Capitalized costs for in-house developments are
measured at cost less accumulated amortization and impairment. In-house developments are amortized for the first time from the
month of completion on a straight-line basis with a term of four years. Interest on borrowings is not included in the cost of production.
Purchased software, licenses and rights are measured at cost less any accumulated amortization and any accumulated
impairment losses. Brands and domains are amortized on a straight-line basis over a term of 15 years. Otherwise, software, licenses and
rights are subject to amortization on a straight-line basis over three to six years.
Goodwill arising from business combinations is recognized as an intangible asset with an indefinite useful life. Goodwill, and
other intangible assets with indefinite useful lives or intangible assets that are not yet available for use are subject to impairment tests
at least once a year. For the aforementioned assets impairment tests are also performed whenever there is an indication or specific
event (“triggering event”) that an asset may be impaired. If the recoverability is no longer given as the carrying amount exceeds the
recoverable amount of capitalized goodwill, an impairment loss must be recognized. This is also applicable for other intangible assets
with indefinite useful lives or intangible assets that are not yet available for use. Assets in use and other intangible assets with finite
useful lives are tested for impairment only if there are specific indications that they may be impaired.
c.
Property, plant and equipment
Property, plant and equipment are recognized at cost of acquisition or production, less accumulated depreciation and any
accumulated impairment losses. For internally generated assets, cost of production includes costs that can be directly allocated,
proportionate overhead costs and depreciation. Interest on borrowings directly attributable to the acquisition, construction or
production of a ‘qualifying asset’ (one that necessarily takes a substantial period of time to get ready for its intended use or sale) are
included in the cost of the asset. Repair and maintenance costs are recognized as an expense directly in the consolidated statement of
profit or loss. Straight-line depreciation is applied over the expected, estimated useful life of the assets. The carrying amounts of
property and equipment are subject to an impairment test as soon as an impairment is indicated. Land, land rights and buildings,
including constructions on third party property, are measured using the cost model. Straight-line depreciation on buildings is
recognized over a maximum useful life of 58 years. Other plant, operating and office equipment is subject to straight-line depreciation








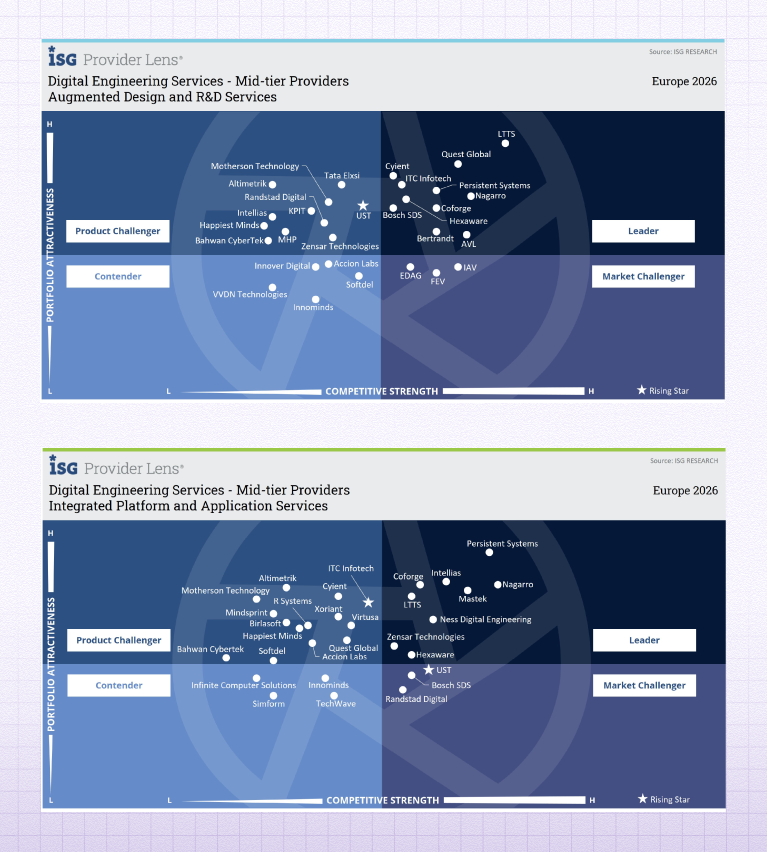 Srinivasan P N, Senior Lead Analyst, ISG, said, “Nagarro stands out in Digital Engineering through its strong leadership in Augmented Design & R&D Services and Integrated Platform and Application Services. Its engineering‑first DNA, combined with design‑led thinking and AI‑native execution, enables enterprises to build, modernize, and scale digital products and platforms with speed and resilience. Nagarro continues to challenge the market in Intelligent Operations and Connected Experience through AI‑driven automation and platform‑centric service models.”


 60 mins


 China
 India
 Japan
 Philippines
 Singapore
 South Africa
 Sri Lanka
 Thailand
 Colombia
 Ecuador
 Austria
 Denmark
 Finland
 France
 Germany
 Hungary
 Norway
 Poland
 Portugal
 Romania
 Spain
 Sweden
 Switzerland
 United Kingdom
 UAE
 Canada
 Mexico
 United States


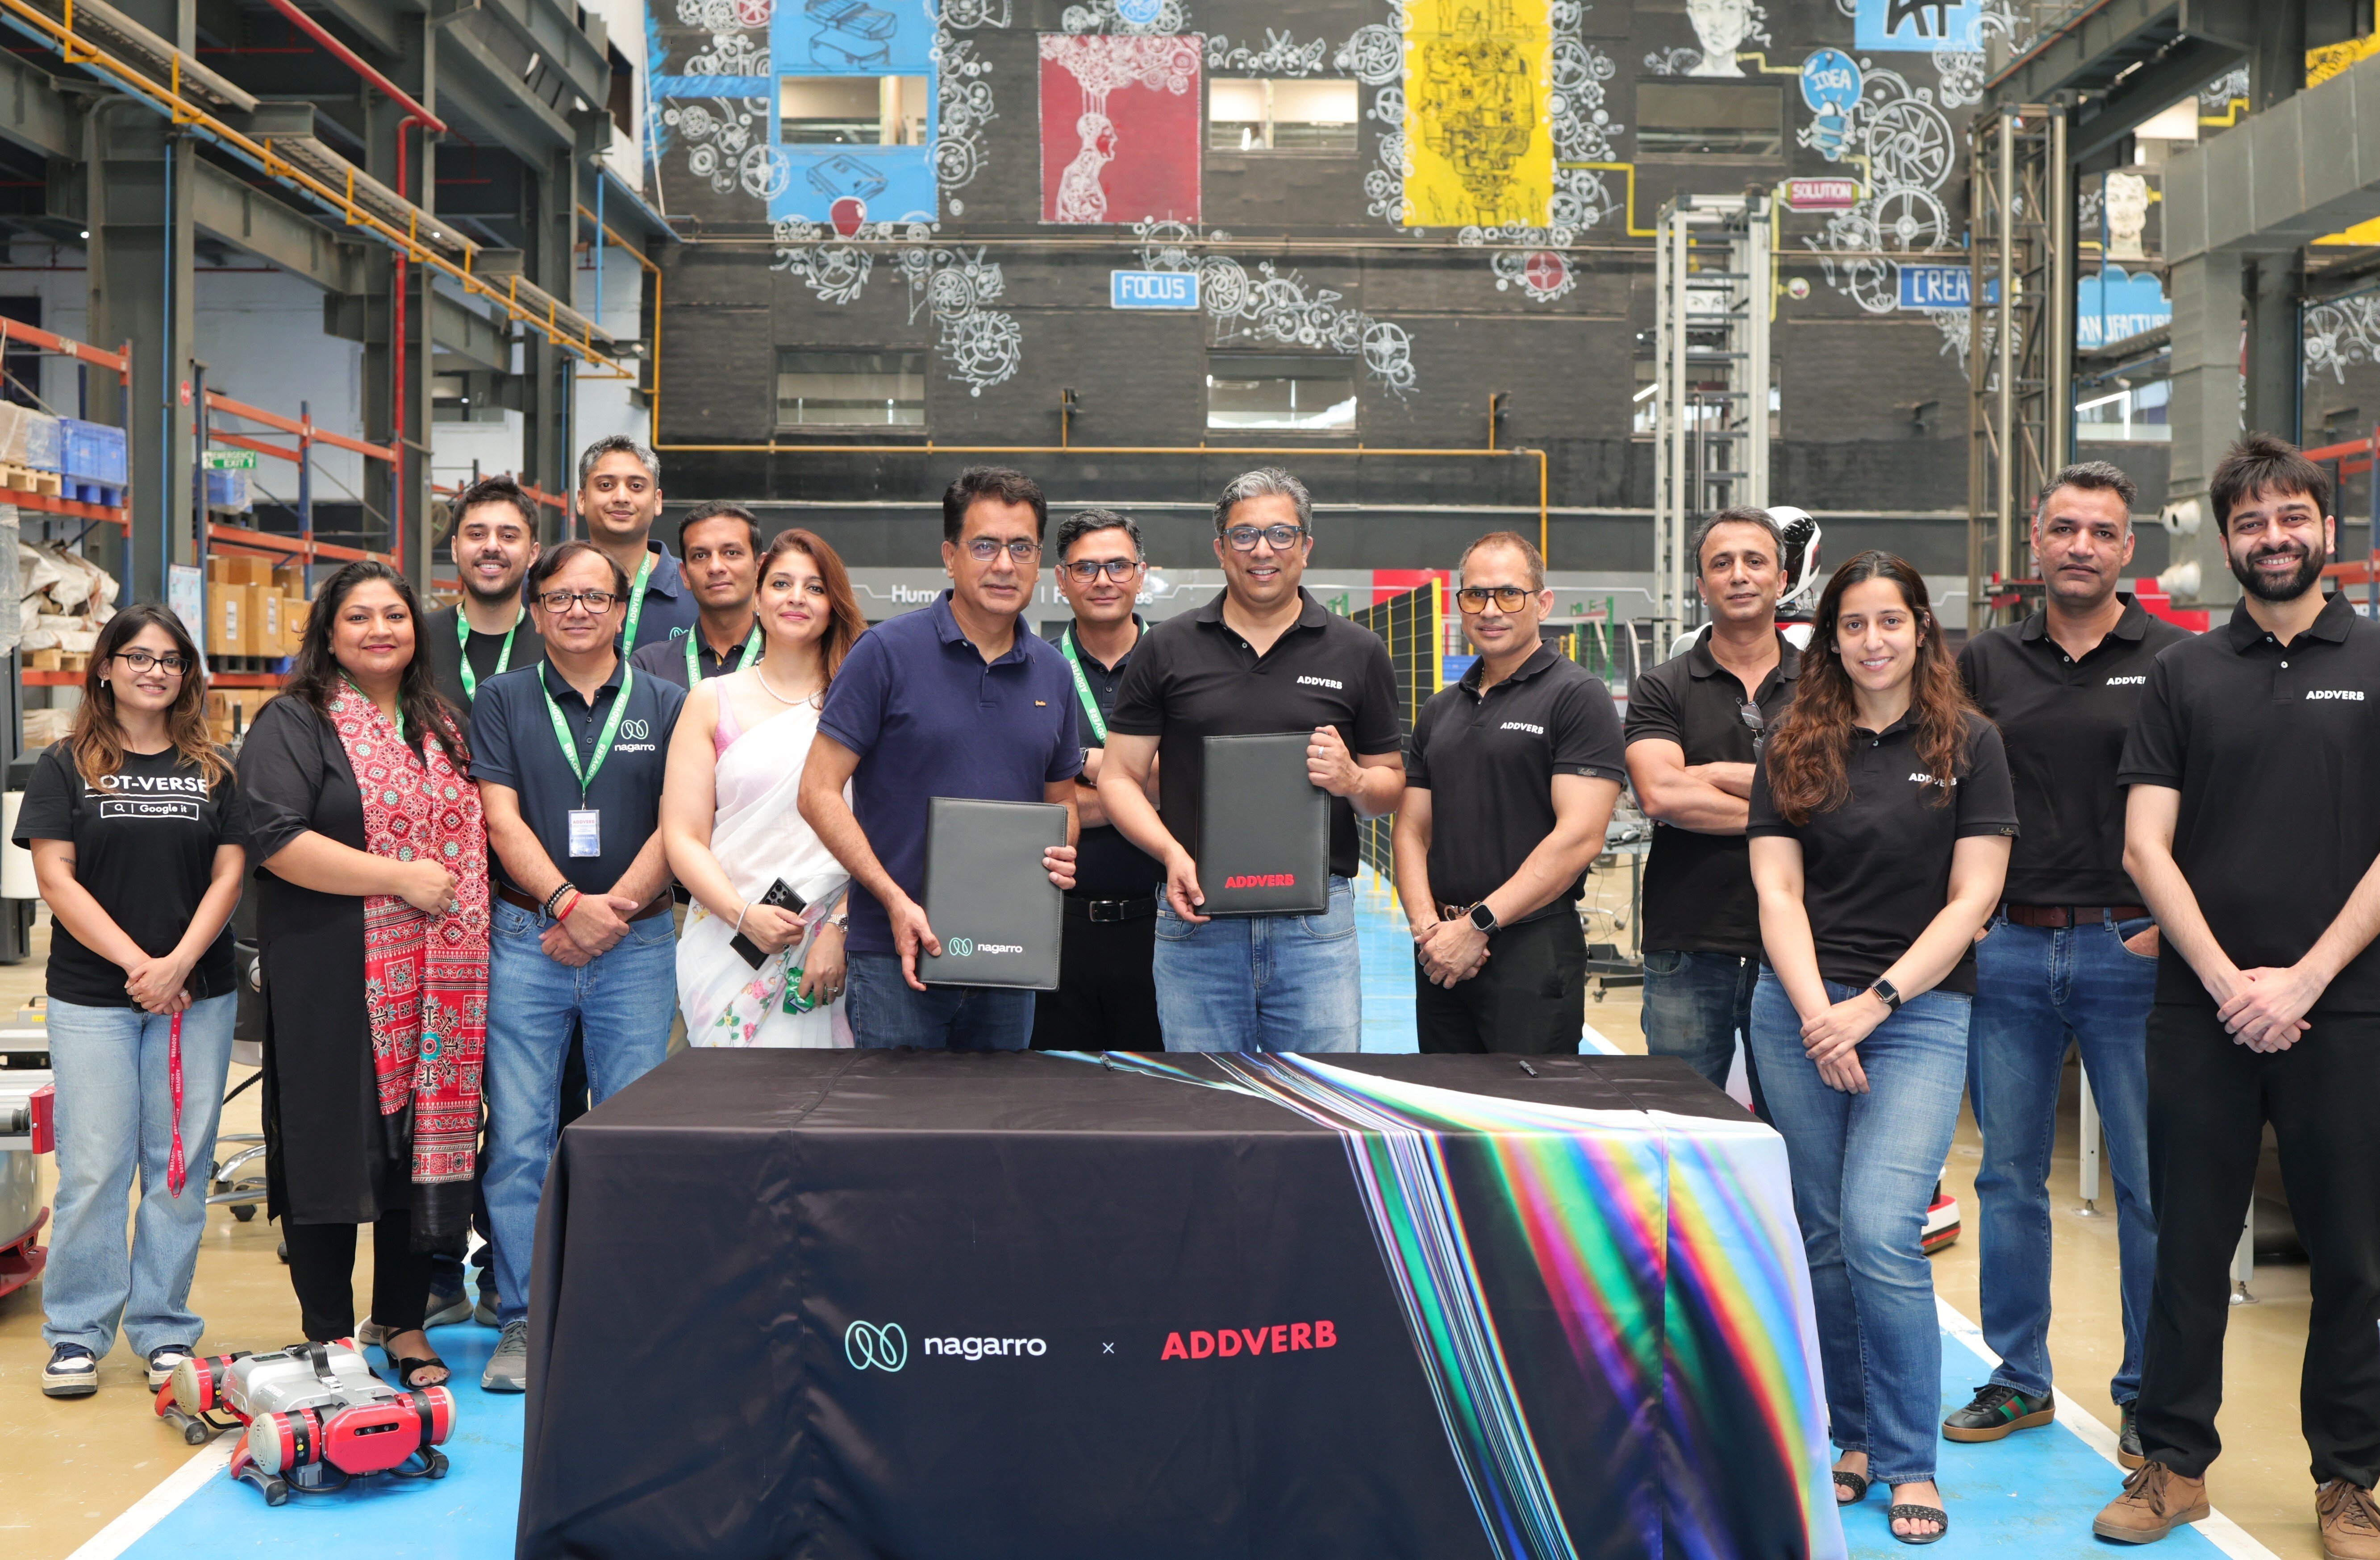 _Nagarro and Addverb colleagues at the MoU signing ceremony


