English 中文 日本語 Deutsch Main menu Account Log In Register myInfineon Benefits My dashboard Notifications Bookmarks Online Orders My cases myICP Profile center Logout Products Applications Design Resources Support & Training About English 中文…

 Main menu
Account
Log In
Register
myInfineon Benefits
My dashboard
Notifications
Bookmarks
Online Orders
My cases
myICP
Profile center
Logout
Close
All Products
-
ASIC
-
Battery management ICs
-
Clocks and timing solutions
-
ESD and surge protection devices
-
Automotive Ethernet
-
Evaluation Boards
-
High reliability
-
Isolation
-
Memories
-
Microcontroller
-
Power
-
RF
-
Security and smart card solutions
-
Sensor technology
-
Small signal transistors and diodes
-
Transceivers
-
Universal Serial Bus (USB)
-
Wireless connectivity
-
Search Tools
-
Technology
-
Packages
-
Product Information
-
Ordering
All Products
ASIC
ASIC
All Products
Clocks and timing solutions
Clocks and timing solutions
All Products
ESD and surge protection devices
ESD and surge protection devices
All Products
Automotive Ethernet
Automotive Ethernet
All Products
High reliability
High reliability
All Products
Isolation
Isolation
All Products
Memories
Memories
All Products
Microcontroller
Microcontroller
All Products
Power
Power
-
Overview
-
AC-DC power conversion
-
Automotive conventional powertrain ICs
-
Class D audio amplifier ICs
-
Contactless power and sensing ICs
-
DC-DC converters
-
Diodes and thyristors (Si/SiC)
-
eFuses
-
Gallium nitride (GaN)
-
Gate Driver ICs
-
IGBTs – Insulated gate bipolar transistors
-
Intelligent power modules (IPM)
-
JFETs
-
LED driver ICs
-
Motor drivers
-
MOSFETs
-
Power modules
-
Power supply ICs
-
Protection and monitoring ICs
-
Silicon carbide (SiC)
-
Smart power switches
-
Solid state relays and isolators
-
Wireless charging ICs
All Products
RF
RF
All Products
Security and smart card solutions
Security and smart card solutions
All Products
Sensor technology
Sensor technology
All Products
Small signal transistors and diodes
Small signal transistors and diodes
All Products
Transceivers
Transceivers
All Products
Universal Serial Bus (USB)
Universal Serial Bus (USB)
-
Overview
-
USB 2.0 peripheral controllers
-
USB 3.2 peripheral controllers
-
USB hub controllers
-
USB PD high-voltage microcontrollers
-
USB-C AC-DC and DC-DC charging solutions
-
USB-C charging port controllers
-
USB-C Power Delivery controllers
All Products
Wireless connectivity
Wireless connectivity
All Products
Automotive Ethernet
Automotive Ethernet PHY for in-vehicle networking
Automotive Ethernet PHY for in-vehicle networking
All Products
Automotive Ethernet
Automotive Ethernet Switches for in-vehicle networking
Automotive Ethernet Switches for in-vehicle networking
All Products
High reliability
Defense
Defense
All Products
High reliability
High-reliability custom services
High-reliability custom services
All Products
High reliability
NewSpace
NewSpace
All Products
High reliability
Space
Space
All Products
Memories
F-RAM (Ferroelectric RAM)
F-RAM (Ferroelectric RAM)
All Products
Memories
NOR flash
NOR flash
All Products
Memories
Radiation hardened and high-reliability memories
Radiation hardened and high-reliability memories
All Products
Memories
SRAMs (Static Random Access Memory)
SRAMs (Static Random Access Memory)
All Products
Microcontroller
AURIX™ TriCore™ MCUs
AURIX™ TriCore™ MCUs
-
Overview
-
AURIX™ TC2x - 32-bit TriCore™
-
AURIX™ TC3x - 32-bit TriCore™
-
AURIX™ TC4x - 32-bit TriCore™
All Products
Microcontroller
PSOC™ MCUs
PSOC™ MCUs
-
Overview
-
PSOC™ 4 Microcontroller: Arm® Cortex®-M0/M0+
-
PSOC™ 4 HV Arm® Cortex®-M0+
-
PSOC™ 5 LP Arm® Cortex®-M3
-
PSOC™ 6 Arm® Cortex®-M4/M0+
-
PSOC™ Multitouch Touchscreen Controller
-
PSOC™ Control C3 Arm® Cortex®-M33
-
PSOC™ Automotive 4: Arm® Cortex®-M0/M0+
-
PSOC™ Edge Arm® Cortex® M55/M33
-
PSOC™ Control C1 Arm® Cortex®-M0
All Products
Microcontroller
TRAVEO™ T2G MCUs
TRAVEO™ T2G MCUs
All Products
Microcontroller
XMC™ MCUs
XMC™ MCUs
All Products
Microcontroller
Legacy MCUs
Legacy MCUs
All Products
Microcontroller
MOTIX™ motor control SoCs/SIPs
MOTIX™ motor control SoCs/SIPs
All Products
Power
AC-DC power conversion
AC-DC power conversion
All Products
Power
Automotive conventional powertrain ICs
Automotive conventional powertrain ICs
All Products
Power
Class D audio amplifier ICs
Class D audio amplifier ICs
All Products
Power
Contactless power and sensing ICs
Contactless power and sensing ICs
All Products
Power
DC-DC converters
DC-DC converters
All Products
Power
Diodes and thyristors (Si/SiC)
Diodes and thyristors (Si/SiC)
All Products
Power
eFuses
eFuses
All Products
Power
Gallium nitride (GaN)
Gallium nitride (GaN)
All Products
Power
Gate Driver ICs
Gate Driver ICs
All Products
Power
IGBTs – Insulated gate bipolar transistors
IGBTs – Insulated gate bipolar transistors
All Products
Power
Intelligent power modules (IPM)
Intelligent power modules (IPM)
All Products
Power
JFETs
JFETs
All Products
Power
LED driver ICs
LED driver ICs
All Products
Power
Motor drivers
Motor drivers
All Products
Power
MOSFETs
MOSFETs
All Products
Power
Power modules
Power modules
All Products
Power
Power supply ICs
Power supply ICs
All Products
Power
Silicon carbide (SiC)
Silicon carbide (SiC)
All Products
Power
Smart power switches
Smart power switches
All Products
Power
Solid state relays and isolators
Solid state relays and isolators
All Products
RF
Rad hard microwave and RF
Rad hard microwave and RF
All Products
RF
Low noise amplifiers (LNAs)
Low noise amplifiers (LNAs)
All Products
RF
RF diode
RF diode
All Products
RF
RF transistors
RF transistors
All Products
Security and smart card solutions
Contactless memories
Contactless memories
All Products
Security and smart card solutions
OPTIGA™ embedded security solutions
OPTIGA™ embedded security solutions
All Products
Security and smart card solutions
SECORA™ security solutions
SECORA™ security solutions
All Products
Security and smart card solutions
Security controllers
Security controllers
All Products
Security and smart card solutions
Smart card modules
Smart card modules
All Products
Security and smart card solutions
Smart solutions for government ID
Smart solutions for government ID
All Products
Sensor technology
ToF 3D image sensors
ToF 3D image sensors
All Products
Sensor technology
Gas sensors
Gas sensors
All Products
Sensor technology
Pressure sensors
Pressure sensors
All Products
Sensor technology
Radar sensors
Radar sensors
All Products
Sensor technology
Magnetic position sensors
Magnetic position sensors
All Products
Sensor technology
Magnetic speed sensors
Magnetic speed sensors
All Products
Small signal transistors and diodes
Bipolar transistors
Bipolar transistors
All Products
Small signal transistors and diodes
Diodes
Diodes
All Products
Transceivers
Automotive transceivers
Automotive transceivers
All Products
Universal Serial Bus (USB)
USB 2.0 peripheral controllers
USB 2.0 peripheral controllers
All Products
Universal Serial Bus (USB)
USB 3.2 peripheral controllers
USB 3.2 peripheral controllers
All Products
Universal Serial Bus (USB)
USB hub controllers
USB hub controllers
All Products
Universal Serial Bus (USB)
USB PD high-voltage microcontrollers
USB PD high-voltage microcontrollers
All Products
Universal Serial Bus (USB)
USB-C AC-DC and DC-DC charging solutions
USB-C AC-DC and DC-DC charging solutions
All Products
Universal Serial Bus (USB)
USB-C Power Delivery controllers
USB-C Power Delivery controllers
All Products
Wireless connectivity
AIROC™ Bluetooth® and multiprotocol
AIROC™ Bluetooth® and multiprotocol
All Products
Wireless connectivity
AIROC™ Wi-Fi + Bluetooth® combos
AIROC™ Wi-Fi + Bluetooth® combos
All Products
Wireless connectivity
AIROC™ Ultra-Wide Band Solutions
AIROC™ Ultra-Wide Band Solutions
All Products
Search Tools
Search Tools
All Products
Technology
Technology
All Products
Product Information
Product Information
All Products
Ordering
Ordering
Browse by core architecture
Browse by key technologies
Browse by design resources & partners
Browse by product information
All Applications
- Aerospace and defense
- AI and data center
- Automotive
- Communications
- Consumer electronics
- Industrial
- Security solutions
- Smart home and building
- Solutions
All Applications
Aerospace and defense
Aerospace and defense
-
Overview
-
Defense applications
-
Space applications
All Applications
AI and data center
AI and data center
All Applications
Automotive
Automotive
-
Overview
-
ADAS & autonomous driving
-
Automotive body electronics
-
Automotive LED lighting systems
-
Automotive zonal architecture
-
Chassis control & safety
-
Electric vehicle drivetrain system
-
EV thermal management system
-
In-vehicle infotainment & HMI
-
Light electric vehicle solutions
All Applications
Communications
Communications
All Applications
Consumer electronics
Consumer electronics
All Applications
Industrial
Industrial
All Applications
Security solutions
Security solutions
All Applications
Smart home and building
Smart home and building
All Applications
Solutions
Solutions
All Applications
Aerospace and defense
Defense applications
Aerospace and defense
Defense applications
All Applications
Aerospace and defense
Space applications
Aerospace and defense
Space applications
All Applications
AI and data center
Data center power solutions
AI and data center
Data center power solutions
All Applications
Automotive
ADAS & autonomous driving
Automotive
ADAS & autonomous driving
All Applications
Automotive
Automotive body electronics
Automotive
Automotive body electronics
All Applications
Automotive
Automotive LED lighting systems
Automotive
Automotive LED lighting systems
All Applications
Automotive
Automotive zonal architecture
Automotive
Automotive zonal architecture
All Applications
Automotive
Chassis control & safety
Automotive
Chassis control & safety
All Applications
Automotive
Electric vehicle drivetrain system
Automotive
Electric vehicle drivetrain system
All Applications
Automotive
EV thermal management system
Automotive
EV thermal management system
All Applications
Automotive
In-vehicle infotainment & HMI
Automotive
In-vehicle infotainment & HMI
All Applications
Automotive
Light electric vehicle solutions
Automotive
Light electric vehicle solutions
All Applications
Communications
Satellite communications
Communications
Satellite communications
All Applications
Communications
Telecommunications infrastructure
Communications
Telecommunications infrastructure
All Applications
Consumer electronics
Consumer wearables
Consumer electronics
Consumer wearables
All Applications
Consumer electronics
Home appliances
Consumer electronics
Home appliances
All Applications
Consumer electronics
Mobile device and smartphone solutions
Consumer electronics
Mobile device and smartphone solutions
All Applications
Consumer electronics
Power adapters and chargers
Consumer electronics
Power adapters and chargers
All Applications
Consumer electronics
Semiconductor solutions for home entertainment applications
Consumer electronics
Semiconductor solutions for home entertainment applications
All Applications
Industrial
Battery energy storage (BESS)
Industrial
Battery energy storage (BESS)
All Applications
Industrial
Digital health
Industrial
Digital health
All Applications
Industrial
EV charging
Industrial
EV charging
All Applications
Industrial
High voltage solid-state power distribution
Industrial
High voltage solid-state power distribution
All Applications
Industrial
Industrial automation
Industrial
Industrial automation
All Applications
Industrial
Industrial motor drives and controls
Industrial
Industrial motor drives and controls
All Applications
Industrial
LED lighting system design
Industrial
LED lighting system design
All Applications
Industrial
Photovoltaic
Industrial
Photovoltaic
All Applications
Industrial
Power tools
Industrial
Power tools
All Applications
Industrial
Power transmission and distribution
Industrial
Power transmission and distribution
All Applications
Industrial
Robotics
Industrial
Robotics
All Applications
Security solutions
Access control and ticketing
Security solutions
Access control and ticketing
All Applications
Security solutions
Government identification
Security solutions
Government identification
All Applications
Security solutions
Payment solutions
Security solutions
Payment solutions
All Applications
Smart home and building
Heating ventilation and air conditioning (HVAC)
Smart home and building
Heating ventilation and air conditioning (HVAC)
All Applications
Smart home and building
Home and building automation
Smart home and building
Home and building automation
All Applications
Solutions
Battery management systems (BMS)
Solutions
Battery management systems (BMS)
All Applications
Solutions
Human Machine Interface
Solutions
Human Machine Interface
All Applications
Solutions
Machine Learning Edge AI
Solutions
Machine Learning Edge AI
All Applications
Solutions
Motor control
Solutions
Motor control
All Applications
Solutions
Power conversion
Solutions
Power conversion
-
Overview
-
AC-DC power conversion
-
DC-DC power conversion
All Applications
Solutions
Sensor solutions
Solutions
Sensor solutions
All Applications
Solutions
System diagnostics and analytics
Solutions
System diagnostics and analytics
All Design Resources
All Design Resources
Boards & Kits
Boards & Kits
All Design Resources
Finder & selection tools
Finder & selection tools
All Design Resources
Platforms
Platforms
-
Overview
-
AIROC™ software & tools
-
AURIX™ software & tools
-
DRIVECORE™ for automotive software development
-
iMOTION™ software & tools
-
Infineon Smart Power Switches & Gate Driver Tool Suite
-
MOTIX™ software & tools
-
OPTIGA™ software & tools
-
PSOC™ software & tools
-
TRAVEO™ software & tools
-
XENSIV™ software & tools
-
XMC™ software & tools
All Design Resources
Services
Services
All Design Resources
Simulation & Modeling
Simulation & Modeling
All Design Resources
Software
Software
All Design Resources
Tools
Tools
All Design Resources
Platforms
AIROC™ software & tools
Platforms
AIROC™ software & tools
All Design Resources
Platforms
AURIX™ software & tools
Platforms
AURIX™ software & tools
All Design Resources
Platforms
DRIVECORE™ for automotive software development
Platforms
DRIVECORE™ for automotive software development
All Design Resources
Platforms
iMOTION™ software & tools
Platforms
iMOTION™ software & tools
All Design Resources
Platforms
MOTIX™ software & tools
Platforms
MOTIX™ software & tools
All Design Resources
Platforms
OPTIGA™ software & tools
Platforms
OPTIGA™ software & tools
All Design Resources
Platforms
PSOC™ software & tools
Platforms
PSOC™ software & tools
All Design Resources
Platforms
TRAVEO™ software & tools
Platforms
TRAVEO™ software & tools
All Design Resources
Platforms
XENSIV™ software & tools
Platforms
XENSIV™ software & tools
All Design Resources
Platforms
XMC™ software & tools
Platforms
XMC™ software & tools
All Design Resources
Simulation & Modeling
IPOSIM Online Power Simulation Platform
Simulation & Modeling
IPOSIM Online Power Simulation Platform
All Design Resources
Software
Code Examples
Software
Code Examples
All Design Resources
Software
DEEPCRAFT™ AI Suite
Software
DEEPCRAFT™ AI Suite
All Design Resources
Software
Device Driver & Libraries
Software
Device Driver & Libraries
All Design Resources
Software
Free and open-source Software (FOSS)
Software
Free and open-source Software (FOSS)
All Design Resources
Software
Software Archive
Software
Software Archive
All Design Resources
Tools
Configuration
Tools
Configuration
All Design Resources
Tools
Programming & Testing
Tools
Programming & Testing
All Design Resources
Tools
SDK
Tools
SDK
All Design Resources
Tools
Tools Archive
Tools
Tools Archive
All Design Resources
Tools
Utilities
Tools
Utilities
All Design Resources
Partners
Partners
All Support
- Support
- Training
- Developer Community
All Support
Support
Support
All Support
Training
Training
All Support
Developer Community
Developer Community
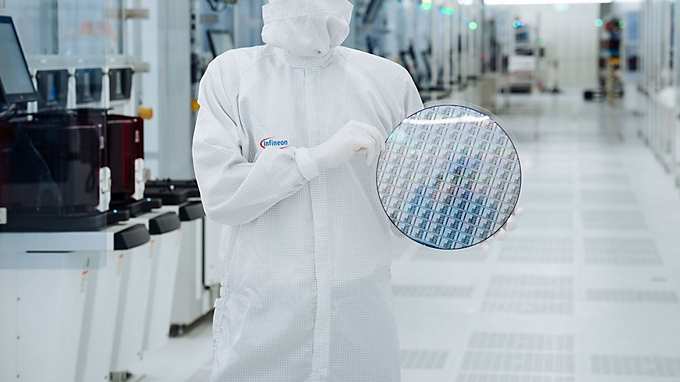
Infineon to establish the world’s first high-volume manufacturing facility for gallium nitride power semiconductors on 300-millimeter wafers in Europe
Business & Financial Press
Oct 27, 2026
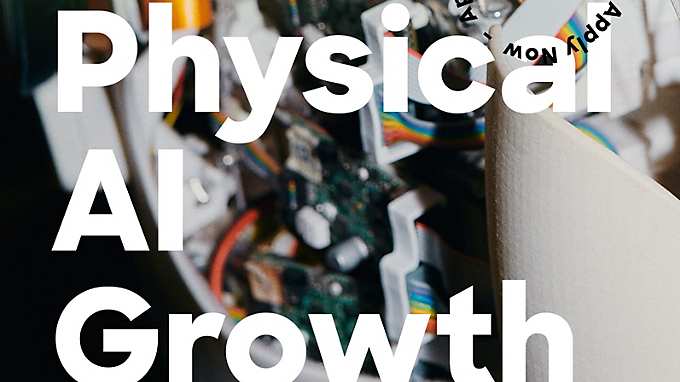
UnternehmerTUM Accelerator, Microsoft, Infineon Technologies, and NVIDIA Launch Physical AI Growth Lab for Europe's Most Promising Startups
Business & Financial Press
Oct 22, 2026
Infineon collaborates with NVIDIA on gallium nitride-based power conversion systems for 800 VDC AI data centers
Business & Financial Press
Oct 21, 2026
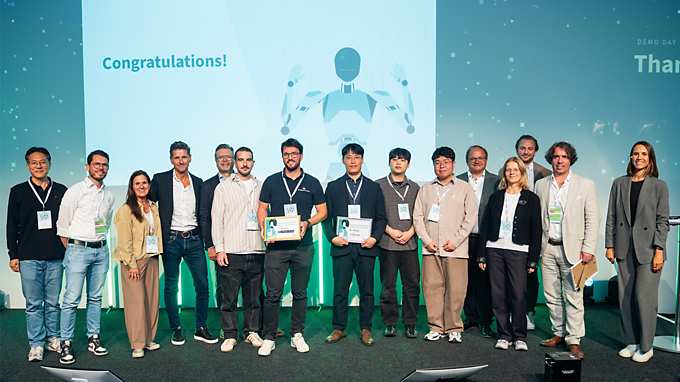
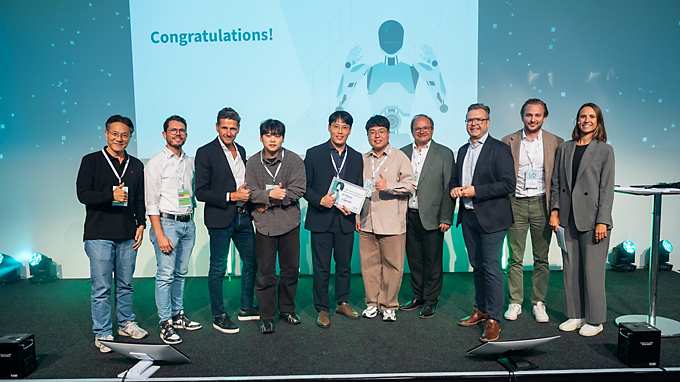
Infineon announces winners of the startup challenge on humanoid robotics
Business & Financial Press
Oct 19, 2026
View all news
All About
- Company
- Our stories
- Events
- Press
- Investor
- Careers
- Quality
All About
Company
Company
All About
Our stories
Our stories
All About
Events
Events
All About
Press
Press
All About
Investor
Investor
All About
Careers
Careers
All About
Quality
Quality
All About
Quality
Certificates & Standards
Certificates & Standards
All About
Quality
Product information finder
Product information finder
All About
Quality
Quality management
Quality management
All About
Quality
Quality and sustainability culture
Quality and sustainability culture
All About
Quality
Security
Security
Infineon to establish the world’s first high-volume manufacturing facility for gallium nitride power semiconductors on 300-millimeter wafers in Europe
Business & Financial Press
Oct 27, 2026
UnternehmerTUM Accelerator, Microsoft, Infineon Technologies, and NVIDIA Launch Physical AI Growth Lab for Europe's Most Promising Startups
Business & Financial Press
Oct 22, 2026
Infineon collaborates with NVIDIA on gallium nitride-based power conversion systems for 800 VDC AI data centers
Business & Financial Press
Oct 21, 2026
Infineon announces winners of the startup challenge on humanoid robotics
Business & Financial Press
Oct 19, 2026
View all news
Login Register
Close
{ "default" : { "title" : "Login or register", "description" : "Please log in with an existing account or create a new one." }, "bookmark" : { "title" : "Save your favorite pages in one place!", "description" : "Log in or create a myInfineon account to bookmark this page and access it anytime from your dashboard. " }, "gated_document" : { "title" : "Unlock unlimited access to valuable documents!", "description" : "Log in or sign up to download this document and enjoy unlimited access to valuable resources." }, "gated_video" : { "title" : "Access exclusive videos!", "description" : "Log in or create a myInfineon account to watch this video and explore more video content and downloads. Don’t miss out—register now!" }, "event_registration" : { "title" : "Register for the event today!", "description" : "To register for this event, you’ll need a myInfineon account. Log in or sign up to secure your spot and access event materials and updates. " }, "board_registration" : { "title" : "Easily register your board!", "description" : "To register this board, you'll need a myInfineon account. Log in or create a myInfineon account and access tailored content related to your product. " }, "block_diagram" : { "title" : "Save your block diagram!", "description" : "Log in or sign up for a myInfineon account to save this block diagram. Your saved diagrams will be stored in your personalized dashboard for easy access and sharing. " }, "contact_sales" : { "title" : "Get personalized sales support!", "description" : "Log in or create a myInfineon account to connect with your dedicated sales expert." }, "subscribe_to_newsletter" : { "title" : "Stay updated!", "description" : "Log in or or create a myInfineon account to receive the latest product updates and insights." }, "add_to_cart" : { "title" : "Access your shopping cart!", "description" : "Log in or create a myInfineon account to manage your cart and simplify your checkout process." }, "request_sample" : { "title" : "Request free-of-charge samples!", "description" : "Corporate or university account required to request free-of-charge samples. Log in or create an account with corporate email address to request samples." } }
Home
Press release
2026
Infineon at electronica 2026: Technology for the AI era, from data centers into robots and onto the road
2026
Share in WeChat
Scan the QR code with your WeChat App to share this page.
Infineon at electronica 2026: Technology for the AI era, from data centers into robots and onto the road
Business & Financial Press
Oct 14, 2026
Munich, Germany – 14 October 2026 – With artificial intelligence evolving from virtual chatbots into real-world machines and devices, it will shape our lives more than ever. At the electronica trade fair 2026 in Munich, Germany (10 – 13 November), Infineon Technologies AG (FSE: IFX / OTCQX: IFNNY) will showcase customer cases, system solutions, and semiconductor innovations for Physical AI across robotics and mobility, intelligent edge devices as well as the infrastructure necessary to power the age of AI. Technology from Infineon helps machines perceive their environment, communicate in a secured way, process data locally through edge AI, and act on it safely and reliably while using energy as efficiently as possible. Visitors will find Infineon at booth 502 in hall C3.
“Many future machines will sense, think, and act autonomously in real-time, creating unprecedented opportunities in areas ranging from everyday convenience to healthcare, mobility, energy efficiency and economic productivity,” said Andreas Urschitz, Chief Marketing Officer at Infineon. “As AI advances from the cloud to the edge and into the physical world, semiconductor innovation is becoming the critical foundation to deploy intelligence efficiently and turn it into action people can rely on. At electronica, we showcase how, together with our customers and partners, we are building the technology foundation for the AI era.”
Infineon will present its contributions along three focus topics:
Physical AI in robotics and edge solutions
Robotics is Physical AI's most complex form, with use cases across the shop floor, the service sector and the home. Semiconductors from Infineon enable every functional block in a robot, from sensing, computing, connectivity to motor control and power. Together, they translate perception into precise movement, while functional safety and cybersecurity embedded at hardware-level provide an anchor of trust for even the most advanced robots.
At electronica, visitors at the Infineon booth will witness Physical AI in action with a live robotics showcase performing a real-world shop floor use case. Furthermore, Infineon will demonstrate several robotics solutions on a system level, including an out-of-the-box solution that enables the precision and efficiency required to replicate the most dexterous part of a human body: a hand. Beyond that, the Infineon booth will provide insights into how edge intelligence enables a new generation of devices from industrial automation to smart home security, and everyday home appliances. The exhibit will also highlight how Infineon helps strengthen the security of intelligent and connected machines against evolving cyber threats in the quantum computing era.
Future mobility with software-defined electric vehicles
In modern vehicles, AI increasingly takes the wheel. It interprets sensor data in driver assistance and automated driving functions, helps to extend driving range and battery longevity, and is expected to become part of the control loop, enabling cars to adapt motion control dynamically to road and energy conditions, for example. In addition, the software-defined era allows connected vehicles to evolve over time, with new software from the cloud improving existing and adding new functions after the vehicle left the factory.
At electronica, Infineon will showcase how its semiconductor and system innovations support this transition and help turn software and AI into reliable vehicle behavior. Visitors can explore core technologies for centralized vehicle architectures at the heart of this development and will see an example implementation in a premium car. They will see system-level innovation empowered by Infineon, for example for AI-enhanced battery management, integrated x-in-1 powertrain solutions and next-generation Ethernet connectivity that provides safe and secured high-speed communication between vehicle systems. Visitors will also get a first glimpse at Infineon’s next automotive microcontroller platform that will leverage the advantage of the open standard RISC-V to bring new levels of intelligence, scalability, safety and security to software-defined vehicles and other Physical AI systems.
Powering the future from renewable power generation to AI data centers
Artificial intelligence is driving a massive expansion of digital infrastructure, creating unprecedented demand for computing power and electricity. Meeting this demand sustainably depends on intelligent power systems that generate, convert, distribute and manage energy efficiently, from renewable energy sources and the electrical grid all the way to the processor core inside an AI server.
At electronica, Infineon will demonstrate how its semiconductor innovations help build this foundation. Visitors will discover technologies that improve energy efficiency throughout the entire power chain, enabling AI data centers to deliver more computing performance while reducing energy losses. They will see solutions that optimize energy delivery from the grid to advanced AI processors, explore next-generation solid-state power distribution technologies, and learn how renewable energy and grid-forming battery storage systems can help keep future electricity networks stable and resilient. By combining power, control, sensing, connectivity and security technologies, Infineon helps connect the worlds of energy and intelligence to power the future.
Where to find Infineon at electronica
The electronica trade fair is taking place from 10 to 13 November in Munich, Germany. Infineon will present its solutions at booth 502 in hall C3. Further information is available at www.infineon.com/electronica
.
About Infineon
Infineon Technologies AG is a global semiconductor leader in power systems and IoT. Infineon drives decarbonization and digitalization with its products and solutions. The Company had around 57,000 employees worldwide (end of September 2025) and generated revenue of about €14.7 billion in the 2025 fiscal year (ending 30 September). Infineon is listed on the Frankfurt Stock Exchange (ticker symbol: IFX) and in the USA on the OTCQX International over-the-counter market (ticker symbol: IFNNY).
Press Photos
Download All (1)

Andreas Urschitz
Andreas Urschitz, Member of the Management Board and Chief Marketing Officer of Infineon.
JPEG
1000x1500 px
Download
×

1
Share in WeChat
Scan the QR code with your WeChat App to share this page.
Information Number : infpr202610-007

Oliver Scharfenberg
Spokesperson Automotive
T +49 89 234 38063
Send email

© 1999-2026 Infineon Technologies AG
Use of cookies
We use cookies and similar technologies (also from third parties) to collect your device and browser information for a better understanding on how you use our online offerings.
This enables us to optimize and personalize your experience with Infineon and to provide you with additional services and information based on your individual profile.
Details are available in our privacy policy where you can also change your preferences on cookies at any time.
Privacy policy
and Imprint
Cookie settings
Reject Accept