LSEG STREETEVENTS EDITED TRANSCRIPT Q2 2026 FRESENIUS MEDICAL CARE AG EARNINGS CALL EVENT DATE/TIME: August 04, 2026 / 8:00AM UTC An LSEG Business August 04, 2026 / 8:00AM UTC, Q2 2026 Fresenius Medical Care AG Earnings Call CORPORATE PARTICIPANTS…
LSEG STREETEVENTS
EDITED TRANSCRIPT
Q2 2026 FRESENIUS MEDICAL CARE AG EARNINGS CALL
EVENT DATE/TIME: August 04, 2026 / 8:00AM UTC
An LSEG Business
August 04, 2026 / 8:00AM UTC, Q2 2026 Fresenius Medical Care AG Earnings Call
CORPORATE PARTICIPANTS
•
Dominik Heger Fresenius Medical Care AG - Head of Investor Relations, Market & Competition,
Sustainability, EVP
•
Helen Giza Fresenius Medical Care AG - Chairwoman of the Management Board, Chief Executive Officer
•
Martin Fischer Fresenius Medical Care AG - Chief Financial Officer, Member of the Management Board
CONFERENCE CALL PARTICIPANTS
•
Operator
•
Veronika Dubajova Citi Infrastructure Investments LLC - Analyst
•
Oliver Metzger Oddo BHF SCA - Analyst
•
Aisyah Noor Morgan Stanley - Analyst
•
Hugo Solvet Exane Bnp Paribas - Analyst
•
Richard Felton Goldman Sachs Group Inc - Analyst
•
Anna Ractliffe Bofa Merrill Lynch Asset Holdings Inc - Analyst
•
Graham Doyle UBS AG - Analyst
•
James Vane-Tempest Jefferies LLC - Equity Analyst
•
Falko Friedrichs Deutsche Bank AG - Analyst
PRESENTATION
Operator
Ladies and gentlemen, welcome to the report on second quarter 2026 earnings release and conference call. I am Valentina
Dekaros, call operator. (Operator Instructions) The conference is being recorded. (Operator Instructions) The conference must not
be recorded for publication or broadcast.
At this time, it's my pleasure to hand over to Dr. Dominik Heger. Please go ahead.
─────────────────────────────────────────────────────────────────────────────────────
Dominik Heger Fresenius Medical Care AG - Head of Investor Relations, Market & Competition,
Sustainability, EVP
Thank you, Valentina. I would like to welcome everyone to our earnings call for the second quarter of 2026. I appreciate your
flexibility to join this earlier call. We felt it is more helpful to have the call earlier given that we had to publish earlier than originally
planned. I do apologize for the inconvenience, in particular for those of you who are located in a different time zone or those of you
who cover another company hosting a call in parallel right now.
LSEG STREETEVENTS | www.lseg.com | Contact Us
©2026 LSEG. All rights reserved. Republication or redistribution of LSEG content, including by framing or similar means, is
prohibited without the prior written consent of LSEG. 'LSEG' and the LSEG logo are registered trademarks of LSEG and its
affiliated companies.
2
August 04, 2026 / 8:00AM UTC, Q2 2026 Fresenius Medical Care AG Earnings Call
As always, I start out the call by mentioning our cautionary language that is in our safe harbor statement as well as in our
presentation and in all the materials that we have distributed earlier today. For further details concerning risks and uncertainties,
please refer to these documents and to our SEC filings. (Event Instructions)
Let me now welcome Helen Giza, CEO and Chair of the Management Board; and Martin Fischer, our Chief Financial Officer. Helen,
the floor is yours.
─────────────────────────────────────────────────────────────────────────────────────
Helen Giza Fresenius Medical Care AG - Chairwoman of the Management Board, Chief Executive
Officer
Thank you, Dominik, and welcome, everyone, and thank you for joining at this earlier time of the day. I will begin my prepared
remarks on slide 4.
We continued our strong start to the year, delivering another quarter of highly profitable growth, supported by solid organic revenue
development and further improvement in profitability. Operating income growth accelerated to 23%, in line with our planned phasing
for the year and we realized another quarter of margin expansion. This was also supported by the continued execution of our
FME25+ transformation program, which delivered EUR67 million of sustainable savings during the quarter.
We also completed our initial EUR1 billion share buyback program on an accelerated timeline and have already launched a second
EUR1 billion program, underscoring our continued focus on disciplined capital allocation and reigniting shareholder returns. With a
net leverage ratio of 2.6 times, we remain around the lower end of our target corridor and continue to maintain a strong financial
position.
With that overview, let me turn to the key second quarter highlights across our operating segments on slide 5. Beginning with Care
Delivery, the international markets delivered 0.8% same-market treatment growth. In the US, same-market treatment growth
declined by 0.9%. At the same time, I am genuinely encouraged by the progress we are seeing where it matters most: for our
patients.
Our continued focus on quality and patient care is making a real difference. Missed treatments and mortality improved in the quarter.
These are outcomes that are deeply meaningful for the patients who rely on us every day and for all of us who are committed to their
care. The same market treatment growth declined due to our own clear operational miss in our business development approach to
capture our fair market share of referrals. This exposed an execution gap and led to a further softening of referrals in Q2 compared
with Q1.
We have promptly addressed this with an organizational change enabling rapid implementation of the necessary prepared
measures. While these measures will take a few months to gain traction, we remain confident in our path to restoring referral rates in
the affected areas. Given the compounding effect of lower first half referrals on the rest of the year, we now expect US same market
treatment growth in 2026 to be around the Q2 level.
I also want to recognize the strong execution driving accelerating momentum across several strategic priorities under our Reignite
strategy. We are making significant progress accelerating the rollout of our 5008X in our clinics in the US. We have a dedicated slide
on high-volume HDF coming up where I will provide a broader update.
As we continue to strengthen our core operations, we remain disciplined in optimizing our clinic network. We have successfully
completed the clinic footprint optimization, exiting around 100 select underperforming clinics. We are realizing favorable rates and
seeing contributions from our revenue cycle management initiatives, providing further evidence that our operational improvement
efforts are gaining traction.
As already indicated, we are beginning to see the impact of our catheter-related bloodstream infection prevention efforts. We saw a
23% reduction in bloodstream infections over the past year, which supports lower infection-related hospitalizations and also
translates into lower patient mortality risk.
Next on Value-Based Care. We continue to build on the strong momentum we have established in this business. The quarter
reflected continued positive operating income as well as an increase in member months driven by contracting growth. We are
demonstrating how our vertically integrated model translates into better patient outcomes. We are seeing meaningful improvements
across key clinical measures such as reduced missed treatments, lowered mortality, and hospitalization rates when FME patients
are managed by Interwell Health.
LSEG STREETEVENTS | www.lseg.com | Contact Us
©2026 LSEG. All rights reserved. Republication or redistribution of LSEG content, including by framing or similar means, is
prohibited without the prior written consent of LSEG. 'LSEG' and the LSEG logo are registered trademarks of LSEG and its
affiliated companies.
3
August 04, 2026 / 8:00AM UTC, Q2 2026 Fresenius Medical Care AG Earnings Call
On October 12, we will host an expert call with Tommy O'Connor, the CEO of Value-Based Care, where we will give more insights
into this segment. Information about the call is available on our Investor Relations website.
Turning to Care Enablement, the 5008X rollout gained also momentum for Care Enablement with growing sales supporting
favorable business growth.
Overall, we continue to realize positive pricing and volume development outside of China, driving momentum in our underlying
business. Despite recent headwinds from regulatory changes, China remains an attractive products market for FME. With refreshed
leadership, we are reviewing our strategy to win as well as our product portfolio for this market.
We are navigating elevated raw material and logistics costs driven by the conflict in the Middle East. While these external cost
pressures remain a headwind and are something we are monitoring closely, they are currently absorbed in our guidance range. This
further reinforces the importance of our continued execution of our FME25+ program to drive sustainable savings.
Before I turn to the 5008X update, there are two other innovations that I want to highlight. Recently, we announced the introduction
of TherapyWise, a cloud-based analytics capability designed to provide retrospective program-level insight into kidney replacement
therapy delivered in acute and hospital critical care settings.
TherapyWise reflects our continued focus on innovation in critical care by applying data analytics. This helps hospital and clinical
leaders gain visibility into how kidney replacement therapy is delivered across their organizations, supporting informed discussions
around workflow, consistency, and quality improvement.
We also launched kinexus, marking a significant milestone in our home dialysis strategy and our broader digital transformation
journey. By bringing peritoneal dialysis and home hemodialysis capabilities together on a single platform, we are creating a more
connected experience for patients, caregivers, and clinical teams. We have already achieved our patient go-live with encouraging
initial feedback, and we look forward to expanding adoption as we continue to scale the platform globally.
Most importantly, kinexus establishes a global digital foundation that will enable future innovation and help us advance our
commitment to delivering high-quality, person-centered home care.
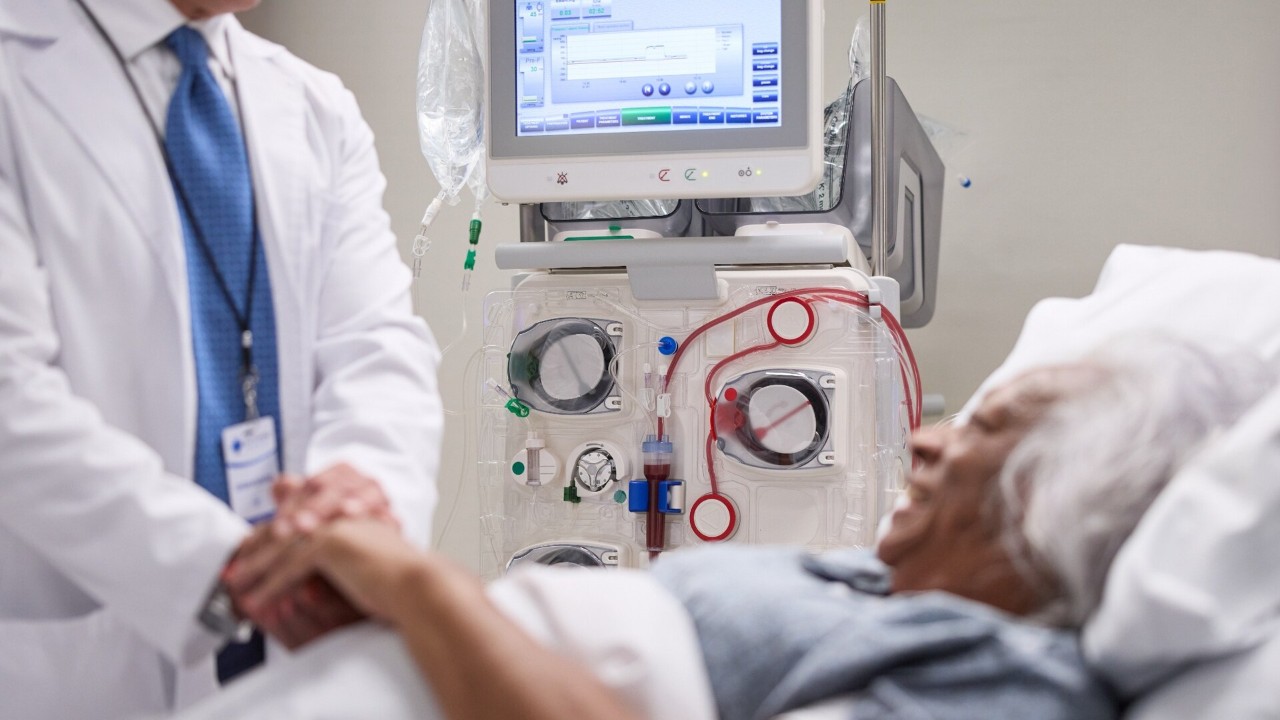
Next on slide 6. I'm excited to update you on the progress we are making with our 5008X rollout, which is accelerating as planned.
We are firmly on track to meet our 2026 targets, including converting around 20% of our machines in our own clinics. By late July,
we had converted 227 clinics across 23 states, representing 10% of our machine base. Of the more than 600,000 treatments on the
5008X, around 170,000 have been HDF and more than 100,000 high-volume HDF.
So far, we have produced 4 million consumables for the 5008X, which is in line with our plan and is rapidly ramping up. Our
extensive training efforts have covered around 5,000 renal nurses and patient care technicians. It has been a tremendous
undertaking to achieve all of this, and I am proud of how much we have accomplished so far.
Last Wednesday, we announced BEACON-US, which is a major research initiative designed to generate real-world evidence for
high-volume HDF in routine US clinical practice. This reflects our commitment to bringing innovation to patients thoughtfully,
responsibly, and with rigorous scientific evaluation at scale. We are encouraged by the positive early experiences we are seeing
from both patients and clinicians.
To give you some examples, patients report feeling better both during and after dialysis. And for example, data shows 40% fewer
muscle cramps. More than 70% of treatments using AutoSub plus technology in our research cohort are already reaching the highvolume HDF target of at least 23 liters of convective volume per session.
Clinical experience suggests simplified clinician workflows, optimized resource utilization, including reduced water consumption, and
a much quieter overall dialysis clinic experience. Early observations are tracking consistently with previously published international
randomized and real-world studies, including the landmark EU-funded CONVINCE study that collectively have associated highvolume HDF with fewer hospitalizations, fewer missed treatments, and improved survival outcomes compared with conventional
hemodialysis.
I will now hand over to Martin to walk you through the second quarter financials in more detail.
─────────────────────────────────────────────────────────────────────────────────────
Martin Fischer Fresenius Medical Care AG - Chief Financial Officer, Member of the Management
Board
LSEG STREETEVENTS | www.lseg.com | Contact Us
©2026 LSEG. All rights reserved. Republication or redistribution of LSEG content, including by framing or similar means, is
prohibited without the prior written consent of LSEG. 'LSEG' and the LSEG logo are registered trademarks of LSEG and its
affiliated companies.
4
August 04, 2026 / 8:00AM UTC, Q2 2026 Fresenius Medical Care AG Earnings Call
Thank you, Helen, and welcome, everyone. I will continue on slide 8. In the second quarter, we achieved solid organic group
revenue growth of 5%, supported by growth in all three operating segments. At constant currency, revenue increased by 4%.
Regulatory pressure in China continued to pose a challenge to revenue development in Care Enablement. Divestitures negatively
impacted group revenue development by 50 basis points in the second quarter.
For the full year, we continue to assume an unfavorable impact on a year-over-year revenue growth of about 30 basis points from
the execution of our portfolio optimization plan in '25 and '26. We significantly increased operating income by 23% at constant
currency. This growth was driven by contributions from Care Delivery and Value-Based Care segments and is in line with our
planned pacing for 2026.
Special items in the second quarter amounted to a negative EUR103 million, mainly related to the TAVNEOS impact. As
background, the European Commission's recommended revocation of the TAVNEOS marketing authorization led to an impairment
of intangible assets at Vifor Fresenius Medical Care Renal Pharma. That resulted in a negative impact on our income from equity
method investees of EUR71 million, which was treated as a special item.
Special items further include EUR42 million, FME25+ one-time cost and also positive effects from the Humacyte reevaluation.
I will continue on slide 9. Our group operating margin again expanded and further improved by 180 basis points. Care Delivery as
well as Value-Based Care contributed positively. I will cover the drivers of the segment profitability a little bit later. The greater
intersegment elimination reflects the growing sales of the 5008X in our clinics in the US. With further advancing our rollout, this trend
will continue.
Corporate costs increased by EUR47 million, mainly driven by the impact from virtual power purchase agreements and the planned
cost of the strategic IT platform investments as we continue to transition to SAP S/4HANA. In addition, FX translation effect had an
impact of negative EUR19 million this quarter. The average US dollar exchange rate in the second quarter was 1.16 compared to
1.17 in the first quarter and compared to 1.13 in the second quarter of 2025.
I will now walk you through the business development in each segment, starting with Care Delivery on slide 10. Care Delivery
realized 5% revenue growth at constant currency and organic revenue growth of 7%. In the US, organic growth of 7% was
supported by the positive impact on TDAPA reimbursement regulations, favorable rates development, and continued progress in
revenue cycle management initiatives, further enhancing revenue yield.
These benefits were partially offset by lower treatment volumes, driven by the referral dynamics Helen discussed earlier. The
international business continued to contribute positively. Divestitures as part of our portfolio optimization plan negatively impacted
revenue growth by around 90 basis points. The main driver here was the prior year divestment of our clinics in Brazil.
Care Delivery achieved strong earnings growth in line with planned phasing for the year, accelerating operating income growth to
45% with a 390 basis points step-up in margin. Importantly, underlying operating income, excluding the TDAPA effects, improved by
34%. This improvement was driven by higher rates, FME25+ contributions, in particular from the clinic closures, as well as benefits
from revenue cycle management.
Additionally, the growth was supported by a lower prior year base, which includes effects such as elevated medical benefit costs.
This more than offsets the impact from lower treatment volumes in the United States. As assumed, benefits from TDAPA
reimbursement regulations for phosphate binders and catheter lock solutions were a driver of earnings with around EUR80 million
year-over-year benefit in the quarter. The TDAPA effects are assumed to be a headwind in the remainder of the year.
Moving on to Value-Based Care on slide 11. Revenue in Value-Based Care segment grew by 9% on both organic and constant
currency basis. This was driven by an increased number of member months and the favorable effect from premium rates. Revenue
increase was partially offset by the change of the risk type for a large contract which resulted in a different type of accounting
treatment and lower revenue recognition.
Value-Based Care delivered a strong improvement in profitability in the second quarter, with operating income increasing to EUR18
million from a EUR9 million loss in the prior year. The margin improved by 500 basis points, marking another profitable quarter.
Supporting favorable business growth in the quarter was an improved savings rate, reflecting the strength of our contracting.
FME25+ savings additionally had a smaller but positive effect on earnings as well.
Looking ahead, due to the positive business development, we expect 2026 revenue for Value-Based Care to decline by EUR150
million to EUR200 million, which is lower than the initially assumed EUR300 million decline.
LSEG STREETEVENTS | www.lseg.com | Contact Us
©2026 LSEG. All rights reserved. Republication or redistribution of LSEG content, including by framing or similar means, is
prohibited without the prior written consent of LSEG. 'LSEG' and the LSEG logo are registered trademarks of LSEG and its
affiliated companies.
5
August 04, 2026 / 8:00AM UTC, Q2 2026 Fresenius Medical Care AG Earnings Call
I will finish the segment overview with Care Enablement on slide 12. Care Enablement delivered organic revenue growth of 3%,
supported by continued positive pricing and volumes outside China. Regulatory measures and stricter tender requirements in China
remained a headwind as assumed. However, the underlying momentum across the rest of the business continues to be encouraging
with growing sales of the 5008X increasingly contributing to that momentum as well.
Care Enablement earnings declined by 5% in the quarter, reflecting the adverse regulatory impact in China as well as increased
inflationary pressure, including higher raw material costs and elevated logistics expenses related to the Middle East conflict. As the
Middle East conflict continues, we are closely monitoring the increasing inflationary pressures and implementing mitigation
measures where possible. Currently, these higher costs, especially for raw materials and transportation, are absorbed in our
guidance range.
For our Care Enablement China business, as expected, we saw a headwind of around EUR20 million in the second quarter. These
negative effects were partially offset by positive volume and price effects outside of China and continued contributions from FME25+
savings.
Next, I will look at cash flow growth on slide 13. We delivered a strong increase in operating cash flow of 11% in the second quarter,
primarily driven by disciplined working capital management. Free cash flow remained stable at EUR625 million, while we increased
our investments in the business, reflecting the continued strength of our underlying cash generation. Total net debt and lease
liabilities, as well as total net debt and lease liabilities increased by 6% year-over-year as expected.
After canceling 8.5% of shares, which we bought back as part of the share buyback program completed in April of this year, we
initiated a new share buyback program starting in May with a total volume of around a further EUR1 billion. The new program will be
executed in tranches over a 12-month period with the first tranche of up to EUR600 million expected to be completed by midDecember.
By the end of the second quarter, we already repurchased 2.5 million shares for EUR94 million, representing 0.9% of total share
capital and approximately 16% of the first tranche. After initiating our new share buyback program, we continue to maintain a net
leverage ratio of 2.6 times, remaining around the lower end of our target corridor of 2.5 times to 3 times and underscoring the
strength of our balance sheet and disciplined approach to capital allocation.
I will now hand back to Helen.
─────────────────────────────────────────────────────────────────────────────────────
Helen Giza Fresenius Medical Care AG - Chairwoman of the Management Board, Chief Executive
Officer
Thank you, Martin. I will pick up at our outlook on slide 15. We continue to expect a broadly flat revenue development. For earnings,
our priority is to sustain the higher level of profitability established in 2025. Accordingly, we expect operating income to remain at a
consistently elevated level in 2026 with an upside/downside range of a mid-single-digit percentage change.
While we do not provide quarterly phasing, we communicated that we expected a strong first half earnings contribution in 2026,
supported by the mentioned underlying earnings improvement and positive TDAPA effects. TDAPA is expected to become a sizable
headwind in the third and fourth quarters, resulting in negative earnings growth in the second half.
For full year TDAPA contributions, we now expect a lower year-over-year headwind of around EUR50 million compared with the
previously anticipated negative impact of around EUR100 million. The second quarter demonstrates that the strategic actions we are
taking are yielding meaningful improvements in underlying profitability in Care Delivery. Despite the headwinds from lower treatment
volumes in the US and a tougher base in the second half of the year, we expect continued improvement in the underlying profitability
of Care Delivery.
Overall, we expect to deliver Care Enablement margin improvements in the second half and full year 2026 as we continue to
execute our Reignite strategy while offsetting increased inflationary pressure from the Middle East conflict in our Care Enablement
business. And we continue to assume Value-Based Care to perform around breakeven for the year, reflecting the assumed phasing
of contributions and prior year effects.
Given our strong first half performance and current expectations for the remainder of the year, we are confirming our full-year
outlook.
This concludes our prepared remarks, and I will now hand back to Dominik to begin the Q&A session.
LSEG STREETEVENTS | www.lseg.com | Contact Us
©2026 LSEG. All rights reserved. Republication or redistribution of LSEG content, including by framing or similar means, is
prohibited without the prior written consent of LSEG. 'LSEG' and the LSEG logo are registered trademarks of LSEG and its
affiliated companies.
6
August 04, 2026 / 8:00AM UTC, Q2 2026 Fresenius Medical Care AG Earnings Call
─────────────────────────────────────────────────────────────────────────────────────
Dominik Heger Fresenius Medical Care AG - Head of Investor Relations, Market & Competition,
Sustainability, EVP
Thank you, Helen. Thank you, Martin. (Event Instructions)
With that, I hand it over to Valentina to open the Q&A, please.
─────────────────────────────────────────────────────────────────────────────────────
QUESTIONS AND ANSWERS
Operator
(Operator Instructions)
─────────────────────────────────────────────────────────────────────────────────────
Dominik Heger Fresenius Medical Care AG - Head of Investor Relations, Market & Competition,
Sustainability, EVP
Jonathan, Barclays.
─────────────────────────────────────────────────────────────────────────────────────
Unidentified Participant
Good morning. Thank you for taking my questions. The first one is just on same-market treatment growth. If you could just help us to
understand really the detail on the deceleration from Q1 to Q2 in that number, specifically on the referrals piece.
I'm really just trying to understand what you could do to improve the inflow of patients there and how should we think about the
relative impact of clinic closures, referrals, and the outflow issues of patients that you previously pointed to?
And then thank you for giving the 2026 expectation. So is it fair to assume that you expect same market treatment growth in the US
to get worse throughout the year? How do you see the phasing and where do you expect to exit 2027 from a same market treatment
growth perspective? Thank you.
─────────────────────────────────────────────────────────────────────────────────────
Helen Giza Fresenius Medical Care AG - Chairwoman of the Management Board, Chief Executive
Officer
Thanks, Jonathan. I'll take that question and recognizing there's probably a lot of similar questions around same-market treatment
growth, I think it's helpful to kind of just maybe walk through that in a bit more detail than normal.
As we already outlined, the same market treatment growth declined by 0.9% in the quarter. At the same time, we are encouraged by
the progress we are seeing where it matters for our patients and that focus on quality and patient care is making a real difference.
And we were really encouraged to see missed treatments and mortality declining in the quarter.
As we discussed in Q1, we are executing a lot in parallel in the US dialysis business, which is an operational stretch. We obviously
exited around 100 clinics with execution speed, I would say, in half one. We've closed clinics faster than we would, than we ever
have before. Obviously, the progress on HDF is exciting, but at the same time, that does cause a fair amount of work in the clinics
that we are impacting there.
And at the same time, there's been a major clinic operations that touched about kind of a couple of thousand people with the whole
focus here on driving profitable growth. In the same time, recognizing that we had the ACA subsidies expiring, we also have
implemented some enhanced insurance verification on our patients.
And while we are pleased with the quality and patient safety initiatives, obviously rolling out these solutions did also have an impact
on the operation. So all of that is really to say the clinic operations are managing significant demand in parallel. And I think we saw
LSEG STREETEVENTS | www.lseg.com | Contact Us
©2026 LSEG. All rights reserved. Republication or redistribution of LSEG content, including by framing or similar means, is
prohibited without the prior written consent of LSEG. 'LSEG' and the LSEG logo are registered trademarks of LSEG and its
affiliated companies.
7
August 04, 2026 / 8:00AM UTC, Q2 2026 Fresenius Medical Care AG Earnings Call
that emerge on referrals in Q1 with a little softness there. And I would say that there was an underestimation of the impact that
created.
As we came out of Q1 into Q2, it was clear that there was -- while that disruption may have been understood, it was clear that it was
masking an underlying issue. And I think what we -- as I've kind of worked kind of closely with the team there, and with Cassie
directly, it's clear now that we have an operational miss, specifically in the business development approach, which is capturing our
fair market share of referrals.
We are not seeing a market issue. We are seeing a volume capture issue in terms of getting the patients that we see into our clinics.
So that was the execution gap that has led to a further softening of referrals in Q2 compared to Q1. We are all over it. We've made
some -- we obviously saw the organizational changes. We've also made organizational changes in the business development group.
That will take a few months to gain traction. Cassie is crystal clear of those priorities, and we do remain confident in our path to
restoring those referral rates in those affected areas. And obviously, we're looking at this region by region. However, given the
compounding effect of the lower first half referrals on the rest of the year, that's why we are now saying we expect the same market
treatment growth in '26 to be around the Q2 level.
Obviously, that compounding effect has caused the gap. We also know that we've got to do work that will take time. So that's why I
think we're trying to be realistic here and call the just similar level to Q2. Obviously, we do expect that work to take hold and for that
benefit to pull through, but realistically, I think we're seeing that more into '27 than we were originally thinking in '26.
In terms of kind of the exit rate for 2027, clearly I'm not going to speak to that today. I think we can kind of see where we see '26,
what '27 looks like. I need a few more quarters under our belt and obviously we'll be able to give that outlook when we get to
February. These kind of the areas of focus that you can appreciate are making sure that when we get those referrals, they're
accepted referrals and we are gaining our fair share there.
We had said, and I think it's fair to acknowledge this, that we didn't have an inflow issue that earlier or maybe the end of last year, it
was an outflow issue. I think we have done some significant work on outflows and that's really showing up in the mortality and
missed treatment numbers. What we have now is not a market or a patient issue, we have an accepted referral and inflow issue that
is 1,000% the focus of Cassie and the organization.
So I think that answered all the pieces there and apologies for the longer answer, I think it was one that's on a lot of people's minds.
─────────────────────────────────────────────────────────────────────────────────────
Unidentified Participant
That's great. Thank you very much.
─────────────────────────────────────────────────────────────────────────────────────
Dominik Heger Fresenius Medical Care AG - Head of Investor Relations, Market & Competition,
Sustainability, EVP
Veronica, Citi.
─────────────────────────────────────────────────────────────────────────────────────
Veronika Dubajova Citi Infrastructure Investments LLC - Analyst
Hello, good morning and thank you guys for taking my questions. I have two, please. Apologies, the first one is going to be on the
same market. And Helen, I just want to get a better shape of understanding of the quarter.
I appreciate you don't report monthly, but I remember when you were on the road, you were talking about April being down 40 basis
points, so not hugely similar, which would suggest that May and June really sort of fell off the cliff in terms of US same market
treatment growth rate. I was kind of wondering if you could comment on that.
And I guess if you have any early indications for how the referral piece is improving in July relative to how poor it must have been in
May and June, that might be helpful to give us all a bit of a confidence in terms of the forward path.
And then my second question is on the TDAPA phosphate binder assumption for the year. By my math, you're probably at around
130 already for H1. It sounds like the new guidance is 150 to 170, just trying to understand if maybe you're being a little too
conservative on that, given how strong the first half of the year has come in. Thank you, guys.
LSEG STREETEVENTS | www.lseg.com | Contact Us
©2026 LSEG. All rights reserved. Republication or redistribution of LSEG content, including by framing or similar means, is
prohibited without the prior written consent of LSEG. 'LSEG' and the LSEG logo are registered trademarks of LSEG and its
affiliated companies.
8
August 04, 2026 / 8:00AM UTC, Q2 2026 Fresenius Medical Care AG Earnings Call
─────────────────────────────────────────────────────────────────────────────────────
Helen Giza Fresenius Medical Care AG - Chairwoman of the Management Board, Chief Executive
Officer
Thanks, Veronika. I'll take the same-market treatment growth, and I'll have Martin walk us through the TDAPA numbers because I
know there's a lot of numbers here on that one. Yes, look, you're right. When we were on the road in April, we were already
indicating that April may be kind of a similar level coming out of the softness of Q1.
I mean, don't forget, April still had the benefit of the lower flu base in 2025. So that was kind of maybe also not giving us the clear
picture. There's no question as you see the number for the quarter that May and June did deteriorate. And I think that's where the
focus has been over the last couple of months, is really getting under what the root cause is and where the area of focus was.
I mean, I can buy disruption to a point, but we also have to make sure that the underlying cooperation is operating as we expect it to.
And I'm the last person to want to speak to an operational miss, but clearly we have one here. And that's why I think we're just being
careful on how we guide the rest of the year.
In July, I haven't seen numbers yet, but I think the fact that we are thinking of calling it for a similar level to Q2, I don't expect to see
the improvement overnight, but I do expect to see it take hold as we go through the next couple of quarters here. Martin you want to
take TDAPA?
─────────────────────────────────────────────────────────────────────────────────────
Martin Fischer Fresenius Medical Care AG - Chief Financial Officer, Member of the Management
Board
So, on TDAPA, as we said, we have seen about an EUR80 million effect in quarter 2 and also we said that we expect after the first
half year tailwind this to turn into a headwind for quarter 3 and quarter 4. Now total TDAPA contribution, we are now saying will be a
negative EUR50 million overall on a year-over-year basis and that is reduced from around EUR100 million they had on the previous
expectation.
As a reminder, we had last year a EUR310 million positive year-over-year contribution, and we said therein there was a EUR90
million DefenCath. DefenCath is unchanged, positive EUR90 million first half. Negative EUR90 million in the second half. So yearover-year, that is a wash or a zero effect.
For the binders, yes, we did see in the first half around EUR70 million positivity year-over-year, and we expect this to turn into a
headwind of around EUR120 million year-over-year in the second half. Then we started seeing in resulting in the EUR50 million for
the full year. The lower headwinds is predominantly driven by our pharma business where we see lower than expected headwinds
and that gives us or gives you an impression on the overall TDAPA picture.
─────────────────────────────────────────────────────────────────────────────────────
Veronika Dubajova Citi Infrastructure Investments LLC - Analyst
That's helpful, thank you. And Helen, can I just follow-up? One of the things that really struck me this quarter is the volume growth
gap, [wars] in the US clinics business, but it looks like your revenue mix is good, your revenue management is good. Is there a risk
here that you're sort of so focused on profitability that you've ended up at a place where volume growth is suffering? Is that the issue
that we're looking at?
─────────────────────────────────────────────────────────────────────────────────────
Helen Giza Fresenius Medical Care AG - Chairwoman of the Management Board, Chief Executive
Officer
No, I don't believe so. The work that we identified on rate and yield were very obvious things for us to go after where we were
lagging, and we've made tremendous strides in those. And in many ways, there are different teams internally within CD as well
focused on those. We will look at profitability measures like the clinic closures where we really can't see a way to make that clinic
profitable. That obviously has been a profitability focus for us, but not at the detriment of the weight and the yield that you're talking
about.
LSEG STREETEVENTS | www.lseg.com | Contact Us
©2026 LSEG. All rights reserved. Republication or redistribution of LSEG content, including by framing or similar means, is
prohibited without the prior written consent of LSEG. 'LSEG' and the LSEG logo are registered trademarks of LSEG and its
affiliated companies.
9
August 04, 2026 / 8:00AM UTC, Q2 2026 Fresenius Medical Care AG Earnings Call
But we clearly knew, right, that when we were closing these clinics, while we've held on to a significant portion of these patients, we
knew we were giving up some of that volume, and we saw that play out in the market in Q1. I expect that to continue to play out in
the market in Q2.
I think that was kind of a smaller piece of the overall same-market treatment growth development though. But we're very mindful,
Veronika, of what trade-offs we are making and we don't go into any of them likely, but clearly the profitability play on both the
restructure and reorg and the clinic closures has been meaningful for us and a smaller part of that same market treatment growth
give up.
The real issue here is really focused to the business development area on accepted referrals. And we can see that by area. So it is
isolated, which is why I'm kind of confident that we've got the right plans in place, we've got the right people now in place, and we
can get at it.
─────────────────────────────────────────────────────────────────────────────────────
Dominik Heger Fresenius Medical Care AG - Head of Investor Relations, Market & Competition,
Sustainability, EVP
Oliver, ODDO BHF.
─────────────────────────────────────────────────────────────────────────────────────
Oliver Metzger Oddo BHF SCA - Analyst
Good morning. Two questions from me. First about the payer or commercial mix. So would you describe that your startup initiatives
to improve the mix since last fall have contributed already significantly to some of this mix improvements?
Second question is still very early days, but we saw recently the first indications about the bundle rate, which also caused some
volatility in the share price. Could you share with us how you think about the first indications and yes, it will still change, but it would
be great to hear your view.
─────────────────────────────────────────────────────────────────────────────────────
Helen Giza Fresenius Medical Care AG - Chairwoman of the Management Board, Chief Executive
Officer
Thanks, Oliver. I think I can tackle both of those. On the commercial mix, we continue to be very encouraged by the improvements
that we see there. The rate improvement is real. We've done a lot of work in that area. It is slightly down to ACA that obviously has
developed in line with our expectations, but overall really pleased with the work that has been done on the commercial mix.
On the bundle rate. The 1%, always disappointing. Clearly, we're in preliminary period. We're offering up a lot of comments to the
administration on the moving pieces of that. We'll see what final brings. But overall, it's always challenging when it's less than
inflation.
─────────────────────────────────────────────────────────────────────────────────────
Oliver Metzger Oddo BHF SCA - Analyst
Yeah, I was less thinking about the bundle rates, but more about also the additions which come to the total rate.
─────────────────────────────────────────────────────────────────────────────────────
Helen Giza Fresenius Medical Care AG - Chairwoman of the Management Board, Chief Executive
Officer
Oh, you mean the TDAPA add-on payment?
─────────────────────────────────────────────────────────────────────────────────────
Oliver Metzger Oddo BHF SCA - Analyst
Yes.
─────────────────────────────────────────────────────────────────────────────────────
LSEG STREETEVENTS | www.lseg.com | Contact Us
©2026 LSEG. All rights reserved. Republication or redistribution of LSEG content, including by framing or similar means, is
prohibited without the prior written consent of LSEG. 'LSEG' and the LSEG logo are registered trademarks of LSEG and its
affiliated companies.
10
August 04, 2026 / 8:00AM UTC, Q2 2026 Fresenius Medical Care AG Earnings Call
Helen Giza Fresenius Medical Care AG - Chairwoman of the Management Board, Chief Executive
Officer
Oh, okay. Yeah, sorry, I heard you say bundle and thought you were talking about the PPS rate that also came out since last
quarter.
─────────────────────────────────────────────────────────────────────────────────────
Oliver Metzger Oddo BHF SCA - Analyst
No. I meant also including TDAPA, sorry.
─────────────────────────────────────────────────────────────────────────────────────
Helen Giza Fresenius Medical Care AG - Chairwoman of the Management Board, Chief Executive
Officer
Yeah, look, two things there. Again, some of this is preliminary. We do expect the government to continue to capture the pricing for
the next couple of quarters before it comes final. So for that, we would expect that payment to come down as it brings in more
quarters, reflecting the lower prices and the rebates that exist in that.
That should come down as we get to final. And I think what we would see, we wouldn't be surprised if that continues to develop in
line with our expectations. It's high right now just because I think it's a two-quarter lag off to what more data would come in and
show.
─────────────────────────────────────────────────────────────────────────────────────
Dominik Heger Fresenius Medical Care AG - Head of Investor Relations, Market & Competition,
Sustainability, EVP
Aisyah, Morgan Stanley.
─────────────────────────────────────────────────────────────────────────────────────
Aisyah Noor Morgan Stanley - Analyst
Hi, good morning, Helen and Martin. Thanks for taking my question. My first one is also unfortunately on the same-market treatment
growth but for the international number. That number was quite weak and the weakest we've seen in two years. Were there any
reimbursements there in the past that supported the growth and has resulted in a lower number in the quarter?
And then my second question was on the ACA headwind that you expect. I guess, what was the number for the quarter, your
expectations for 2026, and any early thoughts on the ACA headwind for 2027?
─────────────────────────────────────────────────────────────────────────────────────
Helen Giza Fresenius Medical Care AG - Chairwoman of the Management Board, Chief Executive
Officer
Yes, thanks, Aisyah. On the international same-market treatment growth, clearly we have a lot -- there's a mix effect there. Clearly,
we have a lot of countries and a lot of markets that we are focusing on. I think the piece that kind of maybe gets lost in this is, we
have exited some markets that had higher growth rates, so that would have an effect and it's kind of a little bit of mix on the mix in
the countries like Brazil and Malaysia, for example. And then as we already mentioned, kind of the flu impact in Q2 as well. So
nothing that we are overly concerned about there.
On the ACA. We had kind of sized a EUR50 million headwind for the full year. We had been watching that very, very closely,
obviously, in Q1 to see how sticky this was and what would happen once patients had to start paying their premiums. It did step up
as expected in Q2, which has meant that we've seen existing patients leave the exchange plans due to the affordability issues.
And then we have seen some patients move to other coverage like Medicare Advantage or Medicare. And of course, some are no
longer treating with us. So the underlying headwind remains consistent with our initial expectation of that EUR50 million for the full
year.
LSEG STREETEVENTS | www.lseg.com | Contact Us
©2026 LSEG. All rights reserved. Republication or redistribution of LSEG content, including by framing or similar means, is
prohibited without the prior written consent of LSEG. 'LSEG' and the LSEG logo are registered trademarks of LSEG and its
affiliated companies.
11
August 04, 2026 / 8:00AM UTC, Q2 2026 Fresenius Medical Care AG Earnings Call
What we're also seeing is that we have been able to reduce the impact on our commercial mix by expanded payer relationships and
signing new contracts in other geographies. So while it starts to get really difficult to tease out what patient went where, we can see
what happened on the ACA exchanges, but anything else that results from that will be picked up in business growth moving forward.
So we won't continue to track this ACA move. I think we've kind of been able to bring fence it for 2026, but all kind of played out as
expected even though there was this weird dynamic between Q1 and Q2. We're back where we thought we would be.
─────────────────────────────────────────────────────────────────────────────────────
Aisyah Noor Morgan Stanley - Analyst
Thanks. So, if I kind of interpret your comments and assuming that this impact kind of increases over the course of the year towards
the EUR50 million you had expected for the full year. Would it be fair to assume it's something like EUR10 million this quarter,
EUR15 million next quarter, EUR25 million the quarter after that? Or is it more kind of a linear progression?
─────────────────────────────────────────────────────────────────────────────────────
Helen Giza Fresenius Medical Care AG - Chairwoman of the Management Board, Chief Executive
Officer
Probably neither. It's been a bit lumpy because of what happened in Q1 and then some of this grace period and then kind of how
patients have fallen out. So I think we're not kind of getting into the quarter-by-quarter, but just like the whole EUR50 million sizing
for the year. But developed in line with our half one, half two phasing within our guidance range.
─────────────────────────────────────────────────────────────────────────────────────
Aisyah Noor Morgan Stanley - Analyst
Understood. Thank you so much.
─────────────────────────────────────────────────────────────────────────────────────
Dominik Heger Fresenius Medical Care AG - Head of Investor Relations, Market & Competition,
Sustainability, EVP
Hugo, BNPP.
─────────────────────────────────────────────────────────────────────────────────────
Hugo Solvet Exane Bnp Paribas - Analyst
Thank you for taking my questions. I have two, please. First quick one on tariff refund. Can you maybe help us quantify the impact in
Q2, what you expect for the remainder of the year? I think you guys have a -- only your marginal impact that would be helpful to
have that number.
Second, thanks for all the moving parts on 2026, but if we look forward to 2027, you guys have some tailwinds rolling off. US draft
reimbursement is 1% and inflation keeps running slightly above that at 3%. Could you walk us through some of the building blocks
for 2027, which would lead to EBIT growth next year, if that is the plan or is EBIT growth of the table next year?
─────────────────────────────────────────────────────────────────────────────────────
Helen Giza Fresenius Medical Care AG - Chairwoman of the Management Board, Chief Executive
Officer
Martin, why don't you take the tariff question and I will head up the tailwind and headwind discussion for 2027?
─────────────────────────────────────────────────────────────────────────────────────
Martin Fischer Fresenius Medical Care AG - Chief Financial Officer, Member of the Management
Board
As we had discussed, we had a limited tariff exposure in the past because of the breadth of our supply chain network and how we
manage to mitigate it. As such, we also expect a limited refund. We have not received or booked anything in the second quarter. We
LSEG STREETEVENTS | www.lseg.com | Contact Us
©2026 LSEG. All rights reserved. Republication or redistribution of LSEG content, including by framing or similar means, is
prohibited without the prior written consent of LSEG. 'LSEG' and the LSEG logo are registered trademarks of LSEG and its
affiliated companies.
12
August 04, 2026 / 8:00AM UTC, Q2 2026 Fresenius Medical Care AG Earnings Call
expect, let's say, high-single-digit kind of range in the second half here. But it is, as I said previously, when the headwind is rather
limited.
─────────────────────────────────────────────────────────────────────────────────────
Helen Giza Fresenius Medical Care AG - Chairwoman of the Management Board, Chief Executive
Officer
Hugo, I think you can appreciate I am not going to get into the moving pieces of 2027 guidance in August of '26. What I will speak to
though is -- you know our usual building blocks, right? On the positive side, business performance and volume, rates and yield,
FME25, clear expectation there that we continue to expand our margins across the business as well as getting the benefits from the
HDF rollout.
On the negative side, of course, we have the usual inflation and merit increases. And then I think the bigger moving bucket for 2027
is the binders and the TDAPA roll-off and that headwind into 2027. Obviously, we are not able to completely size that and won't do
that today. But obviously, we've got to wait for what the final pricing does on kind of the pharma pricing and of what goes into the
bundle.
But I think we've got our arms around what the moving parts of this business are by now. And of course, we will size them
accordingly by February.
─────────────────────────────────────────────────────────────────────────────────────
Dominik Heger Fresenius Medical Care AG - Head of Investor Relations, Market & Competition,
Sustainability, EVP
Richard, Goldman Sachs.
─────────────────────────────────────────────────────────────────────────────────────
Richard Felton Goldman Sachs Group Inc - Analyst
Thank you very much. Thanks for taking my question. I just want to follow-up on the US treatment growth, and in particular your
comments about not capturing your fair share of referrals. What was actually sort of, I guess in practice, what was happening to
drive that? Have there been changes in your processes, your competitor processes? I just would like to understand more what the
sort of the root cause of that is.
And then sort of as a follow-up to that, what is going to be top of Cassie's to-do list this year sort of comes in to run that business
and I suppose tries to steady the ship. Thank you.
─────────────────────────────────────────────────────────────────────────────────────
Helen Giza Fresenius Medical Care AG - Chairwoman of the Management Board, Chief Executive
Officer
Yeah, thanks, Richard. Look, at the end of the day, we could see that we were getting patients referred and we weren't getting them
into the clinic. So we track incoming referrals and we also track confirmed referrals. So when those referrals don't get confirmed,
meaning a patient isn't in the chair, we know that they're going somewhere else. So we clearly are expecting share loss because
those patients have gone somewhere and we'll see how that plays out in the market this quarter, of course.
What we are able to see is what those volumes and what those shares and kind of treatment volumes look like by region. And
clearly where we were falling short there, we have now targeted what area we need to make those improvements. So there is clear
visibility on it that there has been leadership changes in that area as well. And I think our whole organization knows that every
aspect of inflows and outflows on same-market treatment growth are our number one priority.
What I am encouraged by, Cassie's been with the organization three quarters or so now. She clearly, as we were looking through
the noise of disruption and I was trying to get under the real root cause, she quickly identified that we had a business development
and kind of -- in our own control inflow issue, if you will. And she's already working through those measures that need to be
executed in.
And as I mentioned, we're kind of putting the right leaders in and the right metrics to make sure that we're really focused on this
particular root cause, as we know. I mean, it's a big operation. It's a complex operation. We've done a lot here, and I don't want to
LSEG STREETEVENTS | www.lseg.com | Contact Us
©2026 LSEG. All rights reserved. Republication or redistribution of LSEG content, including by framing or similar means, is
prohibited without the prior written consent of LSEG. 'LSEG' and the LSEG logo are registered trademarks of LSEG and its
affiliated companies.
13
August 04, 2026 / 8:00AM UTC, Q2 2026 Fresenius Medical Care AG Earnings Call
dismiss the work that has been done. And I think the work that we are pulling through on outflows speaks to that.
So we're focused on it. And I think Cassie and I are very clearly aligned on the priorities and where we need to see improvement.
And we'll obviously track it accordingly, daily, weekly, and monthly.
─────────────────────────────────────────────────────────────────────────────────────
Richard Felton Goldman Sachs Group Inc - Analyst
Thank you, Helen. I appreciate the color. And if I could just squeeze in one follow-up, international Care Delivery was pretty robust,
especially in organic terms. What was driving that? Are there any one-offs that we should be aware of?
─────────────────────────────────────────────────────────────────────────────────────
Martin Fischer Fresenius Medical Care AG - Chief Financial Officer, Member of the Management
Board
So you saw that the same market treatment growth was at the 0.8%. We did see in the international organic revenue driver a
supporting accounting topic, which had an effect there. When you look at that in the second quarter, we had certain pharmaceutical
product business activities that we still had in Care Enablement and in the second quarter, we shifted that to CD.
It's neutral for the overall company to give you a bit of a, let's say, framing here, this is something that had last year brought it to
about EUR20 million roughly in revenue and the low single-digit in profitability. That is what is supporting international organic
revenue growth. And we did that in order to also have a full visibility of the global pharma P&L.
─────────────────────────────────────────────────────────────────────────────────────
Richard Felton Goldman Sachs Group Inc - Analyst
Thanks very much.
─────────────────────────────────────────────────────────────────────────────────────
Dominik Heger Fresenius Medical Care AG - Head of Investor Relations, Market & Competition,
Sustainability, EVP
Anna, Bank of America.
─────────────────────────────────────────────────────────────────────────────────────
Anna Ractliffe Bofa Merrill Lynch Asset Holdings Inc - Analyst
Hi. Thank you so much for taking the question. I wanted to dig in a bit on the HVHDF rollout and how much, if at all, you saw
disruption from the rollout of the clinics affecting US same market treatment growth in the quarter and what the learnings are from
the rollout in the first half to take into the second half.
And then I also wanted to, if possible, ask about external sales of HVHDF? I realize that's not a near-term priority. The priority for the
year is the internal rollout, but I imagine those discussions are in place. Just how are they evolving and how has that maybe
changed after the MOTheR trial data? Any incremental color there would be super helpful. Thank you.
─────────────────────────────────────────────────────────────────────────────────────
Helen Giza Fresenius Medical Care AG - Chairwoman of the Management Board, Chief Executive
Officer
Yeah, thanks, Anna. As it's my favorite topic and one that we're thrilled with the progress on. And as you can appreciate, something
of this scale, we get a lot of learnings. What I would say is a lot of those learnings were really helpful through that pilot stage of last
year. Once we got going, I think the teams have really stepped up.
Don't forget, it's still a relatively small part of the overall clinic network that has been converted. So it's not that it's a mass disruption
to the 2,600 clinic network, it is obviously an impact to the couple of hundred that we have done so far. What we have seen is as we
are gathering momentum, the speed and training and staff are just getting it. And that's why I think you're seeing the acceleration
and the kind of the progress of the 10%, which is wonderful.
LSEG STREETEVENTS | www.lseg.com | Contact Us
©2026 LSEG. All rights reserved. Republication or redistribution of LSEG content, including by framing or similar means, is
prohibited without the prior written consent of LSEG. 'LSEG' and the LSEG logo are registered trademarks of LSEG and its
affiliated companies.
14
August 04, 2026 / 8:00AM UTC, Q2 2026 Fresenius Medical Care AG Earnings Call
I'd say, we were clear that we wanted to track this patient cohort that was on HDF and you saw Charles put out the BEACON-US
press release last week, which we're thrilled with. I think it's too early at this stage to give real mortality or missed treatment data on
that cohort.
But what we are able to see, and I referenced it earlier, is that the clinical benefits are tracking in line with the CONVINCE study.
And the fact that we've got the patients reaching the high volume relatively quickly, we know that that mortality benefit will ramp up
over the coming years as well. So we're thrilled with what we're seeing so far, as well as obviously not just the performance but the
patient feedback, the physician feedback, and obviously, the kind of patients reaching out to learn more and want to be referred to a
HDF clinic.
As you rightly said, the external sales are minimal this year because of the allocation plan to our clinics. So, obviously we're making
our machines available as we have excess capacity to other providers, but that is something that is in pilot with some of those right
now and obviously that's up to them on what they choose to do with purchasing the machines.
Obviously, if that excess capacity that we've allocated doesn't get taken up in the short-term, that would mean we would allocate
more to our clinics and go faster. So I think we're in good shape for where we are six months or two quarters into -- I guess for eight
months, but two quarters in it leads to the launch and things are going incredibly well. And I think the speed of the uptake on
reaching the high volume levels is incredibly exciting and we're seeing that show up in the patient response.
─────────────────────────────────────────────────────────────────────────────────────
Anna Ractliffe Bofa Merrill Lynch Asset Holdings Inc - Analyst
Great. Thank you very much.
─────────────────────────────────────────────────────────────────────────────────────
Dominik Heger Fresenius Medical Care AG - Head of Investor Relations, Market & Competition,
Sustainability, EVP
Graham, UBS.
─────────────────────────────────────────────────────────────────────────────────────
Graham Doyle UBS AG - Analyst
Good morning, thanks for taking my questions. Just one quick one for Martin and then a slightly longer one for Helen. Martin, just on
the TDAPA, I've had a few people ask this specific total contribution for Q2, so is it fair to think of that as about EUR120 million of
EBIT in Q2 was from the full TDAPA, so catheters and phosphates?
And then, Helen, just secondly, on the guidance for this year, so the midpoint would imply something like a 12%-13% decline in
EBIT in H2. And when I think of H2 '26, H1 '27 looks quite similar in terms of the TDAPA driver in terms of the comparator there.
That feels like a not unsensible way of thinking about H1 '27, and there's still a degree of headwind in H2 '27. Is it still reasonable to
think of EBIT growth in 2027? I know you don't want to comment too much on it, but it's just it seems like those headwinds are quite
big.
─────────────────────────────────────────────────────────────────────────────────────
Martin Fischer Fresenius Medical Care AG - Chief Financial Officer, Member of the Management
Board
So what we did disclose is that this quarter in 2026, we had a year-over-year improvement of EUR80 million. We also disclosed in
quarter two 2025 that we had against the prior year period before TDAPA, an improvement year-over-year of the lower end of a middouble-digit impact. So when you take these two together, you are roughly where you said you would be and that constitutes kind of
a 2 times year-over-year that we see. We think of it in a yearly slice normally, not as a total concentration. Does that make sense?
─────────────────────────────────────────────────────────────────────────────────────
Graham Doyle UBS AG - Analyst
That's super clear. Thank you.
─────────────────────────────────────────────────────────────────────────────────────
LSEG STREETEVENTS | www.lseg.com | Contact Us
©2026 LSEG. All rights reserved. Republication or redistribution of LSEG content, including by framing or similar means, is
prohibited without the prior written consent of LSEG. 'LSEG' and the LSEG logo are registered trademarks of LSEG and its
affiliated companies.
15
August 04, 2026 / 8:00AM UTC, Q2 2026 Fresenius Medical Care AG Earnings Call
Helen Giza Fresenius Medical Care AG - Chairwoman of the Management Board, Chief Executive
Officer
Yes. And then, Graham, on your second question, obviously I don't want to get into the 2027 guidance, but I recognize everyone is
already trying to put those building blocks together. Maybe what I would refer you to is the '25 to '28 CAGR aspiration that we put out
there. Obviously, on '26, we are confirming our guidance. We always said that there would be this shift between half one and half
two that has completely developed in line with our expectations, which is why we are confirming. And then, of course, we've put out
a '25 to '28 3% growth CAGR aspiration, and that is obviously still there.
That used 2025 as a base that had the roughly EUR300 million of TDAPA benefits in there. So yeah, that's how we're thinking about
it. And don't forget, on that 3% to 7% CAGR growth assumption, we had also said there was underlying low 10s growth. So
obviously, we are expecting the businesses to continue to contribute on their margin expansion here.
─────────────────────────────────────────────────────────────────────────────────────
Graham Doyle UBS AG - Analyst
Okay. Thank you very much.
─────────────────────────────────────────────────────────────────────────────────────
Dominik Heger Fresenius Medical Care AG - Head of Investor Relations, Market & Competition,
Sustainability, EVP
James, Jefferies.
─────────────────────────────────────────────────────────────────────────────────────
James Vane-Tempest Jefferies LLC - Equity Analyst
Hi. Thanks very much for taking my questions. Two if I can, please. Firstly, you've completed 100 clinic closures this year. So I was
wondering if volumes stay at around the 2Q level into next year, would you need to consider other clinic closure programs to
manage your fixed costs or how should we think about decisions to manage your clinic capacity?
And then the second question is, this quarter you've renamed the operating cash flow line changes in other working capital and noncash items to changes in other assets and liabilities and other non-cash items. So I was wondering why change the wording now
and was this purely presentational or does it better reflect the fact that a broader set of operating assets and liabilities now contribute
to operating cash flow than historically?
It does seem as if cash flow improvements from this line in the first half were greater than the whole of the group. So it would be
helpful to have some color on what's driven if it's outside core operations, which otherwise would have decreased.
─────────────────────────────────────────────────────────────────────────────────────
Helen Giza Fresenius Medical Care AG - Chairwoman of the Management Board, Chief Executive
Officer
James, the clinic closure question sounds a lot easier than the second one, so I'll take the first one. Martin can clearly -- give him a
moment to look that up while I'm answering the clinic closures.
This is the second round of clinic closures that we've done over the last couple of years. As we know, the deeper you go into that
program on where they are operationally, the tougher they get in terms of the kind of the ROI on them. We feel really good about
what we've done to date and this 100. We feel that we're well placed with our outlook on what we expect to get on volume and
obviously the benefits from HDF as they kick in.
I've always said, while we're not planning for this not to kind of come back to growth, I've always said costs are not fixed indefinitely
and we would adjust capacity and overhead accordingly. And I think we've been very diligent in how we've done that and
appropriate with the kind of with the outlook that we've got. So our expectation is still this underlying return to growth. Clearly, it's
now taking up a little longer, but we're constantly looking at that overhead structure in line with that, and we'll adjust if needed in the
future.
─────────────────────────────────────────────────────────────────────────────────────
LSEG STREETEVENTS | www.lseg.com | Contact Us
©2026 LSEG. All rights reserved. Republication or redistribution of LSEG content, including by framing or similar means, is
prohibited without the prior written consent of LSEG. 'LSEG' and the LSEG logo are registered trademarks of LSEG and its
affiliated companies.
16
August 04, 2026 / 8:00AM UTC, Q2 2026 Fresenius Medical Care AG Earnings Call
James Vane-Tempest Jefferies LLC - Equity Analyst
So would it be fair to say if it was more like, say, minus 1.5 or something, that would kind of probably sort of trigger that sort of
discussion. I guess I'm sort of trying to understand the capacity that you have in terms of this manage and how much excess there is
for you to do that. So how much headroom do you have or the current run rate maybe is a better way of asking the question.
─────────────────────────────────────────────────────────────────────────────────────
Helen Giza Fresenius Medical Care AG - Chairwoman of the Management Board, Chief Executive
Officer
Yeah, I feel that we are right-sized for what we expect to see through this medium-term period.
─────────────────────────────────────────────────────────────────────────────────────
James Vane-Tempest Jefferies LLC - Equity Analyst
Thank you.
─────────────────────────────────────────────────────────────────────────────────────
Martin Fischer Fresenius Medical Care AG - Chief Financial Officer, Member of the Management
Board
So, James quickly from my side, so there is no change in content so to say in the line, there is also no accounting changes that
impact the line, it is only a better representation of the naming of the line.
─────────────────────────────────────────────────────────────────────────────────────
James Vane-Tempest Jefferies LLC - Equity Analyst
So that's now sort of understood, but in terms of what's driven that then, just given it's the swing is more than the cash flow from
generating the overall group, are you able to give us a sense what's gone into that cash flow improvement?
─────────────────────────────────────────────────────────────────────────────────────
Martin Fischer Fresenius Medical Care AG - Chief Financial Officer, Member of the Management
Board
So overall, our cash flow improvement was driven by the working capital development that we had, as I pointed out, where we did
improve so to say, based on the collection side as well as on the receivables side with a strong cash velocity and we also improved
further as we also lined out already in quarter one on the payable side, so those were the main drivers from them.
─────────────────────────────────────────────────────────────────────────────────────
James Vane-Tempest Jefferies LLC - Equity Analyst
Thank you. I think it's just because of the wording, noun doesn't include working capital in that particular line. That's sort of what I'm
just trying to understand. I'm happy to follow-up offline if that's easier. But given the magnitude, it would be helpful to understand.
─────────────────────────────────────────────────────────────────────────────────────
Martin Fischer Fresenius Medical Care AG - Chief Financial Officer, Member of the Management
Board
So no content change and the main drivers are the word (inaudible).
─────────────────────────────────────────────────────────────────────────────────────
Dominik Heger Fresenius Medical Care AG - Head of Investor Relations, Market & Competition,
Sustainability, EVP
Falko, Deutsche Bank.
LSEG STREETEVENTS | www.lseg.com | Contact Us
©2026 LSEG. All rights reserved. Republication or redistribution of LSEG content, including by framing or similar means, is
prohibited without the prior written consent of LSEG. 'LSEG' and the LSEG logo are registered trademarks of LSEG and its
affiliated companies.
17
August 04, 2026 / 8:00AM UTC, Q2 2026 Fresenius Medical Care AG Earnings Call
─────────────────────────────────────────────────────────────────────────────────────
Falko Friedrichs Deutsche Bank AG - Analyst
Thank you. Good morning. My first question is on the Care Enablement business in China. Thanks for pointing out the headwind in
Q2. I was wondering when you expect this situation to stabilize. And secondly, on the ACA topic, do you happen to have any early
view on how we should think about this for 2027 and how much of an additional headwind it could potentially be next year on top of
the EUR50 million this year?
─────────────────────────────────────────────────────────────────────────────────────
Helen Giza Fresenius Medical Care AG - Chairwoman of the Management Board, Chief Executive
Officer
Hi, Falko. Martin, why don't you take the China question? I'll come back on the ACA topic.
─────────────────────────────────────────────────────────────────────────────────────
Martin Fischer Fresenius Medical Care AG - Chief Financial Officer, Member of the Management
Board
So on China, we did see first half expectations to be as we thought. We had EUR20 million headwind in the quarter two. We had in
the quarter one half of the expected less than EUR50 million. So for the second half, we see that to be normalized and we expect for
the full year also this to remain below the EUR50 million. I would say through the first half, we are through the most of it and with that
the EUR50 million assumption for the full year is still intact.
─────────────────────────────────────────────────────────────────────────────────────
Helen Giza Fresenius Medical Care AG - Chairwoman of the Management Board, Chief Executive
Officer
And then Falco, on your ACA question, clearly I'm not going to size what that is for 2027 because we don't really know. What we do
know is the EUR50 million that developed unfavorably this year was in line with expectations, but as I also mentioned in my answer
to my previous question on the same topic, that we also are seeing shifts in kind of contracts from where patients are going.
So I think ultimately what this will all wash up in is our business kind of business growth number and that will kind of now be in the
base. But there's moving pieces here, so not all negative because of the positive moves in coverage with different insurers. So it's
just going to be impossible to track separately moving forward.
So when we give a business growth number for 2027, once we roll up these entire books of business and how it all settles out, we'll
be able to kind of pop it in there so that it's impossible to track where these patients ultimately will end up in 2027 between the
different plans. But we'll do the bottom-up of the business build that goes into that business growth number.
─────────────────────────────────────────────────────────────────────────────────────
Falko Friedrichs Deutsche Bank AG - Analyst
Okay, thank you.
─────────────────────────────────────────────────────────────────────────────────────
Helen Giza Fresenius Medical Care AG - Chairwoman of the Management Board, Chief Executive
Officer
Okay.
─────────────────────────────────────────────────────────────────────────────────────
Dominik Heger Fresenius Medical Care AG - Head of Investor Relations, Market & Competition,
Sustainability, EVP
Super. Thank you. So those were all questions we received. So there's no one waiting to ask a question. With that, I'll thank Helen
and Martin for answering the questions and for all the interesting questions. And with that, we'll close the call and wish everyone a
LSEG STREETEVENTS | www.lseg.com | Contact Us
©2026 LSEG. All rights reserved. Republication or redistribution of LSEG content, including by framing or similar means, is
prohibited without the prior written consent of LSEG. 'LSEG' and the LSEG logo are registered trademarks of LSEG and its
affiliated companies.
18
August 04, 2026 / 8:00AM UTC, Q2 2026 Fresenius Medical Care AG Earnings Call
great summer.
─────────────────────────────────────────────────────────────────────────────────────
Helen Giza Fresenius Medical Care AG - Chairwoman of the Management Board, Chief Executive
Officer
Yeah, thanks everybody. Appreciate the flexibility today on the earlier timing as well. Have a good summer and we'll see many of
you on the road soon. Thank you.
─────────────────────────────────────────────────────────────────────────────────────
Martin Fischer Fresenius Medical Care AG - Chief Financial Officer, Member of the Management
Board
Thank you.
─────────────────────────────────────────────────────────────────────────────────────
Operator
Ladies and gentlemen, the conference is now over. Thank you for choosing our call and thank you for participating in the
conference. You may now disconnect your lines. Goodbye.
─────────────────────────────────────────────────────────────────────────────────────
LSEG STREETEVENTS | www.lseg.com | Contact Us
©2026 LSEG. All rights reserved. Republication or redistribution of LSEG content, including by framing or similar means, is
prohibited without the prior written consent of LSEG. 'LSEG' and the LSEG logo are registered trademarks of LSEG and its
affiliated companies.
19
August 04, 2026 / 8:00AM UTC, Q2 2026 Fresenius Medical Care AG Earnings Call
DISCLAIMER
THE LONDON STOCK EXCHANGE GROUP AND ITS AFFILIATES (COLLECTIVELY, "LSEG") RESERVES THE RIGHT TO MAKE CHANGES TO
DOCUMENTS, CONTENT, OR OTHER INFORMATION ON THIS WEB SITE WITHOUT OBLIGATION TO NOTIFY ANY PERSON OF SUCH
CHANGES. NO CONTENT MAY BE MODIFIED, REVERSE ENGINEERED, REPRODUCED, OR DISTRIBUTED IN ANY FORM BY ANY MEANS,
OR STORED IN A DATABASE OR RETRIEVAL SYSTEM, WITHOUT THE PRIOR WRITTEN PERMISSION OF LSEG. THE CONTENT SHALL
NOT BE USED FOR ANY UNLAWFUL OR UNAUTHORIZED PURPOSES. LSEG DOES NOT GUARANTEE THE ACCURACY, COMPLETENESS,
TIMELINESS, OR AVAILABILITY OF THE CONTENT. LSEG IS NOT RESPONSIBLE FOR ANY ERRORS OR OMISSIONS, REGARDLESS OF
THE CAUSE, FOR THE RESULTS OBTAINED FROM THE USE OF THE CONTENT. IN NO EVENT SHALL LSEG BE LIABLE TO ANY PARTY
FOR ANY DIRECT, INDIRECT, INCIDENTAL, EXEMPLARY, COMPENSATORY, PUNITIVE, SPECIAL, OR CONSEQUENTIAL DAMAGES,
COSTS, EXPENSES, LEGAL FEES, OR LOSSES (INCLUDING, WITHOUT LIMITATION, LOST INCOME OR LOST PROFITS AND
OPPORTUNITY COSTS OR LOSSES CAUSED BY NEGLIGENCE) IN CONNECTION WITH ANY USE OF THE CONTENT EVEN IF ADVISED OF
THE POSSIBILITY OF SUCH DAMAGES.
Copyright ©2026 LSEG. All Rights Reserved.
LSEG STREETEVENTS | www.lseg.com | Contact Us
©2026 LSEG. All rights reserved. Republication or redistribution of LSEG content, including by framing or similar means, is
prohibited without the prior written consent of LSEG. 'LSEG' and the LSEG logo are registered trademarks of LSEG and its
affiliated companies.
20