New GMP (good manufacturing practice) facility to meet increasing demand for lipid nanoparticle (LNP) development and clinical drug product manufacturing Evonik invests over 150 million CAD (93 million EUR) Project is supported with up to 68…
- New GMP (good manufacturing practice) facility to meet increasing demand for lipid nanoparticle (LNP) development and clinical drug product manufacturing
- Evonik invests over 150 million CAD (93 million EUR)
- Project is supported with up to 68 million CAD (42 million EUR) external funding from the Canadian federal government’s Strategic Response Fund
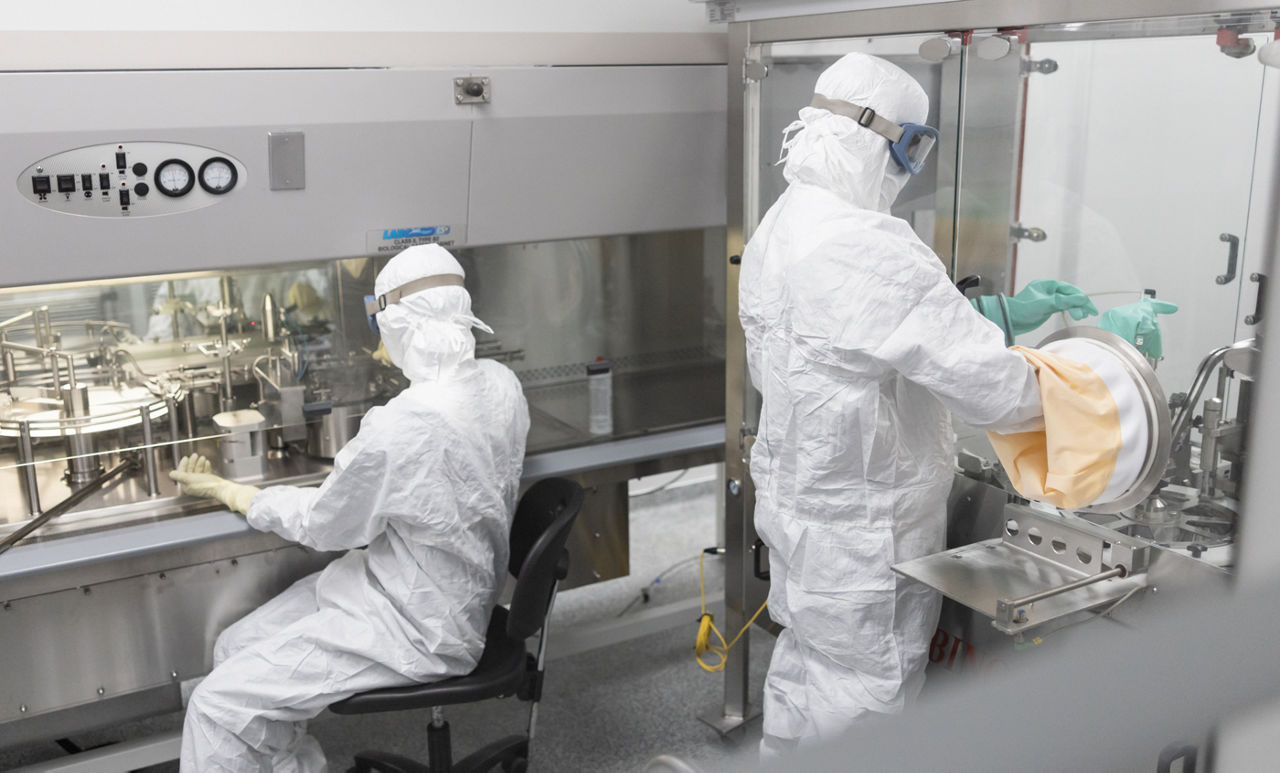
Evonik is investing in a new GMP drug product manufacturing facility for lipid-based drug delivery in Vancouver, Canada**.** The facility will increase Evonik’s development and manufacturing capacity, helping pharmaceutical and biotech customers bring lipid-based pharmaceutical products including vaccines, therapeutics, and other advanced medicines from development through commercial scale. Evonik’s total investment of over 150 million CAD (93 million EUR) in Vancouver is supported by the Canadian federal government’s Strategic Response Fund with up to 68 million CAD (around 42 million EUR). Drug product production is planned to begin at the end of 2029.
“Lipid-based drug delivery technologies are already enabling the next generation of medicines. With the support of the Canadian federal government, this investment builds on our long-standing expertise in the field, enabling the development and commercialization of more life-changing therapies,” said Lauren Kjeldsen, member of Evonik’s Executive Board and COO for the Custom Solutions segment at Evonik.
The Honourable Mélanie Joly, Minister of Industry and Minister responsible for Canada Economic Development for Quebec Regions (left) and Guido Skudlarek, head of Evonik’s Health Care business line (right) announced the investment on August 27 at the University of British Columbia in Vancouver, Canada.

More than tripling production capacity
The project will expand Evonik’s existing manufacturing capabilities through the establishment of a modern GMP facility with more than three times the manufacturing capacity of the current facility for advanced pharmaceutical products. The new facility will also significantly advance quality control (QC) and microbiological testing capabilities, improving efficiency and supporting the timely release of products for clinical use.
“The Vancouver region is a vibrant hub for life sciences innovation, and Evonik’s Health Care business
is proud to be growing within and with this ecosystem. This investment strengthens both our regional presence and our global network for lipid-based drug delivery,” said Guido Skudlarek, head of Evonik’s Health Care business line.
Evonik supports pharmaceutical and biopharmaceutical companies worldwide through an integrated network for lipid and LNP formulation development and manufacturing, with capabilities spanning the entire value chain.
“Canada at the forefront of next-generation vaccines and medicines”
British Columbia is home to Canada’s fastest-growing life sciences sector, where more than 2,000 companies employ close to 20,000 people, most of them in Greater Vancouver. The region’s biotech strength is also rooted in the University of British Columbia, which has been a driving force for decades and has given rise to many startups and spin-offs.
“Evonik’s expansion in Vancouver underscores Canada’s leadership in life sciences and innovation. This investment will drive advances in lipid-based drug delivery, create highly skilled jobs, and bolster British Columbia’s growing biotech ecosystem. The Government of Canada is proud to support Evonik’s goals, which will help position Canada at the forefront of next-generation vaccines and medicines,” said the Honourable Mélanie Joly, Minister of Industry and Minister responsible for Canada Economic Development for Quebec Regions.
Evonik Vancouver Laboratories, formerly Transferra Nanosciences and Northern Lipids, has been a pioneer in lipid-based drug delivery since the 1990s
and today provides CDMO services for advanced LNP and liposomal delivery systems, from formulation research through GMP clinical trial manufacturing and commercial process scale-up. By investing in one of North America’s most dynamic life science clusters, Evonik is expanding in this ecosystem, positioning itself as partner to pharma and biotech innovators to develop and support patient access to these technologies.
The LNP market is projected to grow to US$2.7 billion by 2034
Lipids are essential for encapsulating and delivering nucleic acid-based drugs, including mRNA, as well as other payloads. LNPs have become a leading delivery system, underscored by their role in COVID-19 vaccines, and demand continues to grow as nucleic acid therapeutics expand within the parenteral drugs market. The LNP market alone is estimated to reach US$2.7 billion by 2034
.
Lipid and LNP Network: From Vancouver through Birmingham, Dossenheim, Hanau, and Boston to Lafayette
Evonik supports pharmaceutical and biopharmaceutical companies worldwide through an integrated network for lipid and LNP formulation development and manufacturing, with capabilities spanning the entire value chain. Evonik Vancouver Laboratories develops LNP formulations and supports clinical manufacturing, with processes for advanced clinical trials and commercial production transferred to Birmingham, Alabama, USA. The network is complemented by lipid and adjuvant supply from Dossenheim, and Hanau in Germany, and R&D capabilities at the Cambridge Innovation Satellite in Greater Boston, USA. A new global-scale lipid production facility is also being built at Evonik’s Tippecanoe Labs site in Lafayette, Indiana, USA. Together, these sites combine expertise in lipid chemistry, LNP formulation, equipment and process engineering, sterile manufacturing and regulatory know-how to help customers move from early-stage development through GMP manufacturing and commercial supply.
Further information:
Evonik's product and service portfolio for nucleic acid delivery
Article: An ecosystem for lipid nanoparticles
Contacts
Janusz Berger
Head of Market Communications Health Care
Spoken languages: german, english, polish
+49 173 6986099
Send email
Dr. Jürgen Krauter
Head of Market Communications
Spoken languages: german, english
+49 6181 59-6847
Send email
Downloads
Download as PDF
Press image 1
Press image 2
Press image 3
Evonik: Leading beyond chemistry
Evonik goes beyond the boundaries of chemistry with its combination of innovative strength and leading technological expertise. The global chemical company, headquartered in Essen, Germany, is active in more than 100 countries and generated sales of €14.1 billion and earnings (adjusted EBITDA) of €1.9 billion in 2025. The common motivation of the approximately 31,000 employees: to provide customers with a decisive competitive advantage with tailor-made products and solutions as a superforce for industry, thereby improving people's lives. In all markets. Every day.
About Custom Solutions
The Custom Solutions segment focuses on innovation-driven, tailor-made solutions for customers in specific growth markets. These solutions include additives for coatings, adhesives and sealants, polyurethane foams and lubricants, catalysts, and ingredients for the cosmetics, cleaning and pharmaceutical industries. In 2025, the segment generated sales of €5.4 billion with around 9,500 employees.
Disclaimer
In so far as forecasts or expectations are expressed in this release or where our statements concern the future, these forecasts, expectations or statements may involve known or unknown risks and uncertainties. Actual results or developments may vary, depending on changes in the operating environment. Neither Evonik Industries AG nor its group companies assume an obligation to update the forecasts, expectations or statements contained in this release.
Evonik Industries AG
Opernplatz 1
45128 Essen
Germany
Phone +49 201 177-01
www.evonik.com
Supervisory Board Bernd Tönjes, Chairman Executive Board Christian Kullmann, Lauren Kjeldsen, Dr. Claudine Mollenkopf, Michael Rauch, Deputy Chairman Dr. Claus Rettig, Thomas Wessel
Registered Office is Essen Register Court Essen Local Court Commercial Registry B 19474
Online version press release
Evonik on social media
LinkedIn Evonik
YouTube Evonik
Instagram Evonik
Facebook Evonik
TikTok Evonik
WeChat Evonik
Company Information
Legal Notice
Privacy Policy
Contact


