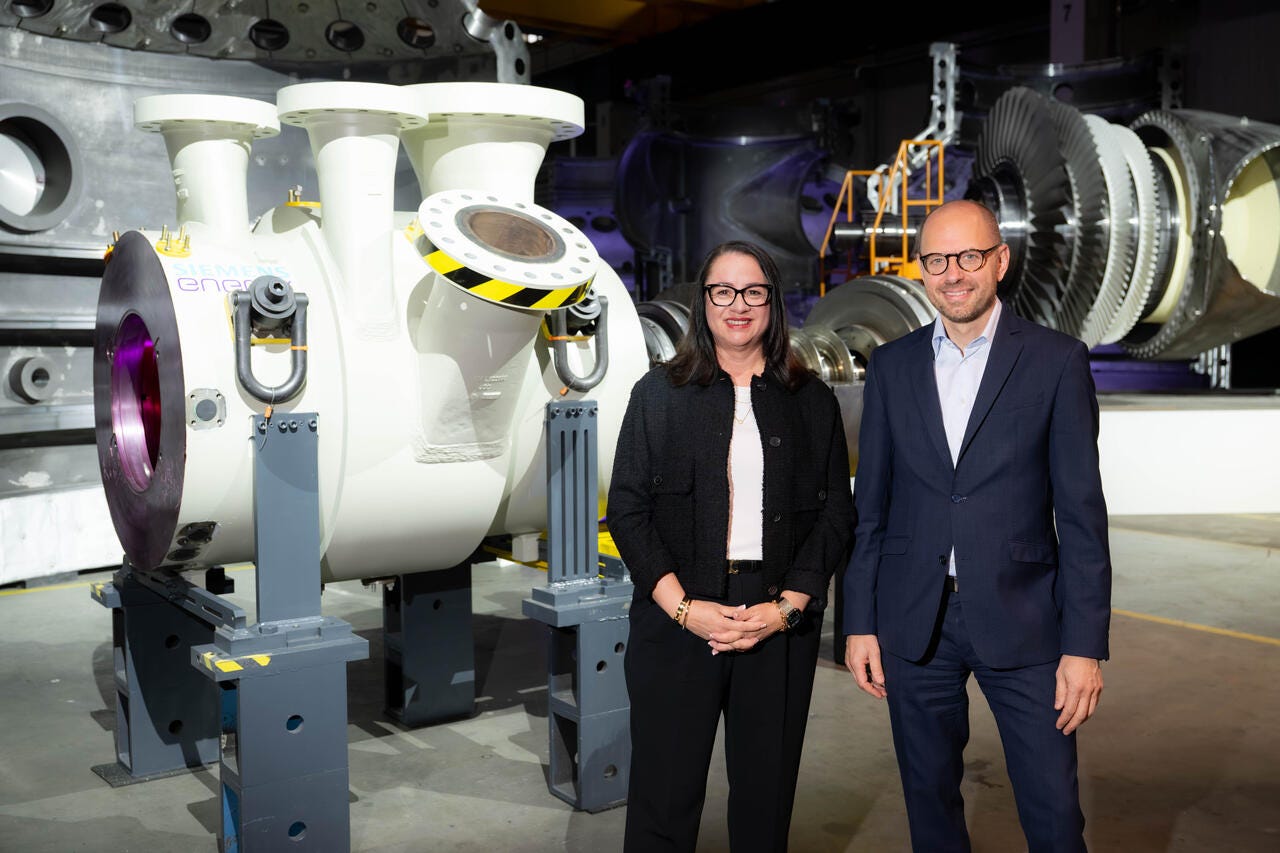
Siemens Energy Half-year Financial Report for the first half of fiscal year 2026 © 2020 Siemens Energy siemens-energy.com Page 1 Content 1 About this Report 2 Interim Group Management Report 6 11 14 15 Results of operations Net assets and financial…
Siemens Energy
Half-year Financial Report
for the first half of
fiscal year 2026
© 2020 Siemens Energy
siemens-energy.com
Page 1
Content
1 About this Report
2 Interim Group Management Report
6
11
14
15
Results of operations
Net assets and financial position
Report on expected developments
Report on material risks and opportunities
3 Half-year Consolidated Financial Statements
17
18
19
20
21
22
Consolidated Statements of Income
Consolidated Statements of Comprehensive Income
Consolidated Statements of Financial Position
Consolidated Statements of Cash Flows
Consolidated Statements of Changes in Equity
Notes to Half-year Consolidated Financial Statements
4 Additional information
31
32
Responsibility Statement
Review Report
About this Report
1
4
This Half-year Financial Report contains the Interim Group Management Report and the condensed Half-year Consolidated Financial Statements of
Siemens Energy AG and its subsidiaries (“Siemens Energy”, “the Group”, “the Company”, or “we”) as of March 31, 2026, as well as a Responsibility
Statement. It complies with the requirements of Section 115 of the German Securities Trading Act (”Wertpapierhandelsgesetz”). This Half-year
Financial Report should be read in conjunction with our Annual Report for fiscal year 2025, which includes a comprehensive presentation of our
business activities as well as explanations of financial measures used.
The Half-year Consolidated Financial Statements are prepared in accordance with International Financial Reporting Standards (IFRS) applicable to
interim financial reporting, as adopted by the European Union (EU).
This document contains statements related to our future business and financial performance and future events or developments involving
Siemens Energy, that may constitute forward-looking statements. These statements may be identified by words such as “expect”, “intend“,
"anticipate”, “aim”, “plan”, “believe”, “seek”, “estimate”, “will”, “project”, or words of similar meaning. We may also make forward-looking statements
in other reports, prospectuses, presentations, material delivered to shareholders and press releases. In addition, our representatives may from time
to time make verbal forward-looking statements. Such statements are based on the current expectations and certain assumptions of
Siemens Energy’s management, of which many are beyond Siemens Energy’s control. These are subject to a number of risks, uncertainties and
factors, including, but not limited to those described in disclosures, in particular in the chapters 2.7 Report on expected developments and
2.8 Report on the internal control and risk management system and material risks and opportunities of the Annual Report, and the
corresponding chapters in the Half-year Financial Report. Should one or more of these risks or uncertainties materialize, should acts of force
majeure occur, or should underlying expectations including future events occur at a later date or not at all, or should assumptions prove incorrect,
Siemens Energy’s actual results, performance, or achievements may (negatively or positively) vary materially from those described explicitly or
implicitly in the relevant forward-looking statement. Siemens Energy neither intends, nor assumes any obligation to update or revise these forwardlooking statements in light of developments, which differ from those anticipated.
This document includes supplemental financial measures not clearly defined in the applicable financial reporting standards, that are or may be
alternative performance measures. These supplemental financial measures should not be viewed in isolation, or as alternatives to measures of
Siemens Energy’s net assets, financial position and results of operations as presented in accordance with the applicable financial reporting standards
in its Consolidated Financial Statements. Other companies that present or report similarly titled alternative performance measures may calculate
them differently.
The Half-year Consolidated Financial Statements have been prepared and published in millions of euro (€ million). Due to rounding, numbers
presented throughout this and other documents, may not add up precisely to the totals provided, and percentages may not precisely reflect the
absolute figures.
This document is an English language translation of the German document. In case of discrepancies, the German language document is the sole
authoritative version.
Siemens Energy – Half-year Financial Report 2026
Interim Group Management Report
2
Interim Group Management Report
2.1 Results of operations
2.1.1 Orders and revenue
Orders
Orders and revenue
First half
Revenue
Change
First half
Change
(in millions of €)
FY 2026
FY 2025
Actual
Comp.
FY 2026
FY 2025
Actual
Comp.
Gas Services
17,620
12,047
46%
53%
6,575
5,986
10%
14%
Grid Technologies
12,960
10,325
26%
32%
6,121
5,341
15%
19%
Transformation of Industry
2,833
3,017
(6)%
(3)%
2,724
2,748
(1)%
3%
Siemens Gamesa
2,402
3,311
(27)%
(24)%
4,881
5,124
(5)%
2%
Total segments
35,816
28,700
25%
31%
20,301
19,200
6%
11%
(458)
(599)
—
—
(332)
(296)
—
—
35,358
28,101
26%
32%
19,969
18,904
6%
11%
Reconciliation to
Consolidated Financial
Statements
Siemens Energy
Orders
Orders and revenue
(location of customer)
First half
Revenue
Change
First half
Change
(in millions of €)
FY 2026
FY 2025
Actual
Comp.
FY 2026
FY 2025
Actual
Comp.
Europe, C.I.S., Middle East, Africa
15,337
14,433
6%
7%
10,973
10,004
10%
12%
2,021
1,763
15%
14%
2,299
1,890
22%
22%
15,604
10,537
48%
62%
6,429
5,407
19%
29%
therein U.S.
13,596
7,684
77%
95%
4,954
3,985
24%
37%
Asia, Australia
4,417
3,131
41%
45%
2,567
3,493
(27)%
(20)%
therein China
647
614
5%
11%
582
772
(25)%
(19)%
Siemens Energy
35,358
28,101
26%
32%
19,969
18,904
6%
11%
therein Germany
Americas
Siemens Energy – Half-year Financial Report 2026
6
7
Interim Group Management Report
Orders
• The favorable market environment in the energy sector from the prior fiscal year remained intact. Strong demand for Siemens Energy’s
products, solutions and services was broad-based across all regions, and was mainly driven by the strong expansion of data centers, particularly
in the U.S. On a comparable basis (excluding currency translation and portfolio effects), Siemens Energy’s order intake increased substantially.
Growth was driven by developments in the new units business at Gas Services and Grid Technologies and was supported by a sharp increase in
the volume of large orders. As a result, the service share of Siemens Energy’s orders declined to 28% (H1 FY 2025: 37%).
• Orders at Gas Services (GS) increased sharply, primarily driven by the new units business, in which the volume of large orders more than
doubled. The positive development was supported by demand related to data centers as well as orders from power capacity expansion in Europe
(e.g. Poland).
• Orders at Grid Technologies (GT) increased substantially compared to the prior-year period. Both the product business, especially transformers,
and the solutions business recorded substantial growth. This was driven by the sharply increased volume from large orders.
• Orders at Transformation of Industry (TI) declined moderately. Increases in Electrification, Automation, Digitalization and Steam Turbines &
Generators could not offset declines in the other businesses.
• Siemens Gamesa (SG) reported a substantially lower order intake. This was due to the decline in the offshore business, reflecting the substantial
order intake in the prior-year period, which included a large order in the North Sea worth €1.4 billion. Onshore orders increased year-over-year.
In the second quarter of the fiscal year, first orders were received for the SG 7.0-170, the successor model to the 5.X turbine.
• Siemens Energy’s book-to-bill ratio was 1.77 (H1 FY 2025: 1.49). The order backlog reached a new record high of €154 billion, compared with
€138 billion at the end of the prior fiscal year.
• From a geographic perspective, increases were recorded in all three reporting regions. In Americas and Asia, Australia, orders increased sharply.
Europe, CIS, Middle East, Africa (EMEA) lagged behind, although the increase was still clear.
• The development in EMEA was driven by substantial and significant increases in the GT and GS segments, respectively. This more than offset
the decline in the other two segments. The sharp decrease at SG was related to the large order in the prior year mentioned above.
• Growth in the Americas was driven by a sharp increase in orders from the U. S., primarily related to data centers. All segments except TI recorded
sharp or substantial growth.
• The development in Asia, Australia was primarily driven by the increase in orders at GS in Taiwan and in the Asia-Pacific region. TI and SG also
reported increases. By contrast, orders at GT in the region declined substantially.
Revenue
• On a comparable basis, Siemens Energy’s revenue increased significantly. All segments contributed to this development and benefited from
both the execution of the high order backlog and the favorable market environment. The increase in the new units business was several times
higher than the growth in the service business. As a result, the share of revenue from the service business declined to 33% (H1 FY 2025: 36%).
• GS reported a significant increase, driven by growth in the new units business. The service business declined slightly.
• Revenue at GT also increased significantly. The solutions business made the largest contribution in value terms, followed by the product business
with switchgear. In addition, the transformer business recorded a significant increase.
• TI reported moderate revenue growth, mainly due to developments in the new units business at Sustainable Energy Systems.
• Revenue at SG was slightly above the prior-year level. This was mainly attributable to the offshore service business. Revenue in the onshore
business declined.
• In terms of the geographic development of revenue on a comparable basis, a substantial increase was recorded in the Americas, EMEA grew
significantly, while revenue in Asia, Australia declined significantly.
• In EMEA, all segments reported increases, led by substantial and significant growth at GT and SG, respectively.
• All segments also contributed to growth in the Americas, especially SG with a sharp increase, followed by a substantial increase at GS.
• The decline in Asia, Australia was primarily driven by the sharp decrease at SG, and revenue at TI also declined, while GS and GT reported
increases.
Siemens Energy – Half-year Financial Report 2026
Interim Group Management Report
2.1.2 Profitability
First half
(in millions of €, earnings per share in €)
FY 2026
FY 2025
Change
Profit Siemens Energy before Special items
2,323
1,387
68%
Gas Services
1,067
922
16%
Grid Technologies
1,062
880
21%
Transformation of Industry
325
312
4%
Siemens Gamesa
(90)
(623)
86%
Reconciliation to Consolidated Financial Statements
(41)
(105)
61%
12%
7%
4 p.p.
Gas Services
16%
15%
1 p.p.
Grid Technologies
17%
16%
1 p.p.
Transformation of Industry
12%
11%
1 p.p.
Siemens Gamesa
(2)%
(12)%
10 p.p.
Special items (for details see table below)
(207)
(309)
33%
Profit Siemens Energy
2,116
1,077
96%
Gas Services
1,113
917
21%
Grid Technologies
1,057
873
21%
318
306
4%
Siemens Gamesa
(260)
(932)
72%
Reconciliation to Consolidated Financial Statements
(113)
(86)
31%
11%
6%
5 p.p.
Gas Services
17%
15%
2 p.p.
Grid Technologies
17%
16%
1 p.p.
Transformation of Industry
12%
11%
1 p.p.
Siemens Gamesa
(5)%
(18)%
13 p.p.
(92)
(121)
24%
94
111
(15)%
Income (loss) before income taxes
2,119
1,067
99%
Income tax gains/ (expenses)
(538)
(314)
(71)%
Net income (loss)
1,581
753
110%
Basic earnings per share
1.68
0.73
130%
Profit margin Siemens Energy before Special Items
Transformation of Industry
Profit margin Siemens Energy
Amortization of intangible assets acquired in business combinations and goodwill impairments
Financial result
Siemens Energy – Half-year Financial Report 2026
8
9
Interim Group Management Report
Profit and Profit before Special items
• Siemens Energy’s sharp increase in Profit was driven by improvements across all segments, with SG recording the strongest growth. Overall,
the increase in Siemens Energy’s Profit was mainly attributable to continued productivity improvements and higher cost efficiency as well as
higher volume and the raised margin of the processed order backlog year-over-year. As in the prior year, Special items were mainly attributable
to expenses related to the sale of the Indian wind business (for further information on this transaction, see Note 2 in 3.6 Notes to the Halfyear Consolidated Financial Statements). Profit before special items and the corresponding margin at Siemens Energy also increased sharply.
• GS improved its Profit substantially, mainly due to higher revenue as well as improved margin quality of the processed order backlog. Profit
included positive special items related to the full acquisition of a joint venture. Profit before special items at GS increased significantly, the
corresponding margin rose moderately compared with the prior-year period.
• GT’s Profit increased substantially. The product business made the largest contribution to the improvement. Overall, the increase in Profit was
driven by higher volume and the higher margin of the processed order backlog year-over-year. As in the prior year, Profit was impacted by
negligible negative special items. Profit before special items at GT rose substantially, the corresponding margin increased moderately.
• TI’s Profit improved moderately compared with the prior-year period. The Profit rose on productivity improvements and the comparatively higher
margin of the processed order backlog. In both years, negative special items were not material. Profit before special items and the corresponding
margin increased moderately.
• SG improved its Profit sharply compared with the prior-year period. This positive development was mainly due to progress in the service business
as well as overall productivity improvements and higher cost efficiency. Profit included expenses reported as special items related to the closing
of the sale of the Indian wind business; this was partly offset by positive special items in connection with the sale of the power electronics
business. Taken together, this also resulted in a sharp improvement in Profit before special items and the corresponding margin.
• Reconciliation to Consolidated Financial Statements includes items which management does not consider to be indicative of the segments’
performance – mainly group management costs (management and corporate functions) and other central items, Treasury activities as well as
eliminations. Other central items include Siemens brand fees, corporate services (e.g. management of the Group’s real estate portfolio),
corporate projects, centrally held equity interests and other items.
Net Income (Loss), Basic Earnings per Share
• In total, the change in financial result and in amortization of intangible assets acquired in business combinations and goodwill impairments was
not material. The Income before income taxes thus developed in line with the Profit.
• The effective tax rate of the Group was 25.4% (H1 FY 2025: 29.5%).
• As a result of the developments described above, Siemens Energy recorded a sharp increase in net income and a corresponding increase in basic
earnings per share in the current half-year.
Siemens Energy – Half-year Financial Report 2026
Interim Group Management Report
Siemens Energy Special items
First half
FY 2026
FY 2025
Change
(42)
(97)
57%
Gas Services
(11)
(9)
(29)%
Grid Technologies
(8)
(8)
(9)%
Transformation of Industry
(8)
(5)
(62)%
Siemens Gamesa
(2)
(45)
95%
Reconciliation to Consolidated Financial Statements
(13)
(31)
60%
Stand-alone costs
(59)
(1)
(200)%
Gas Services
—
—
n/a
Grid Technologies
—
—
n/a
Transformation of Industry
—
—
n/a
Siemens Gamesa
—
—
n/a
(59)
(1)
(200)%
(106)
(212)
50%
Gas Services
57
4
200%
Grid Technologies
3
1
200%
Transformation of Industry
1
(2)
n/a
(167)
(265)
37%
—
50
n/a
(207)
(309)
33%
Gas Services
46
(5)
n/a
Grid Technologies
(5)
(7)
26%
Transformation of Industry
(7)
(7)
0%
Siemens Gamesa
(170)
(310)
45%
Reconciliation to Consolidated Financial Statements
(72)
19
n/a
(in millions of €)
Restructuring and integration costs
Reconciliation to Consolidated Financial Statements
Strategic portfolio decisions
Siemens Gamesa
Reconciliation to Consolidated Financial Statements
Siemens Energy Special items
Siemens Energy – Half-year Financial Report 2026
10
11
Interim Group Management Report
2.2 Net assets and financial position
Mar 31, 2026
Sep 30, 2025
Change
39,452
34,453
15%
Cash and cash equivalents
11,695
9,162
28%
Trade and other receivables
8,237
7,571
9%
Other financial assets
1,416
1,031
37%
Contract assets
4,936
4,295
15%
Inventories
11,407
10,377
10%
—
386
n/a
22,408
22,184
1%
Goodwill
9,222
9,037
2%
Other intangible assets
2,457
2,450
0%
Property, plant and equipment
7,439
7,140
4%
Investments accounted for using the equity method
1,325
703
88%
695
1,531
(55)%
61,861
56,637
9%
Mar 31, 2026
Sep 30, 2025
Change
43,262
38,491
12%
Debt
1,240
1,528
(19)%
Trade and other payables
6,356
5,993
6%
Other financial liabilities
1,041
782
33%
Contract liabilities
27,045
22,321
21%
Provisions
2,681
2,778
(3)%
—
233
n/a
7,480
7,471
0%
2,490
2,438
2%
414
406
2%
2,915
3,065
(5)%
Total equity
11,118
10,675
4%
Total liabilities and equity
61,861
56,637
9%
(in millions of €)
Total current assets
therein
Assets classified as held for disposal
Total non-current assets
therein
Other financial assets
Total assets
(in millions of €)
Total current liabilities
therein
Liabilities associated with assets classified as held for disposal
Total non-current liabilities
therein
Debt
Provisions for pensions and similar obligations
Provisions
Siemens Energy – Half-year Financial Report 2026
Interim Group Management Report
Assets, liabilities and equity
• As of March 31, 2026, total assets of the Siemens Energy Group had increased clearly compared to the end of the prior fiscal year. The changes
on both the assets and liabilities sides primarily reflect the successful business performance in the first half-year – including an increase in
business volume. Currency translation differences had a minor impact on the increase in total assets.
• The substantial increase in cash and cash equivalents was attributable to the higher Free cash flow pre tax – compared to the prior year – that
Siemens Energy generated in the past half-year (see below).
• Negative operating net working capital increased sharp again and amounted to negative €8,823 million (September 30, 2025:
negative €6,071 million). In line with the growing business volume, all components of operating net working capital increased. The main driver
was the substantial increase in contract liabilities resulting from higher project prepayments, particularly at GS and GT.
• Other current financial assets and liabilities increased to €1,416 million (September 30, 2025: €1,031 million) and €1,041 million
(September 30, 2025: €782 million), respectively, primarily in connection with derivative financial instruments.
• In particular as a result of the completion of the sale of the Indian wind business (see Note 2 in 3.6 Notes to the Half-year Consolidated
Financial Statements), there were no longer any assets classified as held for disposal or liabilities associated with assets classified as held
for disposal as of March 31, 2026.
• The changes in investments accounted for using the equity method and in other financial assets were primarily attributable to transactions
related to Siemens Limited, India, and Siemens Energy India Limited, India (see Note 5 and Note 7 in 3.6 Notes to the Half-year Consolidated
Financial Statements).
• Current and non-current debt decreased clearly to €3,730 million in total (September 30, 2025: €3,966 million). This was primarily due to the
repayment of current liabilities to banks.
• Equity increased moderately compared to the end of the prior fiscal year. This was primarily due to Net income and, in addition, to the positive
other comprehensive income, while this was partly offset by the treasury shares acquired in the past half year and the dividend paid for
fiscal year 2025.
Cash flows
• Siemens Energy achieved a sharp increase in Free cash flow pre tax in the first half-year compared to the prior year. This was driven by the
positive profit development and, in particular, the higher cash inflow from changes in operating net working capital compared to the prior year,
which was largely attributable to an increase in contract liabilities.
• The higher Free cash flow pre tax was primarily attributable to GS and GT, with GS making a significantly larger contribution. In both segments,
the improvement resulted from the profit development, but above all from increased customer prepayments, including reservation fees.
TI generated a positive Free cash flow pre tax, which declined sharply, mainly due to cash outflows resulting from changes in operating net
working capital. The decline in SG was mainly driven by higher cash outflows from changes in operating net working capital compared to the
prior year, in particular relating to contract assets and contract liabilities. In addition, Free cash flow pre tax at SG was held back due to the cash
effect of the provisions made for quality issues.
• The change in cash flows from investing activities – apart from the increase in investments – was mainly attributable to higher cash outflows
for the purchase of investments and financial assets compared to the prior year. However, the majority of the cash outflow resulted from the
transactions mentioned above in connection with Siemens Limited, India, and Siemens Energy India Limited, India, which were offset by
corresponding cash inflows from the disposal of investments and financial assets. In addition, lower cash inflows from the disposal of businesses
were recorded in the past half-year.
• The increased cash outflow in cash flows from financing activities was primarily attributable to the purchase of treasury shares under the
share buyback program started on March 4, 2026 (see Note 4 in 3.6 Notes to the Half-year Consolidated Financial Statements), and the
dividend paid. This was supplemented by cash outflows resulting from the reduction in debt.
• Siemens Energy's net cash – defined as the difference between total debt and total liquidity - amounted to €7,965 million as of March 31, 2026
(September 30, 2025: €5,196 million). This development is almost entirely attributable to the increase in cash and cash equivalents.
Siemens Energy – Half-year Financial Report 2026
12
13
Interim Group Management Report
First half
FY 2026
FY 2025
Change
Gas Services
3,752
1,814
107%
Grid Technologies
2,576
1,886
37%
140
458
(69)%
(1,199)
(900)
(33)%
Reconciliation to Consolidated Financial Statements
(426)
(340)
(25)%
Free cash flow pre tax of Siemens Energy
4,844
2,918
66%
(711)
(588)
(21)%
Operating activities
5,234
3,261
60%
Investing activities
(778)
(453)
(72)%
Financing activities
(2,096)
(163)
<(200)%
(in millions of €)
Free cash flow pre tax by segment
Transformation of Industry
Siemens Gamesa
therein Purchase of intangible assets and property, plant and equipment
Cash flows from
Siemens Energy – Half-year Financial Report 2026
Interim Group Management Report
2.3 Report on expected developments
Based on the positive business development in the first half-year and the strong market demand, Siemens Energy raised its outlook for
fiscal year 2026. The change in the outlook is mainly driven by a stronger than expected performance at Grid Technologies. Regarding Free cash
flow pre tax, the higher outlook is particularly attributable to Gas Services and Grid Technologies, which both experience strong cash inflows driven
by customer payments related to strong order momentum.
Siemens Energy now expects for the Group to achieve comparable revenue growth (excluding currency translation and portfolio effects) in fiscal
year 2026 in a range of 14% to 16% (before 11% to 13%) and a Profit margin before Special items between 10% and 12% (before between 9% and
11%). Siemens Energy now expects a Net income of around €4 billion (before in the range of €3 billion to €4 billion). Also, the outlook for Free
cash flow pre tax for the fiscal year 2026 was raised to around €8 billion (before in a range of €4 billion to €5 billion).
The outlook for Siemens Energy does not include charges related to any future legal and regulatory matters.
Amended overall assumptions per business area
• Gas Services assumes a comparable revenue growth of 16% to 18% and a Profit margin before Special items of 14% to 16% (both unchanged).
• Grid Technologies now plans to achieve a comparable revenue growth of 25% to 27% (before 19% to 21%) and a Profit margin before Special
items between 18% and 20% (before between 16% and 18%).
• Transformation of Industry expects a comparable revenue growth of 5% to 7% and a Profit margin before Special items of 11% to 13% (both
unchanged).
• Siemens Gamesa now assumes a comparable revenue growth of 3% to 5% (before 1% to 3%) and a Profit margin before Special items still at
break-even.
Siemens Energy – Half-year Financial Report 2026
14
15
Interim Group Management Report
2.4 Report on material risks and opportunities
In the reporting period, the overall risk position for Siemens Energy has not changed significantly compared to the overall risk position presented
in our Annual Report for the fiscal year 2025. Additional risks and opportunities not known to us or that we currently consider immaterial could
also affect our business operations. At present, no risks have been identified that could endanger the continued existence of our company, either
individually or as a whole.
Siemens Energy – Half-year Financial Report 2026
Half-year Consolidated Financial Statements
3
17
Half-year Consolidated Financial Statements
3.1 Consolidated Statements of Income
First half
Note
FY 2026
FY 2025
8
19,969
18,904
Cost of sales
(15,619)
(15,533)
Gross profit
4,350
3,371
(528)
(600)
(1,731)
(1,658)
Other operating income
80
56
Other operating expenses
(252)
(294)
106
82
Operating income (loss)
2,024
956
Interest income
151
128
Interest expenses
(99)
(137)
43
120
Income (loss) before income taxes
2,119
1,067
Income tax (expenses) benefits
(538)
(314)
Net income (loss)
1,581
753
138
121
1,443
632
Basic earnings per share
1.68
0.73
Diluted earnings per share
1.66
0.72
(in millions of €, earnings per share in €)
Revenue
Research and development expenses
Selling and general administrative expenses
Income (loss) from investments accounted for using the equity method, net
Other financial income (expenses), net
Attributable to:
Non-controlling interests
Shareholders of Siemens Energy AG
Siemens Energy – Half-year Financial Report 2026
Half-year Consolidated Financial Statements
3.2 Consolidated Statements of Comprehensive
Income
First half
(in millions of €)
FY 2026
FY 2025
Net income (loss)
1,581
753
16
61
(2)
(6)
Remeasurements of equity instruments
9
—
Income (loss) from investments accounted for using the equity method, net
0
(1)
Items that will not be reclassified to profit or loss
25
61
Currency translation differences
467
232
Derivative financial instruments
(68)
(10)
therein Income tax effects
18
7
0
(22)
Items that may be reclassified subsequently to profit or loss
399
200
Other comprehensive income (loss), net of income taxes
424
261
2,005
1,013
153
123
1,852
890
Remeasurements of defined benefit plans
therein Income tax effects
Income (loss) from investments accounted for using the equity method, net
Total comprehensive income (loss)
Attributable to:
Non-controlling interests
Shareholders of Siemens Energy AG
Siemens Energy – Half-year Financial Report 2026
18
19
Half-year Consolidated Financial Statements
3.3 Consolidated Statements of Financial Position
Mar 31, 2026
Sep 30, 2025
Cash and cash equivalents
11,695
9,162
Trade and other receivables
8,237
7,571
1,416
1,031
(in millions of €)
Note
Assets
Other financial assets
7
Contract assets
4,936
4,295
Inventories
11,407
10,377
Income tax assets
Other assets
Assets classified as held for disposal
2
406
418
1,356
1,212
—
386
39,452
34,453
Goodwill
9,222
9,037
Other intangible assets
2,457
2,450
Property, plant and equipment
7,439
7,140
Investments accounted for using the equity method
1,325
703
695
1,531
Deferred tax assets
845
904
Other assets
425
419
Total non-current assets
22,408
22,184
Total assets
61,861
56,637
1,240
1,528
6,356
5,993
Total current assets
Other financial assets
7
Liabilities and equity
Debt
3, 7
Trade and other payables
Other financial liabilities
7
1,041
782
Contract liabilities
27,045
22,321
Provisions
2,681
2,778
Income tax liabilities
Other liabilities
Liabilities associated with assets classified as held for disposal
2
Total current liabilities
Debt
3, 7
424
523
4,475
4,332
—
233
43,262
38,491
2,490
2,438
Provisions for pensions and similar obligations
414
406
Deferred tax liabilities
867
634
2,915
3,065
275
401
Provisions
Other financial liabilities
7
Other liabilities
Total non-current liabilities
Total liabilities
Equity
519
528
7,480
7,471
50,742
45,962
4
Issued capital
861
861
Capital reserve
14,445
14,465
Retained earnings
(3,098)
(3,990)
Other components of equity
(477)
(807)
Treasury shares, at cost
(981)
(228)
10,751
10,301
Total equity attributable to shareholders of Siemens Energy AG
367
375
Total equity
Non-controlling interests
11,118
10,675
Total liabilities and equity
61,861
56,637
Siemens Energy – Half-year Financial Report 2026
Half-year Consolidated Financial Statements
3.4 Consolidated Statements of Cash Flows
First half
FY 2026
FY 2025
1,581
753
Amortization, depreciation and impairments
771
1,001
Income tax expenses (benefits)
538
314
Interest (income) expenses, net
(52)
9
(Income) loss related to investing activities
42
(88)
Other non-cash (income) expenses
108
104
(in millions of €)
Cash flows from operating activities
Net income (loss)
Adjustments to reconcile net income (loss) to cash flows from operating activities
Change in operating net working capital
Contract assets
(570)
(64)
Inventories
(815)
(968)
Trade and other receivables
(532)
(212)
Trade and other payables
285
220
4,478
2,816
Change in other assets and liabilities
(483)
(518)
Income taxes paid
(321)
(245)
Dividends received
43
18
Interest received
160
122
5,234
3,261
Purchase of intangible assets and property, plant and equipment
(711)
(588)
Acquisitions of businesses, net of cash acquired
(95)
(67)
Purchase of investments and financial assets
(639)
(28)
Contract liabilities
Cash flows from operating activities
Cash flows from investing activities
Disposal of intangibles and property, plant and equipment
34
3
Disposal of businesses, net of cash disposed
72
127
Disposal of investments and financial assets
561
101
(778)
(453)
Purchase of treasury shares
(879)
—
Other transactions with non-controlling interests
(10)
1
Repayment of lease liabilities
(219)
(185)
Change in debt and other financing activities
(195)
164
Interest paid
(56)
(44)
Dividends paid to shareholders of Siemens Energy AG
(601)
—
Dividends attributable to non-controlling interests
(136)
(99)
(2,096)
(163)
Cash flows from investing activities
Cash flows from financing activities
Cash flows from financing activities
Effect of changes in exchange rates on cash and cash equivalents
86
(2)
2,446
2,642
Cash and cash equivalents at beginning of period
9,249
6,363
Cash and cash equivalents at end of period
11,695
9,005
Change in cash and cash equivalents
Less: Cash and cash equivalents of assets classified as held for disposal at end of period
Cash and cash equivalents at end of period (Consolidated Statements of Financial Position)
—
22
11,695
8,983
Siemens Energy – Half-year Financial Report 2026
20
21
Half-year Consolidated Financial Statements
3.5 Consolidated Statements of Changes in Equity
Total equity
attributable
Currency
(in millions of €)
Balance as of October 1, 2024
Derivative
Treasury
to shareholders
Issued
Capital
Retained
translation
Equity
financial
shares
of Siemens
Non-controlling
Total
capital
reserve
earnings
differences
instruments
instruments
at cost
Energy AG
interests
equity
799
14,512
(5,578)
(598)
—
84
(144)
9,075
289
9,364
Net income (loss)
—
—
632
—
—
—
—
632
121
753
Other comprehensive income (loss), net of income taxes
—
—
61
200
0
(2)
—
259
2
261
Total comprehensive income (loss)
—
—
692
200
0
(2)
—
890
123
1,013
Dividends
—
—
—
—
—
—
—
—
(84)
(84)
Share-based payment
—
150
(0)
—
—
—
—
150
—
150
Purchase of treasury shares
—
—
—
—
—
—
—
—
—
—
Re-issuance of treasury shares
—
(174)
89
—
—
—
85
—
—
—
Other transactions with non-controlling interests
—
—
5
—
—
—
—
5
(3)
1
Other changes in equity
—
—
(4)
(0)
—
—
—
(5)
(0)
(5)
Balance as of March 31, 2025
799
14,488
(4,797)
(399)
0
83
(60)
10,115
325
10,440
Balance as of October 1, 2025
861
14,465
(3,990)
(1,219)
65
347
(228)
10,301
375
10,675
Net income (loss)
—
—
1,443
—
—
—
—
1,443
138
1,581
Other comprehensive income (loss), net of income taxes
—
—
79
455
(54)
(70)
—
410
15
424
Total comprehensive income (loss)
—
—
1,522
455
(54)
(70)
—
1,852
153
2,005
Dividends
—
—
(601)
—
—
—
—
(601)
(148)
(749)
Share-based payment
—
194
(2)
—
—
—
—
193
—
193
Purchase of treasury shares
—
—
—
—
—
—
(995)
(995)
—
(995)
Re-issuance of treasury shares
—
(215)
(28)
—
—
—
242
—
—
—
Other transactions with non-controlling interests
—
—
7
—
—
—
—
7
(10)
(3)
Other changes in equity
Balance as of March 31, 2026
Siemens Energy – Half-year Financial Report 2026
—
—
(6)
—
—
—
—
(6)
(2)
(8)
861
14,445
(3,098)
(765)
11
277
(981)
10,751
367
11,118
Half-year Consolidated Financial Statements
3.6 Notes to Half-year Consolidated Financial
Statements
NOTE 1 Basis of presentation
The Half-year Consolidated Financial Statements as of March 31, 2026, present the operations of Siemens Energy AG with registered office at OttoHahn-Ring 6, 81739 Munich, Germany (registry number HRB 252581, Munich local court), and its subsidiaries.
The Half-year Consolidated Financial Statements are prepared in accordance with International Financial Reporting Standards (IFRS) applicable to
interim financial reporting, as applicable in the European Union (EU). The Half-year Consolidated Financial Statements should be read in
conjunction with the Siemens Energy Consolidated Financial Statements as of September 30, 2025. The results achieved during the interim
reporting period do not necessarily allow predictions about the future course of business.
The accounting and valuation methods applied in the Consolidated Half-year Financial Statements, including the underlying assumptions and
estimation uncertainties, essentially correspond to those used in the Consolidated Financial Statements for fiscal year 2025. Income tax expense
in the interim periods is calculated based on the currently expected effective tax rate of Siemens Energy for the full year.
The dynamic development of import tariffs worldwide persisted during the past half-year. In light of the ruling by the Supreme Court of the United
States on the unlawfulness of certain tariffs imposed on several countries, as well as potential subsequent actions by the U.S. government,
estimation uncertainties arise in accounting with respect to the recognition of potential refund claims for tariffs already paid to U.S. authorities, as
well as for tariffs contractually passed on to customers.
The Half-year Consolidated Financial Statements were prepared and published in millions of euros (€ million). Due to rounding, individual figures
may not add up exactly to the stated total. The Half-year Consolidated Financial Statements are unaudited. They were authorized for issue by the
Executive Board on April 30, 2026.
Siemens Energy, as a supplier of technology in the energy and electricity sector, is active along the entire energy technology and service value
chain with comprehensive and differentiated products, solutions and service offerings. It provides a portfolio in both conventional and renewable
energy along the entire energy value chain, from power generation to power transmission, complemented by a comprehensive set of training and
service offerings, aimed at both the public and private sector.
The reporting structure of Siemens Energy Group consists of the Business Areas Gas Services (GS), Grid Technologies (GT), Transformation of
Industry (TI) and our Wind Power business Siemens Gamesa (SG) and the Reconciliation to Consolidated Financial Statements. The Business Areas
GS, GT and SG represent reportable segments. The Business Area TI comprises four operating but non-reportable segments (Sustainable Energy
Systems; Electrification, Automation, Digitalization; Industrial Steam Turbines & Generators; Compression), which are presented voluntarily as if
they were a single reportable segment, despite some differences in its economic characteristics.
NOTE 2 Acquisitions and disposals
Acquisition of the remaining shares in RWG (Repair & Overhauls) Limited
On December 31, 2025, Siemens Energy acquired the remaining 50% of the shares in RWG (Repair & Overhauls) Limited (RWG), Aberdeen, United
Kingdom, from John Wood Group PLC, Aberdeen, United Kingdom, for a purchase price of €130 million, thereby gaining control of RWG and its
affiliated companies. The purchase price was recognized in full as a cash outflow. The 50% investment in RWG, which had previously been
accounted for using the equity method, was re-measured at fair value through profit or loss at the date control was obtained. The resulting gain
of €56 million was recognized in Income from investments accounted for using the equity method.
The assets and liabilities of RWG were included in the Consolidated Financial Statements at their fair values at the date control was obtained and
allocated to the GS segment. The following table summarizes the consideration transferred as well as the fair values of the assets and liabilities at
the date control was obtained, and the resultant goodwill on a preliminary basis.
Siemens Energy – Half-year Financial Report 2026
22
23
Half-year Consolidated Financial Statements
(in millions of €)
Consideration transferred
260
Cash and cash equivalents
36
Trade receivables and other assets
69
Inventories
95
Property, plant and equipment
41
Other intangible assets
30
Liabilities
(90)
Fair value of net assets
180
Goodwill
80
Allocated to GS segment
80
The purchase price allocation for this business combination has not been finalized as of the date of issuance of these Half-year Financial Statements.
The measurement of the assets and liabilities included in the Consolidated Financial Statements may be subject to change until the purchase price
allocation is finalized within the foreseen measurement period of up to one year under IFRS.
Sale of the Indian wind business
On December 1, 2025, Siemens Energy sold its Indian wind business, which was classified as “held for disposal” in the Annual Report for the fiscal
year 2025, to Vayona Energy Private Limited, formerly Peony Properties Private Limited, Mumbai, India, which is owned by a group of investors led
by TPG. The divested business includes the manufacturing, installation, and service of onshore wind turbines in India and Sri Lanka, which was
reported within the SG segment at Siemens Energy until its classification as “held for disposal”. The preliminary total consideration received was
€73 million, of which €38 million has been received to date as a cash inflow.
The sale of the disposal group resulted in an expense of €181 million in the reporting period, which was primarily attributable to the disposal
group’s accumulated foreign currency translation loss as of the date of sale, and was recognized in Other operating expenses. The disposed assets
amounted to €226 million and consisted primarily of Inventories of €77 million, Trade and other receivables of €46 million, Contract assets of
€41 million, and Cash and cash equivalents of €30 million. Disposed liabilities amounted to €151 million.
NOTE 3 Debt
Current debt
Non-current debt
Mar 31,
Sep 30,
Mar 31,
Sep 30,
(in millions of €)
2026
2025
2026
2025
Lease liabilities
419
394
1,735
1,691
Notes and bonds
810
778
748
747
Loans from banks
11
355
7
0
1,240
1,528
2,490
2,438
Total debt
Credit facilities and loans
As of March 31, 2026, and September 30, 2025, Siemens Energy had an unused €4,000 million syndicated revolving credit facility for general
corporate purposes. In the first half of fiscal year 2026, the second of two one-year extension options was exercised. The credit facility will now
mature in 2031.
Notes and bonds
Siemens Energy has a commercial paper program in place under which, as of March 31, 2026, and September 30, 2025, up to €3,000 million in
short-term debt instruments can be issued. As of March 31, 2026 and September 30, 2025, no commercial papers were outstanding.
Siemens Energy – Half-year Financial Report 2026
Half-year Consolidated Financial Statements
External credit rating
The Company’s credit rating for long-term debt was in the first half of fiscal year 2026 changed by Standard & Poor’s Global Ratings to BBB
(September 30, 2025: BBB-) and by Moody’s Investors Service to Baa1 (September 30, 2025: Baa2).
NOTE 4 Equity
Treasury shares
On March 4, 2026, Siemens Energy announced a share buyback program with a volume of up to €2,000 million, but no more than 70,000,000
shares, to be carried out until no later than September 30, 2026. The share buyback started on March 4, 2026 and has not yet been completed.
The following table presents the development of treasury shares:
First half
FY 2026
FY 2025
Balance at beginning of fiscal year
5,761
9,114
Share buyback
6,658
—
(4,644)
(5,341)
7,775
3,774
(in thousands of shares)
Issuance under share-based payment and employee share programs
Treasury shares, end of first half
NOTE 5 Commitments, contingent liabilities and contingent assets
The following table presents the undiscounted maximum amount for which Siemens Energy was liable under major types of guarantees as at the
balance sheet date:
Mar 31,
Sep 30,
(in millions of €)
2026
2025
Guarantees of third-party performance
267
83
Other guarantees
46
104
Total
313
188
Siemens Energy issues guarantees for third-party performance, which mainly include guarantees of advance payments and performance bonds in
consortium arrangements. In the event of a claim under the guarantees, Siemens Energy will be required to pay up to an agreed maximum amount.
These agreements typically have terms of up to ten years. Besides the guarantees issued by Siemens Energy during the periods presented,
Siemens Group has provided additional guarantees for the Siemens Energy business for which Siemens Group has a right of recourse against
Siemens Energy in case the guarantees are invoked.
In addition, Siemens Energy issued other guarantees. Those include, among others, indemnifications in connection with the disposal of businesses
which are included in the table above with the maximum future payments from these obligations to the extent that future claims are not considered
unlikely.
Moreover, Siemens Energy group companies act as partners in commercial partnerships, have equity capital contribution obligations in this
function and are jointly and severally liable for the commercial partnerships’ liabilities.
Besides that, some subsidiaries abroad have significant potential tax risks that were not recognized in the statement of financial position due to
insufficient probability of occurrence. The potential tax risks result from a large number of individual cases involving indirect and direct taxes. Taken
individually, the risks are not significant. In total, they amount to a mid three-digit million euro range. Contractual arrangements between
Siemens Group and Siemens Energy also include mutual compensation obligations for potential tax effects triggered by changes in the shareholder
structure of Siemens Energy. Depending on the time of occurrence of the changes as well as on the underlying valuations, this could lead to a cash
outflow.
Following the spin-off of the Indian energy business from Siemens Limited, Mumbai, India, and its transfer to Siemens Energy India Limited,
Mumbai, India, Siemens Energy is obligated, pursuant to an agreement entered into with the Siemens Group in November 2023, to exchange its
6% stake in Siemens Limited for an equity stake in Siemens Energy India Limited at the then applicable fair value in one or several transactions. The
first share swap was completed by Siemens Energy and the Siemens Group in December 2025 and took the form of reciprocal purchase and sale
Siemens Energy – Half-year Financial Report 2026
24
25
Half-year Consolidated Financial Statements
agreements. In this transaction, Siemens Energy acquired 5% of the shares in Siemens Energy India Limited and, in return, sold 5% of the shares in
Siemens Limited. The tax effects of the transaction were shared equally by both parties in accordance with the contractual agreement. A second
share swap, using the same exchange mechanism, is planned for the second half of the current fiscal year for the remaining 1% stake in Siemens
Limited. Siemens Energy is also obligated to acquire additional shares from the Siemens Group to reach a total stake of 51% in Siemens Energy
India Limited. The acquisition is expected to be completed in fiscal year 2028. If tax effects arise from further transactions, they will be shared
equally by both parties.
In light of the ruling by the Supreme Court of the United States on the unlawfulness of certain tariffs imposed on several countries, as of
March 31, 2026, contingent assets existed in a low to mid three-digit million € amount for the refund of tariffs already paid to U.S. authorities. As
Siemens Energy, where possible, contractually passed on these tariffs to customers, the majority of these contingent assets are accompanied by
corresponding contingent liabilities.
NOTE 6 Legal proceedings
As reported, it became known in 2017 that gas turbines for a Russian project were illegally brought to Crimea. In 2018, the Hamburg public
prosecutor's office initiated a criminal investigation inter alia against employees of Siemens Energy AG for violations of the German Foreign Trade
Act. In early 2024, the Hamburg public prosecutor's office brought charges against five individuals and at the same time requested a so-called
confiscation of proceeds of crime from third parties. The proceeding is not directed against Siemens Energy AG. In 2025, the Hamburg District
Court opened proceedings against two individuals in connection with the Crimea matter. On January 7, 2026, the Hamburg Regional Court
acquitted the two remaining defendants on all charges. The public prosecutor has filed an appeal against this decision.
NOTE 7 Financial instruments
The following table presents the fair values and the carrying amounts of financial assets and financial liabilities measured at (amortized) cost for
which the carrying amounts do not approximate fair value:
Mar 31, 2026
Sep 30, 2025
Carrying
Carrying
(in millions of €)
Fair value
amount
Fair value
amount
Notes and bonds
1,572
1,558
1,557
1,525
Loans from banks
17
18
355
355
Siemens Energy – Half-year Financial Report 2026
Half-year Consolidated Financial Statements
The following table allocates financial assets and financial liabilities measured at fair value to the three levels of the fair value hierarchy:
Mar 31, 2026
Level 1
Level 2
Level 3
Total
125
2,007
143
2,275
Cash equivalents measured at fair value through profit or loss¹
—
750
—
750
Equity instruments measured at fair value through profit or loss²
—
—
37
37
125
—
4
129
Debt instruments measured at fair value through profit or loss²
—
—
103
103
Derivative financial instruments²
—
1,257
—
1,257
thereof not designated in a hedge accounting relationship
(including embedded derivatives)
—
553
—
553
thereof in connection with cash flow hedges
—
704
—
704
—
792
—
792
thereof not designated in a hedge accounting relationship
(including embedded derivatives)
—
336
—
336
thereof in connection with cash flow hedges
—
457
—
457
(in millions of €)
Financial assets measured at fair value
Equity instruments measured at fair value through Other comprehensive income²
Financial liabilities measured at fair value – Derivative financial instruments³
¹
Reported in line item Cash and cash equivalents in the Consolidated Statement of Financial Position.
²
Reported in line item Other financial assets in the Consolidated Statement of Financial Position.
³
Reported in line item Other financial liabilities in the Consolidated Statement of Financial Position.
Cash equivalents include investments in money market funds. These investments are measured at fair value using net asset values (as provided by
the respective fund administrators), which are calculated based on observable inputs (Level 2).
Siemens Energy measures the fair values of derivative financial instruments in accordance with the specific type of instrument. The fair values of
foreign currency derivatives are based on forward exchange rates and yield curves (Level 2). Compensating effects from underlying transactions
(e.g., firm commitments and forecast transactions) are not taken into consideration. The fair values of equity and debt instruments measured at
fair value are estimated by discounting future cash flows using current market interest rates (Level 3).
The investment in Siemens Limited, Mumbai, India, is measured at fair value through other comprehensive income. Following the partial disposal
to Siemens Group in December 2025, the cumulative remeasurement gains of the sold shares amounting to €63 million, which had been
recognized in other comprehensive income, were reclassified to retained earnings. As of March 31, 2026, the remaining investment had a carrying
amount of €92 million.
Siemens Energy – Half-year Financial Report 2026
26
27
Half-year Consolidated Financial Statements
NOTE 8 Segment information
Orders
Revenue
Profit before Special Items
First half
First half
First half
Assets
Free cash flow
pre tax
Mar 31,
Sep 30,
First half
(in millions of €)
FY 2026
FY 2025
FY 2026
FY 2025
FY 2026
FY 2025
2026
2025
FY 2026
FY 2025
Gas Services
17,620
12,047
6,575
5,986
1,067
922
(1,491)
1,083
3,752
1,814
Grid Technologies
12,960
10,325
6,121
5,341
1,062
880
(1,851)
(386)
2,576
1,886
Transformation of Industry
2,833
3,017
2,724
2,748
325
312
1,865
1,689
140
458
Siemens Gamesa
2,402
3,311
4,881
5,124
(90)
(623)
16
(1,236)
(1,199)
(900)
Total segments
35,816
28,700
20,301
19,200
2,364
1,492
(1,461)
1,150
5,270
3,258
(458)
(599)
(332)
(296)
(41)
(105)
63,322
55,487
(426)
(340)
35,358
28,101
19,969
18,904
2,323
1,387
61,861
56,637
4,844
2,918
Reconciliation to
Consolidated Financial Statements
Siemens Energy
External revenue
Internal revenue
Purchase of intangible assets
and property, plant and
equipment
Amortization, depreciation and
impairment
First half
First half
First half
First half
Investments accounted for
using the equity method
FY 2026
FY 2025
FY 2026
FY 2025
FY 2026
FY 2025
FY 2026
FY 2025
Mar 31, 2026
Sep 30, 2025
Gas Services
6,467
5,909
108
77
119
98
97
89
602
600
Grid Technologies
5,978
5,179
143
162
133
70
55
44
79
72
Transformation of Industry
2,638
2,663
87
86
26
23
35
35
2
2
Siemens Gamesa
4,881
5,124
0
0
229
250
350
594
1
1
Total segments
19,963
18,875
338
325
508
440
536
762
685
675
6
29
(338)
(325)
203
148
235
239
640
28
19,969
18,904
—
—
711
588
771
1,001
1,325
703
(in millions of €)
Reconciliation to Consolidated Financial Statements
Siemens Energy
Siemens Energy – Half-year Financial Report 2026
Half-year Consolidated Financial Statements
Reconciliation to Consolidated Financial Statements
Profit
First half
FY 2026
FY 2025
Profit before Special items Total segments
2,364
1,492
Reconciliation to Profit of Siemens Energy
(41)
(105)
Siemens Energy Profit before Special items
2,323
1,387
Special items
(207)
(309)
Siemens Energy Profit
2,116
1,077
(92)
(121)
94
111
Income (loss) before income taxes
2,119
1,067
Income tax (expenses) benefits
(538)
(314)
Net income (loss) after taxes
1,581
753
Mar 31,
Sep 30,
2026
2025
Tax-related assets
1,251
1,322
Liability-based adjustments
44,281
39,079
Eliminations, Treasury and other central items
17,789
15,086
Reconciliation to Consolidated Financial Statements
63,322
55,487
(in millions of €)
Amortization of intangible assets acquired in
business combinations and goodwill impairments
Financial result
Assets
(in millions of €)
Asset-based adjustments:
Disaggregation of external revenue of Segments
First half
(in millions of €)
FY 2026
FY 2025
Siemens Energy New Units
13,448
12,131
Gas Services
2,592
1,790
Grid Technologies
5,669
4,869
Transformation of Industry
1,505
1,486
Siemens Gamesa
3,683
3,986
Siemens Energy Service
6,515
6,743
3,875
4,120
309
310
Transformation of Industry
1,133
1,176
Siemens Gamesa
1,198
1,138
therein
therein
Gas Services
Grid Technologies
Siemens Energy – Half-year Financial Report 2026
28
29
Half-year Consolidated Financial Statements
NOTE 9 Related party transactions
In the ordinary course of business Siemens Energy has relationships with joint ventures and associates, whereby Siemens Energy buys and sells a
variety of products and services generally on arm’s length terms.
Sales of goods and services
and other income
Purchases of goods and services and other expenses
First half
First half
Receivables and
contract assets
Payables and
contract liabilities
FY 2026
FY 2025
FY 2026
FY 2025
Mar 31, 2026
Sep 30, 2025
Mar 31, 2026
Sep 30, 2025
Siemens Energy joint ventures
31
63
2
62
—
14
—
19
Siemens Energy associates
75
53
20
93
66
85
85
88
Total
106
116
22
155
66
99
85
107
(in millions of €)
Siemens Energy issued guarantees for joint ventures and associates amounting to €2 million as of March 31, 2026
(September 30, 2025: €45 million). Commitments to make capital contributions to associated companies amounted to €1 million as of
March 31, 2026 (September 30, 2025: €17 million).
Siemens Energy – Half-year Financial Report 2026
Additional information
4
31
Additional information
4.1 Responsibility Statement
To the best of our knowledge, and in accordance with the applicable reporting principles, for half-year reporting, the condensed Half-year
Consolidated Financial Statements give a true and fair view of the assets, liabilities, financial position, and profit or loss of the Group, and the
Interim Group Management Report, includes a fair review of the development and performance of the business and the position of the Group,
together with a description of the material opportunities and risks associated with the expected development of the Group for the remaining
months of the fiscal year.
Munich, April 30, 2026
Siemens Energy AG
The Executive Board
Christian Bruch
Maria Ferraro
Karim Ahmed Amin Aly Khalil
Tim Holt
Anne-Laure Parrical de Chammard
Vinod Philip
Siemens Energy – Half-year Financial Report 2026
Additional information
4.2 Review Report
To Siemens Energy AG, Munich
We have reviewed the condensed interim consolidated financial statements – comprising the consolidated statements of income, comprehensive
income, financial position, cash flows, changes in equity and notes to half-year consolidated financial statements – and the interim group
management report of Siemens Energy AG, Munich, for the period from October 1, 2025 to March 31, 2026 that are part of the half-year financial
report according to § 115 WpHG [“Wertpapierhandelsgesetz“: “German Securities Trading Act“]. The preparation of the condensed interim
consolidated financial statements in accordance with International Accounting Standard IAS 34 “Interim Financial Reporting” as adopted by the EU,
and of the interim group management report in accordance with the requirements of the WpHG applicable to interim group management reports,
is the responsibility of the Company’s management. Our responsibility is to issue a report on the condensed interim consolidated financial
statements and on the interim group management report based on our review.
We performed our review of the condensed interim consolidated financial statements and the interim group management report in accordance
with the German generally accepted standards for the review of financial statements promulgated by the Institut der Wirtschaftsprüfer (IDW) and
in supplementary compliance with the International Standard on Review Engagements 2410 “Review of Interim Financial Information Performed
by the Independent Auditor of the Entity” (ISRE 2410). Those standards require that we plan and perform the review so that we can preclude
through critical evaluation, with a certain level of assurance, that the condensed interim consolidated financial statements have not been prepared,
in material respects, in accordance with IAS 34 “Interim Financial Reporting” as adopted by the EU, and that the interim group management report
has not been prepared, in material respects, in accordance with the requirements of the WpHG applicable to interim group management reports.
A review is limited primarily to inquiries of company employees and analytical assessments and therefore does not provide the assurance attainable
in a financial statement audit. Since, in accordance with our engagement, we have not performed a financial statement audit, we cannot issue an
auditor’s report.
Based on our review, no matters have come to our attention that cause us to presume that the condensed interim consolidated financial statements
have not been prepared, in material respects, in accordance with IAS 34 “Interim Financial Reporting” as adopted by the EU, or that the interim
group management report has not been prepared, in material respects, in accordance with the requirements of the WpHG applicable to interim
group management reports.
Munich, April 30, 2026
KPMG AG
Wirtschaftsprüfungsgesellschaft
[Original German version signed by:]
Dr. Dietz
Schmitt
Wirtschaftsprüferin
Wirtschaftsprüfer
[German Public Auditor]
[German Public Auditor]
Siemens Energy – Half-year Financial Report 2026
32
Published by
Siemens Energy AG
Otto-Hahn-Ring 6
81739 München
Germany
Media Relations: [email protected]
Investor Relations: [email protected]
siemens-energy.com
© Siemens Energy, 2026
Siemens Energy is a trademark licensed by Siemens AG.