GROUPE DYNAMITE REPORTS STRONG SECOND QUARTER FISCAL 2026 RESULTS
AS BRAND HEAT AND TOP-TIER LOCATIONS CONTINUE TO DRIVE GROWTH
Delivered comparable store sales growth
(1)
of 10.3%, or 12.3% in constant currency
(1)
, representing a two-
year comparable stack of 38.9% compared with 35.6% in Q1 2026, and total revenue growth of 29.8%
Expanded gross margin
(1)(2)
to 68.8%, up 520 bps year-over-year, reflecting the lapping of prior-year tariƯ
impacts and logistics eƯiciencies from the Company’s US distribution center
Delivered adjusted EBITDA margin
(1)(2)
of 44.3%, our highest since we began reporting under IFRS, and
adjusted diluted EPS growth of 68.7%, supported by a 210 bps improvement in adjusted SG&A margin
(1)
as
revenue scaled
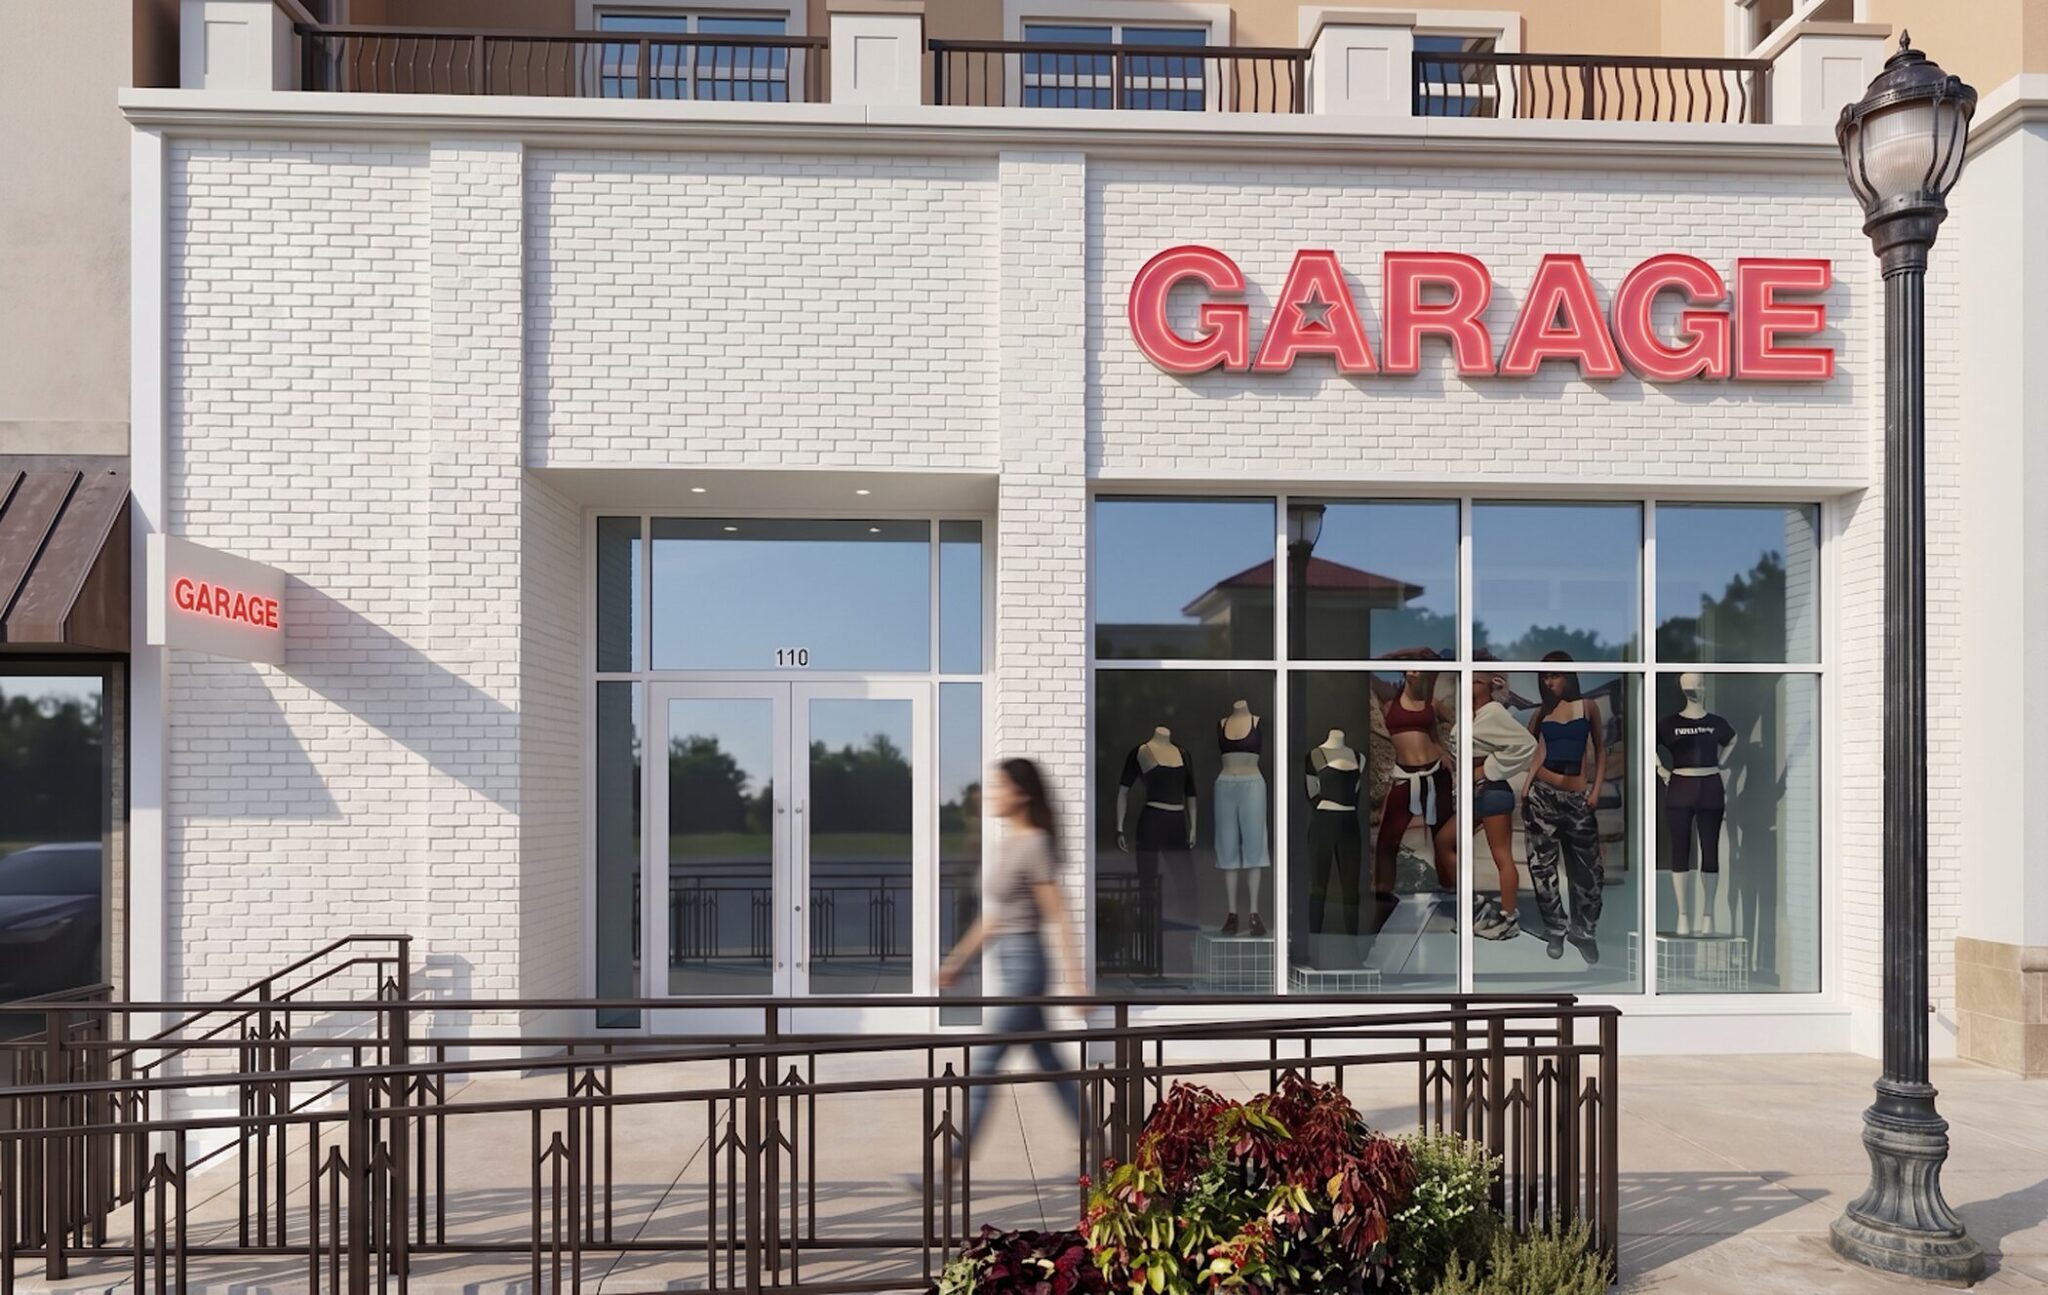
Opened 7 GARAGE stores, 6 in the United States and 1 in the United Kingdom, all in investment-grade
locations. Retail sales per square foot
(1)
for the chain up 28.9% to $1,056.
Raised Fiscal 2026 guidance: comparable store sales growth to 12% to 14%, total revenue growth to 25%
to 27% and adjusted EBITDA margin to 39.5% to 40.5%
Montréal, Québec, Canada – September 10, 2026 – Groupe Dynamite Inc. (“Groupe Dynamite” or
the “Company”) (TSX: GRGD) today reported its financial results for the fiscal year 2026’s second quarter
ended August 1, 2026.
“Our second quarter results demonstrate the strength of our luxury-inspired operating model and our ability to
continue delivering profitable growth. Comparable store sales grew 10.3%, total revenue increased 29.8%,
gross margin expanded to 68.8% and adjusted EBITDA margin reached 44.3%, in all cases excluding the impact
of duty refunds. The continued expansion of gross margin and adjusted EBITDA demonstrates that the
economics of our model are strengthening as we scale. We have built highly coveted global brands with
exceptional unit economics, disciplined inventory management and attractive returns on capital, supported
by a growth engine we have engineered over decades that continues to generate profitable growth. We remain
focused on creating long-term value as we scale Groupe Dynamite with discipline,” said Andrew Lutfy, Chief
Executive OƯicer and Chair of the Board.
“Q2 demonstrated the agility of our operating model and the strength of our execution. Combined with strong
brand heat across GARAGE and DYNAMITE, this helped us build momentum throughout the quarter and deliver
strong sales performance. Early in the quarter, we identified an opportunity to accelerate newness within our
assortments, and the speed of our luxury-inspired model allowed us to respond quickly and make targeted in-
season adjustments. This enabled us to deliver products that resonated strongly with our customers and
reinforced their connection with our brands. That customer response is translating into increasing productivity
across our store network, with sales per square foot continuing to improve as we optimize our fleet and elevate
the in-store experience. At the same time, we are strengthening the infrastructure supporting our growth, with
our U.S. distribution center delivering greater eƯiciency as we scale. We continue to expand our presence
Page | 2
across the United States and internationally, including the UK, and are extending our reach through shipping to
nine additional countries,” added Stacie Beaver, President and Chief Operating OƯicer.
Fiscal 2026 Second Quarter Highlights
Revenue increased by 29.8% to $423.6 million in Q2 2026
(3)
, compared to $326.4 million in Q2 2025
(3)
.
Comparable store sales growth of 10.3% (12.3% on a constant currency basis
(1)
) in Q2 2026, compared to
comparable store sales growth of 28.6% (25.7% on a constant currency basis) in Q2 2025.
Retail sales per square foot increased by 28.9% compared to Q2 2025, reaching $1,056 in Q2 2026.
Gross margin expanded by 520 basis points to 68.8% in Q2 2026 compared to 63.6% in Q2 2025.
SG&A increased to $106.8 million in Q2 2026, compared to $87.7 million in Q2 2025, and adjusted SG&A as
a percentage of sales
(1)
decreased by 210 basis points to 24.6% from 26.7% over the same period in Q2
Operating income increased by 60.5% to $156.2 million in Q2 2026, compared to $97.3 million in Q2 2025.
Adjusted EBITDA
(1)
increased by 55.9% to $187.9 million in Q2 2026, representing an adjusted EBITDA
margin of 44.3%, compared to 36.9% for the same period in Q2 2025.
Diluted net earnings per share increased to $1.00 in Q2 2026, compared to $0.56 in Q2 2025 and adjusted
diluted net earnings per share
(1)
increased by 68.7% to $0.96 in Q2 2026, compared to $0.57 in Q2 2025.
Real estate activity for Q2 2026 includes:
o Opening of 7 new stores: 6 in the United States and 1 in the United Kingdom, both under the GARAGE
banner.
o Renovation or relocation of stores: 4 in Canada and 3 in the United States, both under the GARAGE
banner.
o 7 store closures: 6 in Canada, including 4 under the GARAGE banner and 2 under the DYNAMITE
banner, and 1 in the United States under the DYNAMITE banner.
Ratios and Recent Developments
Inventory turnover
(1)
improved to 7.72x in Q2 2026, compared to 7.25x in Q2 2025.
Net leverage ratio
(1)
was 0.89x in Q2 2026, up from 0.79x in Q2 2025.
Return on assets (“ROA”)
(1)
improved to 38.9% in Q2 2026, compared to 24.1% in Q2 2025.
Return on capital employed (“ROCE”)
(1)
reached 73.5% in Q2 2026, compared to 45.0% in Q2 2025.
During the quarter, the Company repurchased 993,605 shares at an average price of $63.50 for a total of
approximately $63.1 million.
Notes:
(1) Refer to “Non-IFRS Measures including Non-IFRS Financial Measures, Non-IFRS Ratios, Supplementary Financial Measures and Retail Industry Metrics” section of this press release
for further details concerning these measures including definitions and reconciliations of each non-IFRS financial measure to the relevant reported IFRS financial measure. Non-
IFRS financial measures and non-IFRS ratios do not have a standardized meaning under IFRS
Accounting Standards, as issued by the International Accounting Standards Board
(IASB) (“IFRS Accounting Standards”) which are used to prepare the Company's financial statements and might not be comparable to similar financial measures presented by other
entities.
(2) Excludes any impact from the recovery of tariƯ refund claims.
(3) All references to “Q2 2026” are to the Company’s 13-week period ended August 1, 2026, to “Q2 2025” are to the Company’s 13-week period ended August 2, 2025; to “Fiscal 2026”
are to the Company’s fiscal year ending January 30, 2027: to “Fiscal 2025” are to the Company’s fiscal year ended January 31, 2026.
Page | 3
Outlook
The table below outlines the Company’s revised financial annual guidance ranges for Fiscal 2026 replacing
our previously disclosed guidance:
Our achievement of these targets is subject to several risks and uncertainties, including the following:
(1)
Adverse eƯects from future policy or legislative changes, tariƯs (in addition to those currently in place) that
may be imposed by the United States, or retaliatory tariƯs from other countries and the United States.
Failing to successfully locate our stores in suitable locations and any impairment of a store location,
including any decrease in customer traƯic.
Failing to negotiate lease agreements for the store pipeline for Fiscal 2026, along with the risk of delays in
construction activities beyond our control, and substantial increases in occupancy costs.
Failing to successfully open and operate new stores in the United Kingdom.
Failing to complete the renovations and relocations scheduled for Fiscal 2026, which is expected to be
between approximately 10 to 15.
Achieving guidance numbers of comparable store sales or retail sales per square foot.
Disruption of our strategic relationships with suppliers, impairing open-to-buy visibility.
Failing to optimize merchandise, anticipate and respond to constantly changing consumer demands and
fashion trends.
Failing to protect and enhance our brands.
Failing to attract new customers, or retain existing customers, or to maintain or increase sales to those
customers.
Failing to actively manage product margins, including the implementation of eƯective pricing strategies.
Obstacles to the ongoing implementation of in-store productivity initiatives and the achievement of cost
savings intended to improve operating expenses.
Any material disruption in our information technology systems and e-commerce business.
The occurrence of unusually adverse weather, particularly during peak seasons.
Adverse changes in the general economic conditions and consumer spending in Canada, the United States
and other parts of the world.
Note:
(1)
The guidance ranges included in this section are forward-looking statements within the meaning of applicable securities laws, are based on assumptions that we believe
to be reasonable and are subject to several risks and uncertainties, including the risks and uncertainties set forth above as well as those incorporated by reference in the
“Forward-Looking Statements” section of this press release.
(2)
Beginning with Q2 2026, the Company has revised the presentation of its real estate activity outlook to report new store openings only, in order to provide greater visibility
into the pace of the Company’s store expansion activity, independently of store closures. This change in presentation does not reflect a change in the Company’s
underlying store opening or closure expectations. The previously disclosed outlook for net new store openings reflected expected gross new store openings, net of
anticipated store closures. On a comparable basis, the Company’s previously disclosed outlook remains unchanged, with 24 to 26 gross new store openings and 16
anticipated store closures, resulting in 8 to 10 net new store openings.
Revised Fiscal 2026 Guidance Prior Fiscal 2026 Guidance
Real estate activity
2
24 to 26 new store openings 24 to 26 new store openings
Comparable store sales
growth
↑12.0% to 14.0%
11.0% to 14.0%
Total revenue growth ↑ 25.0% to 27.0% 22.0% to 25.0%
Adjusted EBITDA margin ↑ 39.50% to 40.50% 38.25% to 39.50%
CAPEX $100.0 to $110.0 million $100.0 to $110.0 million
Page | 4
Recent events
On September 9, 2026, the Second Amended and Restated Credit Agreement was further amended,
extending the maturity date by two years to May 10, 2030.
Second Quarter Fiscal 2026 Financial Results
Revenue
Total revenue for Q2 2026 increased by $97.2 million or 29.8% compared to Q2 2025. This growth was due to a
10.3% increase in comparable store sales (12.3% on a constant currency basis) and contributions from new
stores. Online revenue for Q2 2026 was $61.4 million, representing an increase of $14.7 million or 31.5%
compared to Q2 2025.
Cost of sales and gross profit
Gross profit for Q2 2026 increased by $84.1 million or 40.5% compared to Q2 2025, with gross margin
increasing by 520 basis points to 68.8%. This increase is attributable to the 29.8% revenue growth compared
to the relatively lower increase in cost of sales of 11.1% which is due to lower tariƯs, controlled merchandise
cost increases and lower logistics costs.
Selling, general and administrative expenses
SG&A for Q2 2026 increased by $19.1 million or 21.8% compared to Q2 2025. This increase was primarily driven
by the Company’s growing scale and activities, leading to a $11.7 million increase in wages and salaries,
including share-based compensation and their related benefits. Selling and marketing expenses increased by
$4.8 million compared to Q2 2025, due to higher investment to support business growth. Administrative
expenses also increased by $2.6 million compared to Q2 2025, reflecting higher operating costs, particularly
related to investments in information technology and software. As a percentage of sales, SG&A decreased by
170 basis points from 26.9% in Q2 2025 to 25.2% in Q2 2026.
Operating income and adjusted EBITDA
Operating income for Q2 2026 increased by $58.9 million or 60.5% to reach $156.2 million compared to $97.3
million in Q2 2025. Similarly, adjusted EBITDA for Q2 2026 increased by $67.4 million or 55.9% to reach $187.9
million compared to $120.5 million in Q2 2025. The adjusted EBITDA margin improved by 740 basis points to
44.3% compared to 36.9% in Q2 2025. This performance results from the combination of both a 520 basis
points improvement in gross margin and a reduction of 210 basis points in adjusted SG&A as a percentage of
sales, which decreased to 24.6% in Q2 2026 from 26.7% in Q2 2025.
Net earnings and adjusted net earnings
Net earnings for Q2 2026 increased by $49.5 million or 77.5% compared to Q2 2025. This growth was mainly
driven by higher revenue, which led to increased gross profit, partially oƯset by higher SG&A and increased
depreciation and amortization. Net earnings also benefited from a $9.4 million recovery of tariƯ refund claims
related to International Emergency Economic Powers Act ("IEEPA") tariƯ refunds under U.S. Customs and
Border Protection's ("CBP") refund process. Adjusted net earnings
(1)
for Q2 2026, which exclude the after-tax
impact of the $9.4 million recovery related to tariƯ refund claims, increased by $44.1 million or 68.1%
compared to Q2 2025.
Working capital
As of August 1, 2026, we have maintained a strong inventory turnover ratio of 7.72x, compared to 7.25x as of
August 2, 2025, with current assets of $203.5 million (including $31.9 million in cash) and current liabilities of
$287.7 million. Inventory continues to be minimized through agile product development and strategic sourcing,
driven by our high open-to-buy ratio.
Page | 5
Free cash flow
Free cash flow for Q2 2026 increased by $36.9 million to $109.5 million, up from $72.6 million in Q2 2025. This
increase was due to higher net earnings, partially oƯset by a $15.6 million increase in CAPEX.
Net leverage ratio
The Company’s net leverage ratio increased to 0.89x compared to 0.79x last year. This increase is primarily due
to higher net debt, partially oƯset by higher adjusted EBITDA. At the end of Q2 2026, the Company has
approximately $31.9 million in cash and a $312.0 million credit facility, providing flexibility to drive growth,
invest in strategic initiatives, manage market volatility and return excess cash to shareholders.
Return metrics
ROA of 38.9% for Q2 2026 has increased from the ROA of 24.1% for Q2 2025. This improvement indicates a
significant boost in the Company’s ability to leverage its assets more eƯectively than in previous periods.
For Q2 2026, our ROCE reached 73.5%, compared to 45.0% in Q2 2025, highlighting the eƯectiveness of our
recent strategies and investments. The slower growth of average capital employed compared to adjusted