September 2026 VGP in full How our business creates value, generates cash and builds recurring income Inter Cars, VGP Park Brașov, Romania AT 30 JUNE 2026 €9.2bn gross asset value portfolio including joint ventures at 100%; €6.1bn at VGP’s…
September 2026
VGP in full
How our business creates value, generates cash and builds recurring income
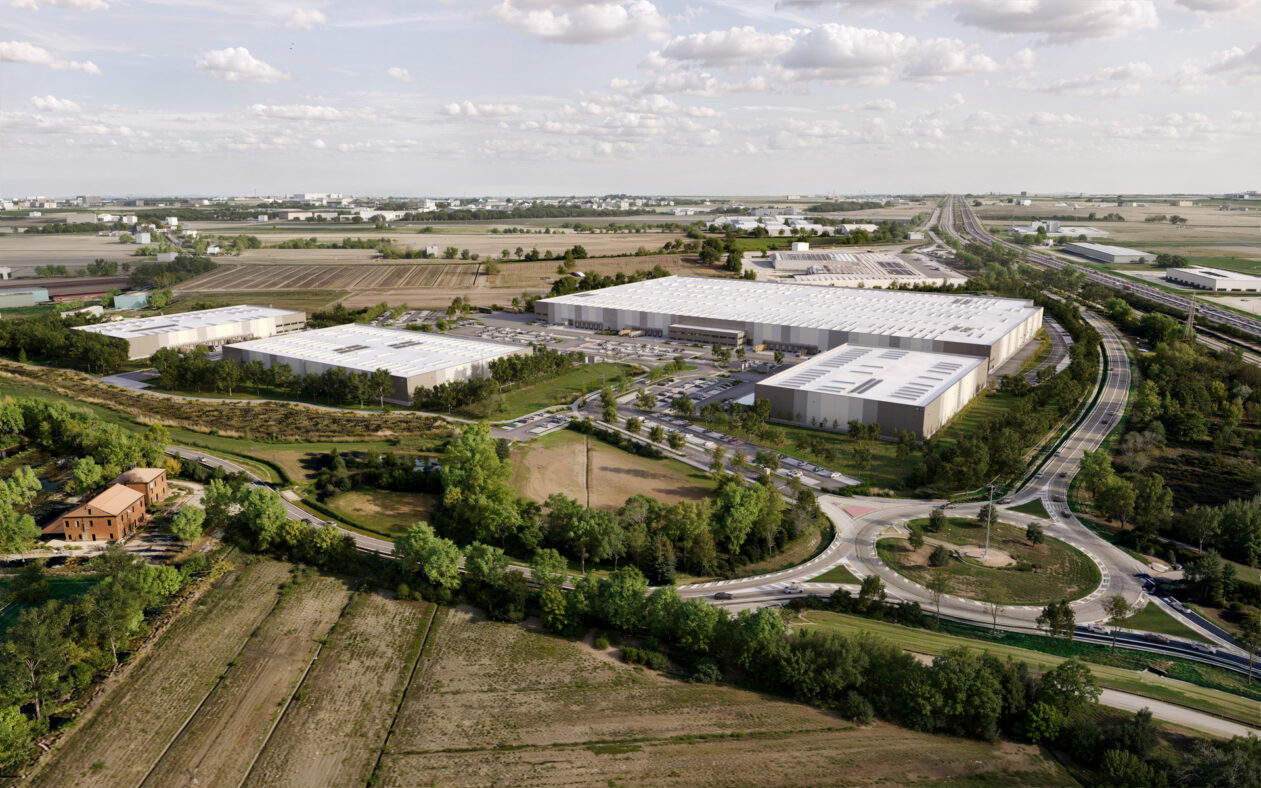
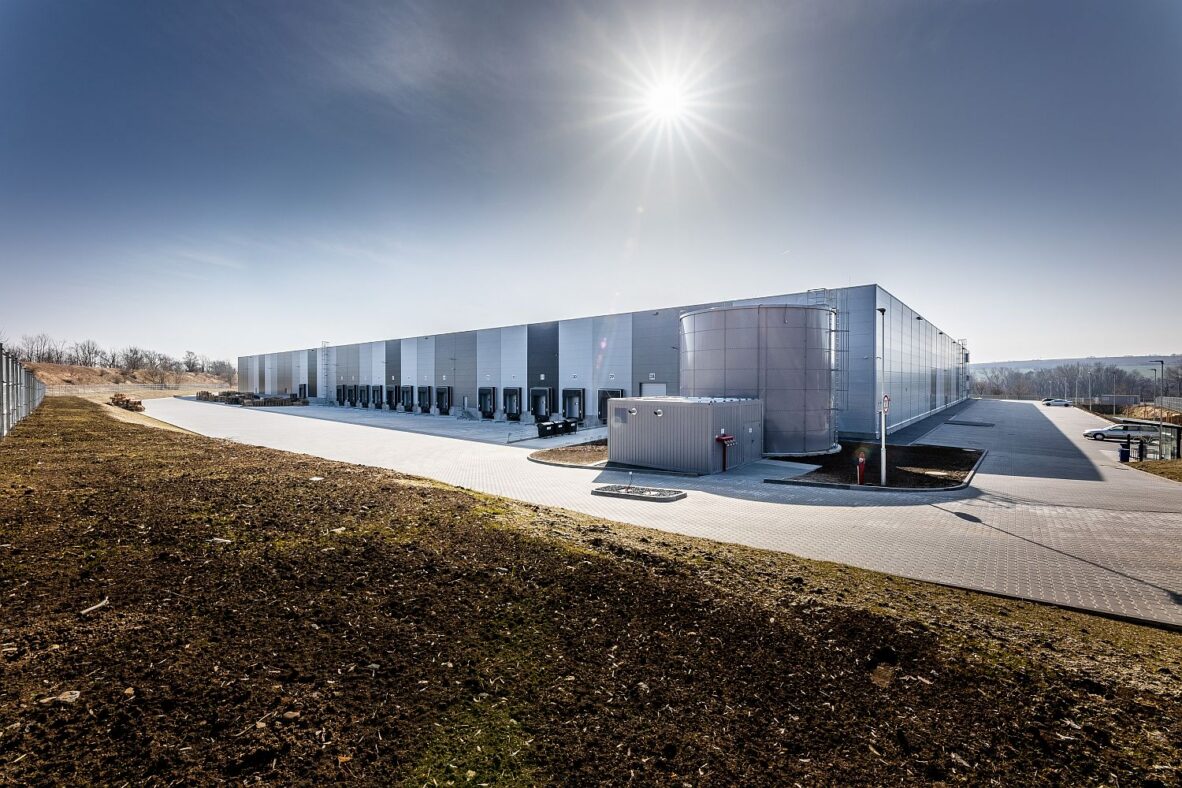
Inter Cars, VGP Park Brașov, Romania
AT 30 JUNE 2026
€9.2bn
gross asset value
portfolio including joint ventures at 100%; €6.1bn at VGP’s
proportional share
€489m
committed annualised rent
joint ventures at 100%; €327m at share; €420m already cash
generative
€455m
EBITDA, full year 2025
UNDERSTAND VGP
How VGP creates value
VGP buys land, designs and builds for a tenant, lets the building and keeps it — in its own portfolio or in
a joint venture in which it typically holds 50% and which it continues to manage. Rooftop solar and
storage stay with VGP.
segment EBITDA, an alternative performance measure;
€255m from Investment and Renewable Energy (H1 2026:
€186m)
€2.9bn
shareholders’ equity
IFRS consolidated; +10.5% since December after €247m net
equity raised
THREE BUSINESS LINES
VGP Park Timișoara, Romania — aerial photograph
Property Development builds it. Investment owns and
manages it. Renewable Energy powers it — page 6.
2
UNDERSTAND VGP
What this presentation explains
One development, followed from land to recurring income, and what each step does to VGP’s accounts.
Land
Build
Let
Value
Transfer
Own & manage
1
2
3
4
5
6
bought or committed; permits
subject to zoning
designed and built in house, for
a tenant
long-term lease; rent starts on
hand-over
fair value replaces cost as the
building progresses
completed building into a JV;
cash back to VGP
50% of results, fees, energy
income
PROPERTY DEVELOPMENT · value created through construction and letting
INVESTMENT · rent, fees, JV results
RENEWABLE ENERGY runs alongside every stage: solar, storage and EV charging on VGP’s roofs and land
1
When does a development become
profit?
Fair value is recognised during construction and
letting — before any sale. Pages 9–11.
2
How does a building become cash
again?
A completed building is transferred into a joint
venture; bank debt and the partner pay VGP out
while VGP keeps 50%. Pages 12–17.
Results and cash flows are full-year 2025; portfolio, balance-sheet and headcount positions are at 30 June 2026. Every figure carries its basis.
3
What does VGP earn afterwards?
Its share of the JV result, management fees,
shareholder-loan interest and distributions — and
the energy income, which never left. Pages 18–21.
VGP in full · September 2026 · 3
UNDERSTAND VGP
Who the tenants are
Half the rent comes from logistics, a third from light industry, a fifth from e-commerce; the ten largest tenants pay 29% on a 10-year term.
TEN LARGEST TENANTS · SHARE OF COMMITTED RENT · 30 JUN 2026
KraussMaffei
5.7%
Opel
3.9%
Rhenus
3.2%
Zalando
3.0%
REWE
2.1%
Ahold Delhaize
1.9%
Drylock Technologies
1.9%
Siemens
Logistics
49.2%
4.9%
Amazon
Isar Aerospace
ALL LEASES BY TENANT SEGMENT · SHARE OF €488.9m COMMITTED RENT · 30 JUN 2026
1.6%
1.2%
Together €143.6m, 29.4% of rent, across light industrial, e-commerce and logistics; 59
lease units in 7 countries; 10.1-year weighted remaining term.
Light industrial
30.0%
E-commerce
Other
18.7%
2.0%
Logistics €240.7m · Light industrial €146.8m · E-commerce €91.3m · Other €10.1m
7.7 yrs
98%
+14%
weighted average lease term occupancy of the completed rent uplift on re-letting
portfolio
30 June 2026; 9.5 years own
portfolio, 6.8 years joint ventures
30 June 2026; 6.6m m², average
building age 5.1 years
full year 2025, versus the
previous rent in the same location
VGP in full · September 2026 · 4
UNDERSTAND VGP
Every step of the chain is carried out in house
VGP Park under construction — precast frame, VGP as general contractor (photograph from the Capital Markets Day 2026 material).
01
02
03
04
05
06
Land
Concept & design
Construction
Leasing
Portfolio management
Energy
Site search, technical, legal
and environmental due
diligence; zoning and permits;
brownfield remediation.
In-house architects design to
VGP’s building standard,
adapted to the tenant’s
process.
VGP acts as general contractor
on a significant part of the
pipeline, to its Considerate
Construction Charter.
Country teams let directly to
tenants, mainly on long-term
contracts, and follow them to
hand-over.
Property, facility and asset
management for the own
portfolio and for every joint
venture.
Rooftop solar, batteries and EV
charging built into the park;
VGP acts as energy supplier
where the arrangement allows.
452 full-time employees at 30 June 2026, 18 countries.
VGP in full · September 2026 · 5
UNDERSTAND VGP
Three business lines, three kinds of income
Segment EBITDA, 2025 against 2024, € million. Development moves with valuations and closings; Investment and Renewable Energy recur.
INVESTMENT · €249.0m
Net rental income on the own completed portfolio (€81.9m); joint-venture fee income
(€52.1m, including the €18.4m Rheingold promote provision); VGP’s share of the joint
ventures’ EBITDA excluding revaluations (€122.9m); 15% of administration costs.
249.0
204.3
199.3
PROPERTY DEVELOPMENT · €199.3m
144.8
Net valuation gains on investment property (€243.6m: €183.1m unrealised on the own
portfolio, €60.5m realised on the Saga closing and settlements with the Deka, Ymir
and Saga joint ventures); about 80% of administration costs.
5.4
Investment
Property Development
FY 2024
6.5
Renewable Energy
RENEWABLE ENERGY · €6.5m
Electricity sales, incentives and roof-space income (€12.3m gross) less direct costs
and roof rent paid to other VGP entities; about 5% of administration costs. Production
sold 132 GWh, +47%.
FY 2025
Total EBITDA €454.7m in 2025 (2024: €354.5m, +28%). Investment and Renewable Energy together rose 22% to €255.4m; Development rose on the December Saga closing and higher
unrealised gains.
VGP in full · September 2026 · 6
FOLLOW ONE PROPERTY
ONE PROPERTY, ILLUSTRATIVE FIGURES
VGP Park X
THE NUMBERS ARE SIMPLIFIED
Before taxes, transaction costs and other
adjustments
Equity-funded at VGP level: no VGP
borrowing in the example
€100 of land and construction cost, funded with equity. €130 of value once complete
and fully let. €6.5 of annual rent. Transferred into a 50:50 joint venture. The same
building and the same numbers on every page of this chapter.
Yields and rates are illustrative and labelled
where used
VGP in full · September 2026 · 7
FOLLOW ONE PROPERTY · INVESTMENT
€100 goes in: land, permits and construction
HOW IT IS FUNDED IN THE EXAMPLE
VGP shareholders’ equity €100
VGP Park X · investment property under
construction €100
In reality VGP funds construction from a mix of bonds, bank lines,
equity and recycled cash; the example keeps VGP debt-free so
that the closing mechanics are not blurred by financing costs.
€100
invested by VGP
WHAT THE ACCOUNTS SHOW
Cost is capitalised into investment property under construction;
it is an investing cash outflow, not an expense. No rent yet.
Construction phase — VGP Park Rüsselsheim, Green Campus Offices
Group actuals, full year 2025: capex on investment property €660.1m — €491.6m construction, €148.9m land acquisitions, €19.5m capitalised interest and rent-free incentives.
VGP in full · September 2026 · 8
FOLLOW ONE PROPERTY · VALUATION
From €100 cost to €130 value
UNDER CONSTRUCTION · WHAT VGP PAID
COMPLETE AND FULLY LET · WHAT THE VALUER SAYS IT IS WORTH
€100
€130
land, permitting and construction cost, capitalised as
the building goes up
€30 valuation gain. No cash received.
Valuation gains are recognised during development. The €130 shown represents the completed and fully
leased property value; part of the €30 is recognised earlier as construction and letting progress (page 10).
None of it is cash until a closing pays for it.
independent appraisal of the completed, fully leased
property
HOW €130 IS ARRIVED AT
€6.5 annual rent ÷ 5.0% valuation yield = €130
A simplified capitalisation. The valuer applies the yield the market pays for a
let building of this type; during construction, the cost still to complete and a
letting allowance are deducted from that end value.
Illustrative photographs: construction and a completed park are different VGP properties. Yield on cost 6.5%; valuation yield 5.0%. Appraisals by independent valuers (IO Partners), semiannually.
VGP in full · September 2026 · 9
FOLLOW ONE PROPERTY · VALUATION
When the €30 is recognised
Fair value replaces cost at the first valuation after construction starts, and moves towards €130 as the building progresses and lets.
WHAT MOVES THE LINE
140
A signed pre-let, construction progress and a lower cost to
complete raise the fair value; the gap between the two lines
is the cumulative gain booked to date in the Development
segment.
120
100
80
WHAT DOES NOT MOVE
60
Cash. Every point on the green line above the tan line is
profit without a receipt. The gap closes only at the closing
(page 12).
40
20
WHY THE END-POINT IS €130
0
Land bought
Permit, construction
start
First valuation
Cost incurred
Mid-construction
Practical
completion
Fully let
€6.5 of rent capitalised at 5.0% — the completed, fully let
value on the previous page.
Carrying value (fair value)
€ — VGP Park X, illustrative path
Illustration; the path between first valuation and completion depends on progress, pre-letting, cost to complete and valuer assumptions. Group actual, full year 2025: €183.1m of unrealised
valuation gains on the own portfolio; own portfolio valued at a 7.48% weighted average yield.
VGP in full · September 2026 · 10
FOLLOW ONE PROPERTY · COMPLETION
Rent starts at hand-over — before any closing
VGP PARK X WHILE VGP OWNS 100% · € A YEAR
Gross rental income
6.5
Property operating costs, net of recharges
(0.1)
Net rental income (Investment segment)
6.4
Interest at VGP level
€6.5
a year, from the day the tenant moves in
VGP Park Timișoara, Romania
— equity-funded in the
example
The rent is fully consolidated in gross rental income for as long as VGP
owns the building — usually six to eighteen months between hand-over and
the next joint-venture closing.
YIELDS
6.5% yield on cost — €6.5 on €100
5.0% yield on value — €6.5 on €130
~8% all-inclusive yield on cost on projects started in H1 2026 (latest
group disclosure)
Profit, rent and cash arrive in different orders for different buildings. Here the valuation gain came first (page 10),
rent second, and the cash third (page 12); a pre-let building sold at practical completion would collect rent and
cash in the same season.
VGP in full · September 2026 · 11
UNDERSTAND THE CLOSING · THE TRANSACTION
€130 of building becomes €97.5 of cash and a 50% stake
Bank
Lends to the JV against the building.
Non-recourse to VGP.
€65 loan, 50% loan-to-value
the building, at €130
VGP NV
€32.5 equity and
shareholder loan
Developer and seller. Keeps 50% of the JV
and remains property, facility and asset
manager.
JV partner
Financial investor. Funds 50% of the equity
and shareholder loans; no operating role.
VGP Park X · now in the JV
€97.5 cash
€130 transfer value · €6.5 rent
owned 50% VGP · 50% partner
€97.5 recycled
97.5% of VGP’s €100 original investment
75% of the €130 property value
€32.5 VGP’s 50% of the €65 equity and shareholder funding — retained, not paid: an ownership interest,
not a cash flow
Result on closing in this example: nil. The €130 price equals the value already recognised on VGP’s balance sheet, so the profit was booked at valuation, not at sale.
Legend ▬ solid arrows: cash ▬ grey arrow: transfer of the building ┄ dashed line: ownership interest
Simplified: before transaction costs, taxes and working-capital adjustments. In this example the transfer value equals the carrying value, so the incremental result on closing is nil; actual
closings can include valuation differences and settlements.
VGP in full · September 2026 · 12
UNDERSTAND THE CLOSING · VGP’S CONSOLIDATED BALANCE SHEET
The property becomes cash, a JV investment and a shareholder loan
Extract for VGP Park X, € — the day before and the day after the closing. Lines that change are shaded.
€
Before closing
After closing
Change
130.0
—
−130.0
Investment in joint venture — equity method
—
12.5
+12.5
Shareholder loan to joint venture
—
20.0
+20.0
Cash and cash equivalents
—
97.5
+97.5
130.0
130.0
—
130.0
130.0
—
—
—
—
130.0
130.0
—
ASSETS
Investment property (Park X, at fair value)
Total assets attributable to Park X
SHAREHOLDERS’ EQUITY AND LIABILITIES
Shareholders’ equity — €100 invested + €30 valuation gain recognised before closing
Financial debt at VGP level
Total equity and liabilities attributable to Park X
WHY THE TOTALS DO NOT MOVE
THE €65 BANK LOAN
The building was already carried at its €130 transfer value, so the closing exchanges assets
one for one. Equity is unchanged: the €30 gain was recognised at valuation, before the closing.
No incremental closing profit arises under these assumptions.
It is raised by the joint venture at the closing to fund part of the €130 price. It never sits on
VGP’s consolidated balance sheet, before or after — it appears at 50% only in the proportional
view (page 17).
Illustration assumes €100 of initial equity funding, with no VGP-level borrowing. The €12.5 / €20.0 split of the €32.5 is illustrative; actual proportions follow each JV agreement.
VGP in full · September 2026 · 13
UNDERSTAND THE CLOSING · VGP’S CONSOLIDATED INCOME STATEMENT
On the income statement, rent leaves and three other lines arrive
VGP Park X in VGP’s consolidated income statement, € a year, before and after the closing.
€ a year
Before closing
After closing
Change
Gross rental income
6.5
—
−6.5
Property operating costs, net
(0.1)
—
+0.1
Net rental income
6.4
—
−6.4
Joint venture fee income — asset management
—
0.4
+0.4
Share in result of joint venture (50%, after JV interest and tax)
—
0.4
+0.4
Contribution to EBITDA before financial result
6.4
0.8
−5.6
Financial income — interest on €20 shareholder loan
—
1.0
+1.0
Contribution to result before taxes
6.4
1.8
−4.6
Realised result on closing (transfer value €130 − carrying value €130)
WHERE THE €6.5 WENT
The building still earns €6.5. After closing the JV keeps it, pays
€2.7 of bank interest, €2.0 of shareholder-loan interest and €0.7
of costs, and VGP shows half of what is left — €0.4 — on one
line. Half of the €2.0 interest comes back to VGP as €1.0 of
financial income.
WHAT THE READER SEES
Consolidated rental income falls after a successful closing. That
is the model working, not a loss of income: the proportional
statements re-add 50% of the JV’s rent (page 17), and the
€97.5 is now funding the next project.
0.0
GROUP ACTUAL, FULL YEAR 2025
Own gross rental income €86.7m; JV fee income €52.1m; share in
result of joint ventures €41.3m after a €10.4m negative JV
revaluation at share; €26.5m of interest on shareholder loans to the
JVs; €82.7m of excess-cash distributions received from the JVs.
Illustrative annual figures for Park X; rates on page 18. Actual closings can add a realised gain or loss where price differs from carrying value, and later settlements (full year 2025: €60.5m
realised, mainly on the Saga closing and settlements).
VGP in full · September 2026 · 14
UNDERSTAND THE CLOSING · VGP’S CASH FLOW STATEMENT
The €97.5 arrives as an investing inflow, not operating cash
Where each amount of the Park X story lands in the cash flow statement — and where it landed for the group in 2025.
Line
Park X
Group
OPERATING ACTIVITIES
Park X, €
Group FY 2025, €m
Rent collected while owned 100%
6.5 a year
included in operating cash of 50.9
Valuation gain (non-cash) — removed from profit
0
(183.1) unrealised, (60.5) realised
Share in JV result (non-cash) — removed from profit
0
(41.3)
Land and construction spend
(100)
(641.9)
Proceeds from disposal of subsidiaries — the closing
97.5
388.7 (Saga third closing €351m net, Riga €34m, settlements)
Distributions received from joint ventures
later years
82.7
Loans provided to joint ventures
(20)*
(0.9)
Equity raised
100 ²
— (€250m raised in May 2026)
Bonds and loans, net
—
289.8
Interest paid and dividends
—
(48.3) and (90.1)
INVESTING ACTIVITIES
FINANCING ACTIVITIES
97.5% of the original investment comes back through cash recycling, making further equity or debt raising for the next project largely unnecessary. * The €20 shareholder loan is retained out of the €130 rather than
advanced in cash, so the cash line shows €97.5 net. ² In practice the €100 is in majority recycled from the proceeds of earlier sales to the joint ventures (page 16, note 3).
Illustrative for Park X. Group actuals per the consolidated cash flow statement, full year 2025; interest paid is presented within financing.
VGP in full · September 2026 · 15
UNDERSTAND THE CLOSING · RECAP
Park X across all three statements, from land to the year after closing
The one page on which the income statement, balance sheet and cash flow statement are read side by side.
€
Investment (p. 8)
Valuation (p. 10)
Completion, one year (p. 11)
Closing (p. 12–15)
Year after closing (p. 18)
Rent, net
—
—
6.4
—
—
Valuation gain
—
+30.0
—
0.0
—
Fee income + share of JV result + SHL interest
—
—
—
—
1.8
Contribution to profit
0.0
30.0
6.4
0.0
1.8
Investment property
100.0
130.0
130.0
—
—
JV investment + shareholder loan
—
—
—
32.5
32.5 + retained result
Cash
—
—
+6.4
+97.5
+1.4 received
Operating
—
—
+6.4
—
+0.4 fee, +1.0 interest*
Investing
(100.0)
—
—
+97.5 ³
distributions when paid
Financing
+100.0 equity ²
—
—
—
—
INCOME STATEMENT
BALANCE SHEET (assets from Park X)
CASH FLOW
- Interest received is presented within operating activities; dividends from joint ventures within investing. The JV’s own €65 bank loan and the partner’s €32.5 never appear in VGP’s consolidated statements. ² Recycled in
majority from the preceding development cycle: the proceeds of sales to joint ventures (note 3). ³ 97.5% of the €100 invested comes back at the closing and funds the next project.
Illustration; equity-funded; figures after closing use the rates on page 18.
VGP in full · September 2026 · 16
UNDERSTAND THE CLOSING · THE PROPORTIONAL VIEW
Proportionally, half the building — and half its debt — come back
Park X after closing, €. The middle column is half of the JV entity’s own statements — the company that owns Park X — added line by line.
VGP, IFRS consolidated
50% of the JV entity’s own
statements
—
65.0
65.0
Cash
97.5
—
97.5
Investment in joint venture (equity method)
12.5
(12.5)
—
Shareholder loan to joint venture
20.0
(20.0)
—
Total assets
130.0
65.0
(32.5)
162.5
Bank debt (JV level)
—
32.5
Shareholder loans owed by the JV (both partners, €40)
—
20.0
(20.0)
—
Shareholders’ equity
130.0
12.5
(12.5)
130.0
Total equity and liabilities
130.0
65.0
(32.5)
162.5
Gross rental income
—
3.25
JV fee income
0.4
Share in result of joint venture
0.4
(0.4)
Interest: bank (JV) / shareholder loan
1.0
(1.35) − (1.0)
BALANCE SHEET
Investment property
Elimination
VGP, proportional
32.5
INCOME STATEMENT, € A YEAR
3.25
0.4
—
+1.0
(1.35)
Reading: proportionally VGP owns €65 of building financed by €32.5 of JV bank debt — a 50% LTV on the retained interest — and its €1.0 of shareholder-loan interest income nets against the JV’s interest cost.
Group actuals on this basis: investment portfolio at share €6.1bn and proportional LTV 49.4% at 30 June 2026; net rental and renewable energy income €223.4m in 2025 (page 22).
Illustration. Proportional statements add 50% of each JV line and eliminate balances between VGP and the JV, notably shareholder loans; VGP publishes them as supplementary notes.
VGP in full · September 2026 · 17
CONTINUING EARNINGS · OWNERSHIP AND PAYMENT FLOWS
What VGP earns from Park X every year after the closing
THE JV’S OWN INCOME STATEMENT · € A YEAR
Tenant pays €6.5 to the JV
Rental income
6.5
Property costs and management fee to VGP (fee 0.4)
(0.7)
Interest on €65 bank loan at 4.1%
(2.7)
Interest on €40 shareholder loans at 5.0%
(2.0)
JV result before tax
1.1
VGP’s 50% share — equity method
0.55
WHAT REACHES VGP · € A YEAR
Route
In profit
In cash
Asset management fee
0.4
0.4 as invoiced
Interest on VGP’s €20 shareholder loan
1.0
1.0 as paid
Share of JV result (50% of 1.1)
0.55
only when distributed
—
when the JV refinances
1.95
1.4 + distributions
Repayment of shareholder loan principal
Total
Joint venture
owns Park X · €6.5 rent
0.4 fee · 1.0 interest · 50% of
distributions
VGP NV
50% owner · manager ·
lender
1.0 interest · 50% of distributions
2.7 interest
JV partner
50% owner · lender
Bank · €65 loan
Profit and cash differ: the €0.55 share of result is booked whether or not the JV distributes; fees and
interest are cash as they fall due; principal repayments are capital, not income.
Illustrative rates: JV bank loan 4.1% (the all-in cost of the refinanced Rheingold facility, May 2026); shareholder loans 5.0% on €40 (VGP €20, partner €20); asset management fee 0.3% of
value. JV tax ignored.
VGP in full · September 2026 · 18
CONTINUING EARNINGS · GROUP ACTUALS
Four cash routes from the joint ventures: full year 2025
€ million, 2025. Fees and interest are income; distributions and repayments are cash on an investment already carried on the balance sheet.
FEES — RECURRING
31.2
Asset management fees (recurring)
Development management fees
€33.7m excluding the promote
Asset management fees €31.2m (2024: €27.0m) and development
management €2.5m. Booked in the Investment segment, paid by the JVs to
VGP. H1 2026: €18.3m.
2.5
DISTRIBUTIONS
€82.7m of excess cash received
30.1
Dividends and equity distributions
Shareholder-loan interest received in cash (income recognised:
26.5)
20.0
Dividends and equity distributions €30.1m, shareholder-loan interest €20.0m,
principal repaid €32.7m (cash-flow note 4). Interest income recognised on the
shareholder loans in 2025: €26.5m. At least €80m of distributions expected in
2026.
PRINCIPAL
€32.7m repaid
32.7
Shareholder-loan principal repaid
Promote — Rheingold (provision; cash July 2026)
18.4
Return of shareholder-loan capital as JVs refinance or amortise — a
reduction of the €566.7m of loans outstanding at year-end 2025, not income.
PROMOTE — EPISODIC
€18.4m
Performance fee on the First JV (Rheingold) after ten years, net IRR above
12%. Provided for in 2025 fee income, received in July 2026. One-off by
nature.
VGP in full · September 2026 · 19
CONTINUING EARNINGS · RENEWABLE ENERGY
The roof goes with the building; the solar plant stays with VGP
WHO OWNS WHAT
1 Building and roof — the property owner: VGP, or after a closing
the joint venture. Investment property at fair value.
2
2 Solar installation — VGP Renewable Energy, whoever owns the
building. Property, plant and equipment at cost, depreciated, never
revalued. It does not transfer at a closing.
1
WHO DELIVERS WHAT, WHO PAYS WHOM
electricity
Tenant
VGP Energy
payment
surplus electricity
roof rent — paid by VGP Energy
to the building owner
Building owner (VGP or JV)
Rooftop photovoltaic installation on a VGP building (photograph). Markers: 1 building and roof, 2 solar installation.
payment for
output*
Grid / utility
- Where output is sold to the grid, the utility or offtaker pays VGP Energy for the
electricity purchased, under the arrangement that applies to the project. Intragroup roof rent is reclassified between the Investment and Renewable Energy
segments.
VGP’s model: installations are held by VGP energy entities, carried at cost and depreciated (note 11); revenue is electricity sold, incentives and, where applicable, leasing. Revenue models
differ by project and country; not every tenant buys power under a PPA.
VGP in full · September 2026 · 20
CONTINUING EARNINGS · RENEWABLE ENERGY PLATFORM
193 MWp of solar operating on a 301 MWp platform
Renewable energy platform, 30 June 2026
PV projects
PV MWp
BESS projects
BESS MWh
Installed and operating
152
193.4
11
31.5
Under construction or permitting
38
32.5
4
140.4
Pipeline (on parks VGP controls)
94
74.8
10
79.0
Total identified
284
300.8
25
250.9
HOW IT IS ACCOUNTED FOR
Installations are property, plant and equipment: €148.2m in total at 30
June 2026, of which €135.4m in the Renewable Energy segment. They
are carried at cost less depreciation — no fair-value gains — so the
segment’s earnings come only from operations.
The segment borrows on its own account: €125.8m of non-current and
€11.3m of current financial debt are allocated to it in the segment
balance sheet.
Cash generation is EBITDA less interest and tax, before the non-cash
depreciation; capex on new installations (€19m in 2025) is an investing
outflow.
€11.9m
€6.5m
gross renewable energy income, 2025
Renewable Energy segment EBITDA, 2025
from €8.3m in 2024; 132 GWh of solar electricity sold,
+47%
from €5.4m; depreciation of €5.5m sits below EBITDA. H1
2026: €4.3m
€169m
100 MWh
operational and committed investment
Hagen battery, expected operational H2 2027
30 June 2026; of which €117m operational, plus ~€65m of
projects under design
the largest storage project in the pipeline; first BESS
revenue expected H2 2026
When a building transfers to a JV the installation stays in these entities;
the roof is then leased from the JV.
Capacity at 30 June 2026 (H1 2026 report); income full year 2025. Solar in MWp; battery energy capacity in MWh; the two are not added. Carrying value of operational PV assets €117m at
30 June 2026.
VGP in full · September 2026 · 21
READ THE GROUP ACCOUNTS · REPORTING BASES
The same portfolio counted three ways
Check the basis before reading any group figure. A closing moves a building from the IFRS view to the proportional view; the 100% view does not
change.
PORTFOLIO AT 100%
PROPORTIONAL SHARE
IFRS CONSOLIDATED
Everything VGP develops and manages
What VGP economically owns
What the statutory accounts show
Own portfolio plus 100% of the joint ventures. Used for operating
KPIs, including sustainability metrics.
Own portfolio plus 50% of each JV, line by line, with shareholder
loans eliminated. Used for leverage and recurring income.
Own portfolio consolidated; each JV on one line as an equityaccounted investment plus a shareholder loan. Used for
reported profit, equity and gearing.
Gross asset value
Investment portfolio at share
Investment property
€9,209m
€6,083m
€2,831m
Committed annualised rent
Committed annualised rent at share
Investments in JVs + shareholder loans
€488.9m
€327.4m
€1,465m + €560m
Net rental and energy income, FY 2025
Net rental and energy income, FY 2025
Share in result of JVs, FY 2025
€264.9m JV + €88.7m own
€223.4m
€41.3m
Completed portfolio
Proportional LTV · net debt / EBITDA
Gearing (net debt / total equity & liabilities)
6.6m m² · 275 buildings · 98% let
49.4% · 7.6×
35.5%
Bridge from proportional to IFRS: remove 50% of the JVs’ assets (€3,255m investment property at share), debt (€1,702m at share) and cash (€138m at share); add back the equity-accounted investment
(€1,465m) and the shareholder loans (€560m). The JVs’ own liabilities never enter the IFRS balance sheet.
Positions at 30 June 2026; income for full year 2025. Proportional net rental and renewable energy income = own €88.7m + JVs at share €134.7m, per the proportional income statement in
the supplementary notes.
VGP in full · September 2026 · 22
READ THE GROUP ACCOUNTS · THE JOINT-VENTURE LINE
One IFRS line, €41.3m in 2025, carries the whole JV portfolio
Summary income statement of the joint ventures, 2025, € million — and the one figure that reaches VGP’s income statement.
€ million, full year 2025
JVs at 100%
JVs at share
Gross rental income
292.5
148.7
Property operating expenses
(1.3)
(0.7)
Property management fees — paid to VGP
(26.2)
(13.4)
Net rental income
264.9
134.7
Net valuation losses on investment properties
(18.3)
(10.4)
Administration expenses
(5.3)
(2.7)
Operating result
222.8
Net financial result — bank and shareholder-loan interest
HOW THE €41.3m IS SPLIT IN THE SEGMENT TABLE
Investment segment EBITDA takes the JVs’ net rental income less
administration, €122.9m at share, as “share of JVs’ adjusted
EBITDA”. The JVs’ interest (€56.6m), current tax (€6.7m), valuation
result (−€10.4m) and deferred tax (€8.0m) are shown below EBITDA
(page 25).
BY VEHICLE — RESULT AT SHARE, 2025
First JV — Rheingold (Allianz)
19.6
Second JV — Aurora (Allianz)
23.7
112.4
Third JV — VGP Park München (Allianz)
(2.1)
(111.3)
(56.4)
Fifth JV — RED (Deka)
(4.6)
Taxes — current and deferred
(29.4)
(14.7)
Sixth JV — Saga (Areim)
5.0
Result for the period → “Share in result of joint ventures”
82.1
41.3
Development JVs
(0.4)
Total
41.3
2025 was a year of flat-to-negative revaluation in the JVs (Germany in H2), which is why the JV line fell from €92.7m to €41.3m
while net rental income at share rose 10.7% to €134.7m. H1 2026: €54.5m, with €25.1m of positive revaluation.
Note 8.1 to the 2025 consolidated financial statements. “At share” is VGP’s approximately 50% interest in each joint venture. Management fees paid by the JVs are income for VGP (€52.1m
in 2025, note 4, including the €18.4m promote provision).
VGP in full · September 2026 · 23
READ THE GROUP ACCOUNTS · EARNINGS QUALITY
€455m of EBITDA in 2025, line by line, and how repeatable each is
Segment table, full year 2025, € million. Segment membership says where a euro comes from; the last column says how likely it is to recur.
€ million
FY 2025 Repeatability
INVESTMENT
Net rental income — own completed portfolio
81.9 Recurring, contracted; grows as deliveries let up
Joint-venture fee income — asset management, excl. promote
31.2 Recurring; scales with assets under management
Joint-venture fee income — Rheingold promote provision
18.4 Episodic; performance-linked
Joint-venture fee income — development management
2.5 Activity-linked
Share of JVs’ adjusted EBITDA (rent less costs, no revaluation)
122.9 Recurring, contracted
Administration expenses allocated (15%)
(7.9)
Investment EBITDA
249.0
PROPERTY DEVELOPMENT
Net property operating expenses
(2.3) Non-recurring
Unrealised valuation gains — new starts, progress and letting
183.1 Development-linked; non-cash until a closing
Realised gains — Saga third closing and JV settlements
60.5 Transaction-linked; cash
Administration expenses allocated (~80%)
(42.1)
Property Development EBITDA
199.3
RENEWABLE ENERGY
Net renewable energy income
9.1 Recurring; grows with MWp connected
Administration expenses allocated (~5%)
(2.6)
Renewable Energy EBITDA
6.5
Group EBITDA
454.7
Note 3.1 to the 2025 consolidated financial statements. The €18.4m Rheingold promote is a provision within property and facility management income. “Repeatability” is a reading aid, not a
company classification.
VGP in full · September 2026 · 24
READ THE GROUP ACCOUNTS · FROM EBITDA TO REPORTED PROFIT
From €455m of EBITDA to €290m of reported result
454.7
−10.9
443.8
−23.9
−56.6
363.3
EBITDA
Depreciation
EBIT
Net financial
cost — own
Net financial
cost — JVs at
share
Result before
taxes (APM)
−10.6
Current tax —
own
−6.7
Current tax —
JVs
346.1
−10.4
Recurrent net
income
JV valuation
result at share
−37.4
Deferred tax —
own
−8.0
290.4
Deferred tax —
JVs
Reported result
€ million, full year 2025
RECURRENT NET INCOME €346.1m
BELOW IT −€55.7m net
NOT IN THIS BRIDGE
rent, fees, JV operating result and energy, after all interest and
current tax — the earnings the standing portfolio produces (2024:
€270.1m)
JV revaluation (−€10.4m) and deferred taxes on unrealised gains (−
€45.4m, own and JVs): non-cash, both ways; +€0.1m of JV
derivative movement
the €18.4m promote sits inside EBITDA as fee income; equity
issuance (€250m in May 2026) never touches earnings
Note 3.1, full year 2025, € million. “Recurrent net income” is VGP’s alternative performance measure; IFRS result before taxes of €338.4m groups the JV items differently (JV result €41.3m
as one line before tax). H1 2026 in appendix A5.
VGP in full · September 2026 · 25
READ THE GROUP ACCOUNTS · CASH
Cash from €492m to €523m: how 2025 was funded
+289.8
−641.9
+82.7
+388.8
−0.9
492.5
Cash 1 Jan 2025
−48.3
−90.1
+50.9
Operating cash flow
Disposals and JV
closings
JV distributions
received
Bonds & loans, net Investment property
& PP&E capex
Loans to JVs
Interest paid
Dividend paid
−0.5
523.1
FX & other
Cash 31 Dec 2025
€ million, full year 2025
WHAT WENT INTO THE GROUND
WHAT CAME BACK FROM THE PORTFOLIO
HOW THE GAP WAS FUNDED
€642m of capex — €492m construction, €149m land, plus
capitalised interest and incentives — for 761,000 m² of new starts
and 494,000 m² delivered
€389m from the Saga closing, Riga and settlements, plus €83m of
JV distributions: together €472m, or 73% of the capex
€290m of net bond and loan proceeds (€576m issued, €80m
repaid, €200m tendered); no equity was raised in 2025 — the
€250m raise followed in May 2026
VGP in full · September 2026 · 26
READ THE GROUP ACCOUNTS · PROFIT AND CASH
€338m of pre-tax profit, €51m of operating cash flow
Three adjustments explained on the Park X pages account for €285m of the €288m gap; working capital and net interest do the rest.
€ million
FY 2025
Park X equivalent
Profit before taxes
338.4
Unrealised valuation gains on investment property
(183.1)
the €30, page 10
Realised gains on disposals and closings
(60.5)
nil in the example
Share in result of joint ventures
(41.3)
the €0.55, page 18
Depreciation
10.7
Interest expense less interest income
23.5
Other non-cash items
0.4
Cash generated before working capital
88.2
Increase in receivables
(43.7)
Increase in payables
11.8
Cash generated from operations
56.3
Interest received
5.2
Income taxes paid
(10.6)
Net cash from operating activities
50.9
WHERE THE CASH ACTUALLY IS
Operating cash flow is small because development capex and closing
proceeds both sit in investing activities, and because the JVs’ operating
cash reaches VGP as distributions (investing, €82.7m) rather than as
operating receipts. Fee income (€52.1m) and interest received are the
operating cash routes.
WORKING CAPITAL
Receivables rose €43.7m in 2025 — including the €18.4m promote
receivable settled in July 2026 and rent-free incentives; payables rose
€11.8m.
the €1.0 shareholder-loan interest
READING THE TWO TOGETHER
Judge the recurring base on recurrent net income (€346.1m) and the
recycling engine on investing inflows (€389m + €83m). Neither is visible
in operating cash flow alone.
Consolidated cash flow statement, full year 2025, € million. Interest paid is presented within financing activities; interest received within operating activities.
VGP in full · September 2026 · 27
READ THE GROUP ACCOUNTS · DEBT AND LIQUIDITY
Where the debt sits: €2.65bn at VGP, €3.35bn in the joint ventures
3,348
35.5%
consolidated gearing
49.4%
proportional loan-to-value
31.6%
stabilised joint ventures’ LTV
net debt €2,052m over total equity and liabilities €5,784m;
35.3% at year-end 2025
2,650
1,702
VGP’s debt plus 50% of JV debt, against the portfolio at
share; 50.0% at year-end 2025
599
272
VGP consolidated
138
Joint ventures at 100%
Gross financial debt
Joint ventures at VGP’s share
non-recourse, asset-backed bank debt inside the JVs;
Rheingold refinanced to an €886m bullet at 4.1% all-in
Cash
€ million
VGP’S OWN FUNDING
A closing lowers gearing (assets down €130, cash up €97.5) but leaves the proportional LTV of the retained
interest at the JV’s own level — in the example 50%. Group leverage therefore moves with the pace of
construction and closings together, not with either alone.
€600m bond, 4.0%, January 2032 · €220m bond, January 2027 (after €100m tender) ·
€24m Schuldschein due H2 2026 · bank facilities · €500m undrawn revolving credit.
No bond maturities between January 2027 and April 2029. Liquidity about €1.1bn.
30 June 2026. Gearing = net financial debt / total equity and liabilities (IFRS). Proportional LTV includes the JVs at share. JV LTV = stabilised JVs’ own loan-to-value. Average cost of VGP
debt 3.0% (2.7% at year-end 2025).
VGP in full · September 2026 · 28
READ THE GROUP ACCOUNTS · RESILIENCE
If a closing moves: what changes, what does not, and what it costs
Park X, €
Closing on schedule
Closing twelve months later
Closing at 40% LTV instead of 50%
Rent to VGP in the year
6.5 until closing, then share
6.5, fully consolidated all year
6.5 until closing, then share
JV bank financing raised
65.0
65.0, a year later
52.0
Partner contribution
32.5
32.5, a year later
39.0
Cash returned to VGP
97.5
0 this year; 97.5 next year
91.0
Capital VGP keeps in the asset
32.5
130.0 for another year
39.0
Consolidated gearing
falls at closing
stays higher for a year
falls, slightly less
Capacity for new starts from this asset
97.5
funded from liquidity meanwhile
91.0
TIMING EFFECT
FINANCING COST
MARKET RISK
The €97.5 arrives later. VGP keeps €130 invested and keeps
the €6.5 of rent; new starts are funded from €599m of cash and
€500m of facilities in the meantime.
Carrying €130 for a year at VGP’s 3.0% average cost of debt is
worth about €3.9 of interest at group level — the example
ignores it because Park X is equity-funded; the group is not.
A closing a year later is priced a year later: valuation yields,
bank terms and the partner’s appetite can move. A lower LTV
also leaves more VGP capital in the JV permanently, not just
later.
Illustration for Park X; group facts at 30 June 2026. Timing effects are shown separately from financing costs and market risks; continuing rent does not guarantee an unchanged outcome.
VGP in full · September 2026 · 29
THE NEXT PHASE · THE JOINT-VENTURE AND FUND PLATFORM
The platform: five joint ventures today, three structures proposed
Net assets at share
€m
Shareholder loan
€m
~50%
631.7
34.7
56.4
Allianz Real Estate
~50%
208.7
23.6
23.6 Investing; €2.4m loan repaid H1
Third JV — VGP Park München
Allianz Real Estate
~50%
188.6
141.7
14.4 Building D (Isar Aerospace) closing targeted H2 2026
Fifth JV — RED
Deka Immobilien
~50%
169.7
233.4
26.4 Investing; five parks in Germany
Sixth JV — Saga
Areim
~50%
247.9
112.0
14.0
Development JVs — Belartza, Grekon
VUSA; Weimer Bau
~50%
18.5
14.9
(0.1) Land only
1,465.0
560.4
134.7
EXISTING · positions 30 June 2026
Partner
VGP share
First JV — Rheingold
Allianz Real Estate
Second JV — Aurora
Total
NRI at share FY
Status
2025 €m
Refinanced €886m bullet, May 2026; €18.4m promote paid
July 2026
Fourth disposal in multiple closings H2 2026 – H1 2027;
€6.0m loan repaid
PROPOSED · not yet in the accounts
Saga II
Areim
50% intended
—
—
— MoU signed; ≥ €1.5bn GAV target; launch expected 2027
Pan-European fund
East Capital
not yet set
—
—
—
Data-centre development platform
Specialist partner
50% intended
in opco and
asset JV
—
—
— MoU signed; seeds Rüsselsheim and Paderno (page 31)
≥ €1.5bn GAV target, CEE emphasis; equity raise H2 2026,
launch 2027; seed portfolio identified
All existing vehicles follow the 50:50 pattern used in the example, with VGP as property, facility and asset manager. Future structures need not replicate identical ownership terms; the cash-recycling mechanics
(page 12) apply wherever VGP transfers a completed asset at market value and retains an interest.
VGP in full · September 2026 · 30
THE NEXT PHASE · DATA CENTRES
Data centres: land, permits and power from VGP; nothing yet
committed
INTENDED STRUCTURE
Pan-European data-centre development platform
Operating company
development and platform management
Asset-holding joint venture
ownership of the data-centre assets
VGP 50% intended
Partner 50% intended
VGP contributes local expertise and the relevant development pipeline at market value —
initially Rüsselsheim (Frankfurt; 190 MVA grid and on-site power plant) and Paderno
Dugnano (Milan; 120 MVA grid) — plus permitting, power and construction capability. The
partner brings design, operating and fund-raising capability.
VGP Park Rüsselsheim — the on-site power infrastructure behind the “powered land” proposition (photograph)
IN THE ACCOUNTS TODAY
ON CONTRIBUTION
AFTERWARDS
Both sites are part of the land bank within investment property,
at fair value. Pre-development costs follow the normal
development treatment. No data-centre capital is committed.
Contributing land at market value into the asset JV is a page-12
event applied to land: cash or equity comes back, VGP’s 50% is
equity-accounted, and any difference to carrying value is
realised in the Development segment.
The recycling logic is intended to repeat: asset stakes can be
sold down across phases while development economics remain
50/50, limiting the new equity VGP needs.
MoU signed; subject to final agreement and documentation. Both sites remain subject to permitting, power confirmation, anchor commitment and final investment approval. Data centres are
reported separately from Renewable Energy.
VGP in full · September 2026 · 31
APPLY THE EXPLANATION · AN ACTUAL CLOSING
Saga third closing, December 2025: €509m of value, €351m of cash
The illustration recycles 75 cents per euro of value; the largest closing of 2025 recycled 69 cents, at lower bank leverage.
THE CLOSING AS DISCLOSED
100
100
75
69
Line
Park X Saga third closing
Gross asset value transferred
130.0
Less: bank financing raised by the JV
(65.0) within €158m; Saga LTV capped at 40%
Less: VGP’s retained equity and
shareholder loan
(32.5) within €158m; VGP holds 50% of the JV
Less: costs, taxes, completion and rent-free
adjustments
Gross asset value transferred
Net cash to VGP
Park X illustration
Saga third closing, Dec 2025 (€509m / €351m)
Per €100 of gross asset value
Timing matters as much as amount: 11 of the 18 buildings were delivered during 2025 and
transferred in the same December closing, so their rent barely appears in consolidated 2025
income. Assets legally owned by a JV but not yet transacted stay in VGP’s investment property
until control passes.
€509m — 18 buildings incl. one
parkhouse, 7 countries
— within €158m; not disclosed separately
Net cash proceeds to VGP
97.5 €351m (69% of value)
Result on closing
0.0
part of €60.5m realised gains in 2025,
with settlements
2025 IN TOTAL, AND WHAT IS SCHEDULED
Cash recycled from closings, settlements and the Riga disposal: €389m in 2025 (€354.6m of it from the
joint ventures). Since 2022: €3.5bn of gross asset value transferred for €2.2bn of net cash. Scheduled:
VGP Park München building D to the Third JV on a €150m gross asset value (H2 2026) and the fourth
Saga disposal across multiple closings in H2 2026 and H1 2027. No JV closing fell in H1 2026.
2025 annual report and management report. Saga (Sixth JV, Areim, 50:50) may use debt up to 40% loan-to-value. The components of the €158m difference are not separately disclosed and
are not estimated here. Realised gains of €60.5m in 2025 relate to this closing and to settlements on earlier transactions.
VGP in full · September 2026 · 32
APPLY THE EXPLANATION · RECAP
One property, three statements, five moments
Invest
Value
Let
Transfer
Own & manage
€100
€130
€6.5 a year
€97.5 back
€1.95 a year
1
2
3
4
5
goes into investment property; an
investing outflow; no income yet
fair value replaces cost progressively as rent starts at hand-over and is fully
the building rises and lets
consolidated while VGP owns 100%
JV bank debt €65 and partner €32.5 pay 50% of the JV result, fees and
VGP; €32.5 stays as a stake; nil result
shareholder-loan interest; cash follows
at this price
distributions
Profit
Profit
Profit
Profit
Profit
—
+30
+6.4 a year
0
+1.95 a year
Cash
Cash
Cash
Cash
Cash
−100
—
+6.4 a year
+97.5 investing
fee + interest + distributions
Balance sheet
Balance sheet
Balance sheet
Balance sheet
Balance sheet
+100 property
property 130
unchanged
property → cash 97.5 + JV
12.5 + loan 20
JV investment + loan 32.5
GROUP, FULL YEAR 2025 · POSITIONS 30 JUNE 2026
READING RULE
€183m of unrealised gains; €41m share in JV results; €52m fees; €83m JV distributions; €389m
recycled; €51m operating cash flow; €642m capex. Cash €599m and €500m undrawn at 30 June
2026.
Check the basis (100% / share / IFRS), separate profit from cash, and read consolidated rent
together with the JV line and the fees.
Illustrative figures for VGP Park X; equity-funded; rates as on page 18. Group flows for full year 2025, positions at 30 June 2026.
VGP in full · September 2026 · 33
Important notice
Purpose of this presentation
Basis of preparation
This presentation has been prepared by VGP NV solely for information purposes as an explanation of the
company’s business model and financial reporting. It does not constitute or form part of any offer or
invitation to sell, issue, purchase or subscribe for any securities, nor any recommendation or investment
advice, in any jurisdiction, and it is not a prospectus within the meaning of Regulation (EU) 2017/1129.
Unless stated otherwise, financial information is derived from VGP’s condensed consolidated interim
financial statements for the six months ended 30 June 2026 (reviewed, not audited) and the related
management report; portfolio, rent, land, renewable energy and pipeline figures are stated as at 30 June
2026. Joint venture information is presented at 100% where indicated and does not represent VGP’s
proportionate share. Certain measures — including EBITDA and segment EBITDA, recurrent net income,
committed annualised rental income, cash-generative rent, potential rental income, yield on cost,
proportional LTV, gearing and gross asset value — are alternative performance measures, are not defined
by IFRS, may not be comparable with similarly titled measures reported by others, and should not be
regarded as substitutes for IFRS measures. Definitions are given in the appendix.
Forward-looking statements
This presentation contains forward-looking statements, including statements regarding strategy,
development and investment plans, the land bank and project pipeline, capital deployment, rental and fee
income, renewable energy and data centre capacity, proposed joint ventures and funds, and expected
returns. These reflect management’s current views and assumptions and are subject to known and
unknown risks and uncertainties. Actual results may differ materially from those expressed or implied. No
representation is given that any forward-looking statement will be achieved.
Third-party information
Market and industry data has been obtained from third-party sources that VGP believes to be reliable,
including independent valuers. VGP has not independently verified such information and accepts no
responsibility for its accuracy or completeness.
Illustrations are not guidance
VGP Park X and the scenario tables are simplified illustrations that exclude taxes, transaction costs and
other adjustments and assume equity funding at VGP level. They describe mechanics, not the terms of
any actual transaction, and do not constitute guidance, a forecast or a target.
© 2026 VGP NV. All rights reserved.
Rounding, liability and updates
Certain figures have been rounded and totals may therefore not sum precisely. Neither VGP NV nor any of
its directors, officers, employees or advisers accepts any liability for any loss howsoever arising from the
use of this presentation or its contents. VGP undertakes no obligation to update or revise any information
or forward-looking statement contained in it, except as required by law.
VGP in full · September 2026 · 34
APPENDIX
STATEMENTS, NOTES AND DEFINITIONS
Appendix
CONTENTS
A1–A3 Statements
A4–A5 Segments; EBITDA to result
Condensed consolidated statements for the six months to 30 June 2026, the
segment and joint-venture tables behind chapters 3–5, portfolio detail and definitions
of the measures used.
A6–A8 Joint ventures; notes
A9–A11 Energy; portfolio; definitions
VGP in full · September 2026 · 35
APPENDIX A1
Consolidated income statement
€ thousand
FY 2025
FY 2024
H1 2026
Gross rental and renewable energy income
98,644
73,704
49,685
Net property operating expenses / income
(9,937)
(6,018)
2,054
Net rental and renewable energy income
88,707
67,686
51,739
Joint Ventures fee income
52,058
32,666
18,274
Net valuation and realisation gains on investment properties
243,624
187,056
65,939
Administration expenses
(63,332)
(61,263)
(30,109)
Share in result of Joint Ventures
41,285
92,744
54,462
Other expenses
—
(1,750)
—
Operating result
362,342
317,139
160,305
Financial income
36,905
50,391
20,444
Financial expenses
(60,806)
(47,988)
(39,806)
Net financial result
(23,901)
2,403
(19,362)
Result before taxes
338,441
319,542
140,943
Taxes
(48,002)
(32,555)
(21,158)
Result for the period — attributable to shareholders of VGP NV
290,439
286,987
119,785
10.64
10.52
4.26
Basic and diluted earnings per share (€)
€ thousand. Full years 2025 and 2024 per the audited consolidated financial statements; six months to 30 June 2026 per the reviewed condensed interim statements. Valuation line includes
realised gains on disposals of subsidiaries and joint ventures.
VGP in full · September 2026 · 36
APPENDIX A2
Condensed consolidated balance sheet
Assets, € thousand
Equity and liabilities, € thousand
30.6.2026
31.12.2025
Share capital
120,917
105,676
2,393,399
Share premium
1,077,198
845,579
148,180
140,687
Retained earnings
1,676,544
1,649,549
1,464,953
1,409,858
Shareholders’ equity
2,874,659
2,600,804
Other non-current receivables (shareholder loans)
560,390
566,718
Non-current financial debt
2,365,214
2,097,766
Deferred tax assets
11,218
10,711
Other non-current liabilities
58,139
55,047
Total non-current assets
5,016,410
4,521,890
Deferred tax liabilities
83,134
65,636
Trade and other receivables
168,686
131,832
Total non-current liabilities
2,506,487
2,218,449
Cash and cash equivalents
598,649
523,094
Current financial debt
285,189
262,045
Disposal group held for sale
—
27,307
Trade debts and other current liabilities
117,410
121,365
767,335
682,233
Liabilities related to disposal group held for sale
—
1,460
5,783,745
5,204,123
402,599
384,870
5,783,745
5,204,123
Intangible assets
Investment properties
Property, plant and equipment
Investments in Joint Ventures and associates
Total current assets
TOTAL ASSETS
30.6.2026
31.12.2025
519
517
2,831,150
Total current liabilities
TOTAL EQUITY AND LIABILITIES
Investment properties comprise about €1.2bn completed assets, €854m under construction and €798m development land at 30 June 2026.
VGP in full · September 2026 · 37
APPENDIX A3
Consolidated cash flow statement
Operating activities, € thousand
FY 2025
FY 2024
H1 2026
Investing and financing, € thousand
FY 2025
FY 2024
H1 2026
Profit before taxes
338,441
319,542
140,943
Depreciation
10,734
8,607
5,261
Unrealised valuation gains on investment
properties
Proceeds from disposal of tangible assets and
other
Proceeds from disposal of subsidiaries, JVs and
investment properties
18
46
309
388,739
808,612
25,698
(183,124)
(94,190)
(63,315)
(641,894)
(549,824)
(376,213)
Realised gains on disposals
(60,500)
(92,866)
(2,624)
82,734
85,635
19,197
Financial instruments and FX
359
239
658
—
(4,273)
—
Interest income
(36,905)
(50,391)
(20,444)
Loans provided to Joint Ventures
(936)
(8,825)
(207)
Interest expense
60,447
47,749
39,148
Net cash from / (used in) investing activities
(171,339)
331,371
(331,216)
Share in profit of Joint Ventures
(41,285)
(92,744)
(54,462)
Interest paid
(48,260)
(46,925)
(57,155)
Cash generated before working capital
88,167
45,946
45,165
Dividends paid
(90,062)
(100,977)
(92,790)
Change in receivables
(43,707)
(11,831)
(34,751)
Net proceeds from issue of share capital
—
—
246,860
Change in payables
11,821
(2,765)
(8,055)
Proceeds from loans
565,083
135,000
593,877
Cash generated from operations
56,281
31,350
2,359
Loan repayments
(275,246)
(78,000)
(289,213)
Interest received
5,185
12,482
6,069
Net cash from / (used in) financing activities
151,515
(90,902)
401,579
Income taxes paid
(10,576)
(10,857)
(4,073)
Net increase / (decrease) in cash
31,066
273,444
74,718
Net cash from operating activities
50,890
32,975
4,355
Cash at beginning of period
492,533
209,921
523,094
(505)
9,168
837
523,094
492,533
598,649
Investment property and PP&E
Distributions by Joint Ventures and associates
Investment in Joint Ventures and associates
FX and reclassification to / from held for sale
Cash at end of period
Full years per the audited consolidated statements (2024 restated: interest paid within financing; JV-owned assets economically held by VGP within investment property); H1 2026 per the
reviewed condensed interim statements.
VGP in full · September 2026 · 38
APPENDIX A4
Segment table, full year 2025
€ thousand, year ended 31 December 2025
Investment
Development
Renewable energy
Eliminations
Total
Gross rental and renewable energy income
86,762
—
12,268
(386)
98,644
Property operating expenses
(4,888)
(2,276)
(3,159)
386
(9,937)
Net rental and renewable energy income
81,874
(2,276)
9,109
—
88,707
Joint Ventures fee income (incl. €18,400 promote provision)
52,058
—
—
—
52,058
—
243,624
—
—
243,624
Administration expenses
(7,890)
(42,081)
(2,630)
—
(52,601)
Share of JVs’ adjusted EBITDA
122,914
—
—
—
122,914
EBITDA
248,956
199,267
6,479
—
454,702
(974)
(4,365)
(5,547)
—
(10,886)
EBIT
247,982
194,902
932
—
443,816
EBITDA FY 2024
204,293
144,770
5,390
—
354,453
EBITDA H1 2026
130,495
51,605
4,332
—
186,432
Net valuation gains on investment properties
Depreciation and amortisation (incl. JVs)
Administration expenses in the segment table (€52.6m) are lower than the income-statement figure (€63.3m) because depreciation and amortisation (€10.7m) is shown separately below EBITDA. Balance-sheet
allocation: completed properties to Investment, land and construction to Development.
Note 3.1 to the 2025 consolidated financial statements. Share of JVs’ adjusted EBITDA = JVs’ net rental income and administration expenses at share, excluding valuation, financial and tax
items. Segment EBITDA is an alternative performance measure.
VGP in full · September 2026 · 39
APPENDIX A5
From EBITDA to reported result — 2025, 2024 and H1 2026
€ thousand
FY 2025
FY 2024
H1 2026
EBITDA
454,702
354,453
186,432
—
(1,750)
—
Depreciation and amortisation — own and JVs
(10,886)
(8,607)
(5,270)
EBIT
443,816
344,096
181,162
Net financial cost — own
(23,901)
2,403
(19,362)
Net financial cost — Joint Ventures and associates
(56,581)
(58,184)
(31,069)
Result before taxes (APM basis)
363,334
288,315
130,731
Current income taxes — own
(10,576)
(10,857)
(4,073)
Current income taxes — Joint Ventures and associates
(6,654)
(7,320)
(4,128)
Recurrent net income
346,104
270,139
122,530
Net valuation gains / (losses) on investment properties — Joint Ventures and associates
(10,367)
54,481
25,066
149
(915)
102
Deferred taxes — own
(37,426)
(21,698)
(17,085)
Deferred taxes — Joint Ventures and associates
(8,021)
(15,020)
(10,828)
Reported result for the period
290,439
286,987
119,785
Other expenses
Net fair value gain / (loss) on derivatives — Joint Ventures and associates
Note 3.1 (FY) and note 4.1 (H1). Recurrent net income is VGP’s alternative performance measure. JV items are VGP’s share.
VGP in full · September 2026 · 40
APPENDIX A6
Joint ventures — income statement and balance sheet
Income statement, full year 2025
JVs at 100%
JVs at share
Gross rental income
292,511
148,747
Underlying property operating expenses
(1,349)
(693)
Property management fees
(26,244)
(13,377)
Net rental income
264,918
134,677
Net valuation gains / (losses)
(18,345)
(10,367)
Administration expenses
(5,299)
(2,695)
Operating result
222,828
112,392
Net financial result
(111,328)
(56,432)
Taxes
(29,385)
(14,675)
Result for the period
82,115
41,285
H1 2026 result for the period
107,293
54,462
Balance sheet, 30 June 2026
JVs at 100%
JVs at share
6,377,732
3,252,247
Other non-current assets
4,539
2,278
Trade and other receivables
66,612
33,838
Cash and cash equivalents
272,137
138,321
Total assets
6,721,020
3,426,684
Non-current financial debt
3,334,502
1,695,497
Current financial debt
13,732
6,866
Deferred tax liabilities
363,436
185,442
Other liabilities *
145,858
73,926
Total liabilities
3,857,528
1,961,731
Net assets = investments in JVs and associates
2,863,492
1,464,953
Investment properties
- Other liabilities at 100%: €46.4m non-current and €99.5m current. Weighted average valuation yield of the completed JV portfolio 5.25% (5.22% at year-end 2025); a 0.10% change moves the JV portfolio
value at 100% by €118.5m. Rheingold refinanced in May 2026: €844m amortising facility replaced by an €886m bullet, average all-in cost from about 2.0% to 4.1%. EPRA at share: earnings €35.7m (+16%),
NTA €1,630m, NIY 5.20%, vacancy 1.2%, LTV 31.5%.
Notes 8.1–8.2 (FY 2025) and 7.2 (H1 2026), € thousand. All joint ventures are equity-accounted; vehicles and partners on page 30.
VGP in full · September 2026 · 41
APPENDIX A7
Shareholder loans and JV carrying value
Shareholder loans to Joint Ventures
30.6.2026
31.12.2025
First Joint Venture
34,661
35,716
Second Joint Venture
23,637
25,492
Third Joint Venture
141,748
139,671
Development Joint Ventures
14,901
14,335
Fifth Joint Venture
233,396
233,396
Sixth Joint Venture
112,047
118,108
Total
560,390
566,718
Investments in JVs and associates — roll-forward
H1 2026
FY 2025
1,409,858
1,300,874
633
97,806
Result of the period
54,462
41,285
Repayment of equity
—
(3,435)
Dividends
—
(26,672)
1,464,953
1,409,858
At 1 January
Additions
At end of period
CASH FROM THE JOINT VENTURES
Cash from the JVs in 2025: €82.7m of distributions — €30.1m dividends and equity distributions,
€20.0m shareholder-loan interest, €32.7m principal repaid. H1 2026: €19.2m of distributions and
€8.4m of principal repaid (Sixth €6.0m, Second €2.4m); the €18.4m Rheingold promote, provided for in
2025, was received on 1 July 2026. Management expects at least €80m of distributions in 2026.
VGP in full · September 2026 · 42
APPENDIX A8
Financial result, taxes, valuation and capital expenditure — 2025
NET FINANCIAL RESULT −€23.9m (2024: +€2.4m)
TAXES −€48.0m
+€5m gain on the buy-back of €200m of bonds; capitalised interest up €3m to €6.6m; interest on
cash −€7m (lower rates); interest on JV loans −€11.4m; interest on bonds +€12.6m; other financial
expenses +€2.8m. Average cost of debt 2.7% at year-end; 3.0% pro forma the January 2026 bond
(H1 2026: 3.0%).
€37.4m deferred tax on higher unrealised revaluation gains; €10.6m current tax (effective current
rate 9.3% on profit normalised for unrealised gains and JV results). JV taxes at share a further
€14.7m, of which €8.0m deferred.
VALUATION +€243.6m own; +€233.3m at share
CAPITAL EXPENDITURE €660.1m on investment property
€183.1m unrealised on the own portfolio; €60.5m realised on the Saga third closing and
settlements with the Deka, Ymir and Saga JVs. Own portfolio valued at a 7.48% weighted average
yield (7.22% at end-2024); JV portfolio 5.22% (5.05%), with a German valuation decline in H2 2025
producing a −€10.4m JV result at share.
€491.6m construction, €148.9m land acquisitions, €19.5m capitalised interest and rent-free
incentives. Renewable energy PP&E capex €19m. Land: 1,372,000 m² acquired, 1,625,000 m²
deployed, 33,000 m² sold (Riga); land bank 10.3m m² at year-end (10.4m m² at 30 June 2026).
EQUITY €2,600.8m at year-end 2025 → €2,874.7m at 30 June 2026
OTHER
2025: result €290.4m less dividend €90.1m. H1 2026: result €119.8m, capital increase €246.9m net
(€250m gross, May 2026), dividend −€92.8m. IFRS NAV per share €95.3 at end-2025, €105.33 at
30 June 2026; EPRA NTA per share €97.33 / €97.1.
Headcount 434 FTE at end-2025, 452 at 30 June 2026. Straight-lining of lease incentives €3.9m
within 2025 gross rental income, which also includes €15.2m of rent on the assets sold to Saga in
December. Revenue definition excludes service charges since 2025.
Notes 6, 7, 9 and management report, 2025 consolidated financial statements; H1 2026 where stated.
VGP in full · September 2026 · 43
APPENDIX A9
Renewable energy platform and accounting
Platform, 30 June 2026
PV projects
PV MWp
BESS projects
BESS MWh
Total projects
Installed
152
193.4
11
31.5
163
Under construction / permitting
38
32.5
4
140.4
42
Pipeline
94
74.8
10
79.0
104
Total
284
300.8
25
250.9
309
Income and capacity
FY 2025
FY 2024
H1 2026
Gross renewable energy income, €m
11.9
8.3
7.2
Net renewable energy income, €m
8.8
6.0
5.6
Solar electricity sold, GWh
132
90
78
Operational PV capacity at period end, MWp
170.5
155.7
193.4
Renewable Energy segment EBITDA, €m
6.5
5.4
4.3
Segment depreciation, €m
(5.5)
(4.7)
(3.2)
Accounting. Installations are property, plant and equipment at cost less depreciation (€148.2m in total;
€135.4m in the segment); no fair-value gains. The segment leases roof space from other VGP entities;
where these intra-group charges are not eliminated they are shown as cost in Renewable Energy and
revenue in Investment. Segment financial debt: €125.8m non-current, €11.3m current. Operational
assets and committed investment €169m (€117m operational); projects under design about €65m
more. First BESS projects connected in H1 2026, revenue expected from H2 2026; 100 MWh Hagen
project expected operational H2 2027.
Capacity at 30 June 2026 (H1 2026 report). PV in MWp; battery energy capacity in MWh; the two are not additive. Carrying value of operational PV €117m at 30 June 2026. GWh 2024
derived from the disclosed +47% growth in 2025.
VGP in full · September 2026 · 44
APPENDIX A10
Portfolio by country, 30 June 2026
Country
Completed m²
Buildings
Under construction m²
Buildings
Germany
3,168,000
103
339,000
11
Czech Republic
811,000
53
74,000
3
Spain
532,000
26
55,000
4
Romania
454,000
20
158,000
6
Hungary
395,000
21
34,000
2
Slovak Republic
336,000
15
34,000
2
Netherlands
259,000
6
138,000
4
Italy
194,000
11
30,000
1
Austria
168,000
7
—
—
Serbia
82,000
3
—
—
Portugal
82,000
4
23,000
2
Latvia
63,000
2
16,000
1
France
39,000
1
167,000
4
Croatia
35,000
1
29,000
1
Denmark
26,000
2
6,000
1
—
—
37,000
2
6,644,000
275
1,140,000
44
United Kingdom
Total
Completed m²
Under construction
m²
Own portfolio
1,647,000
1,094,000
Joint ventures
4,998,000
46,000
Total
6,644,000
1,140,000
Ownership
Committed annualised rent €488.9m at 100%, of which JVs €328.4m;
€327.4m at share. Cash-generative €419.9m (JVs €323.8m, own
€96.1m); a further €42.4m to start within a year and €26.5m within one to
five years. Weighted average lease term 7.7 years (own 9.5, JVs 6.8);
until first break 7.3 years. Ten largest tenants 29.4% of rent. Land bank
10.4m m² with development potential of at least 4.3m m² and €311m of
additional rent, part of a total rental income potential of about €800m
(€633m at share).
Management report. Own portfolio plus joint ventures at 100%; rentable space in m². Completed portfolio 98% let, average age 5.1 years, average size 24,000 m².
VGP in full · September 2026 · 45
APPENDIX A11
Definitions of measures used in this presentation
Gross asset value (portfolio at 100%)
Investment portfolio at share
Fair value of investment property in the own portfolio plus 100% of the joint ventures’ investment
property.
Own portfolio plus VGP’s proportionate share (about 50%) of the joint ventures’ investment property.
Committed annualised rental income
Cash-generative rent
Contracted annual rent of signed leases, including leases not yet started, own portfolio plus JVs at
100% unless stated at share.
Committed annualised rent on space already handed over to tenants.
Segment EBITDA
Recurrent net income
Operating result before depreciation and amortisation by business line, including VGP’s share of the
JVs’ net rental income less administration expenses (Investment) and excluding JV valuation, financial
and tax items; per note 4.1.
EBITDA less depreciation, net financial cost (own and JVs at share) and current taxes (own and JVs at
share); before valuation movements, derivative movements and deferred taxes.
Gearing
Proportional LTV
Net financial debt divided by total equity and liabilities, IFRS consolidated.
Net debt including the JVs at share, divided by the investment portfolio at share.
Yield on cost
Proportionally consolidated statements
Contracted or estimated annual rent divided by total development cost including land.
Consolidated statements with each JV’s assets, liabilities, income and expenses added at VGP’s
share and balances with the JVs (notably shareholder loans) eliminated; published as supplementary
notes.
Share of JVs’ adjusted EBITDA
EPRA measures
The JVs’ net rental income less administration expenses, at share, excluding valuation, financial and
tax items.
Per EPRA Best Practices Recommendations; shown for the JVs at share in note 7.5.
Alternative performance measures as defined by VGP in its interim report; not defined by IFRS. Illustrative Park X figures are not measures of VGP’s performance.
VGP in full · September 2026 · 46