Notification of cessation of securities - MTS
Bull 0
Bear 0
Routine
MTS
Fiscal year ends April
Quarters are offset from the calendar — Q1 is May–Jul
|
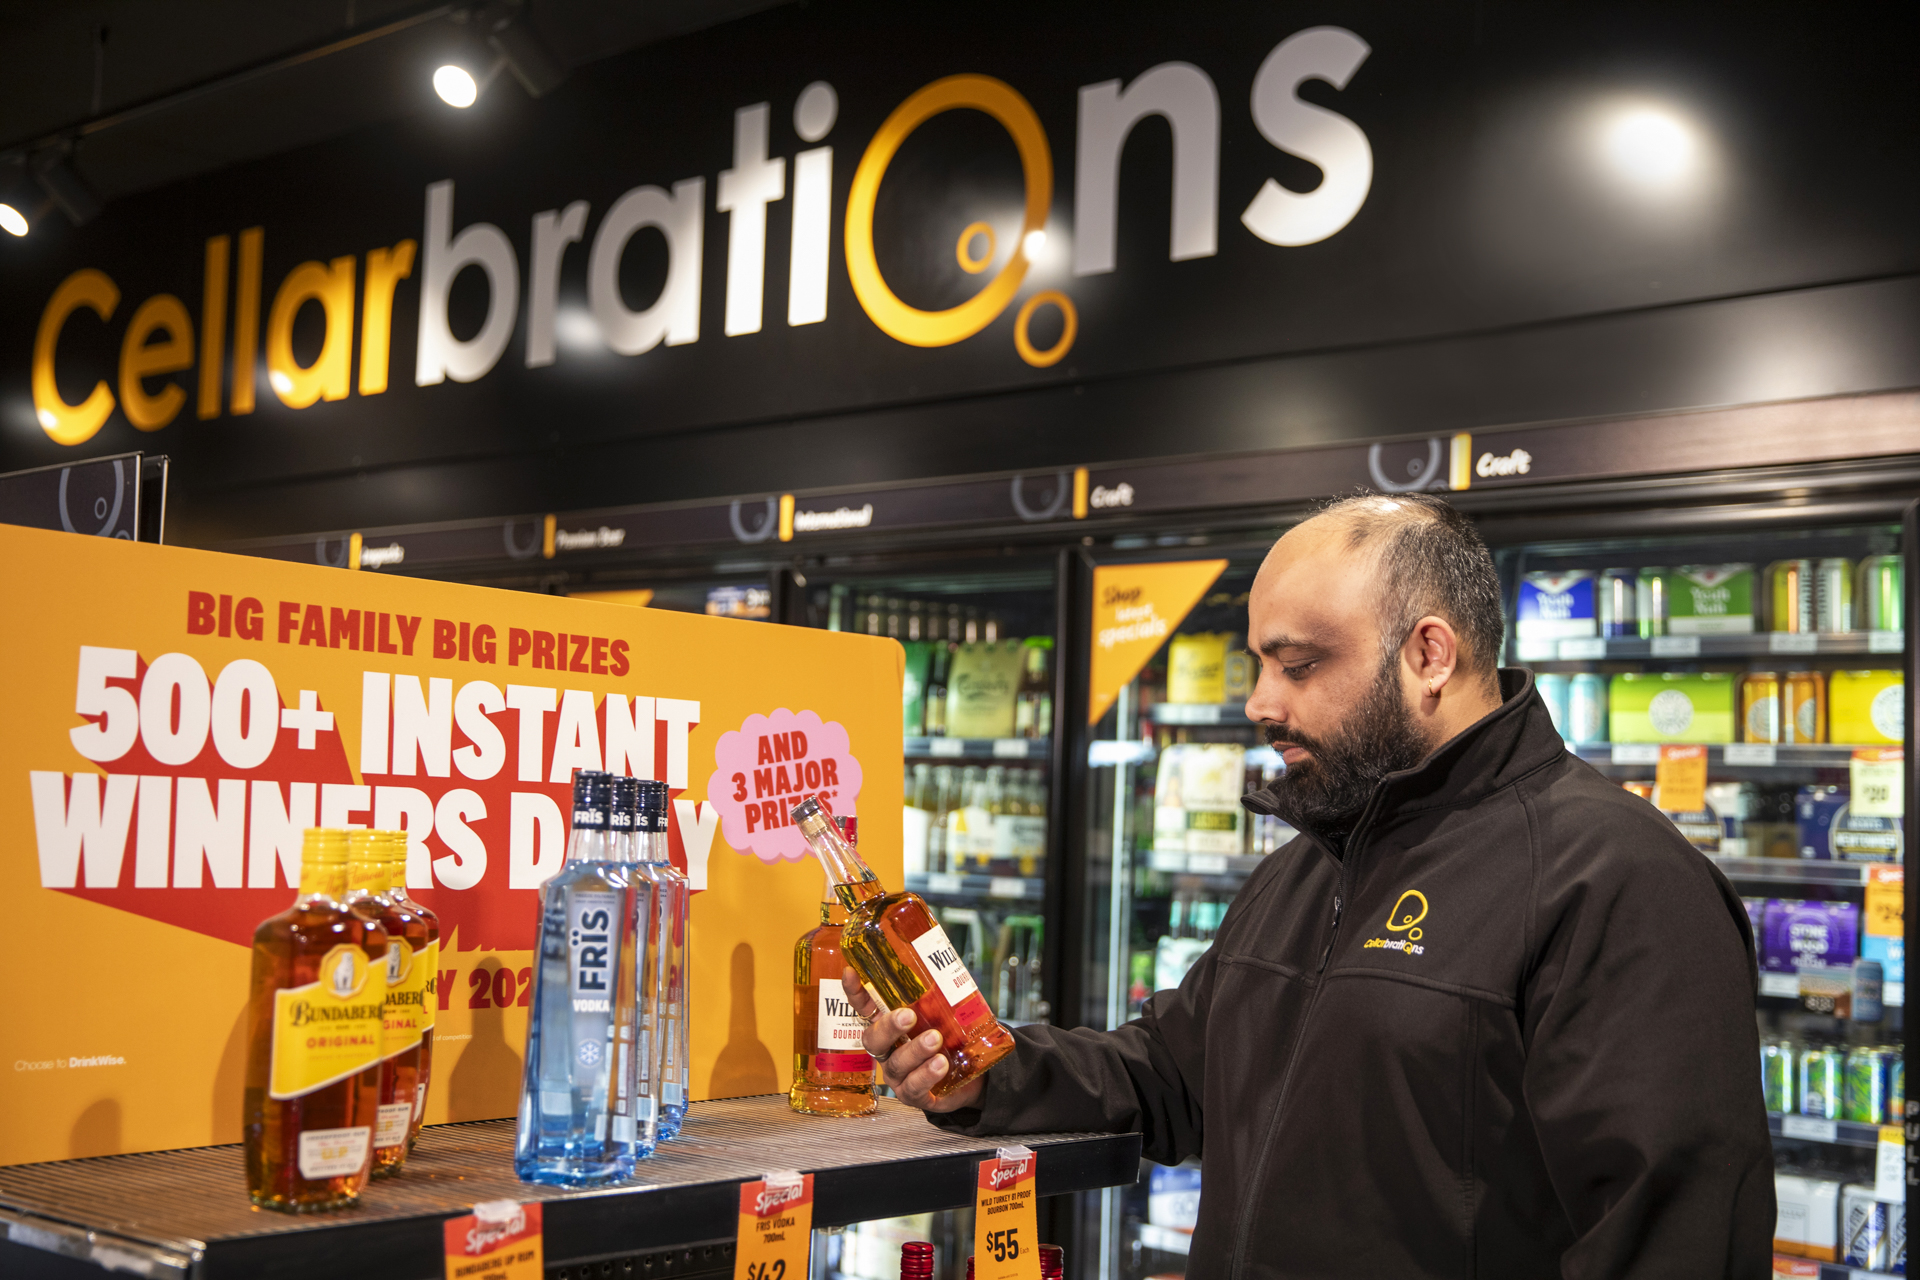
Metcash Limited is an Australian wholesale distribution and marketing company operating across the food, liquor, and hardware sectors. The company supplies and supports a network of independent retailers through three main business pillars: Food, Liquor, and Hardware. In the Food pillar, Metcash operates the IGA and Foodland banners and manages the Food Service & Convenience business, which includes the Superior Foods and Campbells & Convenience brands. The Liquor pillar comprises the Australian Liquor Marketers (ALM) division, which services hotels, restaurants, and licensed premises, alongside company-operated stores such as Cellarbrations, IGA Liquor, the Bottle-O, and the recently acquired Steve’s Liquor Warehouse. The Hardware pillar includes the Mitre 10, Home Hardware, and Total Tools brands, with the latter two merged into the Total Tools and Hardware Group to serve trade and DIY customers. Metcash provides these retailers with procurement, logistics, marketing, and operational support, operating distribution centres across mainland Australia. The company was founded in 1927 as Davids and officially adopted the Metcash name in 2000. Summarised from the company's own disclosures, fiscal year ended Apr 2026 |
Industry Consumer Staples Distribution & Retail | Homepage metcash.com |
| Sector Consumer Defensive | IR page metcash.com/investor-centre | |
|
Tags
wholesale distribution, independent retail, food service, liquor distribution, hardware retail, franchising, logistics, retail media, IGA, Foodland, Mitre 10, Home Hardware, Total Tools, Cellarbrations, IGA Liquor, the Bottle-O, Superior Foods, Campbells & Convenience, Australian Liquor Marketers, ALM, Steve’s Liquor Warehouse, Holliman’s Rural, Bianco Construction Supplies, Alpine Truss, Franklins, Home Timber & Hardware Group, Independent Hardware Group, Total Tools and Hardware Group
|
Press page — |
Metrics
| Valuation | |
|---|---|
| Market cap | A$ 3.794B |
| Market cap (USD) | $ 2.574B |
| P/E | 11.65 |
| PEG | — |
| P/BV | 1.90 |
| P/S | 0.22 |
| P/OCF | 6.80 |
| P/FCF | — |
| Dividend yield | — |
| Turnover / mcap | — |
| Returns | |
|---|---|
| ROE | 16.6% |
| ROI | 12.1% |
| ROIC | 12.1% |
| Profit margin | 1.6% |
| Growth | |
|---|---|
| Revenue growing | Yes |
| Profits growing | No |
| Revenue up 3y | — |
| Revenue up 5y | — |
| Earnings growth 3y (net profit CAGR) | — |
| Quality | |
|---|---|
| Profitable | Yes |
| Margin expanding | No |
| Buying back stock | No |
| Diluting (TTM) | No |
| Debt/Equity | 34.0% |
| Podcast bulls (TTM) | Sign up |
| Podcast bears (TTM) | Sign up |
| Podcast sentiment (TTM) | Sign up |
| Podcast sentiment % (TTM) | Sign up |
| News sentiment (TTM) | 0 |
| Quality score | 26.7% |
| Insiders | |
|---|---|
| Buys, 1w | Sign up |
| Buys, 1m | Sign up |
| Buys, 1y | Sign up |
| Sells, 1w | Sign up |
| Sells, 1m | Sign up |
| Sells, 1y | Sign up |
Sign up to see this company's insider trades
| Figure | FY 2026 | FY 2025 | FY 2024 | FY 2023 | FY 2022 | FY 2021 | FY 2020 | FY 2018 | FY 2017 | FY 2016 | FY 2015 | FY 2014 | FY 2013 | FY 2012 | FY 2011 | FY 2010 |
|---|---|---|---|---|---|---|---|---|---|---|---|---|---|---|---|---|
| Revenue | 17.354B | 17.323B | 15.912B | — | 15.165B | 14.315B | 13.025B | — | — | 13.541B | 13.37B | 13.393B | 13.095B | 12.612B | 12.462B | 11.608B |
| Net profit | 279.1M | 283.3M | 258.1M | — | 245.4M | 239M | -56.8M | — | — | 216.5M | -384.2M | 169.2M | 206M | 90M | 241.4M | 227.6M |
Operating KPIs — quarters
Business figures the company publishes beside its accounts (users, subscribers, same-store sales, production, occupancy ...), read from its results releases and reports, with the growth on the same period a year earlier beneath each: computed from the figures, and as the company states it where it does. Each figure links to its source; counts at a period end show under that period.
Operating KPIs — years
Business figures the company publishes beside its accounts (users, subscribers, same-store sales, production, occupancy ...), read from its results releases and reports, with the growth on the same period a year earlier beneath each: computed from the figures, and as the company states it where it does. Each figure links to its source; counts at a period end show under that period.
Sign up to see institutional holdings
Sign UpPodcast Mentions
Sign up to see podcast mentions and sentiment
Sign UpAnnouncements lodged with ASX, newest first, routine forms (director and substantial-holding notices, daily buy-back and quotation notices) included. The link opens the announcement on ASX. Press releases from the company's own website, newest first.
Notification regarding unquoted securities - MTS
Bull 0
Bear 0
Routine
Notification of cessation of securities - MTS
Bull 0
Bear 0
Routine


Prompts
Click prompts to add them under the company line, click again to take one out, then copy the result into your AI chat. Shared by Asian Century Stocks and Uncovered Thai Stocks. Thank you.
Metcash Limited (ticker MTS), listed in Australia.
Copied
ETFs Holding Metcash Limited
Exchange-traded funds whose newest published daily portfolio holds one of the company's listings, largest weight first.
| ETF | Weight in ETF | Shares | Market value | As of |
|---|---|---|---|---|
| ADIV | 2.25% | 590,529 | $ 1.206M | Jun 30, 2026 |
| RFDI | 0.22% | 172,512 | $ 369.02K | Jul 31, 2026 |
| DISV | 0.12% | 2,657,557 | $ 6.244M | Nov 12, 2026 |
| AVDS | 0.11% | 182,955 | $ 421.491K | Nov 16, 2026 |
| DFIS | 0.10% | 2,420,658 | $ 5.687M | Nov 12, 2026 |
| AVDE | 0.05% | 4,255,142 | $ 9.803M | Nov 16, 2026 |
| DXIV | 0.05% | 46,517 | $ 109.289K | Nov 12, 2026 |
| DFSI | 0.03% | 144,463 | $ 339.408K | Nov 12, 2026 |
| DFIC | 0.03% | 1,739,798 | $ 4.088M | Nov 12, 2026 |
| DFAX | 0.02% | 1,083,021 | $ 2.545M | Nov 12, 2026 |
| DFAI | 0.02% | 1,216,424 | $ 2.858M | Nov 12, 2026 |