Release of Securities from Voluntary Escrow
Bull 0
Bear 0
Routine
|
Kantra Copper Limited is an Australian mining company focused on copper production and mineral exploration in South Australia. The company operates the Kanmantoo Underground Copper Mine, located in the Adelaide Hills, which transitioned from open-pit to underground mining in 2024. Its primary product is copper concentrate, with gold and silver produced as by-products. The operation is supported by a processing plant and ships concentrate via Port Adelaide. Kantra also holds a portfolio of exploration licenses in south-east South Australia and is advancing the Mutooroo Copper Project in northeastern South Australia through a farm-in agreement with Havilah Resources. The company was formerly known as Hillgrove Resources and has operated the Kanmantoo mine since 2005. Summarised from the company's own disclosures, fiscal year ended Jun 2026 |
Industry Materials | Homepage kantra.com |
| Sector Basic Materials | IR page investors.kantra.com | |
|
Tags
copper mining, underground mining, copper concentrate, gold by-product, silver by-product, mineral exploration, resource expansion, farm-in agreements, Kanmantoo Copper Mine, Mutooroo Copper Project, Havilah Resources, Hillgrove Resources, Nugent, Kavanagh, Emily Star, Kanappa
|
Press page — |
Metrics
| Valuation | |
|---|---|
| Market cap | A$ 259.049M |
| Market cap (USD) | $ 177.986M |
| P/E | 13.71 |
| PEG | — |
| P/BV | 8.55 |
| P/S | 1.28 |
| P/OCF | 6.42 |
| P/FCF | — |
| Dividend yield | — |
| Turnover / mcap | — |
| Returns | |
|---|---|
| ROE | — |
| ROI | — |
| ROIC | — |
| Profit margin | — |
| Growth | |
|---|---|
| Revenue growing | Yes |
| Profits growing | Yes |
| Revenue up 3y | — |
| Revenue up 5y | — |
| Earnings growth 3y (net profit CAGR) | — |
| Quality | |
|---|---|
| Profitable | Yes |
| Margin expanding | Yes |
| Buying back stock | — |
| Diluting (TTM) | Yes |
| Debt/Equity | — |
| Podcast bulls (TTM) | Sign up |
| Podcast bears (TTM) | Sign up |
| Podcast sentiment (TTM) | Sign up |
| Podcast sentiment % (TTM) | Sign up |
| News sentiment (TTM) | 0 |
| Quality score | 33.3% |
| Insiders | |
|---|---|
| Buys, 1w | Sign up |
| Buys, 1m | Sign up |
| Buys, 1y | Sign up |
| Sells, 1w | Sign up |
| Sells, 1m | Sign up |
| Sells, 1y | Sign up |
Sign up to see this company's insider trades
| Figure | FY 2026 | FY 2025 | FY 2024 | FY 2023 | FY 2022 | FY 2021 | FY 2020 | FY 2019 | FY 2018 | FY 2017 | FY 2016 | FY 2015 | FY 2014 | FY 2013 | FY 2012 | FY 2011 | FY 2010 |
|---|---|---|---|---|---|---|---|---|---|---|---|---|---|---|---|---|---|
| Revenue | — | 167.616M | 112.388M | 0 | 0 | 0 | 20.372M | 115.24M | 180.305M | 113.315M | 113.127M | 139.501M | 166.768M | 116.605M | 11.62M | 3.176M | 3.943M |
| Net profit | — | 92K | -24.031M | -16.327M | -5.973M | -5.855M | -5.945M | -10.027M | — | — | -109.134M | — | 3.787M | -11.785M | -8.462M | -14.173M | 55.586M |
Sign up to see institutional holdings
Sign UpPodcast Mentions
Sign up to see podcast mentions and sentiment
Sign UpAnnouncements lodged with ASX, newest first, routine forms (director and substantial-holding notices, daily buy-back and quotation notices) included. The link opens the announcement on ASX. Press releases from the company's own website, newest first.
ASX:KAN - Kanmantoo Delivers 31% Ore Reserve Growth
Bull 4
Bear 0
Product/operations
Kanmantoo Delivers 31% Ore Reserve Growth
Released 26 Oct 2026 - 10:55 PM
Released 26 Oct 2026 - 10:55 PM
LikeFollowShare
27 OCTOBER 2026 KANMANTOO DELIVERS 31% ORE RESERVE GROWTH Kantra Copper Limited (Kantra or the Company) (ASX:KAN) is pleased to report a substantial increase, post depletion, in its MRE and ORE at the Company’s 100% owned Kanmantoo Copper Mine (Kanmantoo) in South Australia. Kanmantoo 2026 Ore Reserve Estimate (ORE): • 5.2 Mt @ 0.85% copper (Cu) + 0.20g/t gold (Au), containing 44kt of Cu and 33koz of Au. • Maiden underground Emily Star Reserve declared: ° 740kt @ 0.91% Cu + 0.12g/t Au containing 6.8kt Cu and 3.0koz Au. • Year-on-year (YoY) growth (from 2025): ° 31% increase in Reserve tonnes; ° 30% increase in contained Cu metal; and ° 14% increase in contained Au metal. Kanmantoo 2026 Mineral Resources Estimate (MRE): • 27Mt @ 0.71% Cu + 0.17g/t Au, containing 190kt of Cu and 150koz of Au. • Maiden underground Critchley Resource declared: ° 520kt @0.53% Cu + 0.09g/t Au containing 2.8kt Cu and 1.5koz Au. • YoY growth (from 2025): ° 22% increase in total Resource tonnes; ° 18% increase in total contained Cu metal; and ° 25% increase in total contained Au metal. Figure 1: Year on Year Tonnage growth since 2024. Data for 2025 tonnages extracted from titled ‘Hillgrove Resources Delivers Ore Reserve Extension at 1.0% CuEq*’ released 30 October 2025. Data for 2024 tonnages extracted from ‘Maiden Kanmantoo UG Reserve and 96% increase in Resource’, released on 18 October 2024 2,800 4,000 5,200 2024 2025 2026 Ore Reserves (kt) Kavanagh Nugent Emily Star Other +43% +31% +14% +22% 1 19,300 22,000 27,000 2024 2025 2026 Mineral Resources (kt)
Ask a question
100%
/ 61
1 / 61
Announcement PDF 27 OCTOBER 2026 KANMANTOO DELIVERS 31% ORE RESERVE GROWTH Kantra Copper Limited (Kantra or the Company) (ASX:KAN) is pleased to report a substantial increase, post depletion, in its MRE and ORE at the Company’s 100% owned Kanmantoo Copper Mine (Kanmantoo) in South Australia. Kanmantoo 2026 Ore Reserve Estimate (ORE): • 5.2 Mt @ 0.85% copper (Cu) + 0.20g/t gold (Au), containing 44kt of Cu and 33koz of Au. • Maiden underground Emily Star Reserve declared: ° 740kt @ 0.91% Cu + 0.12g/t Au containing 6.8kt Cu and 3.0koz Au. • Year-on-year (YoY) growth (from 2025): ° 31% increase in Reserve tonnes; ° 30% increase in contained Cu metal; and ° 14% increase in contained Au metal. Kanmantoo 2026 Mineral Resources Estimate (MRE): • 27Mt @ 0.71% Cu + 0.17g/t Au, containing 190kt of Cu and 150koz of Au. • Maiden underground Critchley Resource declared: ° 520kt @0.53% Cu + 0.09g/t Au containing 2.8kt Cu and 1.5koz Au. • YoY growth (from 2025): ° 22% increase in total Resource tonnes; ° 18% increase in total contained Cu metal; and ° 25% increase in total contained Au metal. Figure 1: Year on Year Tonnage growth since 2024. Data for 2025 tonnages extracted from titled ‘Hillgrove Resources Delivers Ore Reserve Extension at 1.0% CuEq*’ released 30 October 2025. Data for 2024 tonnages extracted from ‘Maiden Kanmantoo UG Reserve and 96% increase in Resource’, released on 18 October 2024 2,800 4,000 5,200 2024 2025 2026 Ore Reserves (kt) Kavanagh Nugent Emily Star Other +43% +31% +14% +22% 1 19,300 22,000 27,000 2024 2025 2026 Mineral Resources (kt) 2 of 61 Commenting on the Mineral Resource Estimate and Ore Reserve Estimate (MROR) update, Kantra CEO and Managing Director, Bob Fulker said: “The substantial growth in both Mineral Resources and Ore Reserves demonstrates the quality of the Kanmantoo asset and the success of our exploration and resource conversion strategy. The declaration of the maiden Emily Star Ore Reserve is a significant milestone, underpinning our decision to advance development of the deposit and providing increased confidence in its contribution to future production. Combined with the maiden Critchley Mineral Resource and continued drilling success, these outcomes further strengthen our confidence in Kanmantoo’s long-term growth potential. We see significant opportunity to continue growing our Resource base, Resource to Reserve conversion, and mine life extension.” MINERAL RESOURCE ESTIMATE The increase in the 2026 Kanmantoo MRE when compared to 2025 reflects the impact of ongoing grade control, resource definition and exploration drilling, partially offset by mining depletion and inaccessible material from the Kanmantoo underground operation. Geological domains were refined following the incorporation of new drilling data, including assays from infill holes and observations of mineralised structures underground. Structural models were also updated to reflect the latest drilling and mapping information. Key changes from the 2025 MRE to the 2026 MRE are as follows: • Emily Star: tonnage increased by 114% to 6,000kt, with a 93% uplift in contained Cu with 2,140kt converted to Measured and Indicated; • Nugent: tonnage increased by 31% to 7,100kt, with a 32% uplift in contained Cu, supported by the addition of 420kt of Measured Resource; • Kavanagh: Measured Resource increased by 9.5% to 4,600kt. East Kavanagh increased in tonnage by 35% and Cu tonnes by 25%. Central and West Kavanagh tonnage and Cu tonnes decreased by 17% and 15%, respectively, due to depletion and removal of inaccessible material with drilling locations limited down plunge due to development locations; • Grade control and resource definition drilling delivered an overall 6,400kt increase in total Resources; • The inclusion of a maiden MRE at Critchley added 520kt; and • Depletion of the MRE was 1,200kt due to underground mining operations to 30 Jun 2026 and 520kt due to reclassification of material with low prospect of economic extraction around previously mined voids. 3 of 61 Table 1: Kanmantoo Mineral Resources as at 30 September 2026 Mine Area JORC Classification Tonnes Cu Au Ag Cu Metal Au Metal (kt) (%) (g/t) (g/t) (kt) (koz) Kavanagh (including Spitfire) Measured 4,600 0.76 0.11 2.2 35 17 Indicated 2,200 0.70 0.11 2.1 16 7.7 Inferred 1 5,200 0.64 0.13 1.9 33 22 Sub-Total 12,000 0.70 0.12 2.1 84 47 North Kavanagh Measured - - - - - - Indicated 280 0.73 0.16 2.8 2.1 1.5 Inferred 2 240 0.67 0.19 2.4 1.6 1.5 Sub-Total 520 0.70 0.18 2.6 3.7 3.0 Nugent Measured 970 0.76 0.39 1.9 7.3 12 Indicated 2,300 0.75 0.35 2.1 17 25 Inferred 3 3,900 0.78 0.35 2.0 30 44 Sub-Total 7,100 0.76 0.35 2.0 55 81 Valentines Measured - - - - - - Indicated 190 0.65 0.07 1.3 1.2 0.41 Inferred 4 190 0.52 0.06 1.1 1.0 0.40 Sub-Total 380 0.58 0.07 1.2 2.2 0.81 Emily Star Measured 140 0.96 0.09 1.8 1.3 0.38 Indicated 2,000 0.74 0.09 1.7 15 5.9 Inferred5 3,900 0.67 0.07 1.4 26 9.1 Sub-Total 6,000 0.70 0.08 1.5 42 15 Critchley Measured 8.4 0.60 0.06 0.8 0.05 0.02 Indicated 380 0.54 0.10 1.2 2.1 1.2 Inferred 140 0.48 0.06 1.2 0.66 0.25 Sub-Total 520 0.53 0.09 1.2 2.8 1.5 TOTAL 27,000 0.71 0.17 1.9 190 150 Notes: 1. Due to effects of rounding, total numbers may not sum. 2. Inferred 1 – includes Kavanagh high grade Inferred; Central Kavanagh, North Kavanagh and Valentines Categorical Indicator Kriging (CIK) Inferred. 3. Inferred 2 – includes North Kavanagh high grade Inferred only. 4. Inferred 3 – includes Nugent high grade and CIK Inferred. 5. Inferred 4 – includes Valentines high grade Inferred only. 6. Inferred 5 – includes Emily Star high grade and CIK Inferred. 7. Reporting criteria are: Measured, Indicated and Inferred material (RESCAT = 1 or RESCAT = 2 or RESCAT = 3), Cu >= 0.40% (CU_PCT >= 0.4), in-situ (VOIZONE = 0) with reasonable prospects of eventual economic extraction envelope (MREZONE = 1), Reasonable Prospects for Eventual Economic Extraction (RPEEE=1). 8. Reporting rounded to 2 significant figures, after summation, except gold grades to 2 decimal places 9. Mineral Resource is reported at a 0.40% Cu cut-off grade for all mine areas. 10. Mineral Resource is depleted for mining to 30 June 2026. 11. Mine depletion refers to the current Kanmantoo underground operation, and historical Giant, Nugent and Emily Star open pits. 4 of 61 Figure 2: Waterfall chart of MRE Tonnage Changes (kt) Figure 3: Waterfall chart of MRE Cu Metal Tonnage Changes (kt) 22,000 6,400 (1,200) (520) 520 27,000 2025 MRE Drilling Depletion RPEEE Reduction New Mine Areas 2026 MRE Mineral Resource Estimate 2025 to 2026 - Tonnage Change (kt) 42 (11) (4) 3 190 160 2025 MRE Drilling Depletion No RPEEE New Mine Areas 2026 MRE Mineral Resource Estimate 2025 to 2026 - Contained Cu Metal Change (kt) 5 of 61 ORE RESERVE ESTIMATE The increase in the 2026 Kanmantoo ORE compared to the 2025 estimation reflects the impact of ongoing grade control drilling and greater knowledge from another year of underground operations. The increase has been partially offset by mining depletion. Mining parameters have been refined based on current operational achievements. Key changes from the 2025 ORE to the 2026 ORE are summarised below: • Inclusion of the 2026 MRE; • Depletion of 1,400 kt of ore from the 2025 ORE. This is below the actual tonnage mined during the period due to additional out of Reserve stopes being identified and mined within the year, overbreak in large stopes or changes to the stope designs; • Addition of the Emily Star Orebody and extension of Kavanagh in the East and North Kavanagh areas of the mine; and • Stope modifying factors have been updated to reflect observed overbreak and the associated addition of low-grade material. Table 2: Kanmantoo Ore Reserves as at 01 July 2026 Mine Area Classification Tonnes (kt) Cu (%) Au (g/t) Ag (g/t) CuEq (%) Cu Metal (kt) Au Metal (koz) Kavanagh (including Spitfire and North Kavanagh) Proved 1,800 0.90 0.12 2.3 1 16 7.0 Probable 1,000 0.80 0.13 2.3 0.9 8.2 4.3 Sub-Total 2,800 0.87 0.13 2.3 1 24 11 Nugent Proved 630 0.79 0.39 1.9 1 5.0 7.9 Probable 1,000 0.77 0.32 2.0 1 7.7 10 Sub-Total 1,600 0.78 0.35 1.9 1 13 18 Emily Star Proved 87 0.99 0.09 1.9 1 0.9 0.3 Probable 660 0.90 0.13 2.2 1 5.9 2.7 Sub-Total 740 0.91 0.12 2.2 1 6.8 3.0 Total Ore Reserves Proved 2,500 0.88 0.19 2.2 1 22 15 Probable 2,700 0.81 0.20 2.2 0.9 22 17 Total 5,200 0.85 0.20 2.2 1 44 33 Notes: 1. Dry metric tonnes. 2. Stope cut-off grade 0.8% CuEq (Copper Equivalent) to define development limits, 0.6% CuEq for stopes along defined development. Development cut-off grade 0.4% Cu. Minimum stoping widths of 4m true width. 3. Reported Ore Reserves do not include any diluting Inferred or Unclassified material. The Mine Schedule includes 499kt at 0.35% Cu of non-Reserving material that is mined as unavoidable dilution or is a sterilisation shell around extracted stopes. 4. Reported grades are rounded to two significant figures. Tonnes are rounded to two significant figures. Copper equivalent to one significant figure as for reporting, recoveries and payabilities are averaged values and so have a lower accuracy. 6 of 61 5. Any minor apparent discrepancies for sums in the table are due to rounding. 6. The period of economic extraction is from July 2026 to December 2029. 7. Ore Reserves are converted from Mineral Resource Estimates based on the 2026 Mineral Resource Estimate, reported herewith. 8. Competent Person: Huw Wright MAusIMM (#3078867) with technical review by Mark Hamilton FAusIMM (#221080). 9. Over 30 months of mining actual data demonstrates very good ground conditions. It is expected that this will continue, with Geotech modelling demonstrating stability over modelled life of mine. Copper equivalent includes Cu and Au. The calculation expresses recovered and payable Au value as an equivalent in-situ Cu grade. Driving values are Cu = US$4.20/lb, Au = US$3,250/oz; metallurgical recoveries are Cu Rec = 95.8%, Au Rec = 54.9%; and payabilities are Cu Pay 95%, Au Pay 90%. CuEq (%) = Cu (%) + 100 × [(Au (g/t) ÷ 31.1034 × Au Rec × Au Pay × Au price)] ÷ [Cu price (US$/t) × Cu Rec × Cu Pay]. It is Kantra’s view that all metals within this formula will be recovered and sold. Metallurgical recoveries are based on current plant performance. Metal payability is based on current concentrate quality and contracted marketing terms. 7 of 61 Figure 4: 2026 Ore Reserve Mine Plan viewed to the West Figure 5: Kanmantoo ORE contained Tonnage change (2025 to 2026) Figure 6: Kanmantoo ORE contained Cu metal change (2025 to 2026) 4,000 (1,400) 100 5,200 2,500 2025 ORE Depletion Updated MRE and Mine Plan Modifying Factors 2026 ORE Ore Reserve Estimate 2025 to 2026 - Tonnage (kt) (12) 24 (1) 44 34 2025 ORE Depletion Updated MRE and Mine Plan Modifying Factors 2026 ORE Ore Reserve Estimate 2025 to 2026 - Cu Metal Tonnage (kt) 9 of 61 Authorised for release by the Board of Kantra Copper Limited. Engage with this announcement at the Kantra Copper Investor Hub. For more information contact: Mr Bob Fulker Mr Luke Anderson Chief Executive Officer & Managing Director Chief Financial Officer & Joint Company Secretary T: +61 (0)8 7070 1698 T: +61 (0)8 7070 1698 Ms Jane Brunton Head of Investor Relations & Growth T: +61 (0)8 7070 1698 E: [email protected] Forward Looking Statement This Report contains or may contain certain forward-looking statements and comments about future events, that are based on Kantra's beliefs, assumptions and expectations and on information currently available to management as at the date of this announcement. Often, but not always, forward-looking statements can generally be identified by the use of forward-looking words such as "may", "will", "expect", "plan", "believes", "estimate", "anticipate", "outlook", and "guidance", or similar expressions, and may include, without limitation, statements regarding plans, strategies and objectives of management, anticipated production and production potential, financial forecasts, product quality estimates of future Mineral Resources and Ore Reserves. Such statements are only expectations or beliefs and are subject to inherent risks and uncertainties which could cause actual values, results or performance achievements to differ materially from those expressed or implied in this announcement. Where Kantra expresses or implies an expectation or belief as to future events or results, such expectation or belief is expressed in good faith and on a reasonable basis. No representation or warranty, express or implied, is made by Kantra that the matters stated in this announcement will in fact be achieved or prove to be correct. Except as required by law, Kantra undertakes no obligation to provide any additional or updated information or update any forward-looking statements whether as a result of new information, future events, results or otherwise. Readers are cautioned against placing undue reliance on forward-looking statements. These forward-looking statements are not guarantees of future performance and involve known and unknown risks, uncertainties, assumptions and other important factors, many of which are beyond the control of Kantra, the directors, and management of Kantra. These factors include, but are not limited to difficulties in forecasting expected production quantities, the potential that any of Kantra's projects may experience technical, geological, metallurgical and mechanical problems, changes in market prices and other risks not anticipated by Kantra, changes in exchange rate assumptions, changes in product pricing assumptions, major changes in mine plans and/or resources, changes in equipment life or capability, emergence of previously underestimated technical challenges, increased costs, and demand for production inputs. 10 of 61 Competent Person's Statement The information in this report that relates to the 2024 Kanmantoo Mineral Resource Estimate is extracted from ASX release titled ‘Maiden Kanmantoo Underground Ore Reserve and 96% Increase in Copper Mineral Resource Endowment’ dated 18 October 2024 and is available to view at www.kantra.com. The Company confirms that it is not aware of any new information or data that materially affects the information included in the original market announcement and that all material assumptions and technical parameters underpinning the Mineral Resource Estimate in the relevant market announcement continue to apply and have not materially changed. The Company confirms that the form and context in which the Competent Person's findings are presented have not been materially modified from the original market announcements. The information in this report that relates to the 2025 Kanmantoo Mineral Resource Estimate is extracted from ASX release titled ‘Hillgrove Resources Delivers Ore Reserve Extension at 1.0% CuEq*’ dated 30 October 2025 and is available to view at www.kantra.com. The Company confirms that it is not aware of any new information or data that materially affects the information included in the original market announcement and that all material assumptions and technical parameters underpinning the Mineral Resource Estimate in the relevant market announcement continue to apply and have not materially changed. The Company confirms that the form and context in which the Competent Person's findings are presented have not been materially modified from the original market announcements. The information in this report that relates to Exploration Targets, Exploration Results, Historic Mineral Resources and all data inputs including domain models for the 2026 Mineral Resource Estimation is based on information compiled by Caitlin Rowett, a Competent Person who is a Member of The Australasian Institute of Mining and Metallurgy (MAusIMM CP (Geo)). Caitlin Rowett is a full-time employee of the company and holds equity in Kantra Copper Limited. Caitlin Rowett has sufficient experience that is relevant to the style of mineralisation and type of deposit under consideration and to the activity being undertaken to qualify as a Competent Person as defined in the 2012 Edition of the Australasian Code for Reporting of Exploration Results, Mineral Resources and Ore Reserves. Caitlin Rowett has consented to the inclusion in the release of the matters based on their information in the form and context in which it appears. The information in this report that relates to the 2026 Kanmantoo Mineral Resource Estimation for Kavanagh, North Kavanagh, Emily Star, Critchley, Nugent and Valentines is based on information compiled by Sonia Konopa, a Competent Person who is a Fellow of The Australasian Institute of Mining and Metallurgy. Sonia Konopa is a full- time employee of ERM (and part of the ERM Technical Mining Services team) who were engaged to produce the Mineral Resource Estimate. Sonia Konopa has sufficient experience that is relevant to the style of mineralisation and type of deposit under consideration and to the activity being undertaken to qualify as a Competent Person as defined in the 2012 Edition of the Australasian Code for Reporting of Exploration Results, Mineral Resources and Ore Reserves. Sonia Konopa has consented to the inclusion in the release of the matters based on their information in the form and context in which it appears. The information in the report to which this statement is attached that relates to Ore Reserves is based on information compiled by Huw Wright a Competent Person who is a Member of The Australasian Institute of Mining and Metallurgy. Huw Wright is a full-time employee of Kantra Copper. Huw Wright holds equity in Kantra Copper. Huw Wright has sufficient experience that is relevant to the style of mineralisation and type of deposit under consideration and to the activity being undertaken to qualify as a Competent Person as defined in the 2012 Edition of the ‘Australasian Code for Reporting of Exploration Results, Mineral Resources and Ore Reserves’. Huw Wright consents to the inclusion in the report of the matters based on his information in the form and context in which it appears. 11 of 61 APPENDIX A - SUMMARY OF THE MINERAL RESOURCE ESTIMATE Mineral Resource Estimation Methodology All mine areas reported in the 2026 MRE have been subjected to additional drilling or reinterpretation since the 2025 MRE. These include the down dip and along strike extensions of the Kavanagh Deposit, which includes the West, 12 of 61 Central and East Kavanagh zones, the Spitfire and the South-West Kavanagh zones (all mined within the Giant Open Pit), the North Kavanagh deposit (un-mined), Critchley, the Valentines deposit and a major update to Emily Star. Figure 7 shows a plan view of the Cu-Au mine areas at Kanmantoo and their spatial location. Within the Kanmantoo mineralised system, six areas now have Mineral Resource Estimates – Kavanagh (including Spitfire), North Kavanagh, Nugent (including Saddle Zone), Valentines, Critchley and Emily Star. The 2026 MRE includes minor unnamed zones which are incorporated into the adjacent lodes due to proximity to planned mine infrastructure. 13 of 61 Figure 7: Plan view showing the location of the Kanmantoo Mineral Resource Estimate Specifically, for the 2026 MRE update incorporating Kavanagh, Nugent, North Kavanagh, Valentines, Critchley and Emily Star deposits, the following activities have taken place: • 2,301 drillholes, representing 390,850 drill metres, have been utilised in the estimation. • The increase in the number of drill hole intervals included in the Kanmantoo 2026 MRE is a result of the inclusion of the underground and surface diamond drilling results received to 3 August 2026. • Underground drilling since the 2025 Kanmantoo MRE was focused on Kavanagh, Spitfire, Nugent and Emily Star. • Of the assays used for the 2026 MRE, 42,743 are underground drill hole samples with the whole sample interval crushed to <2mm, rotary split, screened to <1mm and sub-split for Cu assay by bench-mounted Portable XRF (PXRF). There is no Au assay for these samples. Rigorous Quality Assurance & Control (QA/QC) of the PXRF Cu assays against whole sample duplicates assayed by an external laboratory was undertaken, with 4-acid digest and Inductively Coupled Plasma Mass Spectrometry (ICP-MS) analysis verifying the accuracy and precision of the PXRF process for Cu values. 131,740 samples have been assayed externally for multi-elemental analysis using 4-acid digestion including Au. The 2026 Kanmantoo MRE estimated Cu, Au, silver (Ag), bismuth (Bi), sulphur (S) and iron (Fe) for all named deposits have been estimated using an Ordinary Kriged (OK) method by experts from ERM. The estimation process to assign the Cu, Au, Ag, Bi, S and Fe grades to a 3D grid of panels through the respective deposits from the data collected by sampling of Reverse Circulation (RC) percussion and diamond drill holes. All surface drilling (diamond and RC) and underground grade control and resource definition diamond drill holes drilled by Kantra up until 3 August 2026 have been used to estimate the block grades in the MRE. No open pit grade control data have been used in the estimation of the spatial continuity or grade estimate but have been used to assist interpreting the general trends of the mineralised zones. Mapping and Spectral Infra-red (IR) data collected from underground development has also been used to assist with the interpretation of the mineralised zones. Prior to estimation below detection limit assays were assigned a positive value of half of the detection limit for the relevant grade variable. Intentionally unsampled intervals, within the ESTZONE (domain), have been assigned half detection for Cu and assigned a capped mean for Au, Ag, Bi, S and Fe values dependent on the domain. Unsampled intervals outside the lode domains have been assigned half the detection limit for the method. Geological domains were interpreted in 3D at each deposit by Kantra geologists based on the drill hole mineralisation and alteration boundaries and observations, including mapping from the underground mine/open pits. A grade threshold of 0.2% Cu, in conjunction with geology, was used to compile the mineralised domains. ERM reviewed the Kantra interpretations prior to accepting them for use in the resource estimation. In order to capture the significant amount of Cu grade intercepts lying outside of the mineralised zone ‘ore’ wireframe interpretations, a grade based Categorical Indicator Kriging (CIK) process was implemented by ERM to define additional mineralised zone domain codes in the ‘waste’ material. A 0.2% Cu grade indicator value was chosen to correspond with the nominal mineralised zone wireframe COG adopted by Kantra. While ERM considers that the volume of additional Cu mineralisation defined through this process appears geologically reasonable, a certain degree of uncertainty is associated with the orientation of these volumes defined in the block model. These volumes outside of the defined and wireframed mineralised zones, should therefore be considered to have a lower geological confidence, and are classified accordingly. Sample populations were statistically analysed to derive estimation domain groupings for Cu, Bi, Fe, Au, Ag, S and density based on the estimation domains. Statistical analysis included comparison of global grade distributions, 14 of 61 derivation of statistical correlations between grade variables and contact analysis of grade variables across the various geological domains. Samples were composited to a 1m length to correspond to the nominal sample length in the sample database within the estimation domains, and was supported by a review of sample length data. Residual retention was used so that no sampled intervals were omitted from the final composite dataset. Grade capping analysis of the composited samples was completed to determine grade capping values as appropriate for each variable to be estimated. Spatial restrictions were also used to manage the influence of outliers on the grade estimates. Variogram models were completed for the grade variables Cu, Au, Ag, Bi, S, Fe and density within their appropriate estimation domains. Estimation domains were combined for variogram evaluation in cases where either an insufficient number of samples were available for a reliable analysis, or the domains were volumetrically minor. Analysis and modelling were undertaken using Snowden Supervisor software. No weightings were applied to the variables before generation of the variogram models. Variograms were modelled from the capped composite data for each of the variables. A normal scores transform was applied for variogram modelling, with a back-transform to real space applied before using the variogram models in grade estimation. Quantitative Kriging Neighbourhood Analysis (QKNA) was undertaken to assess the effect of changing key kriging neighbourhood parameters on block grade estimates. The Kriging Efficiency and Slope of Regression were determined for a range of block sizes, minimum/maximum samples and search size. The QKNA results were used in conjunction with the common drill grid spacings and the morphology of the mineralised zones to determine final estimation parameters. This allowed some generalisation of sample selection parameters to be used in estimation. For simplicity, grade variables other than the primary economic variable, Cu, utilised the Cu estimation parameters. For the 2026 MRE, ERM conducted sensitivity testing of refinements to the estimation parameters against the performance of the grade control model. This resulted in a generally narrower search in the minor direction compared to previous MREs, as well as local refinements to the trend surfaces used to guide the orientation of the estimation search. Estimation for Cu, Bi, Fe, Au, Ag, S and density was undertaken via Ordinary Kriging (OK), with concurrent check estimates using Inverse Distance (ID) and Nearest Neighbour (NN), for each variable, using the capped composite files within each estimation domain. All grade variables employ a three-pass search strategy, based on an expanding search ellipse. A variable search ellipse orientation strategy was implemented via Datamine Studio’s DA functionality during grade estimation to honour the local undulations in the mineralisation orientation. The density estimate utilises a similar sample selection strategy but is restricted to two search passes due to the limited nature of the sampling for this variable. For waste domains a ‘coarse’ block model prototype was used (5mE by 20mN by 20mZ) as the block model for all OK and ID interpolated variables. For mineralised domains a‘fine’block model prototype was used (2.5mE by 10mN by 10mZ) as the block model for all OK and ID interpolated variables. For the NN estimates a ‘very high’ resolution block model was used (1.25mE by 5mN by 5mZ) as the block model, allowing the NN model to act as a proxy for a de-clustered reference grade distribution. The resource block model is a rotated model to align with the overall orientation of the deposits and be compatible with the operations grade control model. Each estimation domain was interpolated separately with all estimation domain boundaries treated as hard boundaries, as determined from analysis of contact plots and cumulative distribution function (CDF) plots. The model grades from the OK estimate were used as the final grades for all interpolated variables. The ID grade estimates have been used for model check estimate purposes only and are not reported. To fully populate the block 15 of 61 model with grade values, un-estimated blocks for Cu, Bi, Fe, Au, Ag, S were assigned the same default grades as for un-assayed drillhole samples. Final block values were validated by way of visual review of plans and cross sections (block model and drill samples presented with same colour legend), swath plots, and comparison of estimation domain mean grades with the input grade distribution data and the declustered grade distributions represented by the NN block model. Iterative checks by Kantra geologists of the output model against the site grade control model were used to refine the estimation strategy. The Mineral Resource has been classified in accordance with guidelines of the JORC Code. The classification applied reflects the Competent Person’s view of the confidence that should be assigned to the Mineral Resources reported. The following approach was adopted in classifying the Mineral Resource. • Initially data quality was assessed. ERM considers that data quality of the modern data is of suitable standard to allow the delineation of Measured, Indicated and Inferred resources. Model areas informed by a larger proportion of historical data are largely mined out and are not relevant to the current MRE. • Geological continuity was assessed. Given the geometry of the mineralisation, and geological complexity of the deposit, ERM considers that a drill spacing of approximately 80m along strike by 80m downdip is required to enable the broad architecture of the deposit to be discerned prior to development of preliminary mine designs. • Historically, Inferred resources were defined as material contained within the mineralisation wireframe volume on the basis that extrapolation from the nearest drillhole intercept was typically in the order of 80m. Classification was applied via direct coding of the model cells based on this logic. With increased deeper drilling across the project, there are some domains with unclassified material at depth. For those domains, wireframes were constructed using strings digitised in a plane oriented approximately parallel to each mineralised structure. Model cells within the wireframes were flagged as Inferred. • Indicated resources were defined as areas within the mineralisation domains where 2 drillholes were consistently found within 40m and slope of regression for Cu interpolation was consistently greater than 0.3. This was applied by digitising str
Open panelView summary and Q&As
Summary
Share your feedback
How likely is it that you would recommend Kantra Copper to another investor?
Likely
Neutral
Unlikely
0 responses
Questions (0)
Post question
Your question will be sent privately to Kantra Copper. The company may choose to make this question public.
Start the conversation
Ask Kantra Copper a question about this announcement.
Discover
[
Presentation - International Mining and Resources Conference
Released 26 Oct 2026 - 10:56 PM](https://investors.kantra.com/announcements/a32xv1-presentation-international-mining-and-resources-conference)
[
High-Grade Intersections Extend Emily Star Mineralisation
Released 22 Oct 2026 - 10:16 PM](https://investors.kantra.com/announcements/zXYMoL-high-grade-intersections-extend-emily-star-mineralisation)
[
Quarterly Report for 30 September 2026
Released 20 Oct 2026 - 10:27 PM](https://investors.kantra.com/announcements/Nwbzpd-quarterly-report-for-30-september-2026)
Summary
Summary
Questions (0)
Provide feedback to Kantra Copper. Complete survey to view results.
How likely is it that you would recommend Kantra Copper to another investor?
Likely
Neutral
Unlikely
0 responses
Post question
Your question will be sent privately to Kantra Copper. The company may choose to make this question public.
Start the conversation
Ask Kantra Copper a question about this announcement.
Share your feedback
How likely is it that you would recommend Kantra Copper to another investor?
Likely
Neutral
Unlikely
0 responses
Discover
[
Presentation - International Mining and Resources Conference
Released 26 Oct 2026 - 10:56 PM](https://investors.kantra.com/announcements/a32xv1-presentation-international-mining-and-resources-conference)
[
High-Grade Intersections Extend Emily Star Mineralisation
Released 22 Oct 2026 - 10:16 PM](https://investors.kantra.com/announcements/zXYMoL-high-grade-intersections-extend-emily-star-mineralisation)
[
Quarterly Report for 30 September 2026
Released 20 Oct 2026 - 10:27 PM](https://investors.kantra.com/announcements/Nwbzpd-quarterly-report-for-30-september-2026)
We value your privacy
We use cookies, including those from select third parties, to enhance your experience on our website and to help improve our services as specified in our Privacy Policy.
By clicking "Accept all", you consent to our use of cookies.
Our cookie notice lists every cookie we set, what it does and how long it lasts.
Closing this window accepts our default settings. You can change them at any time from cookie settings.
Accept allReject allCustomise settings
ASX:KAN - Presentation - International Mining and Resources Conference
Bull 0
Bear 0
Routine
Presentation - International Mining and Resources Conference
Released 26 Oct 2026 - 10:56 PM
Released 26 Oct 2026 - 10:56 PM
LikeFollowShare
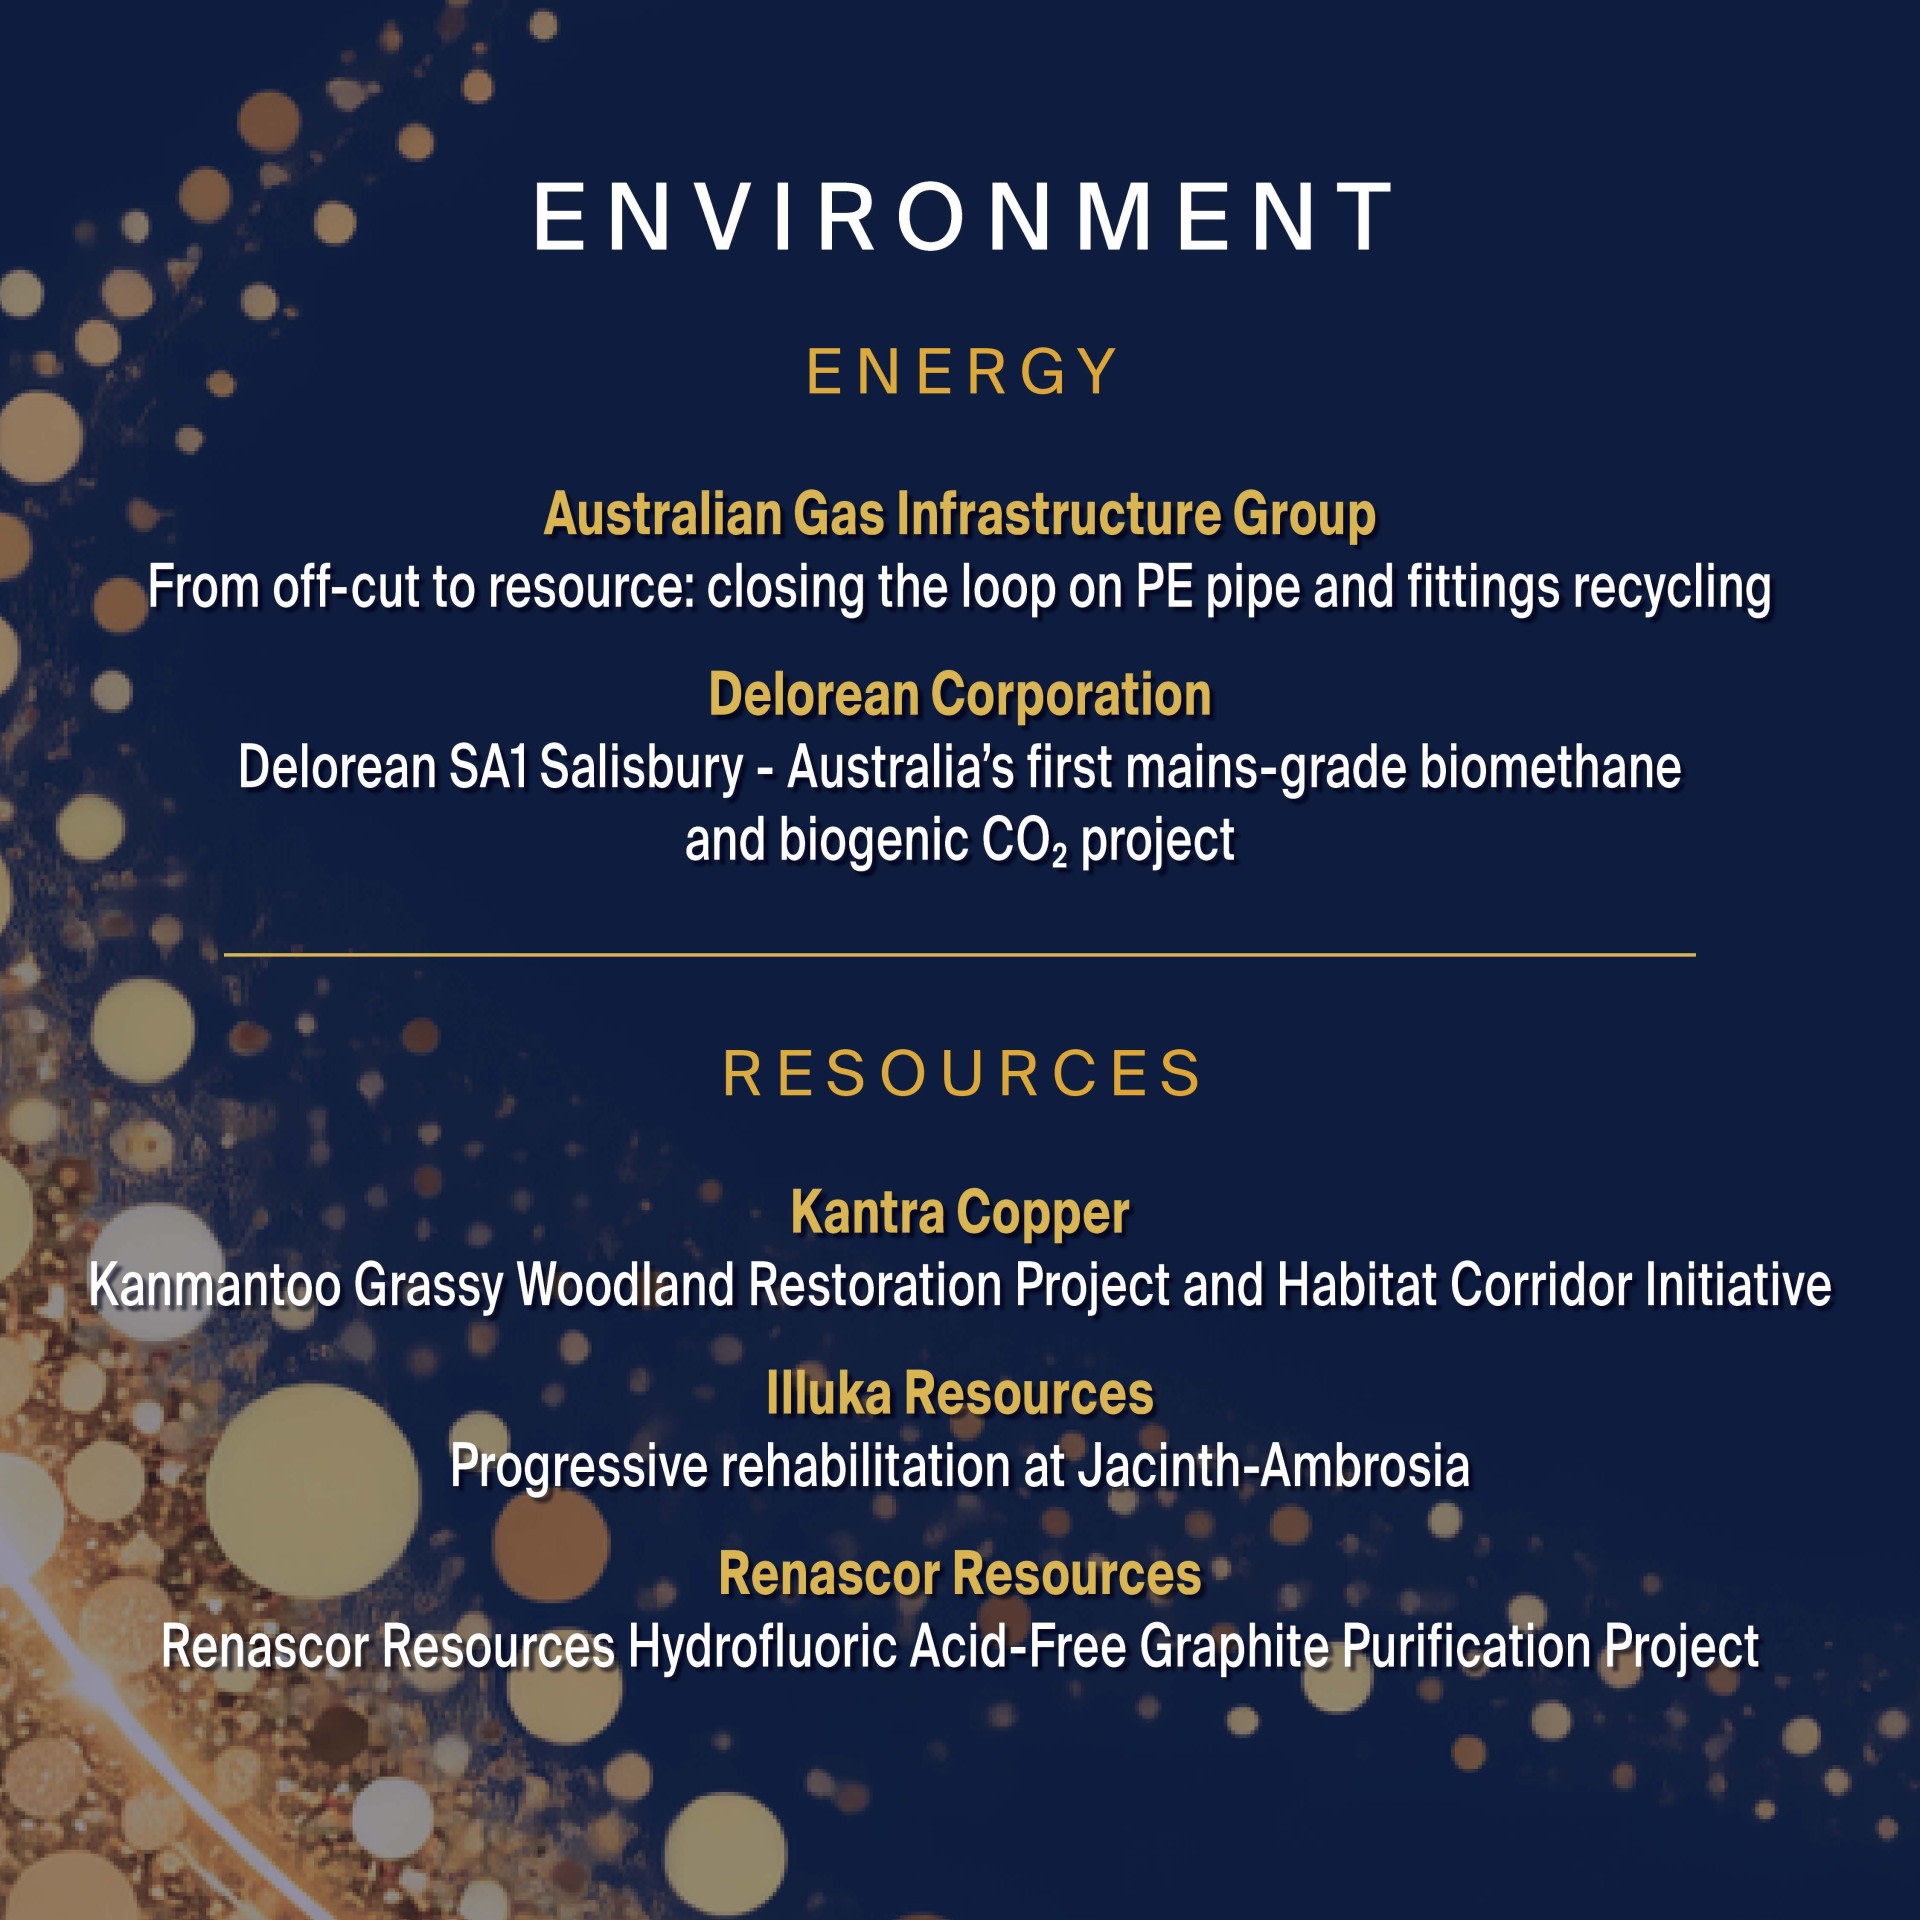
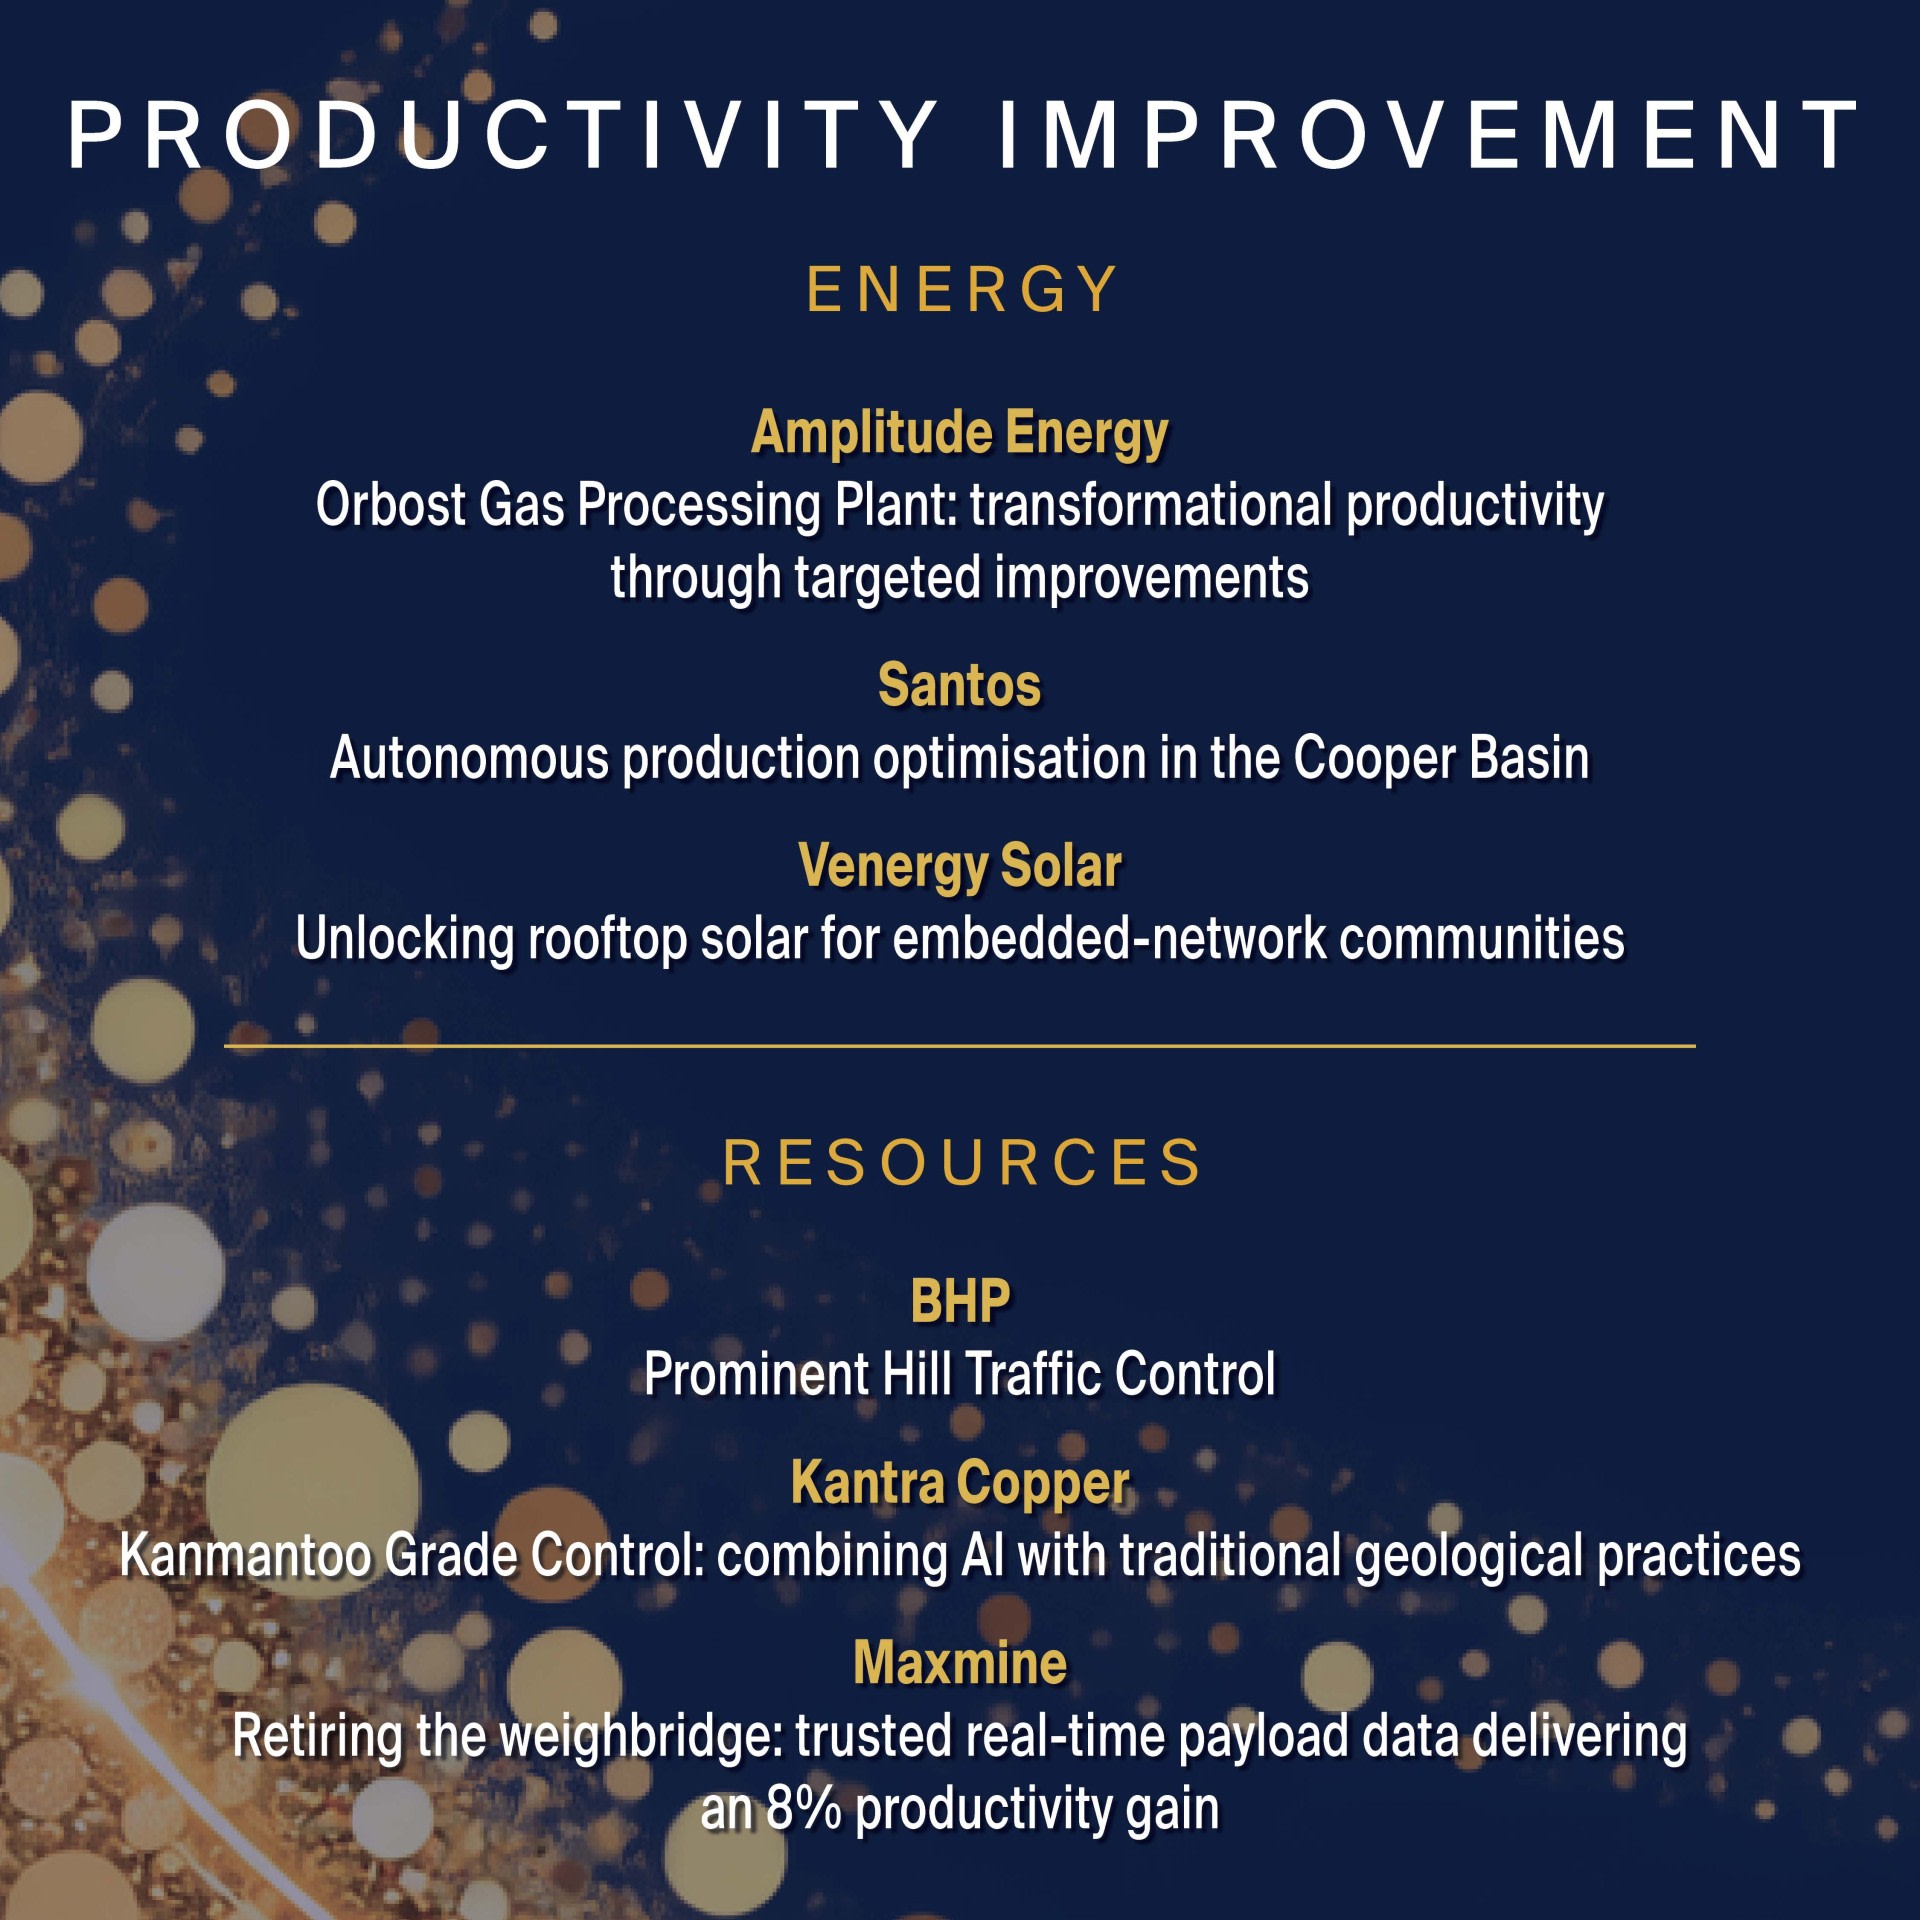
1 of 1 27 OCTOBER 2026 PRESENTATION - INTERNATIONAL MINING AND RESOURCES CONFERENCE Kantra Copper Limited (Kantra or Company) (ASX:KAN) encloses the presentation to be delivered by Kantra’s CEO & Managing Director, Bob Fulker, at the International Mining and Resources Conference (IMARC) at 03:35pm (AEDT) on Tuesday, 27 October 2026. The presentation contains two videos, which are available at the links below: • Kantra 2026 Corporate Video: https://youtu.be/5LmkbEuHpQY • Kantra - 2026 Kanmantoo Mineral Resource and Ore Reserve 3D Visualisation: https://youtu.be/ybOS96zGQE4 Authorised for release by the Board of Kantra Copper Limited. Engage with this announcement at the Kantra Copper Investor Hub.





Prompts
Click prompts to add them under the company line, click again to take one out, then copy the result into your AI chat. Shared by Asian Century Stocks and Uncovered Thai Stocks. Thank you.
KANTRA COPPER LIMITED (ticker KAN), listed in Australia.
Copied
Company History
Name and ticker changes, and re-registrations under a new regulatory id. When a ticker stopped being used is not recorded, so former tickers are undated.
| Date | Change | Detail |
|---|---|---|
| Aug 27, 2026 | Renamed | Hillgrove Resources Limited → KANTRA COPPER LIMITED |
| Aug 27, 2026 | Continues | Continues HGO as KAN: the same business renamed or reorganised. Its figures from before are this company's. |
ETFs Holding KANTRA COPPER LIMITED
Exchange-traded funds whose newest published daily portfolio holds one of the company's listings, largest weight first.