Change in substantial holding
Bull 0
Bear 0
Routine
Fiscal year ends March
Quarters are offset from the calendar — Q1 is Apr–Jun
|
James Hardie Industries plc manufactures fiber cement building products, specializing in home exterior solutions such as siding, trim, and panels. The company operates in North America, Europe, Australia, and New Zealand, serving homeowners and construction professionals. Its primary brand, Hardie, includes products such as Hardie Plank, Hardie Artisan Siding, Hardie Panel, and Hardie Trim. The company utilizes ColorPlus Technology for color application and offers the Hardie Designer tool for project visualization. James Hardie developed modern fiber cement technology in the 1980s. It maintains a distribution partnership with Boise Cascade in the United States and collaborates with Habitat for Humanity for community rebuild efforts. The company produces noncombustible siding materials that hold a Class A fire rating. Summarised from the company's own disclosures, fiscal year ended Oct 2026 |
Industry Materials | Homepage jameshardie.com |
| Sector Basic Materials | IR page ir.jameshardie.com/overview/default.aspx | |
|
Tags
fiber cement, siding, home exteriors, trim, panels, building products, residential construction, Hardie, Hardie Plank, Hardie Artisan Siding, Hardie Panel, Hardie Trim, Hardie Trim Batten, ColorPlus Technology, Hardie Designer, James Hardie ALLIANCE, Trim-Over Method
|
Press page — |
Metrics
| Valuation | |
|---|---|
| Market cap | A$ 24.098B |
| Market cap (USD) | $ 16.23B |
| P/E | -45.42 |
| PEG | — |
| P/BV | — |
| P/S | 13.51 |
| P/OCF | 107.08 |
| P/FCF | — |
| Dividend yield | — |
| Turnover / mcap | — |
| Returns | |
|---|---|
| ROE | — |
| ROI | — |
| ROIC | — |
| Profit margin | -29.7% |
| Growth | |
|---|---|
| Revenue growing | Yes |
| Profits growing | No |
| Revenue up 3y | — |
| Revenue up 5y | — |
| Earnings growth 3y (net profit CAGR) | — |
| Quality | |
|---|---|
| Profitable | No |
| Margin expanding | No |
| Buying back stock | — |
| Diluting (TTM) | — |
| Debt/Equity | — |
| Podcast bulls (TTM) | Sign up |
| Podcast bears (TTM) | Sign up |
| Podcast sentiment (TTM) | Sign up |
| Podcast sentiment % (TTM) | Sign up |
| News sentiment (TTM) | 0 |
| Quality score | -44.4% |
| Insiders | |
|---|---|
| Buys, 1w | Sign up |
| Buys, 1m | Sign up |
| Buys, 1y | Sign up |
| Sells, 1w | Sign up |
| Sells, 1m | Sign up |
| Sells, 1y | Sign up |
Operating KPIs — quarters
Business figures the company publishes beside its accounts (users, subscribers, same-store sales, production, occupancy ...), read from its results releases and reports, with the growth on the same period a year earlier beneath each: computed from the figures, and as the company states it where it does. Each figure links to its source; counts at a period end show under that period.
Operating KPIs — years
Business figures the company publishes beside its accounts (users, subscribers, same-store sales, production, occupancy ...), read from its results releases and reports, with the growth on the same period a year earlier beneath each: computed from the figures, and as the company states it where it does. Each figure links to its source; counts at a period end show under that period.
Podcast Mentions
Announcements lodged with ASX, newest first, routine forms (director and substantial-holding notices, daily buy-back and quotation notices) included. The link opens the announcement on ASX. Material events reported to the SEC on Form 8-K or 6-K, newest first. The link opens the filing itself on EDGAR. Press releases from the company's own website, newest first.
Change in substantial holding
Bull 0
Bear 0
Routine
Change of Director's Interest Notice
Bull 0
Bear 0
Routine
Change in substantial holding
Bull 0
Bear 0
Routine
Becoming a substantial holder
Bull 0
Bear 0
Routine
Change in substantial holding
Bull 0
Bear 0
Routine
Q2 FY27 Results Pack
Bull 6
Bear 0
Results
Statement of CDIs on issue - JHX
Bull 0
Bear 0
Routine
James Hardie Industries plc. — Results of Operations and Financial Condition
Bull 5
Bear 0
Results
On November 5, 2026, James Hardie Industries plc (the “Company”) released earnings information for the fiscal quarter ended September 30, 2026, as well as updated fiscal year 2027 guidance. A copy of the press release is furnished as Exhibit 99.1 to this report.
November 5, 2026
Second Quarter Net Sales of $1.564 Billion, including discontinued operations
Second Quarter Highlights (Continuing Operations)
Net Sales of $1.428 Billion, up 24% Year Over Year, at the High End of Guidance
Siding & Trim Net Sales of $880.3 Million, Above the High End of Guidance, Led by Continued Growth in Fiber Cement
Net Income margin of 10.5%; Adjusted EBITDA Margin of 31.8%, Above the High End of Guidance and up 450 Basis Points
Cost Synergies Ahead of Schedule; Revenue Synergies On Track
$111 Million of Term Loan Debt Repaid in the Quarter, Reached FY27 Leverage Target Ahead of Schedule
Consolidated FY27 Net Sales and Adjusted EBITDA Guidance Reaffirmed, Free Cash Flow Target Raised to More than $650 Million
CHICAGO--(BUSINESS WIRE)-- James Hardie Industries plc (NYSE / ASX : JHX) ("James Hardie" or the "Company"), a leading provider of exterior home and outdoor living solutions, today announced results for its second quarter ended September 30, 2026.
In August 2026, the Company announced the strategic divestiture of its European operations and the intended closure of its European fiber cement operations. Europe is therefore presented within discontinued operations, and unless otherwise noted, results and the outlook in this release are on a continuing operations basis, excluding Europe. Beginning in the first quarter FY27, the Company revised the definitions of certain non-GAAP financial measures, including Adjusted EBITDA, to exclude share-based compensation costs.
Aaron Erter, CEO of James Hardie, said, "We delivered a strong second quarter, with sales from continuing operations up 24%, well above the market and at the high end of our guidance range. Adjusted EBITDA was above the guidance range, with margins expanding 450 basis points. North America fiber cement and Deck, Rail & Accessories both delivered double-digit sell-through growth, driven by consistent execution against our sales initiatives, material conversion opportunities and commercial synergies. Australia & New Zealand also delivered strong growth, driven by continued share gains."
Mr. Erter added, "We're focused on what we can control: accelerating material conversion, executing our growth initiatives, and driving continuous improvement through the Hardie Operating System. Our synergy momentum continues to build, with commercial synergies on track to reach our fiscal 2027 target and cost synergies ahead of schedule."
Mr. Erter concluded, "Halfway through the year, we are delivering on the commitments we set for fiscal 2027. While the U.S. housing market remains challenging, particularly new construction, our plan does not depend on a near-term recovery. Based on our broad set of self-help growth levers and our confidence in continuing to outperform the market, we are reaffirming our consolidated fiscal 2027 sales and Adjusted EBITDA outlook and raising our free cash flow target."
| Consolidated Financial Information | |||||||||||
| Q2 FY27 | Q2 FY26 | Change | 6 MonthsFY27 | 6 MonthsFY26 | Change | ||||||
| Group | (US$ millions, except per share data) | ||||||||||
| Net Sales | 1,428.2 | 1,154.7 | +24% | 2,746.4 | 1,918.1 | +43% | |||||
| Operating Income | 263.3 | 12.5 | NM | 462.2 | 137.9 | +235% | |||||
| Operating Income Margin | 18.4% | 1.1% | +1,730bps | 16.8% | 7.2% | +960bps | |||||
| Net Income (Loss) from Continuing Operations | 149.8 | (64.3) | NM | 240.4 | (12.0) | NM | |||||
| Income from Discontinued Operations | 1.2 | 8.5 | (86%) | 14.9 | 18.8 | (21%) | |||||
| Net Income (Loss) from Continuing Operations per common share - Diluted | 0.26 | (0.11) | NM | 0.41 | (0.03) | NM | |||||
| Income from Discontinued Operations per common share - Diluted | — | 0.01 | (100%) | 0.03 | 0.04 | (25%) | |||||
| Net Income (Loss) Margin from Continuing Operations | 10.5% | (5.6%) | NM | 8.8% | (0.6%) | NM | |||||
| Net Income Margin from Discontinued Operations | 0.1% | 0.7% | (60bps) | 0.5% | 1.0% | (50bps) | |||||
| Adjusted Net Income | 248.5 | 148.4 | +67% | 443.2 | 272.6 | +63% | |||||
| Adjusted Diluted Earnings Per Share | 0.42 | 0.25 | +68% | 0.76 | 0.54 | +41% | |||||
| Adjusted EBITDA | 454.7 | 314.9 | +44% | 847.4 | 530.6 | +60% | |||||
| Adjusted EBITDA Margin | 31.8% | 27.3% | +450bps | 30.9% | 27.7% | +320bps | |||||
| ____________ | |||||||||||
| NM - Not meaningful |
| Segment Business Update and Results |
| Siding & Trim | |||||||||||
| Q2 FY27 | Q2 FY26 | Change | 6 MonthsFY27 | 6 MonthsFY26 | Change | ||||||
| Siding & Trim | (US$ millions) | ||||||||||
| Net Sales | 880.3 | 766.0 | +15% | 1,740.1 | 1,407.8 | 24% | |||||
| Operating Income | 232.0 | 151.0 | +54% | 446.9 | 312.2 | 43% | |||||
| Operating Income Margin | 26.4% | 19.7% | +670bps | 25.7% | 22.2% | +350bps | |||||
| Adjusted EBITDA | 304.4 | 224.0 | +36% | 592.1 | 429.8 | 38% | |||||
| Adjusted EBITDA Margin | 34.6% | 29.2% | +540bps | 34.0% | 30.5% | +350bps |
Siding & Trim net sales increased 15% compared to the quarter ended September 30, 2025, led by continued fiber cement volume growth, favorable price/mix, and traction from our strategic growth initiatives.
Fiber cement volumes increased mid-single digits in the quarter, with multi-family up high-teens. Growth was driven by share gains against vinyl and other materials, strategic initiatives such as ColorPlus®, trim-over and the rollout of Hardie ProLabs, and the resilience of multi-family. Total exterior volumes grew in nearly every region, even as new construction remained soft across many of the Company’s markets. Fiber cement sell-through increased low double digits in the quarter, well ahead of declining end markets.
Second quarter operating income margin was 26.4%, up 670 basis points year-over-year. Adjusted EBITDA Margin, which excludes inventory fair value adjustments, acquisition and divestiture related restructuring expenses, and amortization of acquired AZEK intangibles, was 34.6%, up 540 basis points year-over-year. The increase was primarily driven by favorable net price and mix realization, volume leverage, and lower manufacturing costs, reflecting favorable input costs and continued savings from the Hardie Operating System ("HOS") and footprint optimization. Disciplined SG&A management contributed further. These gains were partially offset by higher freight and diesel costs.
| Deck, Rail & Accessories (DR&A) | |||||||||||
| Q2 FY27 | Q2 FY26 | Change | 6 MonthsFY27 | 6 MonthsFY26 | Change | ||||||
| Deck, Rail & Accessories | (US$ millions) | ||||||||||
| Net Sales | 387.0 | 255.8 | +51% | 692.1 | 255.8 | +171% | |||||
| Operating Income (Loss) | 48.6 | (11.9) | NM | 45.3 | (11.9) | NM | |||||
| Operating Income (Loss) Margin | 12.6% | (4.7%) | NM | 6.5% | (4.7%) | NM | |||||
| Adjusted EBITDA | 128.7 | 78.6 | +64% | 211.5 | 78.6 | +169% | |||||
| Adjusted EBITDA Margin | 33.3% | 30.7% | +260bps | 30.6% | 30.7% | (10bps) | |||||
| ____________ | |||||||||||
| NM - Not meaningful |
DR&A net sales increased 51%, or $131.2 million, compared to the quarter ended September 30, 2025, reflecting strong sell-through, the completion of the planned channel inventory normalization in the first quarter and the impact of the initial load-in of our new business with Boise Cascade.
Demand for our products was robust, with low double-digit sell-through well ahead of the market, supported by continued material conversion from wood. Growth was strong at both the entry and premium ends of the range. Retail sell-through was particularly strong, supported by solid consumer demand and incremental shelf space across the combined platform.
Second quarter operating income margin was 12.6%. Adjusted EBITDA Margin was 33.3%, up 260 basis points year-over-year, primarily driven by higher volume and pricing, improved plant performance and operating leverage as production returned to normal levels, and continued savings from cost synergies and HOS. These gains were partially offset by higher input costs, including material inflation and freight costs.
| Australia & New Zealand (ANZ) | |||||||||||
| Q2 FY27 | Q2 FY26 | Change | 6 MonthsFY27 | 6 MonthsFY26 | Change | ||||||
| Australia & New Zealand | (US$ millions, unless otherwise noted) | ||||||||||
| Net Sales | 160.9 | 132.9 | +21% | 314.2 | 254.5 | 23% | |||||
| Net Sales (A$ millions) | 227.9 | 203.2 | +12% | 443.9 | 392.7 | 13% | |||||
| Operating Income | 49.9 | 38.0 | +31% | 96.7 | 75.8 | +28% | |||||
| Operating Income Margin | 31.0% | 28.6% | +240bps | 30.8% | 29.8% | +100bps | |||||
| EBITDA | 56.8 | 43.5 | +31% | 110.3 | 86.5 | 28% | |||||
| EBITDA Margin | 35.3% | 32.7% | +260bps | 35.1% | 34.0% | +110bps |
Net sales increased 21% for the quarter, or 12% in Australian dollars, driven by high single digit volume growth and a foreign exchange tailwind in the period. Volume growth reflected resilient housing activity in the Australian housing market, ongoing share gains, and continued conversion from competing materials.
Operating Income Margin was 31.0%, up 240 basis points year over year. EBITDA margin was 35.3%, up 260 basis points year over year. These increases were the result of strong flow-through on higher volumes, manufacturing efficiencies and lower input costs, together with the non-recurrence of a prior-year provision related to the closure of a New Zealand site, were partially offset by higher freight costs.
The Company is focused on driving growth in Australia and New Zealand by evolving from a fiber cement business to a broader building products platform. The strategy centers on defending and extending our core fiber cement operations while accelerating adoption of whole-home solutions, including Hardie™ Gravis™, and expanding into outdoor living with TimberTech® by James Hardie decking.
Outlook
Q3 FY27 Guidance and Full Year Planning Assumptions (Continuing Operations)
Ryan Lada, CFO said, “Our second quarter sales growth reflected share gains, continued traction of our growth initiatives and the early benefits of our expanded distribution partnerships. Higher Net Income Margin and the 450 basis point increase in Adjusted EBITDA Margin was driven by favorable volume, price and mix and HOS savings; offset by general inflation and higher freight costs, with Net Income Margin also benefiting from lower acquisition-related expenses.
We are reaffirming our consolidated full-year fiscal 2027 net sales and Adjusted EBITDA guidance and increasing our free cash flow target to more than $650 million. We expect Adjusted EBITDA to be lower in the third quarter and second half driven by DR&A seasonality in Q3, incremental freight costs and the weaker macro environment.
Strong cash generation is accelerating our deleveraging. First-half free cash flow was $535 million and we repaid $111 million of term loan debt in the quarter. Together with the expected proceeds from the Europe divestiture, we remain on track to reach net leverage below 2.0x by the end of the second quarter of fiscal 2028."
We provide certain elements of our outlook on a non-GAAP basis, as we cannot predict some elements that are included in reported GAAP results, including the impact of actuarial estimates on asbestos-related assets and liabilities in future periods. Refer to the discussion of non-GAAP financial measures below for more details.
Third Quarter Guidance Assumptions:
- Net Sales for Siding & Trim: $758 to $800 million
- Net Sales for Deck, Rail & Accessories: $164 to $190 million
- Total Net Sales: $1.058 to $1.140 billion
- Adjusted EBITDA for Siding & Trim: $245 to $262 million
- Adjusted EBITDA for Deck, Rail & Accessories: $38 to $49 million
- Total Adjusted EBITDA: $298 to $320 million
Updated Full Year Planning Assumptions:
- Net Sales for Siding & Trim: $3.236 to $3.314 billion
- Net Sales for Deck, Rail & Accessories: $1.198 to $1.240 billion
- Total Net Sales: $4.990 to $5.133 billion
- Adjusted EBITDA for Siding & Trim: $1.046 to $1.085 billion
- Adjusted EBITDA for Deck, Rail & Accessories: $355 to $375 million
- Total Adjusted EBITDA: $1.446 to $1.534 billion
- Free Cash Flow: More than $650 million
| Cash Flow, Capital Investment & Allocation |
First half operating cash flow totaled $693.7 million, up from $254.3 million a year ago, driven by net income adjusted for non-cash items of $682.5 million and a $99.2 million working capital inflow, partially offset by $65.2 million of asbestos claims and handling costs paid. Capital expenditures totaled $158.3 million, resulting in Free Cash Flow of $535.4 million for the six month period versus $58.4 million for the prior year period.
Our capital allocation priorities for FY2027 are unchanged: invest in organic growth and reduce leverage. We expect to apply approximately $600 million of proceeds from the Europe divestiture, which is expected to close in the first half of calendar 2027, toward debt repayment. Together with continued free cash flow generation, this is expected to support our target of net leverage below 2.0x by the end of the second quarter of FY2028.
For FY2027, we continue to expect capital expenditures to be in the range of approximately 6% to 7% of net sales, reflecting maintenance and targeted growth investments across the manufacturing network. Our footprint today is well positioned and equipped to support demand across both fiber cement and decking, and we do not anticipate the need for significant new capacity in the near term.
The previously announced closures of our Fontana, California and Summerville, South Carolina facilities are expected to generate approximately $25 million in annualized cost savings for Fiscal Year 2027.
Reported Financial Results
| (Millions of U.S. dollars) | (Unaudited)September 30,2026 | March 31,2026 | |||
| Assets | |||||
| Current assets: | |||||
| Cash and cash equivalents | $ | 323.1 | $ | 265.4 | |
| Restricted cash and cash equivalents | 27.5 | 75.2 | |||
| Restricted short-term investments — Asbestos | 216.1 | 198.5 | |||
| Accounts and other receivables, net | 430.9 | 420.1 | |||
| Inventories | 511.7 | 551.3 | |||
| Prepaid expenses and other current assets | 94.7 | 111.9 | |||
| Assets held for sale | 939.7 | 977.1 | |||
| Total current assets | 2,543.7 | 2,599.5 | |||
| Property, plant and equipment, net | 2,617.6 | 2,677.8 | |||
| Operating lease right-of-use assets | 114.9 | 117.9 | |||
| Finance lease right-of-use assets | 97.3 | 100.6 | |||
| Goodwill | 4,572.2 | 4,575.4 | |||
| Intangible assets, net | 3,043.8 | 3,198.8 | |||
| Deferred income taxes | 62.2 | 70.0 | |||
| Deferred income taxes — Asbestos | 270.3 | 282.5 | |||
| Other assets | 78.4 | 66.1 | |||
| Total assets | $ | 13,400.4 | $ | 13,688.6 | |
| Liabilities and Shareholders’ Equity | |||||
| Current liabilities: | |||||
| Accounts payable and accrued liabilities | $ | 561.4 | $ | 568.6 | |
| Accrued payroll and employee benefits | 138.3 | 150.0 | |||
| Operating lease liabilities | 30.9 | 28.7 | |||
| Finance lease liabilities | 5.7 | 5.4 | |||
| Long-term debt, current portion | 54.7 | 43.8 | |||
| Accrued product warranties | 10.5 | 10.2 | |||
| Income taxes payable | 15.8 | 11.4 | |||
| Asbestos liability | 130.7 | 128.3 | |||
| Liabilities held for sale | 210.6 | 233.3 | |||
| Other liabilities | 44.1 | 56.7 | |||
| Total current liabilities | 1,202.7 | 1,236.4 | |||
| Long-term debt | 3,962.6 | 4,491.2 | |||
| Deferred income taxes | 376.4 | 348.1 | |||
| Operating lease liabilities | 97.8 | 103.5 | |||
| Finance lease liabilities | 96.3 | 97.9 | |||
| Accrued product warranties | 54.4 | 53.3 | |||
| Asbestos liability | 832.3 | 880.3 | |||
| Other liabilities | 51.7 | 52.4 | |||
| Total liabilities | 6,674.2 | 7,263.1 | |||
| Total shareholders’ equity | 6,726.2 | 6,425.5 | |||
| Total liabilities and shareholders’ equity | $ | 13,400.4 | $ | 13,688.6 |
| (Unaudited)Three Months Ended September 30, | (Unaudited)Six Months Ended September 30, | ||||||||||||||
| (Millions of U.S. dollars, except per share data) | 2026 | 2025 | 2026 | 2025 | |||||||||||
| Net sales | $ | 1,428.2 | $ | 1,154.7 | $ | 2,746.4 | $ | 1,918.1 | |||||||
| Cost of goods sold | 865.8 | 776.0 | 1,685.8 | 1,246.6 | |||||||||||
| Gross profit | 562.4 | 378.7 | 1,060.6 | 671.5 | |||||||||||
| Selling, general and administrative expenses | 268.5 | 222.2 | 533.1 | 348.2 | |||||||||||
| Research and development expenses | 14.6 | 14.9 | 29.1 | 26.2 | |||||||||||
| Restructuring expenses | 0.8 | — | 6.0 | — | |||||||||||
| Acquisition and divestiture related expenses | 14.9 | 128.9 | 31.5 | 158.3 | |||||||||||
| Asbestos adjustments | 0.3 | 0.2 | (1.3 | ) | 0.9 | ||||||||||
| Operating income | 263.3 | 12.5 | 462.2 | 137.9 | |||||||||||
| Interest, net | 54.8 | 67.1 | 116.1 | 106.1 | |||||||||||
| Other (income) expense, net | (18.9 | ) | (1.4 | ) | (19.9 | ) | 9.7 | ||||||||
| Income (loss) before income taxes | 227.4 | (53.2 | ) | 366.0 | 22.1 | ||||||||||
| Income tax expense | 77.6 | 11.1 | 125.6 | 34.1 | |||||||||||
| Net income (loss) from continuing operations | 149.8 | (64.3 | ) | 240.4 | (12.0 | ) | |||||||||
| Income from discontinued operations, net of tax | 1.2 | 8.5 | 14.9 | 18.8 | |||||||||||
| Net income (loss) | $ | 151.0 | $ | (55.8 | ) | $ | 255.3 | $ | 6.8 | ||||||
| Income (loss) per share: | |||||||||||||||
| Basic | |||||||||||||||
| Continuing operations | $ | 0.26 | $ | (0.11 | ) | $ | 0.41 | $ | (0.03 | ) | |||||
| Discontinued operations | $ | — | $ | 0.01 | $ | 0.03 | $ | 0.04 | |||||||
| Net income (loss) per share - basic | $ | 0.26 | $ | (0.10 | ) | $ | 0.44 | $ | 0.01 | ||||||
| Diluted | |||||||||||||||
| Continuing operations | $ | 0.26 | $ | (0.11 | ) | $ | 0.41 | $ | (0.03 | ) | |||||
| Discontinued operations | $ | — | $ | 0.01 | $ | 0.03 | $ | 0.04 | |||||||
| Net income (loss) per share - diluted | $ | 0.26 | $ | (0.10 | ) | $ | 0.44 | $ | 0.01 | ||||||
| Weighted average common shares outstanding (Millions): | |||||||||||||||
| Basic | 581.0 | 577.4 | 580.6 | 504.0 | |||||||||||
| Diluted | 585.8 | 577.4 | 584.8 | 504.0 |
| (Unaudited)Six Months Ended September 30, | |||||||
| (Millions of U.S. dollars) | 2026 | 2025 | |||||
| Cash Flows From Operating Activities | |||||||
| Net income | $ | 255.3 | $ | 6.8 | |||
| Adjustments to reconcile net income to net cash provided by operating activities: | |||||||
| Depreciation and amortization | 331.4 | 182.9 | |||||
| Lease expense | 24.1 | 18.5 | |||||
| Deferred income taxes | 31.8 | 7.7 | |||||
| Share-based compensation | 30.3 | 19.9 | |||||
| Asbestos adjustments | (1.3 | ) | 0.9 | ||||
| Non-cash restructuring expenses | 2.5 | — | |||||
| Non-cash interest expense | 4.8 | 4.3 | |||||
| Non-cash charge related to step up of inventory | — | 47.9 | |||||
| Other, net | 3.6 | 28.6 | |||||
| Changes in operating assets and liabilities: | |||||||
| Accounts and other receivables | 42.3 | 101.4 | |||||
| Inventories | 54.1 | (50.2 | ) | ||||
| Operating lease assets and liabilities, net | (28.4 | ) | (20.9 | ) | |||
| Prepaid expenses and other assets | (1.8 | ) | (14.9 | ) | |||
| Insurance receivable — Asbestos | 1.2 | 1.7 | |||||
| Accounts payable and accrued liabilities | 2.8 | (9.1 | ) | ||||
| Claims and handling costs paid — Asbestos | (65.2 | ) | (61.0 | ) | |||
| Income taxes payable | 10.3 | (3.3 | ) | ||||
| Other accrued liabilities and interest | (4.1 | ) | (6.9 | ) | |||
| Net cash provided by operating activities | $ | 693.7 | $ | 254.3 | |||
| Cash Flows From Investing Activities | |||||||
| Purchases of property, plant and equipment | $ | (158.3 | ) | $ | (195.9 | ) | |
| Capitalized interest | — | (5.1 | ) | ||||
| Cash consideration for The AZEK Company acquisition, net of cash acquired | — | (3,919.8 | ) | ||||
| Purchase of restricted investments — Asbestos | (117.9 | ) | (96.4 | ) | |||
| Proceeds from restricted investments — Asbestos | 104.1 | 96.4 | |||||
| Net cash used in investing activities | $ | (172.1 | ) | $ | (4,120.8 | ) | |
| Cash Flows From Financing Activities | |||||||
| Proceeds from senior secured notes | $ | — | $ | 1,700.0 | |||
| Proceeds from revolving facility | 530.0 | — | |||||
| Proceeds from term loans | — | 2,500.0 | |||||
| Repayments of term loans | (121.9 | ) | (301.6 | ) | |||
| Repayment of revolving facility | (530.0 | ) | — | ||||
| Repayment of senior unsecured notes | (400.0 | ) | — | ||||
| Debt issuance costs paid | — | (42.0 | ) | ||||
| Proceeds from exercise of vested stock options | 13.5 | — | |||||
| Repayment of finance lease obligations | (3.0 | ) | (1.5 | ) | |||
| Cash paid for shares withheld for taxes | (1.9 | ) | (6.3 | ) | |||
| Net cash (used in) provided by financing activities | $ | (513.3 | ) | $ | 3,848.6 | ||
| Effects of exchange rate changes on cash and cash equivalents and restricted cash | $ | (0.1 | ) | $ | (0.7 | ) | |
| Net increase (decrease) cash and cash equivalents and restricted cash | 8.2 | (18.6 | ) | ||||
| Cash and cash equivalents, restricted cash and restricted cash including discontinued operations at beginning of period | 344.4 | 605.6 | |||||
| Cash and cash equivalents and restricted cash including discontinued operations at end of period | $ | 352.6 | $ | 587.0 | |||
| Non-Cash Investing and Financing Activities | |||||||
| Capital expenditures incurred but not yet paid | $ | 20.7 | $ | 35.5 | |||
| Non-cash ROU assets obtained in exchange for new lease liabilities | $ | 21.3 | $ | 13.6 | |||
| Non-cash consideration for AZEK acquisition | $ | — | $ | 4,143.6 | |||
| Supplemental Disclosure of Cash Flow Activities | |||||||
| Cash paid during the year for interest | $ | 125.8 | $ | 61.0 | |||
| Cash paid to AICF | $ | 22.2 | $ | 31.4 |
Further Information
Readers are referred to Part I, Item 1. Financial Statements and Item 2. Management's Discussion and Analysis of Financial Condition and Results of Operations in the Company's Quarterly Report on Form 10-Q for the quarter ended September 30, 2026 for additional information regarding the Company’s results.
All comparisons made are vs. the comparable period in the prior fiscal year and amounts presented are in U.S. dollars, unless otherwise noted.
Conference Call Details
James Hardie will hold a conference call to discuss results and outlook Thursday, November 5, 2026 at 5:00pm ET (Friday, November 6, 2026 at 9:00am AET). Participants may register for a live webcast and access a replay following the event of the event on the Investor Relations section of the Company’s website (ir.jameshardie.com ).
About James Hardie
James Hardie Industries plc is the industry leader in exterior home and outdoor living solutions, with a portfolio that includes fiber cement, composite decking, PVC decking and railing products. Products offered by James Hardie are engineered for beauty, durability, and climate resilience, and include trusted brands like Hardie®, TimberTech®, AZEK® Exteriors, Versatex®, and StruXure®. The James Hardie portfolio is marketed and sold throughout North America, Australia and New Zealand.
James Hardie Industries plc is incorporated and existing under the laws of Ireland. As an Irish plc, James Hardie is governed by the Irish Companies Act. James Hardie’s principal executive offices are located at 1st Floor, Block A, One Park Place, Upper Hatch Street, Dublin 2, D02 FD79, Ireland.
Forward-Looking Statements
This Earnings Release contains forward-looking statements and information within the meaning of the Private Securities Litigation Reform Act of 1995. These statements, which are not statements of historical fact, contain estimates, assumptions, projections and/or expectations regarding future events, which may or may not occur. Words such as “believe,” “anticipate,” “plan,” “expect,” “intend,” “target,” “estimate,” “project,” “predict,” “forecast,” “guideline,” “aim,” “will,” “should,” “likely,” “continue,” “may,” “objective,” “outlook” and similar expressions are intended to identify forward-looking statements but are not the exclusive means of identifying such statements. These forward-looking statements are subject to a number of risks, uncertainties and assumptions. Many factors could cause the actual results, performance or achievements of James Hardie to be materially different from those expressed or implied in this release, including, among others, the risks and uncertainties described in "Risk Factors" in our Annual Report on Form 10-K for the fiscal year ended March 31, 2026 and in other reports we file with the U.S. Securities and Exchange Commission and the Australian Securities Exchange from time to time; changes in general economic, political, governmental and business conditions globally and in the countries in which James Hardie does business; changes in interest rates; changes in inflation rates; changes in exchange rates; the level of construction generally; changes in cement demand and prices; changes in raw material and energy prices; changes in business strategy; the AZEK integration and the European divestiture and their anticipated benefits and various other factors. Should one or more of these risks or uncertainties materialize, or should underlying assumptions prove incorrect, actual results may vary materially from those described herein.
Forward-looking statements are based on the Company’s current expectations, estimates and assumptions. Readers are cautioned not to place undue reliance on forward-looking statements. Forward-looking statements speak only as of the date they are made, and the Company assumes no obligation to update any forward-looking statements or information except as required by law.
Non-GAAP Financial Measures
To supplement our Earnings Release and condensed consolidated financial statements prepared and presented in accordance with generally accepted accounting principles in the United States ("GAAP"), we use certain non-GAAP financial measures, as described in this earnings release, to provide investors with additional useful information about our financial performance, to enhance the overall understanding of our past performance and future prospects and to allow for greater transparency with respect to important metrics used by our management for financial and operational decision-making. We are presenting these non-GAAP financial measures to assist investors in seeing our financial performance and liquidity from management’s view and because we believe they provide an additional tool for investors to use in comparing our core financial performance and liquidity over multiple periods with other companies in our industry.
- Adjusted Net Income: Defined as net income from continuing operations before legacy items such as asbestos related expenses and adjustments, AICF interest income, and significant non-recurring items, such as restructuring gain or expenses, acquisition and divestiture related expenses, pre-close financing costs, non-cash gain on foreign currency forward contracts, inventory fair value adjustment, amortization of intangible assets resulting from AZEK acquisition, as well as share-based compensation expense and adjustments to tax expenses.
- Adjusted EBITDA: Defined as net income from continuing operations before interest, net, other expense (income), net, income tax expense, depreciation and amortization, legacy items such as asbestos related expenses and adjustments, share-based compensation expense, and significant non-recurring items, such as restructuring gain and expenses, acquisition and divestiture related expenses and inventory fair value adjustment. Adjusted EBITDA Margin is equal to Adjusted EBITDA divided by net sales.
- Adjusted Diluted EPS: Defined as Adjusted Net Income divided by weighted average common shares outstanding – diluted, to reflect the conversion or exercise, as applicable, of all outstanding shares of restricted stock awards, restricted stock units and options to purchase shares of our common stock.
- Adjusted Segment EBITDA: Defined as segment operating income before depreciation and amortization and significant non-recurring items such as restructuring expenses, acquisition and divestiture related expenses, inventory fair value adjustment and amortization of intangible assets resulting from AZEK acquisition. The Company does not calculate net income by segment, therefore, Adjusted Segment EBITDA is reconciled to the closest GAAP measure of segment profitability, Segment operating profit.
- Adjusted General Corporate and Unallocated R&D EBITDA: Defined as General Corporate and Unallocated R&D costs before depreciation and amortization, share-based compensation expense, legacy items such as asbestos related expenses and adjustments, and significant non-recurring items such as restructuring gain or expenses, and acquisition and divestiture related expenses. The Company does not calculate net income for General Corporate and Unallocated R&D costs, therefore, Adjusted General Corporate and Unallocated R&D EBITDA is reconciled to the closest GAAP measure of profitability, General Corporate and unallocated R&D costs.
- Adjusted Income Before Income Taxes: Defined as Income before income taxes before share-based compensation expense, legacy items such as asbestos related expenses and adjustments and AICF interest income, and significant non-recurring items such as restructuring gains or expenses, pre-close financing costs, non-cash gain on foreign currency forward contracts, acquisition and divestiture related expenses, inventory fair value adjustment and amortization of intangible assets resulting from AZEK acquisition.
- Adjusted Income Tax Expense: Defined as income tax expense before tax adjustments.
- Adjusted Effective Tax Rate: Defined as Adjusted Income Tax Expense divided by Adjusted Income Before Income Taxes.
- Adjusted Interest, net: Defined as Interest, net before legacy items such as AICF interest income, and significant non-recurring items such as pre-close financing and interest costs.
- Adjusted Other Expense (Income), net: Defined as Other expense (income), net, before significant non-recurring items such as non-cash gain on foreign currency forward contracts and non-cash loss on interest rate swap.
- Net Leverage: Defined as gross debt less cash and cash equivalents, divided by trailing twelve month Adjusted EBITDA.
- Free Cash Flow: Defined as net cash provided by (used in) operating activities less purchases of property, plant and equipment plus proceeds from sale of property, plant and equipment.
These non-GAAP financial measures have limitations as analytical tools, and you should not consider them in isolation or as a substitute for analysis of our results as reported under GAAP. Non-GAAP financial measures may be calculated differently from, and therefore may not be directly comparable to, similarly titled measures used by other companies. See the accompanying earnings tables for a reconciliation of these non-GAAP measures to their most directly comparable GAAP measures.
The Company is unable to forecast the most directly comparable U.S. GAAP financial measure for future periods due to, amongst other factors, uncertainty regarding the impact of actuarial estimates on asbestos-related assets and liabilities in future periods. Such reconciling items that impact Adjusted EBITDA and Free Cash Flow have not occurred, are outside of our control or cannot be reasonably predicted. Accordingly, a reconciliation of each of Adjusted EBITDA and Free Cash Flow to its most directly comparable GAAP measure is not available without unreasonable effort. However, it is important to note that material changes to these reconciling items could have a significant effect on our Adjusted EBITDA and Free Cash Flow planning assumptions and future GAAP results.
This Earnings Release has been authorized by the James Hardie Board of Directors.
Non-GAAP Financial Measures
| Total Net Sales | |||
| (Millions of U.S. dollars) | Three Months EndedSeptember 30, | ||
| 2026 | |||
| Net sales from continuing operations | $ | 1,428.2 | |
| Net sales from discontinued operations | $ | 135.3 | |
| Total net sales | $ | 1,563.5 |
| Adjusted EBITDA and Adjusted EBITDA Margin | ||||||||||||||||
| (Millions of U.S. dollars) | Three Months EndedSeptember 30, | Six Months EndedSeptember 30, | ||||||||||||||
| 2026 | 2025 | 2026 | 2025 | |||||||||||||
| Net income (loss) from continuing operations | $ | 149.8 | $ | (64.3 | ) | $ | 240.4 | $ | (12.0 | ) | ||||||
| Interest, net | 54.8 | 67.1 | 116.1 | 106.1 | ||||||||||||
| Other (income) expense, net | (18.9 | ) | (1.4 | ) | (19.9 | ) | 9.7 | |||||||||
| Income tax expense | 77.6 | 11.1 | 125.6 | 34.1 | ||||||||||||
| Depreciation and amortization | 155.7 | 119.1 | 314.4 | 168.8 | ||||||||||||
| Acquisition and divestiture related expenses1 | 14.9 | 128.9 | 31.5 | 158.3 | ||||||||||||
| Asbestos related expenses and adjustments | 1.0 | 0.9 | — | 1.9 | ||||||||||||
| Inventory fair value adjustment | — | 47.9 | — | 47.9 | ||||||||||||
| Restructuring expenses | 0.8 | — | 6.0 | — | ||||||||||||
| Share-based compensation expense2 | 19.0 | 5.6 | 33.3 | 15.8 | ||||||||||||
| Adjusted EBITDA | $ | 454.7 | $ | 314.9 | $ | 847.4 | $ | 530.6 |
| Three Months EndedSeptember 30, | Six Months EndedSeptember 30, | |||||||||||
| 2026 | 2025 | 2026 | 2025 | |||||||||
| Net income (loss) from continuing operations margin | 10.5 | % | (5.6 | )% | 8.8 | % | (0.6 | %) | ||||
| Interest, net | 3.8 | % | 5.8 | % | 4.2 | % | 5.5 | % | ||||
| Other (income) expense, net | (1.3 | )% | (0.1 | )% | (0.7 | %) | 0.5 | % | ||||
| Income tax expense | 5.4 | % | 1.0 | % | 4.6 | % | 1.8 | % | ||||
| Depreciation and amortization | 10.9 | % | 10.3 | % | 11.5 | % | 8.8 | % | ||||
| Acquisition and divestiture related expenses1 | 1.0 | % | 11.2 | % | 1.1 | % | 8.3 | % | ||||
| Asbestos related expenses and adjustments | 0.1 | % | 0.1 | % | — | % | 0.1 | % | ||||
| Inventory fair value adjustment | — | % | 4.1 | % | — | % | 2.5 | % | ||||
| Restructuring expenses | 0.1 | % | — | % | 0.2 | % | — | % | ||||
| Share-based compensation expense2 | 1.3 | % | 0.5 | % | 1.2 | % | 0.8 | % | ||||
| Adjusted EBITDA Margin | 31.8 | % | 27.3 | % | 30.9 | % | 27.7 | % | ||||
| 1. The three months ended September 30, 2026 period includes acquisition expenses of $9.7 million and divestiture expenses of $5.2 million. The six months ended September 30, 2026 period includes acquisition expenses of $22.2 million and divestiture expenses of $9.3 million. The prior year is entirely acquisition related expenses.2. Effective as of June 30, 2026, we revised the definition of Adjusted EBITDA and Adjusted EBITDA Margin to exclude share-based compensation expense. Prior periods have been recast to reflect the change. For the three and six months ended September 30, 2026, share-based compensation expense of $0.5 million and $0.8 million, respectively, is included in acquisition related expenses. For both the three and six months September 30, 2025 periods, share-based compensation expense of $8.5 million is included in acquisition and divestiture related expenses. |
| Adjusted Net Income and Adjusted Diluted Earnings Per Share | ||||||||||||||||
| (Millions of U.S. dollars, except per share amounts) | Three Months EndedSeptember 30, | Six Months EndedSeptember 30, | ||||||||||||||
| 2026 | 2025 | 2026 | 2025 | |||||||||||||
| Net income (loss) from continuing operations | $ | 149.8 | $ | (64.3 | ) | $ | 240.4 | $ | (12.0 | ) | ||||||
| Asbestos related expenses and adjustments | 1.0 | 0.9 | — | 1.9 | ||||||||||||
| AICF interest income | (3.3 | ) | (2.4 | ) | (6.6 | ) | (5.0 | ) | ||||||||
| Restructuring expenses | 0.8 | — | 6.0 | — | ||||||||||||
| Pre-close financing costs1 | — | — | — | 46.5 | ||||||||||||
| Non-cash gain on foreign currency forward contracts | (19.4 | ) | — | (19.4 | ) | — | ||||||||||
| Acquisition and divestiture related expenses2 | 14.9 | 128.9 | 31.5 | 158.3 | ||||||||||||
| Inventory fair value adjustment | — | 47.9 | — | 47.9 | ||||||||||||
| Amortization of intangible assets resulting from AZEK acquisition | 77.5 | 48.7 | 155.1 | 48.7 | ||||||||||||
| Share-based compensation expense3 | 19.0 | 5.6 | 33.3 | 15.8 | ||||||||||||
| Tax impact of adjustments4 | 8.2 | (16.9 | ) | 2.9 | (29.5 | ) | ||||||||||
| Adjusted Net Income | $ | 248.5 | $ | 148.4 | $ | 443.2 | $ | 272.6 |
| Three Months EndedSeptember 30, | Six Months EndedSeptember 30, | |||||||||||||||
| 2026 | 2025 | 2026 | 2025 | |||||||||||||
| Net income (loss) from continuing operations per common share - diluted | $ | 0.26 | $ | (0.11 | ) | $ | 0.41 | $ | (0.03 | ) | ||||||
| Asbestos related expenses and adjustments | — | — | — | — | ||||||||||||
| AICF interest income | (0.01 | ) | — | (0.01 | ) | (0.01 | ) | |||||||||
| Restructuring expenses | — | — | 0.01 | — | ||||||||||||
| Pre-close financing costs1 | — | — | — | 0.09 | ||||||||||||
| Non-cash gain on foreign currency forward contracts | (0.03 | ) | — | (0.03 | ) | — | ||||||||||
| Acquisition and divestiture related expenses2 | 0.03 | 0.22 | 0.05 | 0.32 | ||||||||||||
| Inventory fair value adjustment | — | 0.08 | — | 0.09 | ||||||||||||
| Amortization of intangible assets resulting from AZEK acquisition | 0.13 | 0.08 | 0.27 | 0.10 | ||||||||||||
| Share-based compensation expense3 | 0.03 | 0.01 | 0.06 | 0.03 | ||||||||||||
| Tax impact of adjustments4 | 0.01 | (0.03 | ) | — | (0.05 | ) | ||||||||||
| Adjusted Diluted Earnings Per Share5 | $ | 0.42 | $ | 0.25 | $ | 0.76 | $ | 0.54 | ||||||||
| 1. The six months ended September 30, 2025 period includes pre-close financing interest of $34.9 million and $11.6 million non-cash loss on our interest rate swap.2. The three months ended September 30, 2026 period includes acquisition expenses of $9.7 million and divestiture expenses of $5.2 million. The six months ended September 30, 2026 period includes acquisition expenses of $22.2 million and divestiture expenses of $9.3 million. The prior year is entirely acquisition related expenses.3. Effective as of June 30, 2026, we revised the definition of Adjusted Net Income and Adjusted Diluted Earnings Per Share to exclude share-based compensation expense. Prior periods have been recast to reflect the change. For the three and six months ended September 30, 2026, share-based compensation expense of $0.5 million and $0.8 million, respectively, is included in acquisition and divestiture related expenses. For both the three and six months September 30, 2025 periods, share-based compensation expense of $8.5 million is included in acquisition and divestiture related expenses.4. Includes tax adjustments related to the amortization of certain U.S. intangible assets, asbestos, share-based compensation and discrete items relating to the acquisition and divestiture costs.5. Weighted average common shares outstanding used in computing diluted net income per common share of 585.8 million and 582.1 million for the three months ended September 30, 2026 and 2025, respectively. Weighted average common shares outstanding used in computing diluted net income per common share of 584.8 million and 508.6 million for the six months ended September 30, 2026 and 2025, respectively. |
| Siding & Trim Segment Adjusted EBITDA and Adjusted EBITDA Margin | ||||||||||||
| (Millions of U.S. dollars) | Three Months EndedSeptember 30, | Six Months EndedSeptember 30, | ||||||||||
| 2026 | 2025 | 2026 | 2025 | |||||||||
| Siding & Trim Segment operating income | $ | 232.0 | $ | 151.0 | $ | 446.9 | $ | 312.2 | ||||
| Acquisition and divestiture related expenses1 | 4.7 | 3.8 | 9.0 | 4.8 | ||||||||
| Inventory fair value adjustment | — | 11.2 | — | 11.2 | ||||||||
| Amortization of intangible assets resulting from AZEK acquisition | 18.6 | 10.8 | 37.1 | 10.8 | ||||||||
| Restructuring expenses | 0.8 | — | 0.8 | — | ||||||||
| Depreciation and amortization | 48.3 | 47.2 | 98.3 | 90.8 | ||||||||
| Siding & Trim Segment Adjusted EBITDA | $ | 304.4 | $ | 224.0 | $ | 592.1 | $ | 429.8 |
| Three Months EndedSeptember 30, | Six Months EndedSeptember 30, | |||||||||||
| 2026 | 2025 | 2026 | 2025 | |||||||||
| Siding & Trim Segment operating income margin | 26.4 | % | 19.7 | % | 25.7 | % | 22.2 | % | ||||
| Acquisition and divestiture related expenses1 | 0.5 | % | 0.5 | % | 0.5 | % | 0.3 | % | ||||
| Inventory fair value adjustment | — | % | 1.5 | % | — | % | 0.8 | % | ||||
| Amortization of intangible assets resulting from AZEK acquisition | 2.1 | % | 1.4 | % | 2.1 | % | 0.8 | % | ||||
| Restructuring expenses | 0.1 | % | — | % | — | % | — | % | ||||
| Depreciation and amortization | 5.5 | % | 6.1 | % | 5.7 | % | 6.4 | % | ||||
| Siding & Trim Segment Adjusted EBITDA Margin | 34.6 | % | 29.2 | % | 34.0 | % | 30.5 | % | ||||
| 1. The three months ended September 30, 2026 period includes acquisition expenses of $3.0 million and divestiture expenses of $1.7 million. The six months ended September 30, 2026 period includes acquisition expenses of $7.3 million and divestiture expenses of $1.7 million. The prior year is entirely acquisition related expenses. |
| Deck, Rail & Accessories Segment Adjusted EBITDA and Adjusted EBITDA Margin | ||||||||||||||
| (Millions of U.S. dollars) | Three Months EndedSeptember 30, | Six Months EndedSeptember 30, | ||||||||||||
| 2026 | 2025 | 2026 | 2025 | |||||||||||
| Deck, Rail & Accessories operating income (loss) | $ | 48.6 | $ | (11.9 | ) | $ | 45.3 | $ | (11.9 | ) | ||||
| Restructuring expenses | — | — | 5.2 | — | ||||||||||
| Inventory fair value adjustment | — | 36.7 | — | 36.7 | ||||||||||
| Amortization of intangible assets resulting from AZEK acquisition | 58.9 | 37.9 | 118.0 | 37.9 | ||||||||||
| Depreciation and amortization | 21.2 | 15.9 | 43.0 | 15.9 | ||||||||||
| Deck, Rail & Accessories Segment Adjusted EBITDA | $ | 128.7 | $ | 78.6 | $ | 211.5 | $ | 78.6 |
| Three Months EndedSeptember 30, | Six Months EndedSeptember 30, | |||||||||||
| 2026 | 2025 | 2026 | 2025 | |||||||||
| Deck, Rail & Accessories operating income (loss) margin | 12.6 | % | (4.7 | %) | 6.5 | % | (4.7 | %) | ||||
| Restructuring expenses | — | % | — | % | 0.8 | % | — | % | ||||
| Inventory fair value adjustment | — | % | 14.4 | % | — | % | 14.4 | % | ||||
| Amortization of intangible assets resulting from AZEK acquisition | 15.2 | % | 14.8 | % | 17.1 | % | 14.8 | % | ||||
| Depreciation and amortization | 5.5 | % | 6.2 | % | 6.2 | % | 6.2 | % | ||||
| Deck, Rail & Accessories Segment Adjusted EBITDA Margin | 33.3 | % | 30.7 | % | 30.6 | % | 30.7 | % |
| Australia & New Zealand Segment EBITDA and EBITDA Margin | ||||||||||||
| (Millions of U.S. dollars) | Three Months EndedSeptember 30, | Six Months EndedSeptember 30, | ||||||||||
| 2026 | 2025 | 2026 | 2025 | |||||||||
| Australia & New Zealand Segment operating income | $ | 49.9 | $ | 38.0 | $ | 96.7 | $ | 75.8 | ||||
| Depreciation and amortization | 6.9 | 5.5 | 13.6 | 10.7 | ||||||||
| Australia & New Zealand Segment EBITDA | $ | 56.8 | $ | 43.5 | $ | 110.3 | $ | 86.5 |
| Three Months EndedSeptember 30, | Six Months EndedSeptember 30, | |||||||||||
| 2026 | 2025 | 2026 | 2025 | |||||||||
| Australia & New Zealand Segment operating income margin | 31.0 | % | 28.6 | % | 30.8 | % | 29.8 | % | ||||
| Depreciation and amortization | 4.3 | % | 4.1 | % | 4.3 | % | 4.2 | % | ||||
| Australia & New Zealand Segment EBITDA Margin | 35.3 | % | 32.7 | % | 35.1 | % | 34.0 | % |
| Adjusted General Corporate and Unallocated R&D EBITDA | ||||||||||||||||
| (Millions of U.S. dollars) | Three Months EndedSeptember 30, | Six Months EndedSeptember 30, | ||||||||||||||
| 2026 | 2025 | 2026 | 2025 | |||||||||||||
| General Corporate and Unallocated R&D costs | $ | (67.2 | ) | $ | (164.6 | ) | $ | (126.7 | ) | $ | (238.2 | ) | ||||
| Acquisition and divestiture related expenses1 | 10.2 | 125.1 | 22.5 | 153.5 | ||||||||||||
| Asbestos related expenses and adjustments | 1.0 | 0.9 | — | 1.9 | ||||||||||||
| Share-based compensation expense2 | 19.0 | 5.6 | 33.3 | 15.8 | ||||||||||||
| Depreciation and amortization | 1.8 | 1.8 | 4.4 | 2.7 | ||||||||||||
| Adjusted General Corporate and Unallocated R&D EBITDA | $ | (35.2 | ) | $ | (31.2 | ) | $ | (66.5 | ) | $ | (64.3 | ) | ||||
| 1. The three months ended September 30, 2026 includes acquisition expenses of $6.7 million and divestiture expenses of $3.5 million. The six months ended September 30, 2026 includes acquisition expenses of $14.9 million and divestiture expenses of $7.6 million. The prior year is entirely acquisition related expenses.2. Effective as of June 30, 2026, we revised the definition of Adjusted General Corporate and Unallocated R&D EBITDA to exclude share-based compensation expense. Prior periods have been recast to reflect the change. For the three and six months ended September 30, 2026, share-based compensation expense of $0.5 million and $0.8 million, respectively, is included in acquisition and divestiture related expenses. For both the three and six months September 30, 2025 periods, share-based compensation expense of $8.5 million is included in acquisition and divestiture related expenses. |
| Adjusted Income Before Income Taxes, Adjusted Income Tax Expense and Adjusted Effective Tax Rate | ||||||||||||||||
| (Millions of U.S. dollars) | Three Months EndedSeptember 30, | Six Months EndedSeptember 30, | ||||||||||||||
| 2026 | 2025 | 2026 | 2025 | |||||||||||||
| Income (Loss) before income taxes | $ | 227.4 | $ | (53.2 | ) | $ | 366.0 | $ | 22.1 | |||||||
| Asbestos related expenses and adjustments | 1.0 | 0.9 | — | 1.9 | ||||||||||||
| AICF interest income | (3.3 | ) | (2.4 | ) | (6.6 | ) | (5.0 | ) | ||||||||
| Restructuring expenses | 0.8 | — | 6.0 | — | ||||||||||||
| Pre-close financing costs1 | — | — | — | 46.5 | ||||||||||||
| Non-cash gain on foreign currency forward contracts | (19.4 | ) | — | (19.4 | ) | — | ||||||||||
| Acquisition and divestiture related expenses2 | 14.9 | 128.9 | 31.5 | 158.3 | ||||||||||||
| Inventory fair value adjustment | — | 47.9 | — | 47.9 | ||||||||||||
| Amortization of intangible assets resulting from AZEK acquisition | 77.5 | 48.7 | 155.1 | 48.7 | ||||||||||||
| Share-based compensation expense3 | 19.0 | 5.6 | 33.3 | 15.8 | ||||||||||||
| Adjusted Income Before Income Taxes | $ | 317.9 | $ | 176.4 | $ | 565.9 | $ | 336.2 | ||||||||
| Income tax expense | $ | 77.6 | $ | 11.1 | $ | 125.6 | $ | 34.1 | ||||||||
| Tax impact of adjustments4 | (8.2 | ) | 16.9 | (2.9 | ) | 29.5 | ||||||||||
| Adjusted Income Tax Expense | $ | 69.4 | $ | 28.0 | $ | 122.7 | $ | 63.6 | ||||||||
| Effective Tax Rate | 34.1 | % | (20.9 | %) | 34.3 | % | 154.3 | % | ||||||||
| Adjusted Effective Tax Rate | 21.8 | % | 15.9 | % | 21.7 | % | 18.9 | % | ||||||||
| 1. The six months ended September 30, 2025 period includes pre-close financing interest of $34.9 million and $11.6 million non-cash loss on our interest rate swap.2. The three months ended September 30, 2026 includes acquisition expenses of $9.7 million and divestiture expenses of $5.2 million. The six months ended September 30, 2026 period includes acquisition expenses of $22.2 million and divestiture expenses of $9.3 million. The prior year is entirely acquisition related expenses.3. Effective as of June 30, 2026, we revised the definition of Adjusted Income Before Income Taxes to exclude share-based compensation expense. Prior periods have been recast to reflect the change. For the three and six months ended September 30, 2026, share-based compensation expense of $0.5 million and $0.8 million, respectively, is included in acquisition and divestiture related expenses. For both the three and six months September 30, 2025 periods, share-based compensation expense of $8.5 million is included in acquisition and divestiture related expenses.4. Includes tax adjustments related to the amortization of certain U.S. intangible assets, asbestos, share-based compensation and discrete items relating to the acquisition and divestiture costs. |
| Adjusted Interest, Net | |||||||||||||
| (Millions of U.S. dollars) | Three Months EndedSeptember 30, | Six Months EndedSeptember 30, | |||||||||||
| 2026 | 2025 | 2026 | 2025 | ||||||||||
| Interest, net | $ | 54.8 | $ | 67.1 | $ | 116.1 | $ | 106.1 | |||||
| Pre-close financing and interest costs | — | — | — | (34.9 | ) | ||||||||
| AICF interest income | 3.3 | 2.4 | 6.6 | 5.0 | |||||||||
| Adjusted Interest, Net | $ | 58.1 | $ | 69.5 | $ | 122.7 | $ | 76.2 |
| Adjusted Other Expense (Income), Net | ||||||||||||||||
| (Millions of U.S. dollars) | Three Months EndedSeptember 30, | Six Months EndedSeptember 30, | ||||||||||||||
| 2026 | 2025 | 2026 | 2025 | |||||||||||||
| Other (income) expense, net | $ | (18.9 | ) | $ | (1.4 | ) | $ | (19.9 | ) | $ | 9.7 | |||||
| Non-cash gain on foreign currency forward contracts | 19.4 | — | 19.4 | — | ||||||||||||
| Non-cash loss on interest rate swap | — | — | — | (11.6 | ) | |||||||||||
| Adjusted Other Expense (Income), Net | $ | 0.5 | $ | (1.4 | ) | $ | (0.5 | ) | $ | (1.9 | ) |
| Free Cash Flow | ||||||||
| The following Free Cash Flow reconciliation includes discontinued operations. | ||||||||
| (Millions of U.S. dollars) | Six Months EndedSeptember 30, | |||||||
| 2026 | 2025 | |||||||
| Net cash provided by operating activities | $ | 693.7 | $ | 254.3 | ||||
| Purchases of property, plant and equipment | (158.3 | ) | (195.9 | ) | ||||
| Free Cash Flow | $ | 535.4 | $ | 58.4 | ||||
| Net cash used in investing activities | $ | (172.1 | ) | $ | (4,120.8 | ) | ||
| Net cash (used in) provided by financing activities | $ | (513.3 | ) | $ | 3,848.6 |
| Pro Forma Net Sales | |||
| (Millions of U.S. dollars) | Fiscal Year Ended | ||
| March 31, 2026 | |||
| Net sales from continuing operations | $ | 4,278.9 | |
| AZEK net sales for Q1 FY26 | 416.6 | ||
| Total Pro Forma net sales from continuing operations | $ | 4,695.5 | |
Investor and Media Contact
Bill Seymour
V.P. Investor Relations
T: +1 312 856 7460
E: [email protected]
Source: James Hardie Industries plc
INVESTOR RELATIONS
[email protected]


Investor Email Alerts
Personal Information.
Email Address *Required Email Address is required. Email Address is invalid.
Investor Alert Options *
- News
- Quarterly Reports
- Annual Reports
- SEC Filings
- End of Day Stock Quote
- Events & Presentations
Investor Alert Options is required.
The captcha test has failed. Please try again.
Submit

© 2026 James Hardie Industries PLC - All rights reserved
Change in substantial holding
Bull 0
Bear 0
Routine
Change in substantial holding
Bull 0
Bear 0
Routine
James Hardie Announces Timing of Second Quarter FY27 Earnings Release and Conference Call
Bull 0
Bear 0
Routine
October 22, 2026
CHICAGO--(BUSINESS WIRE)-- James Hardie Industries plc (NYSE / ASX : JHX) ("James Hardie" or the "Company"), a leading provider of exterior home and outdoor living solutions, today announced it will release financial results for the second quarter of its 2027 fiscal year after the market closes in the United States on Thursday, November 5th and before the market opens in Australia on Friday, November 6th. Following the release, the company will hold a conference call to discuss results, hosted by Aaron Erter, CEO and Ryan Lada, CFO. The event will be webcast live on the Investor Relations page of James Hardie’s corporate website (www.jameshardie.com ) at the respective times for the following time zones:
- US: 5PM EDT / 4PM CDT on Thursday, November 5 th, 2026
- Dublin: 10PM IST on Thursday, November 5 th, 2026
- Australia: 9AM AEDT on Friday, November 6 th, 2026
Webcast Registration: https://events.q4inc.com/attendee/487064195
About James Hardie
James Hardie Industries plc is the industry leader in exterior home and outdoor living solutions, with a portfolio that includes fiber cement, fiber gypsum, and composite and PVC decking and railing products. Products offered by James Hardie are engineered for beauty, durability, and climate resilience, and include trusted brands like Hardie®, TimberTech®, AZEK® Exteriors, Versatex®, fermacell® and StruXure®. With a global footprint, the James Hardie portfolio is marketed and sold throughout North America, Europe, Australia and New Zealand.
James Hardie Industries plc is incorporated and existing under the laws of Ireland. As an Irish plc, James Hardie is governed by the Irish Companies Act. James Hardie’s principal executive offices are located at 1st Floor, Block A, One Park Place, Upper Hatch Street, Dublin 2, D02 FD79, Ireland.
**Investor and Media Contact
**Bill Seymour
[email protected]
Source: James Hardie Industries plc
INVESTOR RELATIONS
[email protected]
Investor Email Alerts
Personal Information.
Email Address *Required Email Address is required. Email Address is invalid.
Investor Alert Options *
- News
- Quarterly Reports
- Annual Reports
- SEC Filings
- End of Day Stock Quote
- Events & Presentations
Investor Alert Options is required.
The captcha test has failed. Please try again.
Submit
© 2026 James Hardie Industries PLC - All rights reserved
Change in substantial holding
Bull 0
Bear 0
Routine
Statement of CDIs on issue - JHX
Bull 0
Bear 0
Routine
James Hardie Announces Appointment of New Non-Executive Director
Bull 1
Bear 0
Management
October 1, 2026
CHICAGO--(BUSINESS WIRE)-- James Hardie Industries plc (NYSE / ASX: JHX) ("James Hardie" or the "Company"), a leading provider of exterior home and outdoor living solutions, is pleased to announce the appointment of Jennifer Kong-Picarello as an independent non-executive director of James Hardie to be effective October 1, 2026.
Ms. Kong-Picarello, a resident of the United States, is a serving public company Chief Financial Officer with more than 25 years of leadership across NYSE-listed and multinational organizations in the manufacturing, industrial technology and energy management sectors. She currently serves as Senior Vice President and Chief Financial Officer of Terex Corporation (NYSE: TEX), an approximately $8bn global manufacturer of specialty vehicles and industrial equipment with global manufacturing operations, overseeing finance, treasury, mergers and acquisitions, enterprise risk, investor relations and internal audit worldwide.
Prior to joining Terex, Ms. Kong-Picarello was Senior Vice President and Chief Financial Officer of the then €27bn revenue Energy Management segment of Schneider Electric SE and before that, held a number of Chief Financial Officer roles at Honeywell, including Vice President and Chief Financial Officer of its Intelligrated warehouse automation and material handling business, and Chief Financial Officer of its Smart Meter Energy business, where she oversaw the consolidation of its manufacturing footprint. Her earlier career included finance and audit leadership roles at Tyco International, following a foundation in public accounting at Deloitte. Over her career she has built and led global finance organizations of up to 540 professionals across more than 25 countries.
Ms. Kong-Picarello holds a Bachelor of Accountancy from Nanyang Technological University, Singapore, and is a Certified Public Accountant (inactive). It is anticipated that Ms. Kong-Picarello will join the Audit Committee of the Board in November 2026.
Commenting on the appointment, Nigel Stein, Chair of James Hardie, said, “I am delighted Jennifer has agreed to join the Board. As a serving public company Chief Financial Officer with more than 25 years of experience in global manufacturing, she brings deep expertise in financial management, capital allocation and M&A execution and integration. Her experience in using technology and digitalization to improve business performance will be of real benefit as we continue to execute our growth strategy, integrate our businesses and build on the advantages of our combined portfolio. Jennifer will be a valuable addition to the Board. I look forward to her contributions.”
This media release has been authorized for release by the Board of Directors.
About James Hardie
James Hardie Industries plc is the industry leader in exterior home and outdoor living solutions, with a portfolio that includes fiber cement, fiber gypsum, and composite and PVC decking and railing products. Products offered by James Hardie are engineered for beauty, durability, and climate resilience, and include trusted brands like Hardie®, TimberTech®, AZEK® Exteriors, Versatex®, fermacell® and StruXure®. With a global footprint, the James Hardie portfolio is marketed and sold throughout North America, Europe, Australia and New Zealand.
James Hardie Industries plc is incorporated and existing under the laws of Ireland. As an Irish plc, James Hardie is governed by the Irish Companies Act. James Hardie’s principal executive offices are located at 1st Floor, Block A, One Park Place, Upper Hatch Street, Dublin 2, D02 FD79, Ireland.
Investor and Media Contact
Bill Seymour
Vice President, Investor Relations
[email protected]
Source: James Hardie Industries plc
INVESTOR RELATIONS
[email protected]
Investor Email Alerts
Personal Information.
Email Address *Required Email Address is required. Email Address is invalid.
Investor Alert Options *
- News
- Quarterly Reports
- Annual Reports
- SEC Filings
- End of Day Stock Quote
- Events & Presentations
Investor Alert Options is required.
The captcha test has failed. Please try again.
Submit
© 2026 James Hardie Industries PLC - All rights reserved
James Hardie Hosts 2026 Investor Day, Outlines Path to Long-term Value Creation
Bull 4
Bear 0
Guidance
September 15, 2026
Targets annual organic growth of 4% to 7% above market – with compounding earnings
Expects to achieve $125 million in cost synergies one year ahead of schedule, $500 million in revenue synergies on track
Reaffirms capital allocation priorities, including reducing net leverage to below 2.0x by Q2 FY28
Raises FY27 Free Cash Flow target, while reaffirming net sales and Adjusted EBITDA guidance
NEW YORK--(BUSINESS WIRE)-- James Hardie Industries plc (NYSE / ASX: JHX) (“James Hardie” or the “Company”), a leading provider of exterior home and outdoor living solutions, is holding its first Investor Day since combining with AZEK today in New York City, September 15, 2026, beginning at 8:30 a.m. ET.
CEO Aaron Erter, joined by other members of the senior leadership team, will present an in-depth look at the Company’s growth strategy and its path to long-term value creation. The presentation will explore the core elements of the Company’s investment thesis, including:
- Growth above market – without cycle dependency
- Enduring competitive advantages
- Compelling growth algorithm with compounding earnings
- Enhanced Free Cash Flow, with deleveraging
- Delivering consistent execution to build long-term value
“We are excited to host our first Investor Day as a combined company and show how bringing together James Hardie and AZEK creates a superior growth platform,” said Aaron Erter, CEO. “Today, we will provide a deeper look at the strength and resilience of our business model, our competitive advantages, and the substantial near-term and long-term opportunities ahead.”
Erter continued, “We are also introducing our financial growth algorithm that outlines the building blocks to deliver 4% to 7% growth above market. This will be driven by a $23 billion material conversion opportunity, self-help growth initiatives, and $500 million in anticipated revenue synergies – all without underwriting a housing recovery.”
“Today, we are outlining a clear path to compounding earnings and cash flow, and to creating long-term shareholder value,” said Ryan Lada, CFO. “We are seeing consistent demand for our products and are executing well in the areas we can control. This gives us confidence to reaffirm our second quarter and fiscal 2027 sales and Adjusted EBITDA guidance1 and raise our fiscal 2027 Free Cash Flow guidance, despite the continued challenging macro backdrop. We also now expect to achieve our original $125 million cost synergy target approximately one year ahead of schedule. Our improving Free Cash Flow allows us to de-lever while enhancing capital allocation optionality.”
Webcast Details:
A link to the live webcast and presentation materials of James Hardie’s 2026 Investor Day will be available today at approximately 8:30 a.m. ET Here . Webcast registration for the event is required. An archived replay of the webcast will be available shortly after the event concludes.
1 The Company’s guidance in the presentation materials referenced above has been adjusted to exclude the contribution of the Company’s European operations pending the anticipated divestiture.
About James Hardie
James Hardie Industries plc is the industry leader in exterior home and outdoor living solutions, with a portfolio that includes fiber cement, fiber gypsum, and composite and PVC decking and railing products. Products offered by James Hardie are engineered for beauty, durability, and climate resilience, and include trusted brands like Hardie®, TimberTech®, AZEK® Exteriors, Versatex®, fermacell® and StruXure®. With a global footprint, the James Hardie portfolio is marketed and sold throughout North America, Europe, and Australia & New Zealand.
James Hardie Industries plc is incorporated and existing under the laws of Ireland. As an Irish plc, James Hardie is governed by the Irish Companies Act. James Hardie’s principal executive offices are located at 1st Floor, Block A, One Park Place, Upper Hatch Street, Dublin 2, D02 FD79, Ireland.
Forward-Looking Statements
This press release contains forward-looking statements and information within the meaning of the Private Securities Litigation Reform Act of 1995. These statements, which are not statements of historical fact, contain estimates, assumptions, projections and/or expectations regarding future events, which may or may not occur. Words such as “believe,” “anticipate,” “plan,” “expect,” “intend,” “target,” “estimate,” “project,” “predict,” “forecast,” “guideline,” “aim,” “will,” “should,” “likely,” “continue,” “may,” “objective,” “outlook” and similar expressions are intended to identify forward-looking statements but are not the exclusive means of identifying such statements. These forward-looking statements are subject to a number of risks, uncertainties and assumptions. Many factors could cause the Company’s actual results, performance or achievements to be materially different from those expressed or implied in this release, including, among others, the risks and uncertainties described in "Risk Factors" in the Company’s Annual Report on Form 10-K for the fiscal year ended March 31, 2026; changes in general economic, political, governmental and business conditions globally and in the countries in which the Company does business; changes in interest rates; changes in inflation rates; changes in exchange rates; the level of construction generally; changes in cement demand and prices; changes in raw material and energy prices; changes in business strategy; the ongoing AZEK integration and its anticipated benefits and various other factors. Should one or more of these risks or uncertainties materialize, or should underlying assumptions prove incorrect, actual results may vary materially from those described herein. Forward-looking statements are based on the Company’s current expectations, estimates and assumptions. Readers are cautioned not to place undue reliance on forward-looking statements. Forward-looking statements speak only as of the date they are made, and the Company assumes no obligation to update any forward-looking statements or information except as required by law.
Investor and Media Contact
Investors:
Bill Seymour
V.P. Investor Relations
E: [email protected]
Source: James Hardie Industries plc
INVESTOR RELATIONS
[email protected]
Investor Email Alerts
Personal Information.
Email Address *Required Email Address is required. Email Address is invalid.
Investor Alert Options *
- News
- Quarterly Reports
- Annual Reports
- SEC Filings
- End of Day Stock Quote
- Events & Presentations
Investor Alert Options is required.
The captcha test has failed. Please try again.
Submit
© 2026 James Hardie Industries PLC - All rights reserved
James Hardie Industries plc. — Material Modification to Rights of Security Holders
Bull 0
Bear 0
Routine
The information set forth under Item 5.03 below is incorporated by reference in this Item 3.03.
Amendments or Articles of Incorporation or Bylaws; Change in Fiscal Year
At the Annual Meeting (as defined below), upon the recommendation of the Board of Directors, the shareholders of the Company approved amendments to Articles 109(a) and 110 of the Company’s Articles of Association to remove the current exclusion of the Chief Executive Officer from the classified Board provisions, so that those provisions apply consistently to all Directors. The amendments also provide that the Directors will, by majority vote, designate the class to which any Director serving as Chief Executive Officer is assigned, and that the maximum three-year re-election period in Article 110 will run from the date of that designation. The amended Articles of Association are filed as Exhibit 3.1 to this Current Report on Form 8-K and are incorporated herein by reference.
Submission of Matters to a Vote of Security Holders
On August 20, 2026, the Company held its annual general meeting of shareholders.
James Hardie Announces Strategic Divestiture of European Operations, Including Sale of Fermacell to Holcim for €840 Million
Bull 5
Bear 0
M&A
August 20, 2026
Transaction expected to accelerate deleveraging, support return of capital to shareholders, and be accretive to margin profile and ROIC
Separately, the Company also intends to close European fiber cement business to enhance focus on core growth regions
Actions further align portfolio with Company’s long-term growth strategy
James Hardie Board authorizes $250 million share repurchase program
CHICAGO--(BUSINESS WIRE)-- James Hardie Industries plc (NYSE / ASX: JHX) (“James Hardie” or the “Company”), a leading provider of exterior home and outdoor living solutions, today announced a strategic divestiture of its European operations to further align the Company’s portfolio with its long-term growth strategy. The Company has entered into an agreement to sell its sustainable walling and flooring solutions business Fermacell in Europe, including the fermacell® and Aestuver® brands, to Holcim (SIX: HOLN), a global provider of high-value end-to-end building materials and solutions based in Switzerland, for €840 million, or currently approximately $980 million USD, in cash. James Hardie also intends to close its European fiber cement business, subject to customary legal, regulatory and employee (including competent works council) consultation requirements.
“The strategic divestiture of our European operations and the intended closure of the European fiber cement business will enable us to focus on our highest growth and return opportunities,” said Aaron Erter, CEO of James Hardie. “We believe this divestiture will strengthen our balance sheet, deliver compelling value for our shareholders and position the Fermacell business for long-term success under Holcim’s ownership. We are deeply grateful to our talented team members across Europe, whose expertise and hard work have made meaningful contributions to James Hardie, and we are committed to supporting impacted European fiber cement employees.”
Continuity of Leadership and Operations
Following completion of the transaction, Fermacell will complement Holcim’s ability to broaden its integrated building systems and modular construction offerings. The business, including the fermacell® and Aestuver® brands, will continue to be led by Christian Claus, CEO of Fermacell and President of James Hardie Europe.
“Holcim is a strong strategic fit for the Fermacell business, and importantly, customers will continue to receive high quality and excellent service,” said Claus. “We share a common vision, values and commitment to shaping the future of sustainable construction. With Holcim’s global reach and complementary capabilities, we will be well positioned to support a smooth transition, build on our strong foundation and accelerate our growth. I look forward to continuing to lead the Fermacell business in this next chapter.”
Transaction Details and Use of Proceeds
The transaction is expected to be accretive to margin profile and return on invested capital post-close.
The Company intends to deploy the transaction proceeds to accelerate deleveraging and return capital to shareholders. Approximately $600 million is expected to be used to repay debt, accelerating the Company’s progress toward its stated target of net leverage below 2.0x by September 30, 2027. In addition, James Hardie’s Board of Directors has authorized a new $250 million share repurchase program. Repurchases may be effected through open-market purchases, accelerated share repurchases or other methods as determined by the Company, subject to market conditions and other relevant considerations.
The transaction is expected to close in the first half of calendar 2027, subject to customary closing conditions, including required regulatory approvals and completion of applicable employee (including competent works council) consultation processes where required.
Advisors
Goldman Sachs & Co. LLC is serving as financial advisor to James Hardie, and DLA Piper is serving as legal advisor.
This media release has been authorized for release by the Board of Directors.
**About James Hardie
**James Hardie Industries plc is the industry leader in exterior home and outdoor living solutions, with a portfolio that includes fiber cement, fiber gypsum, and composite and PVC decking and railing products. Products offered by James Hardie are engineered for beauty, durability, and climate resilience, and include trusted brands like Hardie®, TimberTech®, AZEK® Exteriors, Versatex®, fermacell® and StruXure®. With a global footprint, the James Hardie portfolio is marketed and sold throughout North America, Europe, Australia and New Zealand.
James Hardie Industries plc is incorporated and existing under the laws of Ireland. As an Irish plc, James Hardie is governed by the Irish Companies Act. James Hardie’s principal executive offices are located at 1st Floor, Block A, One Park Place, Upper Hatch Street, Dublin 2, D02 FD79, Ireland.
**Forward-Looking Statements
**This press release contains forward-looking statements and information within the meaning of the Private Securities Litigation Reform Act of 1995. These statements, which are not statements of historical fact, contain estimates, assumptions, projections and/or expectations regarding future events, which may or may not occur. Words such as “believe,” “anticipate,” “plan,” “expect,” “intend,” “target,” “estimate,” “project,” “predict,” “forecast,” “guideline,” “aim,” “will,” “should,” “likely,” “continue,” “may,” “objective,” “outlook” and similar expressions are intended to identify forward-looking statements but are not the exclusive means of identifying such statements. These forward-looking statements are subject to a number of risks, uncertainties and assumptions. Many factors could cause the Company’s actual results, performance or achievements to be materially different from those expressed or implied in this release, including, among others, the risks and uncertainties described in "Risk Factors" in the Company’s Annual Report on Form 10-K for the fiscal year ended March 31, 2026; changes in general economic, political, governmental and business conditions globally and in the countries in which the Company does business; changes in interest rates; changes in inflation rates; changes in exchange rates; the level of construction generally; changes in cement demand and prices; changes in raw material and energy prices; changes in business strategy; the ongoing AZEK integration and its anticipated benefits and various other factors. Should one or more of these risks or uncertainties materialize, or should underlying assumptions prove incorrect, actual results may vary materially from those described herein. Forward-looking statements are based on the Company’s current expectations, estimates and assumptions. Readers are cautioned not to place undue reliance on forward-looking statements. Forward-looking statements speak only as of the date they are made, and the Company assumes no obligation to update any forward-looking statements or information except as required by law.
Investor and Media Contact
Bill Seymour
V.P. Investor Relations
T: +1 312 856 7460
[email protected]
Media Contact
Ed Trissel / Arielle Rothstein
Joele Frank, Wilkinson Brimmer Katcher
+1 212-355-4449
Source: James Hardie Industries plc
INVESTOR RELATIONS
[email protected]
Investor Email Alerts
Personal Information.
Email Address *Required Email Address is required. Email Address is invalid.
Investor Alert Options *
- News
- Quarterly Reports
- Annual Reports
- SEC Filings
- End of Day Stock Quote
- Events & Presentations
Investor Alert Options is required.
The captcha test has failed. Please try again.
Submit
© 2026 James Hardie Industries PLC - All rights reserved
James Hardie Reports First Quarter FY27 Results; Raises FY27 Outlook
Bull 5
Bear 0
Results
August 6, 2026
First Quarter Highlights
Net Sales of $1.475 Billion, an Increase of 64% Year Over Year; Pro Forma Net Sales Increased 12%, Exceeding Original Guidance
Siding & Trim Net Sales of $860 Million; North American Fiber Cement Up 20% Organically
Net Income of $104 Million; Adjusted EBITDA of $422 Million, Exceeding Original Guidance
Cost Synergies Ahead of Schedule; Revenue Synergies On Track
FY27 Outlook
Raising Full-Year Outlook
Targeting Pro Forma Sales Growth of 5.9% to 9.0% and Pro Forma Adjusted EBITDA Growth of 7.4% to 13.7% for full year FY27; Organic Growth Expected in Siding & Trim for remainder of the year
FY27 Free Cash Flow Target of $500+ Million Reaffirmed, Reflecting an Increase of More than $200 Million Year Over Year
CHICAGO--(BUSINESS WIRE)-- James Hardie Industries plc (NYSE / ASX : JHX) ("James Hardie" or the "Company"), a leading provider of exterior home and outdoor living solutions, today announced results for its first quarter ended June 30, 2026.
Beginning in the first quarter FY27, the Company revised the definitions of certain non-GAAP financial measures, including Adjusted EBITDA, to exclude share-based compensation costs. The Company believes that this provides greater transparency into the underlying operating performance of the business and enhances comparability with peers. This presentation affects only how we calculate non-GAAP measures, each of which is reconciled to the most directly comparable GAAP measure in the accompanying tables, where the share-based compensation adjustment is shown separately. Such non-GAAP financial measures for prior periods presented herein have been recast to reflect this change.
Aaron Erter, CEO of James Hardie, said, "In the first quarter, we delivered sales and adjusted EBITDA ahead of our original guidance. The above-market performance was driven primarily by strong double-digit sell-through in Siding & Trim, reflecting the success of our growth initiatives, underlying demand for our products, and lapping an inventory reduction from a year ago. Deck, Rail & Accessories delivered near double-digit sell-through alongside continued channel inventory normalization. In addition, Europe and Australia & New Zealand both experienced double-digit revenue growth."
Mr. Erter added, "We are encouraged by the traction from our sales initiatives to grow the fiber cement business, continued material conversion in decking, and positive contributions from both sales and cost synergies. Our commercial synergy momentum continues to build, highlighted by our recently announced expanded nationwide partnerships with Boise Cascade and major regional distributors."
Mr. Erter concluded, "Our strong first-quarter results reflect disciplined execution and continued above-market growth, rather than a meaningful improvement in the underlying U.S. housing market. We are not assuming a housing market improvement, but our performance and growth expectations support raising our full-year outlook. We remain firmly committed to our fiscal 2027 priorities: returning fiber cement to growth, outperforming the market, expanding Adjusted EBITDA, achieving cost and revenue synergies, and driving a meaningful step-up in free cash flow to support continued deleveraging. We look forward to sharing more on our long-term strategy and value creation opportunities at our Investor Day in New York City in September."
Pro forma comparisons reflect the AZEK acquisition for periods prior to July 1, 2025. Organic net sales comparisons exclude the impact of the AZEK acquisition.
| Consolidated Financial Information | |||||||
| Q1 FY27 | Q1 FY26 | Change | |||||
| Group | (US$ millions, except per share data) | ||||||
| Net Sales | 1,474.6 | 899.9 | +64% | ||||
| Operating Income | 217.7 | 138.6 | +57% | ||||
| Operating Income Margin | 14.8 | % | 15.4 | % | (60bps) | ||
| Net Income | 104.3 | 62.6 | +67% | ||||
| Net Income per common share - Diluted | 0.18 | 0.15 | +23% | ||||
| Net Income Margin | 7.1 | % | 7.0 | % | +10bps | ||
| Adjusted Net Income | 209.3 | 136.1 | +54% | ||||
| Adjusted Diluted Earnings Per Share | 0.36 | 0.32 | +13% | ||||
| Adjusted EBITDA | 422.1 | 236.4 | +79% | ||||
| Adjusted EBITDA Margin | 28.6 | % | 26.3 | % | +230bps |
Segment Business Update and Results
| Siding & Trim | |||||||
| Q1 FY27 | Q1 FY26 | Change | |||||
| Siding & Trim | (US$ millions) | ||||||
| Net Sales | 859.8 | 641.8 | +34% | ||||
| Operating Income | 214.9 | 161.2 | +33% | ||||
| Operating Income Margin | 25.0 | % | 25.1 | % | (10bps) | ||
| Adjusted EBITDA | 287.7 | 205.8 | +40% | ||||
| Adjusted EBITDA Margin | 33.5 | % | 32.1 | % | +140bps |
Siding & Trim net sales increased 34% compared to the quarter ended June 30, 2025, driven by low-double-digit volume increase in Fiber Cement, strong price/mix realization, and the contribution from AZEK Exteriors not in the prior period. On an organic basis, net sales increased 20%, led by a return to volume growth in North American fiber cement and traction from our strategic growth initiatives.
Exterior product volumes increased mid-double digits in the quarter, with both Single-Family and Multi-Family growing double digits. Interior products, a small portion of the segment, declined low-double digits. Growth was driven by share gains against vinyl and other competitive materials, strategic initiatives such as ColorPlus® and our Expanded Statement™ program, and greater resilience in the higher-end repair and remodel and multi-family markets. Because the Company's shipments track more closely to home completions than to starts, single-family completions performing better than starts supported volumes even as forward-looking indicators remained soft.
Year-over-year volume comparisons also benefited from an easier prior-year comparison, as channel inventory was reduced in the first quarter of fiscal 2026; with inventory now at normalized levels and ordering patterns stabilized, sell-in recovered in the quarter. The Company expects this comparison benefit to moderate over the balance of the year.
First quarter reported operating income margin of 25.0% which was approximately flat year-over-year, as favorable net price and operating leverage were offset by AZEK acquisition-related expenses and the amortization of acquired AZEK intangibles. Adjusted EBITDA margin, which excludes these items, increased 140 basis points year-over-year to 33.5%, driven primarily by favorable net price realization, favorable raw material costs and continued cost savings from the Hardie Manufacturing Operating System, partially offset by higher freight costs. Higher volumes provided operating leverage on the segment's fixed cost base, and disciplined SG&A management contributed further.
As organic volumes continue to recover, the Company expects to benefit from strong incremental margins driven by the deployment of the Hardie Manufacturing Operating System and improved manufacturing utilization across the network.
| Deck, Rail & Accessories (DR&A) | ||
| Q1 FY27 | ||
| Deck, Rail & Accessories | (US$ millions) | |
| Net Sales | 305.1 | |
| Operating Loss | (3.3 | ) |
| Operating Loss Margin | (1.1 | %) |
| Adjusted EBITDA | 82.8 | |
| Adjusted EBITDA Margin | 27.1 | % |
DR&A net sales decreased 5% on a proforma basis compared to the quarter ended June 30, 2025. The volume decline reflected the planned reduction in production and shipments the Company implemented late in the prior quarter to align channel inventory with end-market demand, rather than any weakening in the underlying category. Adjusted EBITDA margin was 27.1%.
Underlying demand remained healthy and improved through the quarter, with total sell-through approaching double digit growth. Sell-through accelerated each month and outpaced shipments, bringing channel inventory down to more normalized levels and positioning the segment well for the balance of the year. Retail sell-through was particularly strong, supported by solid consumer demand as well as incremental shelf space across the combined platform.
The runway for margin improvement in DR&A is supported by cost synergies, continued progress in recycled material usage and formulation optimization, improved utilization across the manufacturing network, and the application of the Hardie Operating System ("HOS"). As production normalizes with channel demand, the Company expects manufacturing absorption to improve.
The Company continues to execute its proven growth strategy focused on material conversion from wood, share gains, and product innovation. James Hardie's combination with AZEK continues to support growth through expanded distribution, incremental shelf space, and a more comprehensive exterior solutions offering.
| Australia & New Zealand (ANZ) | |||||||
| Q1 FY27 | Q1 FY26 | Change | |||||
| Australia & New Zealand | (US$ millions, unless otherwise noted) | ||||||
| Net Sales | 153.3 | 121.6 | +26% | ||||
| Net Sales (A$ millions) | 216.0 | 189.5 | +14% | ||||
| Operating Income | 46.8 | 37.8 | +24% | ||||
| Operating Income Margin | 30.5 | % | 31.1 | % | (60bps) | ||
| EBITDA | 53.5 | 43.0 | +24% | ||||
| EBITDA Margin | 34.9 | % | 35.4 | % | (50bps) |
Net sales increased +26% in the quarter, or 14% in Australian dollars, driven by low double digit volume growth and a FX tailwind in the period. Volume growth reflected a combination of gradual improvement in the Australian housing market, ongoing share gains, continued conversion and new builder wins. EBITDA margin of 34.9% decreased 50 basis points in the quarter as strong flow-through on higher volumes was offset by the margin diluting effect of the fuel levy, which is passed through at cost, and the allocation of certain R&D expenses that were not allocated to the segment in the prior period.
The Company is focused on driving growth in Australia and New Zealand by evolving from a fiber cement business to a broader building products platform. The strategy centers on defending and extending our core fiber cement operations while accelerating adoption of whole-home solutions, including Hardie™ Gravis™, to better align with changing customer preferences and modern building design trends. While first-quarter macro conditions were relatively favorable, the Company is not assuming a market recovery and remains focused on operational execution, including advanced manufacturing initiatives and HOS productivity improvements to support margin performance and consistent profitability.
| Europe | |||||||
| Q1 FY27 | Q1 FY26 | Change | |||||
| Europe | (US$ millions, unless otherwise noted) | ||||||
| Net Sales | 156.4 | 136.5 | +15% | ||||
| Net Sales (€ millions) | 134.6 | 120.3 | +12% | ||||
| Operating Income | 20.2 | 15.1 | +34% | ||||
| Operating Income Margin | 12.9 | % | 11.1 | % | +180bps | ||
| EBITDA | 30.4 | 21.9 | +39% | ||||
| EBITDA Margin | 19.4 | % | 16.0 | % | +340bps |
Net sales increased 15% in the quarter, or 12% in Euros, driven by high-single digit volume growth in Fiber Gypsum, strong price realization, and a favorable FX tailwind. Operating Income Margin of 12.9% increased 180 basis points year over year. EBITDA margin of 19.4% increased 340 basis points year-over-year.
Margin expansion was driven by operating leverage on higher volumes, favorable pricing, and continued cost savings from HOS, which more than offset higher freight costs stemming from elevated diesel prices in the current global environment. SG&A spending was held relatively flat despite higher sales, driving improved operating leverage.
Market conditions across Europe, particularly in Germany, the Company's largest market, remain challenged, with ongoing inflationary pressure on raw materials, energy, and freight. Against this backdrop, the Company remains focused on improving the profitability of its core fiber gypsum business through product innovation and continued optimization of its operating network.
We are prioritizing our higher-margin, innovation-led product portfolio, including flooring systems and underfloor heating solutions, which continues to deliver strong growth and attractive returns. We also see an opportunity to expand in adjacent applications, including fire protection and prefabricated construction, where our differentiated product performance and sustainability advantages support continued share gains. Margin expansion is expected to be driven by operating leverage from sales growth, alongside ongoing efficiency initiatives, including manufacturing optimization, logistics improvements and HOS productivity actions.
Outlook
Q2 FY27 Guidance and Full Year Planning Assumptions
Ryan Lada, CFO said, “Our first quarter results came in ahead of expectations, and that outperformance was driven through synergy realization, our enhanced go-to-market model, and the manufacturing cost actions we took in FY26, not a shift in the underlying housing market. We’re raising our full-year guidance to reflect that execution, while continuing to plan conservatively on the macro environment.
In Siding & Trim, channel inventories are normalized and the prior-year destocking comparison is now largely behind us; we expect organic growth from repair and remodel expansion, improved mix, and commercial synergies. In Deck, Rail & Accessories, we expect above-market performance for the full year, supported by the sell-through strength we saw in the quarter as production aligns with demand. At the total company level, we expect earnings growth driven by synergy realization, manufacturing cost improvements, and disciplined execution, with Free Cash Flow improving meaningfully as most FY26 integration and acquisition-related costs roll off.”
We provide certain of our outlook on a non-GAAP basis, as we cannot predict some elements that are included in reported GAAP results, including the impact of actuarial estimates on asbestos-related assets and liabilities in future periods. Refer to the discussion of non-GAAP financial measures below for more details.
Updated Full Year Planning Assumptions:
- Net Sales for Siding & Trim: $3.226 to $3.314 billion
- Net Sales for Deck, Rail & Accessories: $1.210 to $1.240 billion
- Total Net Sales: $5.564 to $5.723 billion
- Adjusted EBITDA for Siding & Trim: $1.045 to $1.106 billion
- Adjusted EBITDA for Deck, Rail & Accessories: $339 to $357 million
- Total Adjusted EBITDA: $1.536 to $1.625 billion
- Free Cash Flow: At Least $500 million
Second Quarter Guidance Assumptions:
Both segments enter the second quarter with normalized channel inventory and improving visibility.
- Net Sales for Siding & Trim: $835 to $875 million
- Net Sales for Deck, Rail & Accessories: $365 to $395 million
- Total Net Sales: $1.485 to $1.575 billion
- Adjusted EBITDA for Siding & Trim: $259 to $289 million
- Adjusted EBITDA for Deck, Rail & Accessories: $116 to $128 million
- Total Adjusted EBITDA: $420 to $455 million
Note: All planning assumptions include a full-year contribution from the AZEK acquisition. Free cash flow represents net cash provided by operating activities less purchases of property, plant and equipment plus proceeds from the sale of property, plant and equipment.
Cash Flow, Capital Investment & Allocation
First Quarter operating cash flow totaled $344.0 million, up from $206.9 million a year ago, driven by net income adjusted for non-cash items of $336.9 million and a $71.2 million working capital inflow, partially offset by $33.1 million of asbestos claims and handling costs paid. Capital expenditures totaled $89.8 million, resulting in Free Cash Flow of $254.2 million for the quarter, more than double the prior year.
Our capital allocation priorities for FY2027 are unchanged and remain sequenced: invest in organic growth, deploy capital with discipline, and reduce leverage. We are targeting less than 2.0x net leverage by the end of the second quarter of fiscal year 2028.
For the remainder of FY2027, we expect capital expenditures to be in the range of approximately 6% to 7% of net sales, reflecting maintenance and targeted growth investments across the manufacturing network. Our footprint today is well positioned to support demand across both fiber cement and decking, and we do not anticipate the need for significant new capacity in the near term.
The previously announced closures of our Fontana, California and Summerville, South Carolina facilities are expected to generate approximately $25 million in annualized cost savings for Fiscal Year 2027.
Reported Financial Results
| (Millions of U.S. dollars) | (Unaudited)June 30,2026 | March 31,2026 | |||
| Assets | |||||
| Current assets: | |||||
| Cash and cash equivalents | $ | 289.9 | $ | 269.2 | |
| Restricted cash and cash equivalents | 32.1 | 75.2 | |||
| Restricted short-term investments — Asbestos | 212.9 | 198.5 | |||
| Accounts and other receivables, net | 499.6 | 517.3 | |||
| Inventories | 612.1 | 635.7 | |||
| Prepaid expenses and other current assets | 101.8 | 120.0 | |||
| Assets held for sale | 10.8 | 10.9 | |||
| Total current assets | 1,759.2 | 1,826.8 | |||
| Property, plant and equipment, net | 3,051.4 | 3,084.6 | |||
| Operating lease right-of-use assets | 130.3 | 133.4 | |||
| Finance lease right-of-use assets | 97.7 | 100.8 | |||
| Goodwill | 4,775.8 | 4,780.4 | |||
| Intangible assets, net | 3,260.5 | 3,340.1 | |||
| Deferred income taxes | 71.3 | 73.3 | |||
| Deferred income taxes — Asbestos | 276.3 | 282.5 | |||
| Other assets | 70.9 | 66.7 | |||
| Total assets | $ | 13,493.4 | $ | 13,688.6 | |
| Liabilities and Shareholders’ Equity | |||||
| Current liabilities: | |||||
| Accounts payable and accrued liabilities | $ | 699.6 | $ | 712.5 | |
| Accrued payroll and employee benefits | 124.7 | 167.9 | |||
| Operating lease liabilities | 33.6 | 32.9 | |||
| Finance lease liabilities | 6.3 | 5.6 | |||
| Long-term debt, current portion | 43.8 | 43.8 | |||
| Accrued product warranties | 11.1 | 10.7 | |||
| Income taxes payable | 26.5 | 13.1 | |||
| Asbestos liability | 128.8 | 128.3 | |||
| Other liabilities | 35.1 | 42.6 | |||
| Total current liabilities | 1,109.5 | 1,157.4 | |||
| Long-term debt | 4,232.9 | 4,491.2 | |||
| Deferred income taxes | 426.3 | 399.7 | |||
| Operating lease liabilities | 109.5 | 114.3 | |||
| Finance lease liabilities | 95.9 | 97.9 | |||
| Accrued product warranties | 53.9 | 53.3 | |||
| Asbestos liability | 851.4 | 880.3 | |||
| Other liabilities | 73.4 | 69.0 | |||
| Total liabilities | 6,952.8 | 7,263.1 | |||
| Total shareholders’ equity | 6,540.6 | 6,425.5 | |||
| Total liabilities and shareholders’ equity | $ | 13,493.4 | $ | 13,688.6 |
| (Unaudited)Three Months Ended June 30, | ||||||
| (Millions of U.S. dollars, except per share data) | 2026 | 2025 | ||||
| Net sales | $ | 1,474.6 | $ | 899.9 | ||
| Cost of goods sold | 925.9 | 563.0 | ||||
| Gross profit | 548.7 | 336.9 | ||||
| Selling, general and administrative expenses | 295.4 | 156.1 | ||||
| Research and development expenses | 15.4 | 12.1 | ||||
| Restructuring expenses | 5.2 | — | ||||
| Acquisition related expenses | 16.6 | 29.4 | ||||
| Asbestos adjustments | (1.6 | ) | 0.7 | |||
| Operating income | 217.7 | 138.6 | ||||
| Interest, net | 61.5 | 37.8 | ||||
| Other (income) expense, net | (1.1 | ) | 11.1 | |||
| Income before income taxes | 157.3 | 89.7 | ||||
| Income tax expense | 53.0 | 27.1 | ||||
| Net income | $ | 104.3 | $ | 62.6 | ||
| Income per share: | ||||||
| Basic | $ | 0.18 | $ | 0.15 | ||
| Diluted | $ | 0.18 | $ | 0.15 | ||
| Weighted average common shares outstanding (Millions): | ||||||
| Basic | 580.3 | 429.9 | ||||
| Diluted | 584.3 | 431.1 |
| (Unaudited)Three Months Ended June 30, | |||||||
| (Millions of U.S. dollars) | 2026 | 2025 | |||||
| Cash Flows From Operating Activities | |||||||
| Net income | $ | 104.3 | $ | 62.6 | |||
| Adjustments to reconcile net income to net cash provided by operating activities: | |||||||
| Depreciation and amortization | 168.8 | 56.5 | |||||
| Lease expense | 12.5 | 8.3 | |||||
| Deferred income taxes | 29.0 | 13.8 | |||||
| Share-based compensation | 12.0 | 6.9 | |||||
| Asbestos adjustments | (1.6 | ) | 0.7 | ||||
| Non-cash restructuring expenses | 1.7 | — | |||||
| Non-cash interest expense | 2.9 | 33.6 | |||||
| Other, net | 7.3 | 22.1 | |||||
| Changes in operating assets and liabilities: | |||||||
| Accounts and other receivables | 56.0 | 77.7 | |||||
| Inventories | 26.0 | (26.8 | ) | ||||
| Operating lease assets and liabilities, net | (14.3 | ) | (7.9 | ) | |||
| Prepaid expenses and other assets | (20.6 | ) | (16.9 | ) | |||
| Insurance receivable — Asbestos | 0.8 | 0.9 | |||||
| Accounts payable and accrued liabilities | (10.8 | ) | 33.3 | ||||
| Claims and handling costs paid — Asbestos | (33.1 | ) | (29.3 | ) | |||
| Income taxes payable | 13.6 | 4.6 | |||||
| Other accrued liabilities and interest | (10.5 | ) | (33.2 | ) | |||
| Net cash provided by operating activities | $ | 344.0 | $ | 206.9 | |||
| Cash Flows From Investing Activities | |||||||
| Purchases of property, plant and equipment | $ | (89.8 | ) | $ | (103.2 | ) | |
| Capitalized interest | — | (2.1 | ) | ||||
| Purchase of restricted investments — Asbestos | (76.1 | ) | (56.6 | ) | |||
| Proceeds from restricted investments — Asbestos | 62.3 | 56.6 | |||||
| Net cash used in investing activities | $ | (103.6 | ) | $ | (105.3 | ) | |
| Cash Flows From Financing Activities | |||||||
| Proceeds from senior secured notes | $ | — | $ | 1,700.0 | |||
| Proceeds from revolving facility | 530.0 | — | |||||
| Repayments of term loans | (10.9 | ) | (290.6 | ) | |||
| Repayment of revolving facility | (380.0 | ) | — | ||||
| Repayment of senior unsecured notes | (400.0 | ) | — | ||||
| Debt issuance costs paid | — | (6.3 | ) | ||||
| Proceeds from exercise of vested stock options | 1.0 | — | |||||
| Repayment of finance lease obligations | (1.4 | ) | (0.3 | ) | |||
| Cash paid for shares withheld for taxes | (0.1 | ) | — | ||||
| Net cash (used in) provided by financing activities | $ | (261.4 | ) | $ | 1,402.8 | ||
| Effects of exchange rate changes on cash and cash equivalents, restricted cash and restricted cash — Asbestos | $ | (1.4 | ) | $ | 1.8 | ||
| Net (decrease) increase in cash and cash equivalents, restricted cash and restricted cash — Asbestos | (22.4 | ) | 1,506.2 | ||||
| Cash and cash equivalents, restricted cash and restricted cash -— Asbestos at beginning of period | 344.4 | 605.6 | |||||
| Cash and cash equivalents, restricted cash and restricted cash — Asbestos at end of period | $ | 322.0 | $ | 2,111.8 | |||
| Non-Cash Investing and Financing Activities | |||||||
| Capital expenditures incurred but not yet paid | $ | 27.1 | $ | 19.6 | |||
| Non-cash ROU assets obtained in exchange for new lease liabilities | $ | 9.4 | $ | 2.7 | |||
| Supplemental Disclosure of Cash Flow Activities | |||||||
| Cash paid during the year for interest | $ | 41.2 | $ | 4.6 |
Further Information
Readers are referred to Part 1. Item 1. Financial Statements and Item 2. Management's Discussion and Analysis of Financial Condition and Results of Operations in the Company's Quarterly Report on Form 10-Q for the quarter ended June 30, 2026 for additional information regarding the Company’s results.
All comparisons made are vs. the comparable period in the prior fiscal year and amounts presented are in U.S. dollars, unless otherwise noted.
Conference Call Details
James Hardie will hold a conference call to discuss results and outlook Thursday August 6, 2026 at 6:00pm EDT (Friday, August 7, 2026 at 8:00am AEST). Participants may register for a live webcast and access a replay following the event of the event on the Investor Relations section of the Company’s website (ir.jameshardie.com).
2026 Investor Day
James Hardie will host its Investor Day in New York City on September 15, 2026. The event will offer investors the opportunity to hear directly from key leaders across the business and gain deeper insight into our long-term strategy and value creation. Registration invitations have been distributed.
About James Hardie
James Hardie Industries plc is the industry leader in exterior home and outdoor living solutions, with a portfolio that includes fiber cement, fiber gypsum, and composite and PVC decking and railing products. Products offered by James Hardie are engineered for beauty, durability, and climate resilience, and include trusted brands like Hardie®, TimberTech®, AZEK® Exteriors, Versatex®, fermacell® and StruXure®. With a global footprint, the James Hardie portfolio is marketed and sold throughout North America, Europe, Australia and New Zealand.
James Hardie Industries plc is incorporated and existing under the laws of Ireland. As an Irish plc, James Hardie is governed by the Irish Companies Act. James Hardie’s principal executive offices are located at 1st Floor, Block A, One Park Place, Upper Hatch Street, Dublin 2, D02 FD79, Ireland.
Forward-Looking Statements
This Earnings Release contains forward-looking statements and information within the meaning of the Private Securities Litigation Reform Act of 1995. These statements, which are not statements of historical fact, contain estimates, assumptions, projections and/or expectations regarding future events, which may or may not occur. Words such as “believe,” “anticipate,” “plan,” “expect,” “intend,” “target,” “estimate,” “project,” “predict,” “forecast,” “guideline,” “aim,” “will,” “should,” “likely,” “continue,” “may,” “objective,” “outlook” and similar expressions are intended to identify forward-looking statements but are not the exclusive means of identifying such statements. These forward-looking statements are subject to a number of risks, uncertainties and assumptions. Many factors could cause the actual results, performance or achievements of James Hardie to be materially different from those expressed or implied in this release, including, among others, the risks and uncertainties described in "Risk Factors" in our Annual Report on Form 10-K for the fiscal year ended March 31, 2026; changes in general economic, political, governmental and business conditions globally and in the countries in which James Hardie does business; changes in interest rates; changes in inflation rates; changes in exchange rates; the level of construction generally; changes in cement demand and prices; changes in raw material and energy prices; changes in business strategy; the AZEK integration and its anticipated benefits and various other factors. Should one or more of these risks or uncertainties materialize, or should underlying assumptions prove incorrect, actual results may vary materially from those described herein.
Forward-looking statements are based on the Company’s current expectations, estimates and assumptions. Readers are cautioned not to place undue reliance on forward-looking statements. Forward-looking statements speak only as of the date they are made, and the Company assumes no obligation to update any forward-looking statements or information except as required by law.
Non-GAAP Financial Measures
To supplement our Earnings Release and condensed consolidated financial statements prepared and presented in accordance with generally accepted accounting principles in the United States, or ("GAAP"), we use certain non-GAAP financial measures, as described with this earnings release, to provide investors with additional useful information about our financial performance, to enhance the overall understanding of our past performance and future prospects and to allow for greater transparency with respect to important metrics used by our management for financial and operational decision-making. We are presenting these non-GAAP financial measures to assist investors in seeing our financial performance and liquidity from management’s view and because we believe they provide an additional tool for investors to use in comparing our core financial performance and liquidity over multiple periods with other companies in our industry.
- Adjusted Net Income: Defined as net income before legacy items such as asbestos related expenses and adjustments, AICF interest income, and significant non-recurring items, such as restructuring gain or expenses, pre-close financing costs, acquisition and pre-close financing related costs, inventory fair value adjustment, amortization of intangible assets resulting from AZEK acquisition, as well as share-based compensation expense and adjustments to tax expenses.
- Adjusted EBITDA: Defined as net income before interest, net, other expense (income), net, income tax expense, depreciation and amortization, legacy items such as asbestos related expenses and adjustments, share-based compensation expense, and significant non-recurring items, such as restructuring gain and expenses, acquisition related expenses and inventory fair value adjustment. Adjusted EBITDA Margin is equal to Adjusted EBITDA divided by net sales.
- Adjusted Diluted EPS: Defined as Adjusted Net Income divided by weighted average common shares outstanding – diluted, to reflect the conversion or exercise, as applicable, of all outstanding shares of restricted stock awards, restricted stock units and options to purchase shares of our common stock.
- Adjusted Segment EBITDA: Defined as segment operating income before depreciation and amortization and significant non-recurring items such as restructuring expenses, acquisition related expenses, inventory fair value adjustment and amortization of intangible assets resulting from AZEK acquisition. The Company does not calculate net income by segment, therefore, Adjusted Segment EBITDA is reconciled to the closest GAAP measure of segment profitability, Segment operating profit.
- Adjusted General Corporate and Unallocated R&D EBITDA: Defined as General Corporate and Unallocated R&D costs before depreciation and amortization, share-based compensation expense, legacy items such as asbestos related expenses and adjustments, and significant non-recurring items such as restructuring, net and acquisition related expenses. The Company does not calculate net income for General Corporate and Unallocated R&D costs, therefore, Adjusted General Corporate and Unallocated R&D EBITDA is reconciled to the closest GAAP measure of profitability, General Corporate and unallocated R&D costs.
- Adjusted Income Before Income Taxes: Defined as Income before income taxes before share-based compensation expense, legacy items such as asbestos related expenses and adjustments and AICF interest income, and significant non-recurring items such as restructuring, net, pre-close financing costs, acquisition related expenses, inventory fair value adjustment and amortization of intangible assets resulting from AZEK acquisition.
- Adjusted Income Tax Expense: Defined as income tax expense before tax adjustments.
- Adjusted Effective Tax Rate: Defined as Adjusted Income Tax Expense divided by Adjusted Income Before Income Taxes.
- Adjusted Interest, net: Defined as Interest, net before legacy items such as AICF interest income, and significant non-recurring items such as pre-close financing and interest costs.
- Adjusted Other Expense (Income), net: Defined as Other expense (income), net, before significant non-recurring items such as non-cash loss on interest rate swap.
- Free Cash Flow: Defined as net cash provided by (used in) operating activities less purchases of property, plant and equipment plus proceeds from sale of property, plant and equipment.
These non-GAAP financial measures have limitations as analytical tools, and you should not consider them in isolation or as a substitute for analysis of our results as reported under GAAP. Non-GAAP financial measures may be calculated differently from, and therefore may not be directly comparable to, similarly titled measures used by other companies. See the accompanying earnings tables for a reconciliation of these non-GAAP measures to their most directly comparable GAAP measures.
The Company is unable to forecast the comparable U.S. GAAP financial measure for future periods due to, amongst other factors, uncertainty regarding the impact of actuarial estimates on asbestos-related assets and liabilities in future periods. Such reconciling items that impact Adjusted EBITDA and Free Cash Flow have not occurred, are outside of our control or cannot be reasonably predicted. Accordingly, a reconciliation of each of Adjusted EBITDA and Free Cash Flow to its most comparable GAAP measure is not available without unreasonable effort. However, it is important to note that material changes to these reconciling items could have a significant effect on our Adjusted EBITDA and Free Cash Flow planning assumptions and future GAAP results.
This Earnings Release has been authorized by the James Hardie Board of Directors.
Non-GAAP Financial Measures
| Adjusted EBITDA and Adjusted EBITDA margin | ||||||||||
| (Millions of U.S. dollars) | Three Months Ended June 30, | Fiscal Year Ended | ||||||||
| 2026 | 2025 | March 31, 2026 | ||||||||
| Net income | $ | 104.3 | $ | 62.6 | $ | 104.0 | ||||
| Interest, net | 61.5 | 37.8 | 231.1 | |||||||
| Other (income) expense, net | (1.1 | ) | 11.1 | 9.8 | ||||||
| Income tax expense | 53.0 | 27.1 | 102.7 | |||||||
| Depreciation and amortization | 168.8 | 56.5 | 493.5 | |||||||
| Acquisition related expenses | 16.6 | 29.4 | 206.9 | |||||||
| Asbestos related expenses and adjustments | (1.0 | ) | 1.0 | 53.7 | ||||||
| Inventory fair value adjustment | — | — | 47.9 | |||||||
| Restructuring, net | 5.2 | — | 16.2 | |||||||
| Share-based compensation expense1 | 14.8 | 10.9 | 37.3 | |||||||
| Adjusted EBITDA | $ | 422.1 | $ | 236.4 | $ | 1,303.1 | ||||
| AZEK Adjusted EBITDA for Q1 FY26 | 126.8 | 126.8 | ||||||||
| Total Pro Forma Adjusted EBITDA | $ | 363.2 | $ | 1,429.9 |
| Three Months Ended June 30, | Fiscal Year Ended | ||||||||
| 2026 | 2025 | March 31, 2026 | |||||||
| Net income margin | 7.1 | % | 7.0 | % | 2.2 | % | |||
| Interest, net | 4.2 | % | 4.2 | % | 4.8 | % | |||
| Other (income) expense, net | (0.1 | )% | 1.2 | % | 0.2 | % | |||
| Income tax expense | 3.6 | % | 3.0 | % | 2.1 | % | |||
| Depreciation and amortization | 11.4 | % | 6.3 | % | 10.2 | % | |||
| Acquisition related expenses | 1.1 | % | 3.3 | % | 4.3 | % | |||
| Asbestos related expenses and adjustments | (0.1 | )% | 0.1 | % | 1.1 | % | |||
| Inventory fair value adjustment | — | % | — | % | 1.0 | % | |||
| Restructuring, net | 0.4 | % | — | % | 0.3 | % | |||
| Share-based compensation expense1 | 1.0 | % | 1.2 | % | 0.7 | % | |||
| Adjusted EBITDA Margin | 28.6 | % | 26.3 | % | 26.9 | % | |||
| Total Pro Forma Adjusted EBITDA Margin | 27.6 | % | 27.2 | % | |||||
| 1. Effective as of June 30, 2026, we revised the definition of Adjusted EBITDA and Adjusted EBITDA Margin to exclude share-based compensation expense. For the three months ended June 30, 2026 and twelve months ended March 31, 2026, share-based compensation expense of $0.4 million and $9.9 million, respectively, is included in acquisition related expenses. The prior periods have been recast to reflect this change. |
| Pro Forma net sales | ||||||||
| (Millions of U.S. dollars) | Three Months Ended June 30, | Fiscal Year Ended | ||||||
| 2025 | March 31, 2026 | |||||||
| Consolidated net sales | $ | 899.9 | $ | 4,835.8 | ||||
| AZEK net sales for Q1 FY26 | 416.6 | 416.6 | ||||||
| Total Pro Forma net sales | $ | 1,316.5 | $ | 5,252.4 | ||||
| Adjusted Net Income and Adjusted Diluted Earnings Per Share | ||||||||
| (Millions of U.S. dollars, except per share amounts) | Three Months Ended June 30, | |||||||
| 2026 | 2025 | |||||||
| Net income | $ | 104.3 | $ | 62.6 | ||||
| Asbestos related expenses and adjustments | (1.0 | ) | 1.0 | |||||
| AICF interest income | (3.3 | ) | (2.6 | ) | ||||
| Restructuring expenses | 5.2 | — | ||||||
| Pre-close financing costs1 | — | 46.5 | ||||||
| Acquisition related expenses | 16.6 | 29.4 | ||||||
| Amortization of intangible assets resulting from AZEK acquisition | 77.6 | — | ||||||
| Share-based compensation expense2 | 14.8 | 10.9 | ||||||
| Tax impact of adjustments3 | (4.9 | ) | (11.7 | ) | ||||
| Adjusted Net Income | $ | 209.3 | $ | 136.1 | ||||
| Three Months Ended June 30, | ||||||||
| 2026 | 2025 | |||||||
| Net income per common share - diluted | $ | 0.18 | $ | 0.15 | ||||
| Asbestos related expenses and adjustments | — | — | ||||||
| AICF interest income | (0.01 | ) | (0.01 | ) | ||||
| Restructuring expenses | 0.01 | — | ||||||
| Pre-close financing costs1 | — | 0.10 | ||||||
| Acquisition related expenses | 0.03 | 0.07 | ||||||
| Amortization of intangible assets resulting from AZEK acquisition | 0.13 | — | ||||||
| Share-based compensation expense2 | 0.03 | 0.03 | ||||||
| Tax impact of adjustments3 | (0.01 | ) | (0.02 | ) | ||||
| Adjusted Diluted Earnings Per Share4 | $ | 0.36 | $ | 0.32 |
| 1. The first quarter of fiscal year 2026 includes pre-close financing interest of $34.9 million and $11.6 million non-cash loss on our interest rate swap. |
| 2. Effective as of June 30, 2026, we revised the definition of Adjusted Net Income and Adjusted Diluted Earnings Per Share to exclude share-based compensation expense. For the three months ended June 30, 2026, share-based compensation expense of $0.4 million is included in acquisition related expenses. The prior period has been recast to reflect the change. |
| 3. Includes tax adjustments related to the amortization of certain U.S. intangible assets, asbestos, share-based compensation and discrete items relating to the AZEK acquisition. |
| 4. Weighted average common shares outstanding used in computing diluted net income per common share of 584.3 million and 431.1 million for the three months ended June 30, 2026 and 2025, respectively. |
| Siding & Trim Segment Adjusted EBITDA and Adjusted EBITDA Margin | ||||||
| (Millions of U.S. dollars) | Three Months Ended June 30, | |||||
| 2026 | 2025 | |||||
| Siding & Trim Segment operating income | $ | 214.9 | $ | 161.2 | ||
| Acquisition related expenses | 4.3 | 1.0 | ||||
| Amortization of intangible assets resulting from AZEK acquisition | 18.5 | — | ||||
| Depreciation and amortization | 50.0 | 43.6 | ||||
| Siding & Trim Segment Adjusted EBITDA | $ | 287.7 | $ | 205.8 |
| Three Months Ended June 30, | ||||||
| 2026 | 2025 | |||||
| Siding & Trim Segment operating income margin | 25.0 | % | 25.1 | % | ||
| Acquisition related expenses | 0.5 | % | 0.2 | % | ||
| Amortization of intangible assets resulting from AZEK acquisition | 2.2 | % | — | % | ||
| Depreciation and amortization | 5.8 | % | 6.8 | % | ||
| Siding & Trim Segment Adjusted EBITDA Margin | 33.5 | % | 32.1 | % |
| Deck, Rail & Accessories Segment Adjusted EBITDA and Adjusted EBITDA Margin | ||||
| (Millions of U.S. dollars) | Three Months Ended June 30, | |||
| 2026 | ||||
| Deck, Rail & Accessories operating loss | $ | (3.3 | ) | |
| Restructuring expenses | 5.2 | |||
| Amortization of intangible assets resulting from AZEK acquisition | 59.1 | |||
| Depreciation and amortization | 21.8 | |||
| Deck, Rail & Accessories Segment Adjusted EBITDA | $ | 82.8 |
| Three Months Ended June 30, | |||
| 2026 | |||
| Deck, Rail & Accessories operating loss margin | (1.1 | %) | |
| Restructuring expenses | 1.7 | % | |
| Amortization of intangible assets resulting from AZEK acquisition | 19.4 | % | |
| Depreciation and amortization | 7.1 | % | |
| Deck, Rail & Accessories Segment Adjusted EBITDA Margin | 27.1 | % |
| Australia & New Zealand Segment EBITDA and EBITDA Margin | ||||||
| (Millions of U.S. dollars) | Three Months Ended June 30, | |||||
| 2026 | 2025 | |||||
| Australia & New Zealand Segment operating income | $ | 46.8 | $ | 37.8 | ||
| Depreciation and amortization | 6.7 | 5.2 | ||||
| Australia & New Zealand Segment EBITDA | $ | 53.5 | $ | 43.0 |
| Three Months Ended June 30, | ||||||
| 2026 | 2025 | |||||
| Australia & New Zealand Segment operating income margin | 30.5 | % | 31.1 | % | ||
| Depreciation and amortization | 4.4 | % | 4.3 | % | ||
| Australia & New Zealand Segment EBITDA Margin | 34.9 | % | 35.4 | % |
| Europe Segment EBITDA and EBITDA Margin | ||||||
| (Millions of U.S. dollars) | Three Months Ended June 30, | |||||
| 2026 | 2025 | |||||
| Europe Segment operating income | $ | 20.2 | $ | 15.1 | ||
| Depreciation and amortization | 10.2 | 6.8 | ||||
| Europe Segment EBITDA | $ | 30.4 | $ | 21.9 |
| Three Months Ended June 30, | ||||||
| 2026 | 2025 | |||||
| Europe Segment operating income margin | 12.9 | % | 11.1 | % | ||
| Depreciation and amortization | 6.5 | % | 4.9 | % | ||
| Europe Segment EBITDA Margin | 19.4 | % | 16.0 | % |
| Adjusted General Corporate and Unallocated R&D EBITDA | ||||||||
| (Millions of U.S. dollars) | Three Months Ended June 30, | |||||||
| 2026 | 2025 | |||||||
| General Corporate and Unallocated R&D costs | $ | (60.9 | ) | $ | (75.5 | ) | ||
| Acquisition related expenses | 12.3 | 28.4 | ||||||
| Asbestos related expenses and adjustments | (1.0 | ) | 1.0 | |||||
| Share-based compensation expense1 | 14.8 | 10.9 | ||||||
| Depreciation and amortization | 2.5 | 0.9 | ||||||
| Adjusted General Corporate and Unallocated R&D EBITDA | $ | (32.3 | ) | $ | (34.3 | ) | ||
| 1. Effective as of June 30, 2026, we revised the definition of Adjusted General Corporate and Unallocated R&D EBITDA to exclude share-based compensation expense. For the three months ended June 30, 2026, share-based compensation expense of $0.4 million is included in acquisition related expenses. The prior period has been recast to reflect the change. |
| Adjusted Income Before Income Taxes, Adjusted Income Tax Expense and Adjusted Effective Tax Rate | ||||||||
| (Millions of U.S. dollars) | Three Months Ended June 30, | |||||||
| 2026 | 2025 | |||||||
| Income before income taxes | $ | 157.3 | $ | 89.7 | ||||
| Asbestos related expenses and adjustments | (1.0 | ) | 1.0 | |||||
| AICF interest income | (3.3 | ) | (2.6 | ) | ||||
| Restructuring expenses | 5.2 | — | ||||||
| Pre-close financing costs1 | — | 46.5 | ||||||
| Acquisition related expenses | 16.6 | 29.4 | ||||||
| Amortization of intangible assets resulting from AZEK acquisition | 77.6 | — | ||||||
| Share-based compensation expense2 | 14.8 | 10.9 | ||||||
| Adjusted Income Before Income Taxes | $ | 267.2 | $ | 174.9 | ||||
| Income tax expense | $ | 53.0 | $ | 27.1 | ||||
| Tax impact of adjustments3 | 4.9 | 11.7 | ||||||
| Adjusted Income Tax Expense | $ | 57.9 | $ | 38.8 | ||||
| Effective Tax Rate | 33.7 | % | 30.2 | % | ||||
| Adjusted Effective Tax Rate | 21.7 | % | 22.2 | % |
| 1. The first quarter of fiscal year 2026 includes pre-close financing interest of $34.9 million and $11.6 million non-cash loss on our interest rate swap. |
| 2. Effective as of June 30, 2026, we revised the definition of Adjusted Income Before Taxes, Adjusted Income Tax Expense and Adjusted Effective Tax Rate to exclude share-based compensation expense. For the three months ended June 30, 2026, share-based compensation expense of $0.4 million is included in acquisition related expenses. The prior period has been recast to reflect the change. |
| 3. Includes tax adjustments related to the amortization of certain U.S. intangible assets, asbestos, share-based compensation and discrete items relating to the AZEK acquisition. |
| Adjusted Interest, Net | |||||||
| (Millions of U.S. dollars) | Three Months Ended June 30, | ||||||
| 2026 | 2025 | ||||||
| Interest, net | $ | 61.5 | $ | 37.8 | |||
| Pre-close financing and interest costs | — | (34.9 | ) | ||||
| AICF interest income | 3.3 | 2.6 | |||||
| Adjusted Interest, Net | $ | 64.8 | $ | 5.5 |
| Adjusted Other Income, Net | ||||||||
| (Millions of U.S. dollars) | Three Months Ended June 30, | |||||||
| 2026 | 2025 | |||||||
| Other (income) expense, net | $ | (1.1 | ) | $ | 11.1 | |||
| Non-cash loss on interest rate swap | — | (11.6 | ) | |||||
| Adjusted Other Income, Net | $ | (1.1 | ) | $ | (0.5 | ) | ||
| Free Cash Flow | ||||||||
| (Millions of U.S. dollars) | Three Months Ended June 30, | |||||||
| 2026 | 2025 | |||||||
| Net cash provided by operating activities | $ | 344.0 | $ | 206.9 | ||||
| Purchases of property, plant and equipment | (89.8 | ) | (103.2 | ) | ||||
| Free Cash Flow | $ | 254.2 | $ | 103.7 | ||||
| Net cash used in investing activities | $ | (103.6 | ) | $ | (105.3 | ) | ||
| Net cash (used in) provided by financing activities | $ | (261.4 | ) | $ | 1,402.8 | |||
Investor and Media Contact
Bill Seymour
V.P. Investor Relations
T: +1 312 856 7460
E: [email protected]
Source: James Hardie Industries plc
INVESTOR RELATIONS
[email protected]
Investor Email Alerts
Personal Information.
Email Address *Required Email Address is required. Email Address is invalid.
Investor Alert Options *
- News
- Quarterly Reports
- Annual Reports
- SEC Filings
- End of Day Stock Quote
- Events & Presentations
Investor Alert Options is required.
The captcha test has failed. Please try again.
Submit
© 2026 James Hardie Industries PLC - All rights reserved
Boise Cascade and James Hardie Expand U.S. Nationwide Distribution Partnership
Bull 3
Bear 0
Order/contract
August 3, 2026
Boise Cascade to become the sole nationwide distributor for James Hardie’s complete portfolio of industry-leading exterior building solutions, including Hardie®, TimberTech®, and AZEK® products
BOISE, Idaho & CHICAGO--(BUSINESS WIRE)-- Boise Cascade Company (“Boise Cascade”) (NYSE: BCC) and James Hardie Building Products Inc. (“James Hardie”), a wholly-owned subsidiary of James Hardie Industries plc (“JHI”) (NYSE / ASX: JHX), today announced an expansion of their partnership under which Boise Cascade’s Building Materials Distribution division will become the sole nationwide distributor of James Hardie’s and its North American affiliates’ complete portfolio of exterior building products through its extensive network of strategically located distribution facilities across the United States, effective July 31, 2026.
Boise Cascade’s Building Materials Distribution division is one of the largest wholesale distributors of building products in North America. James Hardie is the North American leader in fiber cement siding and exterior design solutions.
Under the expanded agreement, Boise Cascade will distribute James Hardie’s comprehensive portfolio of products – including Hardie® siding and trim, and now adding AZEK® trim and moulding and TimberTech® decking and railing – through its nationwide network of distribution centers. As the two companies fully align their focus and resources, Boise Cascade will transition away from distributing competitive siding, trim, and exterior moulding products. James Hardie has designated Boise Cascade its sole nationwide distribution partner and will consolidate its distribution network across all regional markets.
Together, Boise Cascade and James Hardie will leverage their complementary strengths to better serve customers, provide broader access to dealers, contractors, and retailers, expand their market reach, and drive long-term growth and value creation for their respective stakeholders.
Specifically, as a result of the expanded partnership between the two companies, dealers and contractors will benefit from:
-
Access to James Hardie’s complete portfolio of exterior building products through a national distribution partner;
-
Increased product availability and fulfillment consistency across key markets;
-
Coordinated sales, marketing, and contractor engagement and training programs; and
-
A simpler purchasing experience supported by a trusted distribution network.
“This agreement is consistent with our focus on delivering the best products and service for our customers, which is at the core of every strategic decision we make at Boise Cascade,” said Jeff Strom, CEO of Boise Cascade. “Customers want trusted brands, reliable availability, and dependable service that makes their jobs easier. This expanded partnership will improve access to James Hardie’s industry-leading products through Boise Cascade’s nationwide distribution network, helping customers get what they need, when and where they need it. Our two organizations have shared values, complementary strengths, and an unwavering focus on delivering high-quality products and outstanding service. I look forward to working closely with the James Hardie team in the coming months to unlock the powerful potential of this expanded agreement.”
“By bringing our full exterior building products portfolio to market through Boise Cascade’s national distribution platform, we will create an even more seamless customer experience – from product selection through end use application,” said Aaron Erter, CEO of JHI. “Boise Cascade has been an outstanding partner for many years, and we are excited to strengthen our relationship as we increase the accessibility of our innovative and resilient products. Together, with our combined distribution capabilities, strong customer relationships, and proven ability to execute, we will be positioned to deliver best-in-class service to existing and prospective customers, driving long-term growth for both companies. We look forward to working alongside the Boise Cascade team in the coming months to implement a smooth transition and continue building on our successful partnership.”
James Hardie to Expand Regional Distribution Partnerships
Bull 2
Bear 0
Order/contract
August 3, 2026
Builds on longstanding regional partnerships to broaden access to James Hardie’s complete portfolio of exterior building products, adding Hardie® siding and trim to existing product offerings
CHICAGO--(BUSINESS WIRE)-- James Hardie Building Products Inc. (“James Hardie”), a wholly-owned subsidiary of James Hardie Industries plc (“JHI”) (NYSE / ASX: JHX), today announced expanded portfolio arrangements with several of its existing regional distributors to include James Hardie’s complete portfolio of exterior building products, alongside that of its North American affiliates’, in select locations: Capital Lumber Company (“Capital Lumber”), Dixie Plywood and Lumber Company (“DIXIEPLY"), Lumbermen’s Inc. (“Lumbermen’s”), Parksite, Woodgrain, and Woolf Distributing.
The participating distributors will carry the company’s complete portfolio for the first time, adding Hardie® siding and trim to their product lines alongside existing AZEK® and TimberTech® product offerings, across designated markets.
“We are pleased to build upon our longstanding regional relationships with Capital Lumber, DIXIEPLY, Lumbermen’s, Parksite, Woodgrain, and Woolf Distributing,” said Aaron Erter, CEO of JHI. “These expanded relationships are an important step in bringing the full strength of our unified portfolio to market. By creating a more connected distribution network, we will make it even easier for customers to access our trusted products and excellent service, driving long-term value creation.”
The arrangements are part of James Hardie’s broader effort to strengthen how its portfolio is brought to market across the United States. As noted in a separate press release issued today, James Hardie also announced that Boise Cascade Company (“Boise Cascade”) will become the sole U.S. nationwide distributor of James Hardie’s and its North American affiliates’ complete portfolio of exterior building products through its extensive network of strategically located distribution facilities across the United States, effective July 31, 2026.
About James Hardie Building Products Inc.
James Hardie Building Products Inc. is the North American leader in fiber cement siding and exterior design solutions and part of the larger James Hardie group of companies that offer a portfolio of leading exterior and outdoor living brands including Hardie®, TimberTech®, AZEK®, Versatex®, and StruXure®. As The Home of Resilient Beauty™, its products are trusted by architects, builders, contractors, and homeowners throughout North America.
**Forward-Looking Statements
**This communication contains forward-looking statements and information that are subject to risks, uncertainties and assumptions. Many factors could cause the actual results, performance or achievements of JHI and its subsidiaries to be materially different from those expressed or implied in this communication, including, among others, the risks and uncertainties set forth in Item 1. Part 1A "Risk Factors" in JHI’s Annual Report on Form 10-K for the fiscal year ended March 31, 2026; changes in general economic, political, governmental and business conditions globally and in the countries in which JHI does business; changes in interest rates; changes in inflation rates; changes in exchange rates; the level of construction generally; changes in cement demand and prices; changes in raw material and energy prices; changes in business strategy; and various other factors. Should one or more of these risks or uncertainties materialize, or should underlying assumptions prove incorrect, actual results may vary materially from those described herein. Neither James Hardie nor JHI assumes any obligation to update or correct the information contained in this Press Release except as required by law.
Investor and Media Contact
Bill Seymour
Vice President, Investor Relations
[email protected]
Source: James Hardie Industries plc
INVESTOR RELATIONS
[email protected]
Investor Email Alerts
Personal Information.
Email Address *Required Email Address is required. Email Address is invalid.
Investor Alert Options *
- News
- Quarterly Reports
- Annual Reports
- SEC Filings
- End of Day Stock Quote
- Events & Presentations
Investor Alert Options is required.
The captcha test has failed. Please try again.
Submit
© 2026 James Hardie Industries PLC - All rights reserved
James Hardie Announces Preliminary First Quarter FY 2027 Results, Exceeding Prior Guidance on Strength in Siding & Trim and Deck, Rail & Accessories
Bull 4
Bear 0
Results
July 22, 2026
CHICAGO--(BUSINESS WIRE)-- James Hardie Industries plc (NYSE / ASX: JHX) ("James Hardie" or the "Company"), a leading provider of exterior home and outdoor living solutions, today announced preliminary expected financial results for the fiscal first quarter ended June 30, 2026. The Company is providing this update in accordance with its continuous disclosure obligations under ASX Listing Rule 3.1.
Preliminary results for the quarter exceeded the high end of the Company's prior consolidated guidance range, driven primarily by stronger-than-anticipated Siding & Trim sales.
Preliminary Expected Financial Information
Below are the Company's preliminary expected ranges for selected unaudited financial results for the fiscal first quarter ended June 30, 2026, compared to the prior guidance for the fiscal first quarter ended June 30, 2026, provided on May 19, 2026.
| Q1 FY27 Preliminary(Expected Range) | Q1 FY27 Prior Guidance (provided 5/19/26) | |
| Net Sales (Consolidated) | $1.449 to $1.475 billion | $1.315 to $1.354 billion |
| GAAP Net Income (Consolidated) | $102 to $104 million | n/a |
| Adjusted EBITDA (Consolidated) | $399 to $407 million | $354 to $375 million |
| Net Sales (Siding & Trim) | $846 to $860 million | $758 to $781 million |
| GAAP Operating Income (Siding & Trim) | $211 to $215 million | n/a |
| Adjusted EBITDA (Siding & Trim) | $282 to $288 million | $256 to $272 million |
| Net Sales (DR&A) | $296 to $305 million | $291 to $300 million |
| GAAP Operating Loss (DR&A) | $(3.1) to $(3.3) million | n/a |
| Adjusted EBITDA (DR&A) | $79 to $83 million | $78 to $82 million |
| Note: These estimates are preliminary and subject to the Company’s detailed quarter-end closing procedures. Refer to additional related cautionary notes within this press release for more information. Adjusted EBITDA is a non-GAAP financial measure. See "Cautionary Note and Use of Non-GAAP Financial Measures" below. |
Aaron Erter, CEO of James Hardie said, "Our first quarter results are expected to exceed our prior guidance, primarily as a result of better-than-expected sales in Siding & Trim. Siding & Trim net sales reflected strong sell-through and underlying demand for our products. Our performance in Deck, Rail & Accessories was driven by channel inventory normalization and sell-through that improved throughout the quarter.”
“We are pleased with our fiscal first quarter preliminary results. We believe our performance reflects our team’s execution and growth above market, rather than a meaningful improvement in the overall U.S. housing market. That said, we are encouraged by the positive traction from our initiatives to grow our fiber cement business, continued conversion in decking and the positive contribution from sales and cost synergies. We will provide an update on our full year guidance with our first quarter earnings call.”
This Press Release has been authorized by the James Hardie CEO.
Fiscal First Quarter Earnings Release and Conference Call
James Hardie will release fiscal first quarter 2027 results after the market close and hold a conference call to discuss results and its outlook on Thursday, August 6, 2026 (6PM EDT) / Friday, August 7, 2026 (8AM AEST). Participants may register for the live webcast and access a replay following the event on the Investor Relations section of the Company's website (ir.jameshardie.com).
About James Hardie
James Hardie Industries plc is the industry leader in exterior home and outdoor living solutions, with a portfolio that includes fiber cement, fiber gypsum, and composite and PVC decking and railing products. Products offered by James Hardie are engineered for beauty, durability, and climate resilience, and include trusted brands like Hardie®, TimberTech®, AZEK® Exteriors, Versatex®, fermacell® and StruXure®. With a global footprint, the James Hardie portfolio is marketed and sold throughout the United States, Canada, Europe, Australia, and New Zealand.
James Hardie Industries plc is incorporated and existing under the laws of Ireland. As an Irish plc, James Hardie is governed by the Irish Companies Act. James Hardie's principal executive offices are located at 1st Floor, Block A, One Park Place, Upper Hatch Street, Dublin 2, D02 FD79, Ireland.
Cautionary Note and Use of Non-GAAP Financial Measures
The Company’s condensed consolidated financial statements as of, and for the three months ended, June 30, 2026 are not yet available. Accordingly, the information presented above reflects the Company’s preliminary estimates subject to the completion of the Company’s financial closing procedures and any adjustments that may result from the completion of the quarterly review of the Company’s condensed consolidated financial statements. As a result, these preliminary estimates may differ, and may differ materially, from the actual results that will be reflected in the Company’s condensed consolidated financial statements for the first quarter when they are completed and publicly disclosed. The Company’s expectations with respect to its unaudited results for the period discussed above are based upon management estimates. The Company’s independent registered public accounting firm has not audited, reviewed or performed any procedures with respect to these preliminary estimates and, accordingly, does not express an opinion or any other form of assurance about them.
This Press Release includes financial measures that are not considered a measure of financial performance under generally accepted accounting principles in the United States (GAAP), such as Adjusted EBITDA. These non-GAAP financial measures should not be considered to be more meaningful than the equivalent GAAP measure. Management has included such measures to provide investors with an alternative method for assessing its operating results in a manner that is focused on the performance of its ongoing operations and excludes the impact of certain legacy items, such as asbestos adjustments, or significant non-recurring items, such as asset impairments, restructuring expenses, acquisition and pre-close financing related costs, as well as adjustments to tax expense. Additionally, management uses such non-GAAP financial measures for the same purposes. However, these non-GAAP financial measures are not prepared in accordance with GAAP, may not be reported by all of the Company’s competitors and may not be directly comparable to similarly titled measures of the Company’s competitors due to potential differences in the exact method of calculation. For more information regarding the Company’s use of non-GAAP financial measures and their limitations, see the section titled “Non-GAAP Financial Measures” within the Company’s Annual Report for the fiscal year ended March 31, 2026.
This Press Release contains forward-looking statements and information that are subject to risks, uncertainties and assumptions. Many factors could cause the actual results, performance or achievements of James Hardie to be materially different from those expressed or implied in this release, including, among others, the risks and uncertainties set forth in Part 1, Item 1A "Risk Factors" in James Hardie’s Annual Report for the fiscal year ended March 31, 2026; changes in general economic, political, governmental and business conditions globally and in the countries in which James Hardie does business; changes in interest rates; changes in inflation rates; changes in exchange rates; the level of construction generally; changes in cement demand and prices; changes in raw material and energy prices; changes in business strategy; the AZEK acquisition and various other factors. Should one or more of these risks or uncertainties materialize, or should underlying assumptions prove incorrect, actual results may vary materially from those described herein. James Hardie assumes no obligation to update or correct the information contained in this Press Release except as required by law.
| Non-GAAP Financial Measures Reconciliations | ||||
| (Millions of US dollars) | Three Months Ended June 30, 2026 | |||
| (Estimated) | ||||
| Low | High | |||
| Consolidated Net Income | $ | 102.2 | $ | 104.2 |
| Interest, net | 60.2 | 61.5 | ||
| Other income, net | (1.1) | (1.1) | ||
| Income tax expense | 51.9 | 53.0 | ||
| Asbestos related expenses and adjustments | (1.0) | (1.0) | ||
| Restructuring expenses | 5.1 | 5.2 | ||
| Acquisition related expenses | 16.3 | 16.6 | ||
| Depreciation and amortization | 165.4 | 168.6 | ||
| Consolidated Adjusted EBITDA | $ | 399.0 | $ | 407.0 |
| (Millions of US dollars) | Three Months Ended June 30, 2026 | |||
| (Estimated) | ||||
| Low | High | |||
| Siding & Trim Segment operating income | $ | 210.6 | $ | 215.1 |
| Acquisition related expenses | 4.2 | 4.3 | ||
| Amortization of intangible assets resulting from AZEK acquisition | 18.1 | 18.5 | ||
| Depreciation and amortization | 49.1 | 50.1 | ||
| Siding & Trim Segment Adjusted EBITDA | $ | 282.0 | $ | 288.0 |
| (Millions of US dollars) | Three Months Ended June 30, 2026 | |||
| (Estimated) | ||||
| Low | High | |||
| Deck, Rail & Accessories Segment operating loss | $ | (3.1) | $ | (3.3) |
| Amortization of intangible assets resulting from AZEK acquisition | 56.4 | 59.2 | ||
| Restructuring expenses | 5.0 | 5.2 | ||
| Depreciation and amortization | 20.7 | 21.9 | ||
| Deck, Rail & Accessories Segment Adjusted EBITDA | $ | 79.0 | $ | 83.0 |
Investor and Media Contact
Bill Seymour
V.P. Investor Relations
T: +1 312 856 7460
E: [email protected]
Source: James Hardie Industries plc
INVESTOR RELATIONS
[email protected]
Investor Email Alerts
Personal Information.
Email Address *Required Email Address is required. Email Address is invalid.
Investor Alert Options *
- News
- Quarterly Reports
- Annual Reports
- SEC Filings
- End of Day Stock Quote
- Events & Presentations
Investor Alert Options is required.
The captcha test has failed. Please try again.
Submit
© 2026 James Hardie Industries PLC - All rights reserved
James Hardie Announces Timing of First Quarter FY27 Earnings Release and Conference Call
Bull 0
Bear 0
Routine
July 22, 2026
CHICAGO--(BUSINESS WIRE)-- James Hardie Industries plc (NYSE / ASX : JHX) ("James Hardie" or the "Company"), a leading provider of exterior home and outdoor living solutions, today announced it will release financial results for the first quarter of its 2027 fiscal year after the market closes in the United States on Thursday, August 6th and before the market opens in Australia on Friday, August 7th. Following the release, the company will hold a conference call to discuss results, hosted by Aaron Erter, CEO and Ryan Lada, CFO. The event will be webcast live on the Investor Relations page of James Hardie’s corporate website (www.jameshardie.com ) at the respective times for the following time zones:
- US: 6PM EDT / 5PM CDT on Thursday, August 6 th, 2026
- Dublin: 11PM IST on Thursday, August 6 th, 2026
- Australia: 8AM AEST on Friday, August 7 th, 2026
Webcast Registration: https://events.q4inc.com/attendee/441440227
About James Hardie
James Hardie Industries plc is the industry leader in exterior home and outdoor living solutions, with a portfolio that includes fiber cement, fiber gypsum, and composite and PVC decking and railing products. Products offered by James Hardie are engineered for beauty, durability, and climate resilience, and include trusted brands like Hardie®, TimberTech®, AZEK® Exteriors, Versatex®, fermacell® and StruXure®. With a global footprint, the James Hardie portfolio is marketed and sold throughout North America, Europe, Australia and New Zealand.
James Hardie Industries plc is incorporated and existing under the laws of Ireland. As an Irish plc, James Hardie is governed by the Irish Companies Act. James Hardie’s principal executive offices are located at 1st Floor, Block A, One Park Place, Upper Hatch Street, Dublin 2, D02 FD79, Ireland.
**Investor and Media Contact
**Bill Seymour
V.P. Investor Relations
T: +1 312 856 7460
[email protected]
Source: James Hardie Industries plc
INVESTOR RELATIONS
[email protected]
Investor Email Alerts
Personal Information.
Email Address *Required Email Address is required. Email Address is invalid.
Investor Alert Options *
- News
- Quarterly Reports
- Annual Reports
- SEC Filings
- End of Day Stock Quote
- Events & Presentations
Investor Alert Options is required.
The captcha test has failed. Please try again.
Submit
© 2026 James Hardie Industries PLC - All rights reserved
James Hardie Announces Redemption of Senior Unsecured Notes
Bull 0
Bear 0
Financing
June 25, 2026
CHICAGO--(BUSINESS WIRE)-- James Hardie Industries plc (NYSE/ASX: JHX) ("James Hardie" or the "Company"), a leading provider of exterior home and outdoor living solutions, today announced that James Hardie International Finance Designated Activity Company, its wholly-owned subsidiary, redeemed on June 25th, 2026 (the “Redemption Date”) its US$400 million aggregate principal amount 5.00% Senior Unsecured Notes due 2028 (the “Notes”) (ISIN USG4253KAB01/ISIN US47032FAB58). The redemption price for the Notes is equal to 100% of principal amount of the Notes redeemed, plus any accrued and unpaid interest thereon to, but excluding, the Redemption Date.
On and after the Redemption Date, the Notes will no longer be deemed outstanding and interest will no longer accrue on the Notes. Payment of the redemption price for the Notes was made through the facilities of Deutsche Bank Trust & Agency Operations.
For the purposes of ASX Listing Rule 15.5, James Hardie confirms that this document has been authorised for release to the market by Aoife Rockett, Company Secretary.
About James Hardie
James Hardie Industries plc (NYSE: JHX; ASX: JHX) is the industry leader in exterior home and outdoor living solutions, with a portfolio that includes fiber cement, fiber gypsum, and composite and PVC decking and railing products. Products offered by James Hardie are engineered for beauty, durability, and climate resilience, and include trusted brands like Hardie®, TimberTech®, AZEK® Exteriors, Versatex®, fermacell® and StruXure®. With a global footprint, the James Hardie portfolio is marketed and sold throughout North America, Europe, and the Asia-Pacific region. James Hardie Industries plc is a limited liability company incorporated in Ireland with its registered office at 1st Floor, Block A, One Park Place, Upper Hatch Street, Dublin 2, D02 FD79, Ireland.
Investor and Media Contacts
Media:
Jack Gordon
Sodali & Co.
T: +61 478 060 363
Investors:
Bill Seymour
T: +1 312 856 7460
E: [email protected]
Source: James Hardie Industries plc
INVESTOR RELATIONS
[email protected]
Investor Email Alerts
Personal Information.
Email Address *Required Email Address is required. Email Address is invalid.
Investor Alert Options *
- News
- Quarterly Reports
- Annual Reports
- SEC Filings
- End of Day Stock Quote
- Events & Presentations
Investor Alert Options is required.
The captcha test has failed. Please try again.
Submit
© 2026 James Hardie Industries PLC - All rights reserved
James Hardie Industries plc. — Regulation FD Disclosure
Bull 0
Bear 0
Routine
James Hardie Industries plc's fiscal year 2026 Irish Statutory Accounts are being furnished with this Current Report on Form 8-K as Exhibit 99.1.
James Hardie Reports Fourth Quarter FY26 and Full-Year FY26 Results; Provides FY27 Outlook
Bull 4
Bear 0
Results
May 19, 2026
Fourth Quarter Highlights
Net Sales of $1.40 Billion, an Increase of 45% Year Over Year; Organic Net Sales Decreased 1%
Net Income of $29 Million, Adjusted EBITDA of $381 Million, Exceeding Guidance and Expectations
Full Year Highlights
Net Sales of $4.84 Billion, an Increase of 25% Year Over Year; Organic Net Sales Decreased 2%
Net Income of $104 Million, Adjusted EBITDA of $1.27 Billion, Exceeding Guidance and Expectations
Cost Synergies Ahead of Schedule, Commercial Synergies On Track
FY27 Outlook
Company Targeting Pro Forma Adjusted EBITDA Growth of 4% to 8% in FY27; Organic Growth Expected in Siding & Trim
FY27 Free Cashflow of $500+ Million Expected, an Increase of more than $200+ Million Year Over Year
CHICAGO--(BUSINESS WIRE)-- James Hardie Industries plc (NYSE / ASX : JHX) ("James Hardie" or the "Company"), a leading provider of exterior home and outdoor living solutions, today announced results for its fourth quarter ending March 31, 2026.
Aaron Erter, CEO of James Hardie said, "We delivered Adjusted EBITDA above our guidance range in the fourth quarter, reflecting disciplined execution and the strength of our business model in a challenging operating environment. Despite unfavorable weather in February and early March that impacted reported results and disrupted construction activity across key regions, the business delivered underlying performance that exceeded expectations."
Mr. Erter added, “Fiscal 2026 was a transformational year for James Hardie, highlighted by the closing of the AZEK acquisition. As we integrate the businesses, we are seeing continued progress across both cost and commercial synergies, further strengthening our belief in the long-term value creation opportunity from the combination. For the full fiscal year, we delivered solid financial performance despite a challenging operating environment. Despite our markets declining mid-to-high single digits for the year, our organic net sales declined just 2% year over year. We finished the year with Adjusted EBITDA of $1.27 billion and Adjusted EBITDA margin of 26.2%. We delivered strong flow-through on our cost actions and realized meaningful benefits from the operational initiatives implemented throughout the year, positioning the business for improved margin performance moving forward.”
Mr. Erter concluded, “Inflationary and affordability pressures continue to weigh on housing activity. We are focused on what we can control: our cost base, pricing discipline, and providing exceptional products and service to our customers. Against that backdrop, we enter fiscal year 2027 with confidence. We see customers responding to our differentiated products, strong brands, and go to market strategy of the combined company. We are making solid progress on the integration and have surpassed our FY26 cost synergy target. That puts us ahead of plan and increases our confidence in achieving our $125 million cost synergy target ahead of our original three-year timeline. On the commercial front, based on recently signed agreements and the activity we’re seeing in the market, we have confidence in reaching our $125 million run-rate commercial synergy milestone exiting FY27. We also expect a meaningful step-up in Free Cash Flow to greater than $500 million in FY27. This will be driven by higher Adjusted EBITDA as we realize both cost and commercial synergies, a reduction in one-time integration and transaction-related costs, and continued discipline around capital spending and working capital. As these factors come together, cash conversion will improve, giving us greater flexibility to reduce leverage over time.”
| Consolidated Financial Information | |||||||||||
| Q4 FY26 | Q4 FY25 | Change | FY26 | FY25 | Change | ||||||
| Group | (US$ millions, except per share data) | ||||||||||
| Net Sales | 1,403.9 | 971.5 | +45% | 4,835.8 | 3,877.5 | +25% | |||||
| Operating Income | 108.8 | 62.1 | +75% | 447.6 | 655.9 | (32%) | |||||
| Operating Income Margin | 7.7% | 6.4% | +130bps | 9.3% | 16.9% | (760bps) | |||||
| Net Income | 28.5 | 43.6 | (35%) | 104.0 | 424.0 | (75%) | |||||
| Net Income per common share - Diluted | 0.05 | 0.10 | (51%) | 0.19 | 0.98 | (81%) | |||||
| Net Income Margin | 2.0% | 4.5% | (250bps) | 2.2% | 10.9% | (870bps) | |||||
| Adjusted Net Income | 172.6 | 156.1 | +11% | 595.7 | 644.3 | (8%) | |||||
| Adjusted Diluted Earnings Per Share | 0.30 | 0.36 | (19%) | 1.09 | 1.49 | (27%) | |||||
| Adjusted EBITDA | 380.9 | 268.6 | +42% | 1,265.8 | 1,079.4 | +17% | |||||
| Adjusted EBITDA Margin | 27.1% | 27.6% | (50bps) | 26.2% | 27.8% | (160bps) |
| Segment Business Update and Results | |||||||||||
| Siding & Trim | |||||||||||
| Q4 FY26 | Q4 FY25 | Change | FY26 | FY25 | Change | ||||||
| Siding & Trim | (US$ millions) | ||||||||||
| Net Sales | 767.0 | 718.9 | +7% | 2,963.1 | 2,863.3 | 3% | |||||
| Operating Income | 146.8 | 202.4 | (27%) | 661.9 | 840.9 | (21%) | |||||
| Operating Income Margin | 19.1% | 28.2% | (910bps) | 22.3% | 29.4% | (710bps) | |||||
| Adjusted EBITDA | 253.0 | 247.6 | +2% | 951.4 | 1,001.6 | (5%) | |||||
| Adjusted EBITDA Margin | 33.0% | 34.4% | (140bps) | 32.1% | 35.0% | (290bps) |
Siding & Trim net sales increased 7% compared to the quarter ended March 31, 2025, driven by the contribution from AZEK Exteriors. On an organic basis, net sales declined 7%, reflecting lower volumes from softer market demand, partially offset by price/mix.
Exterior product volumes declined low-double digits in the quarter, with Single-Family down mid-double digits, partially offset by Multi-Family growth of low-single digits. Interior product volumes declined high-single digits. The decline in Single-Family Exteriors was driven by softer new construction activity, particularly in the Southeast and Western regions, where the Company has strong exposure to large national homebuilders. Texas, the Company’s largest region by volume, declined high-single digits year-over-year but improved approximately 25% sequentially, though activity remains below historical levels.
For the full fiscal year, Exterior product volumes declined high-single digits, with Single-Family down low double digits and Multi-Family up mid-single digits. Interior product volumes declined low-double digits. Geographic trends were consistent with the fourth quarter, with the Southeast and Western regions representing the primary areas of weakness. Texas declined low-double digits year-over-year.
Market conditions remained challenging, with subdued building activity and ongoing affordability pressures. Siding & Trim experienced weather-related volume headwinds in February and early March, reflecting its geographic exposure across key new construction markets. Year-over-year comparisons were further impacted by elevated channel inventory levels in the prior year, creating an additional headwind to current quarter volumes.
Fourth quarter and full year reported operating income margins of 19.1% and 22.3% decreased 910 and 710 basis points year-over-year, respectively, primarily reflecting AZEK acquisition-related expenses, amortization of acquired intangibles, and restructuring charges. Adjusted EBITDA margin, which excludes these items, decreased 140 basis points year-over-year in the quarter to 33.0%, and decreased 290 basis points for the full year to 32.1%. Volume declines in the quarter weighed on year-over-year margins, partially offset by improved decremental margins reflecting cost actions and disciplined SG&A management. The quarterly decline was further impacted by marketing-related costs associated with the integration of the two companies, as previously committed contractor events, trade shows, and sales meetings from both organizations were held in the quarter, as well as the allocation of certain R&D expenses held at the corporate level not previously included in the segment. These headwinds were partially offset by mid-single-digit average net sales price increase.
As volumes recover, the Company expects to benefit from strong incremental margins driven by the deployment of the Hardie Manufacturing Operating System for improved manufacturing utilization across the network.
| Deck, Rail & Accessories (DR&A) | ||||||
| Q4 FY26 | FY26 | |||||
| Deck, Rail & Accessories | (US$ millions) | |||||
| Net Sales | 345.3 | 795.2 | ||||
| Operating Income (Loss) | 18.2 | (17.7 | ) | |||
| Operating Income (Loss) Margin | 5.3 | % | (2.2 | %) | ||
| Adjusted EBITDA | 97.5 | 224.8 | ||||
| Adjusted EBITDA Margin | 28.2 | % | 28.3 | % |
DR&A net sales increased +5% compared to the quarter ended March 31, 2025, prior to the acquisition, driven primarily by price/mix improvement, as volumes were essentially flat year-over-year. Adjusted EBITDA margin was 28.2% reflecting the benefit of top-line growth.
During the quarter, the Company fulfilled strong early buy orders, resulting in elevated channel inventory levels as sell-through, which was up low-single-digits, moderated in February and early March due to weather related disruptions. In response, we reduced production exiting the quarter to better align with channel conditions. We expect a temporary P&L impact in the first quarter of FY27 as this inventory is absorbed.
In addition to cost synergies, the runway for margin improvement in Deck, Rail & Accessories is supported by continued progress in recycled material usage and formulation optimization, improved utilization across the manufacturing network, and the application of the Hardie Operating System ("HOS").
We continue to execute our proven growth strategy focused on material conversion from wood, share gains, and product innovation. Recent introductions — including new railing and accessory offerings launched in early 2026 — have been well received, expanding our portfolio and enhancing both aesthetics and functionality for homeowners and contractors.
We remain focused on driving downstream demand through contractor engagement while selectively expanding our channel presence. James Hardie's combination with AZEK continues to support growth through expanded distribution, incremental shelf space and a more comprehensive exterior solutions offering.
| Australia & New Zealand (ANZ) | |||||||||||
| Q4 FY26 | Q4 FY25 | Change | FY26 | FY25 | Change | ||||||
| Australia & New Zealand | (US$ millions, unless otherwise noted) | ||||||||||
| Net Sales | 139.6 | 118.1 | +18% | 520.6 | 519.9 | —% | |||||
| Net Sales (A$ millions) | 200.2 | 188.1 | +6% | 785.8 | 795.0 | (1%) | |||||
| Operating Income | 42.5 | 43.0 | (1%) | 153.9 | 111.0 | +39% | |||||
| Operating Income Margin | 30.4% | 36.4% | (600bps) | 29.6% | 21.7% | +790bps | |||||
| Adjusted EBITDA | 50.0 | 40.8 | +23% | 177.7 | 180.5 | (2%) | |||||
| Adjusted EBITDA Margin | 35.8% | 34.5% | +130bps | 34.1% | 34.7% | (60bps) |
Net sales increased +18% in the quarter, or 6% in the Australian dollar, with mid-single digit volume growth and low-single digit average net sales price growth in Australian dollars. Adjusted EBITDA margin of 35.8% increased 130 basis points in the quarter as volume growth and lower cash costs reflecting favorable raw material prices and improved manufacturing performance drove strong operating leverage. This improvement was modestly offset by the allocation of R&D costs not previously charged to the segment and slightly higher SG&A costs, primarily marketing-related.
The Company is focused on driving growth in Australia and New Zealand by evolving from a fiber cement business to a broader building products platform. The strategy centers on defending and extending our core fiber cement operations while accelerating adoption of whole home solutions to better align with changing customer preferences and modern building design trends. While market conditions remain challenged, the ANZ team continues to focus on operational execution, including advanced manufacturing initiatives and HOS productivity improvements to support margin expansion and consistent profitability.
| Europe | |||||||||||
| Q4 FY26 | Q4 FY25 | Change | FY26 | FY25 | Change | ||||||
| Europe | (US$ millions, unless otherwise noted) | ||||||||||
| Net Sales | 152.0 | 134.5 | +13% | 556.9 | 494.3 | +13% | |||||
| Net Sales (€ millions) | 130.0 | 127.7 | +2% | 480.4 | 460.6 | +4% | |||||
| Operating Income | 14.3 | 13.3 | +8% | 52.2 | 38.0 | +37% | |||||
| Operating Income Margin | 9.4% | 9.9% | (50bps) | 9.4% | 7.7% | +170bps | |||||
| EBITDA | 22.7 | 21.8 | +4% | 82.2 | 70.4 | +17% | |||||
| EBITDA Margin | 14.9% | 16.2% | (130bps) | 14.8% | 14.2% | +60bps |
Net sales increased 13% in the quarter, or 2% in Euros, driven by low-single digit volume growth, an FX tailwind, and flat price/mix realization. Operating Margin of 9.4% decreased 50 basis points year over year. EBITDA margin of 14.9% decreased 130 basis points year over year, reflecting a prior year one-time item that did not repeat, commissioning costs associated with our new Orejo production line and higher freight to support fiber gypsum growth. These headwinds were partially offset by favorable raw material purchasing, as well as improved plant performance.
Markets across Europe remain challenged, particularly in Germany, the Company’s largest market, where recovery is expected to be gradual. Against the backdrop, we remain focused on improving profitability of our core fiber gypsum business through product innovation and continued optimization of our operating network.
We are prioritizing our higher-margin, innovation-led product portfolio, including flooring systems and underfloor heating solutions, which continues to deliver strong growth and attractive returns. We also see an opportunity to expand in adjacent applications, including fire protection and prefabricated construction, where our differentiated product performance and sustainability advantages support continued share gains. Margin expansion is expected to be driven by operating leverage from sales growth, alongside ongoing efficiency initiatives, including manufacturing optimization, logistics improvements and HOS productivity actions.
Outlook
Q1 FY27 Guidance and Full Year Planning Assumptions
Turning to guidance, Ryan Lada, CFO, said, “The operating environment remains uncertain. We are not assuming a market recovery. What gives us confidence is execution — synergy realization, our enhanced go-to-market model, manufacturing cost actions taken in FY26, and disciplined capital allocation. In forming our fiscal year 2027 outlook, we assessed a broad range of macroeconomic indicators, including commentary from large homebuilders, repair and remodel market trends, channel inventory levels across our distribution network, and broader consumer sentiment.
In Siding & Trim, channel inventories have normalized and visibility has improved. We expect to return to organic growth, driven by repair and remodel expansion in underpenetrated regions, improved product mix, and the contribution of commercial synergies from the combined platform.
In Deck, Rail & Accessories, we expect above-market performance for the full year, supported by product innovation, channel expansion, and contractor conversion.
At the total company level, we expect earnings growth, driven by synergy realization, manufacturing cost improvements, and disciplined execution. We also expect Free Cash Flow to improve meaningfully in FY27, driven by higher profitability and the roll-off of most integration and acquisition-related costs we had in FY26."
We provide certain of our outlook on a non-GAAP basis, as we cannot predict some elements that are included in reported GAAP results, including the impact of actuarial estimates on asbestos-related assets and liabilities in future periods. Refer to the discussion of non-GAAP financial measures below for more details.
Full Year Planning Assumptions Are As Follows:
- Net Sales for Siding & Trim: $3.04 to $3.13 billion
- Net Sales for Deck, Rail & Accessories: $1.11 to $1.15 billion
- Total Net Sales: $5.25 to $5.41 billion
- Adjusted EBITDA for Siding & Trim: $1.02 to $1.07 billion
- Adjusted EBITDA for Deck, Rail & Accessories: $333 to $343 million
- Total Adjusted EBITDA: $1.45 to $1.50 billion
- Free Cash Flow: At Least $500 million
Now Turning To The First Quarter:
Siding & Trim enters Q1 with normalized channel inventory and improved visibility. In Deck, Rail & Accessories, channel inventories are slightly elevated following strong early buy orders and weather-related sell-through softness in February and early March. We expect a near-term P&L impact in Q1 as inventory normalizes. The full year outlook for the segment is unchanged.
First Quarter Guidance Assumptions Are As Follows:
- Net Sales for Siding & Trim: $758 to $781 million
- Net Sales for Deck, Rail & Accessories: $291 to $300 million
- Total Net Sales: $1.32 to $1.35 billion
- Adjusted EBITDA for Siding & Trim: $256 to $272 million
- Adjusted EBITDA for Deck, Rail & Accessories: $78 to $82 million
- Total Adjusted EBITDA: $354 to $375 million
Note: All planning assumptions include a full-year contribution from the AZEK acquisition. Free cash flow represents net cash provided by operating activities less purchases of property, plant and equipment plus proceeds from the sale of property, plant and equipment.
Cash Flow, Capital Investment & Allocation
Operating cash flow totaled $589.8 million for the twelve months ended FY26, driven by net income adjusted for non-cash items of $806.7 million, partially offset by $107.0 million of asbestos claims and handling costs paid and higher working capital of $33.9 million. Capital expenditures were $383.9 million.
Our capital allocation priorities for FY2027 are straightforward: invest in organic growth, deploy capital expenditures with discipline, and reduce leverage. We are targeting approximately 2.0x net leverage by the end of the second quarter of fiscal year 2028.
Capital expenditures for FY2027 are expected to be in the range of approximately 6% to 7% of net sales, reflecting maintenance and targeted growth investments across the manufacturing network. Our current footprint is well positioned to support demand across both fiber cement and decking, and we do not anticipate the need for significant new capacity in the near term.
The previously announced closures of our Fontana, California and Summerville, South Carolina facilities are expected to generate approximately $25 million in annualized cost savings beginning in FY2027.
Reported Financial Results
| (Millions of US dollars) | **March 31 **2026 | March 31 2025 | |||
| Assets | |||||
| Current assets: | |||||
| Cash and cash equivalents | $ | 269.2 | $ | 562.7 | |
| Restricted cash and cash equivalents | 5.0 | 5.0 | |||
| Restricted cash and cash equivalents - Asbestos | 70.2 | 37.9 | |||
| Restricted short-term investments - Asbestos | 198.5 | 175.8 | |||
| Accounts and other receivables, net | 517.3 | 391.8 | |||
| Inventories | 635.7 | 347.1 | |||
| Prepaid expenses and other current assets | 113.6 | 100.6 | |||
| Assets held for sale | 10.9 | 73.1 | |||
| Insurance receivable - Asbestos | 3.5 | 5.5 | |||
| Workers’ compensation - Asbestos | 2.9 | 2.3 | |||
| Total current assets | 1,826.8 | 1,701.8 | |||
| Property, plant and equipment, net | 3,084.6 | 2,169.0 | |||
| Operating lease right-of-use-assets | 133.4 | 70.4 | |||
| Finance lease right-of-use-assets | 100.8 | 2.7 | |||
| Goodwill | 4,780.4 | 193.7 | |||
| Intangible assets, net | 3,340.1 | 145.6 | |||
| Insurance receivable - Asbestos | 20.8 | 23.2 | |||
| Workers’ compensation - Asbestos | 18.7 | 16.5 | |||
| Deferred income taxes | 73.3 | 600.4 | |||
| Deferred income taxes - Asbestos | 282.5 | 284.5 | |||
| Other assets | 27.2 | 22.1 | |||
| Total assets | $ | 13,688.6 | $ | 5,229.9 | |
| Liabilities and Shareholders’ Equity | |||||
| Current liabilities: | |||||
| Accounts payable and accrued liabilities | $ | 712.5 | $ | 446.4 | |
| Accrued payroll and employee benefits | 167.9 | 133.3 | |||
| Operating lease liabilities | 32.9 | 21.6 | |||
| Finance lease liabilities | 5.6 | 1.1 | |||
| Long-term debt, current portion | 43.8 | 9.4 | |||
| Accrued product warranties | 10.7 | 7.3 | |||
| Income taxes payable | 13.1 | 10.3 | |||
| Asbestos liability | 128.3 | 119.4 | |||
| Workers’ compensation - Asbestos | 2.9 | 2.3 | |||
| Other liabilities | 39.7 | 59.1 | |||
| Total current liabilities | 1,157.4 | 810.2 | |||
| Long-term debt | 4,491.2 | 1,110.1 | |||
| Deferred income taxes | 399.7 | 121.1 | |||
| Operating lease liabilities | 114.3 | 63.9 | |||
| Finance lease liabilities | 97.9 | 1.9 | |||
| Accrued product warranties | 53.3 | 26.9 | |||
| Asbestos liability | 880.3 | 864.2 | |||
| Workers’ compensation - Asbestos | 18.7 | 16.5 | |||
| Other liabilities | 50.3 | 53.6 | |||
| Total liabilities | 7,263.1 | 3,068.4 | |||
| Total shareholders’ equity | 6,425.5 | 2,161.5 | |||
| Total liabilities and shareholders’ equity | $ | 13,688.6 | $ | 5,229.9 |
| Three Months Ended March 31 | Years Ended March 31 | |||||||||||
| (Millions of US dollars, except per share data) | 2026 | 2025 | 2026 | 2025 | ||||||||
| Net sales | $ | 1,403.9 | $ | 971.5 | $ | 4,835.8 | $ | 3,877.5 | ||||
| Cost of goods sold | 880.5 | 598.7 | 3,106.2 | 2,372.5 | ||||||||
| Gross profit | 523.4 | 372.8 | 1,729.6 | 1,505.0 | ||||||||
| Selling, general and administrative expenses | 289.8 | 151.8 | 946.4 | 596.2 | ||||||||
| Research and development expenses | 16.2 | 12.4 | 60.7 | 48.5 | ||||||||
| Restructuring, net | 40.2 | (7.0 | ) | 16.2 | 50.3 | |||||||
| Acquisition related expenses | 17.8 | 16.5 | 206.9 | 16.5 | ||||||||
| Asbestos adjustments | 50.6 | 137.0 | 51.8 | 137.6 | ||||||||
| Operating income | 108.8 | 62.1 | 447.6 | 655.9 | ||||||||
| Interest, net | 62.3 | 2.9 | 231.1 | 10.3 | ||||||||
| Other expense, net | 0.1 | 0.4 | 9.8 | 0.2 | ||||||||
| Income before income taxes | 46.4 | 58.8 | 206.7 | 645.4 | ||||||||
| Income tax expense | 17.9 | 15.2 | 102.7 | 221.4 | ||||||||
| Net income | $ | 28.5 | $ | 43.6 | $ | 104.0 | $ | 424.0 | ||||
| Income per share: | ||||||||||||
| Basic | $ | 0.05 | $ | 0.10 | $ | 0.19 | $ | 0.98 | ||||
| Diluted | $ | 0.05 | $ | 0.10 | $ | 0.19 | $ | 0.98 | ||||
| Weighted average common shares outstanding (Millions): | ||||||||||||
| Basic | 580.1 | 429.8 | 541.8 | 430.8 | ||||||||
| Diluted | 584.7 | 430.9 | 545.5 | 432.1 |
| Years Ended March 31 | |||||||
| (Millions of US dollars) | 2026 | 2025 | |||||
| Cash Flows From Operating Activities | |||||||
| Net income | $ | 104.0 | $ | 424.0 | |||
| Adjustments to reconcile net income to net cash provided by operating activities: | |||||||
| Depreciation and amortization | 493.5 | 216.2 | |||||
| Lease expense | 41.8 | 32.9 | |||||
| Deferred income taxes | (17.9 | ) | 62.1 | ||||
| Share-based compensation | 38.0 | 23.0 | |||||
| Asbestos adjustments | 51.8 | 137.6 | |||||
| Gain on sale of land | (26.2 | ) | — | ||||
| Non-cash restructuring expenses | 23.5 | 38.2 | |||||
| Non-cash interest expense | 8.8 | 2.0 | |||||
| Non-cash charge related to step up of inventory | 47.9 | — | |||||
| Other, net | 41.5 | 19.1 | |||||
| Changes in operating assets and liabilities: | |||||||
| Accounts and other receivables | (15.6 | ) | (28.9 | ) | |||
| Inventories | (48.5 | ) | (15.7 | ) | |||
| Operating lease assets and liabilities, net | (47.3 | ) | (34.0 | ) | |||
| Prepaid expenses and other assets | (1.2 | ) | (40.6 | ) | |||
| Insurance receivable - Asbestos | 3.8 | 3.9 | |||||
| Accounts payable and accrued liabilities | 30.2 | 18.3 | |||||
| Claims and handling costs paid - Asbestos | (107.0 | ) | (114.4 | ) | |||
| Income taxes payable | 2.2 | (2.7 | ) | ||||
| Other accrued liabilities and interest | (33.5 | ) | 61.8 | ||||
| Net cash provided by operating activities | $ | 589.8 | $ | 802.8 | |||
| Cash Flows From Investing Activities | |||||||
| Purchases of property, plant and equipment | $ | (383.9 | ) | $ | (422.2 | ) | |
| Proceeds from sale of property, plant and equipment | 108.2 | 0.4 | |||||
| Capitalized interest | (6.1 | ) | (21.0 | ) | |||
| Cash consideration for The AZEK Company acquisition, net of cash acquired | (3,919.8 | ) | — | ||||
| Purchase of restricted investments - Asbestos | (190.1 | ) | (183.1 | ) | |||
| Proceeds from restricted investments - Asbestos | 183.2 | 179.2 | |||||
| Net cash used in investing activities | $ | (4,208.5 | ) | $ | (446.7 | ) | |
| Cash Flows From Financing Activities | |||||||
| Proceeds from term loans | $ | 2,500.0 | $ | — | |||
| Proceeds from senior secured notes | 1,700.0 | — | |||||
| Proceeds from revolving credit facility | 130.0 | — | |||||
| Repayments of term loans | (323.4 | ) | (7.5 | ) | |||
| Repayment of revolving credit facilities | (130.0 | ) | — | ||||
| Repayment of senior unsecured notes | (465.2 | ) | — | ||||
| Debt issuance costs paid | (41.6 | ) | — | ||||
| Proceeds from exercise of vested stock options | 1.7 | — | |||||
| Share issuance costs due to AZEK acquisition | (2.1 | ) | — | ||||
| Repayment of finance lease obligations | (4.8 | ) | (1.2 | ) | |||
| Shares repurchased | — | (149.9 | ) | ||||
| Shares issued net of cash paid for shares withheld for taxes | (13.7 | ) | (7.3 | ) | |||
| Net cash provided by (used in) financing activities | $ | 3,350.9 | $ | (165.9 | ) | ||
| Effects of exchange rate changes on cash and cash equivalents, restricted cash and restricted cash - Asbestos | $ | 6.6 | $ | (0.4 | ) | ||
| Net (decrease) increase in cash and cash equivalents, restricted cash and restricted cash - Asbestos | (261.2 | ) | 189.8 | ||||
| Cash and cash equivalents, restricted cash and restricted cash - Asbestos at beginning of period | 605.6 | 415.8 | |||||
| Cash and cash equivalents, restricted cash and restricted cash - Asbestos at end of period | $ | 344.4 | $ | 605.6 | |||
| Non-Cash Investing and Financing Activities | |||||||
| Capital expenditures incurred but not yet paid | $ | 50.2 | $ | 41.3 | |||
| Non-cash ROU assets obtained in exchange for new lease liabilities | $ | 58.5 | $ | 33.6 | |||
| Non-cash consideration for AZEK acquisition | $ | 4,143.6 | $ | — | |||
| Supplemental Disclosure of Cash Flow Activities | |||||||
| Cash paid during the year for interest | $ | 207.8 | $ | 63.6 | |||
| Cash payment for income taxes, net | $ | 85.1 | $ | 128.1 | |||
| Cash paid to AICF | $ | 125.4 | $ | 99.2 |
Further Information
Readers are referred to the Company’s Consolidated Financial Statements and Management’s Discussion and Analysis in the Company's Annual Report on Form 10-K for the year ended March 31, 2026 for additional information regarding the Company’s results.
All comparisons made are vs. the comparable period in the prior fiscal year and amounts presented are in US dollars, unless otherwise noted.
Conference Call Details
James Hardie will hold a conference call to discuss results and outlook Tuesday, May 19, 2026 at 6:00pm EDT (Wednesday, May 20, 2026 at 8:00am AEST). Participants may register for a live webcast and access a replay following the event of the event on the Investor Relations section of the Company’s website (ir.jameshardie.com ).
2026 Investor Day
James Hardie will host its Investor Day in New York City on September 15, 2026. The event will offer investors the opportunity to hear directly from key leaders across the business and gain deeper insight into the drivers of our performance and value creation. A formal invitation to register for in-person or virtual attendance will be provided in the coming weeks.
About James Hardie
James Hardie Industries plc is the industry leader in exterior home and outdoor living solutions, with a portfolio that includes fiber cement, fiber gypsum, and composite and PVC decking and railing products. Products offered by James Hardie are engineered for beauty, durability, and climate resilience, and include trusted brands like Hardie®, TimberTech®, AZEK® Exteriors, Versatex®, fermacell® and StruXure®. With a global footprint, the James Hardie portfolio is marketed and sold throughout North America, Europe, Australia and New Zealand.
James Hardie Industries plc is incorporated and existing under the laws of Ireland. As an Irish plc, James Hardie is governed by the Irish Companies Act. James Hardie’s principal executive offices are located at 1st Floor, Block A, One Park Place, Upper Hatch Street, Dublin 2, D02 FD79, Ireland.
Forward-Looking Statements
This Earnings Release contains forward-looking statements and information within the meaning of the Private Securities Litigation Reform Act of 1995. These statements, which are not statements of historical fact, contain estimates, assumptions, projections and/or expectations regarding future events, which may or may not occur. Words such as “believe,” “anticipate,” “plan,” “expect,” “intend,” “target,” “estimate,” “project,” “predict,” “forecast,” “guideline,” “aim,” “will,” “should,” “likely,” “continue,” “may,” “objective,” “outlook” and similar expressions are intended to identify forward-looking statements but are not the exclusive means of identifying such statements. These forward-looking statements are subject to a number of risks, uncertainties and assumptions. Many factors could cause the actual results, performance or achievements of James Hardie to be materially different from those expressed or implied in this release, including, among others, the risks and uncertainties described in "Risk Factors" in our Annual Report on Form 10-K for the fiscal year ended March 31, 2026; changes in general economic, political, governmental and business conditions globally and in the countries in which James Hardie does business; changes in interest rates; changes in inflation rates; changes in exchange rates; the level of construction generally; changes in cement demand and prices; changes in raw material and energy prices; changes in business strategy; the AZEK acquisition and various other factors. Should one or more of these risks or uncertainties materialize, or should underlying assumptions prove incorrect, actual results may vary materially from those described herein.
Forward-looking statements are based on the Company’s current expectations, estimates and assumptions. Readers are cautioned not to place undue reliance on forward-looking statements. Forward-looking statements speak only as of the date they are made, and the Company assumes no obligation to update any forward-looking statements or information except as required by law.
Non-GAAP Financial Measures
To supplement our Earnings Release and consolidated financial statements prepared and presented in accordance with generally accepted accounting principles in the United States, or ("GAAP"), we use certain non-GAAP financial measures, as described with this earnings release, to provide investors with additional useful information about our financial performance, to enhance the overall understanding of our past performance and future prospects and to allow for greater transparency with respect to important metrics used by our management for financial and operational decision-making. We are presenting these non-GAAP financial measures to assist investors in seeing our financial performance and liquidity from management’s view and because we believe they provide an additional tool for investors to use in comparing our core financial performance and liquidity over multiple periods with other companies in our industry.
- Adjusted Net Income: Defined as net income before asbestos related expenses and adjustments, AICF interest income, restructuring, net, pre-close financing costs, acquisition related expenses, inventory fair value adjustment, amortization of intangible assets results from AZEK acquisition and tax adjustments.
- Adjusted EBITDA: Defined as net income before interest, net, other expense (income), net, income tax expense, depreciation and amortization, asbestos related expenses and adjustments, restructuring, net, acquisition related expenses, and inventory fair value adjustment.
- Adjusted Diluted EPS: Defined as Adjusted Net Income divided by weighted average common shares outstanding – diluted, to reflect the conversion or exercise, as applicable, of all outstanding shares of restricted stock awards, restricted stock units and options to purchase shares of our common stock.
- Adjusted Segment EBITDA: Defined as segment operating income before depreciation and amortization, restructuring expenses, acquisition related expenses, and inventory fair value adjustment. The Company does not calculate net income by segment, therefore, Adjusted Segment EBITDA is reconciled to the closest GAAP measure of segment profitability, Segment operating profit.
- Adjusted General Corporate and Unallocated R&D EBITDA: Defined as General Corporate and Unallocated R&D costs before depreciation and amortization, restructuring, net, acquisition related expenses and asbestos related expenses and adjustments. The Company does not calculate net income for General Corporate and Unallocated R&D costs, therefore, Adjusted General Corporate and Unallocated R&D EBITDA is reconciled to the closest GAAP measure of profitability, General Corporate and unallocated R&D costs.
- Adjusted Income Before Income Taxes: Defined as Income before income taxes before asbestos related expenses and adjustments, AICF interest income, restructuring, net, pre-close financing costs, acquisition related expenses, inventory fair value adjustment and amortization of intangible assets resulting from AZEK acquisition.
- Adjusted Income Tax Expense: Defined as income tax expense before tax adjustments.
- Adjusted Effective Tax Rate: Defined as Adjusted Income Tax Expense divided by Adjusted Income Before Income Taxes.
- Adjusted Interest, net: Defined as Interest, net before pre-close financing and interest costs, and AICF interest income.
- Adjusted Other Expense (Income), net: Defined as Other expense (income), net before non-cash loss on interest rate swap.
- Free Cash Flow: Defined as net cash provided by (used in) operating activities less purchases of property, plant and equipment plus proceeds from sale of property, plant and equipment.
These non-GAAP financial measures have limitations as analytical tools, and you should not consider them in isolation or as a substitute for analysis of our results as reported under GAAP. Non-GAAP financial measures may be calculated differently from, and therefore may not be directly comparable to, similarly titled measures used by other companies. See the accompanying earnings tables for a reconciliation of these non-GAAP measures to their most directly comparable GAAP measures.
The Company is unable to forecast the comparable US GAAP financial measure for future periods due to, amongst other factors, uncertainty regarding the impact of actuarial estimates on asbestos-related assets and liabilities in future periods. Such reconciling items that impact Adjusted EBITDA and Free Cash Flow have not occurred, are outside of our control or cannot be reasonably predicted. Accordingly, a reconciliation of each of Adjusted EBITDA and Free Cash Flow to its most comparable GAAP measure is not available without unreasonable effort. However, it is important to note that material changes to these reconciling items could have a significant effect on our Adjusted EBITDA and Free Cash Flow planning assumptions and future GAAP results.
This Earnings Release has been authorized by the James Hardie Board of Directors.
Non-GAAP Financial Measures
| Adjusted EBITDA and Adjusted EBITDA margin | |||||||||||||
| (Millions of US dollars) | Quarter and Full Year Ended March 31 | ||||||||||||
| Q4 FY26 | Q4 FY25 | FY26 | FY25 | ||||||||||
| Net income | $ | 28.5 | $ | 43.6 | $ | 104.0 | $ | 424.0 | |||||
| Interest, net | 62.3 | 2.9 | 231.1 | 10.3 | |||||||||
| Other expense, net | 0.1 | 0.4 | 9.8 | 0.2 | |||||||||
| Income tax expense | 17.9 | 15.2 | 102.7 | 221.4 | |||||||||
| Depreciation and amortization | 163.0 | 59.4 | 493.5 | 216.2 | |||||||||
| Acquisition related expenses | 17.8 | 16.5 | 206.9 | 16.5 | |||||||||
| Asbestos related expenses and adjustments | 51.1 | 137.6 | 53.7 | 140.5 | |||||||||
| Inventory fair value adjustment | — | — | 47.9 | — | |||||||||
| Restructuring, net | 40.2 | (7.0 | ) | 16.2 | 50.3 | ||||||||
| Adjusted EBITDA | $ | 380.9 | $ | 268.6 | $ | 1,265.8 | $ | 1,079.4 | |||||
| AZEK Adjusted EBITDA for Q1 FY26 | 126.8 | ||||||||||||
| Total Pro Forma Adjusted EBITDA | $ | 1,392.6 |
| Quarter and Full Year Ended March 31 | |||||||||||
| Q4 FY26 | Q4 FY25 | FY26 | FY25 | ||||||||
| Net income margin | 2.0 | % | 4.5 | % | 2.2 | % | 10.9 | % | |||
| Interest, net | 4.4 | % | 0.3 | % | 4.8 | % | 0.3 | % | |||
| Other expense, net | — | % | — | % | 0.2 | % | — | % | |||
| Income tax expense | 1.3 | % | 1.6 | % | 2.1 | % | 5.7 | % | |||
| Depreciation and amortization | 11.6 | % | 6.1 | % | 10.2 | % | 5.6 | % | |||
| Acquisition related expenses | 1.3 | % | 1.7 | % | 4.3 | % | 0.4 | % | |||
| Asbestos related expenses and adjustments | 3.6 | % | 14.1 | % | 1.1 | % | 3.6 | % | |||
| Inventory fair value adjustment | — | % | — | % | 1.0 | % | — | % | |||
| Restructuring, net | 2.9 | % | (0.7 | )% | 0.3 | % | 1.3 | % | |||
| Adjusted EBITDA margin | 27.1 | % | 27.6 | % | 26.2 | % | 27.8 | % |
| Adjusted net income and Adjusted diluted earnings per share | ||||||||||||||||
| (Millions of US dollars, except per share amounts) | Quarter and Full Year Ended March 31 | |||||||||||||||
| Q4 FY26 | Q4 FY25 | FY26 | FY25 | |||||||||||||
| Net income | $ | 28.5 | $ | 43.6 | $ | 104.0 | $ | 424.0 | ||||||||
| Asbestos related expenses and adjustments | 51.1 | 137.6 | 53.7 | 140.5 | ||||||||||||
| AICF interest income | (2.7 | ) | (2.4 | ) | (10.1 | ) | (10.9 | ) | ||||||||
| Restructuring, net | 40.2 | (7.0 | ) | 16.2 | 50.3 | |||||||||||
| Pre-close financing costs1 | — | 0.8 | 46.5 | 0.8 | ||||||||||||
| Acquisition related expenses | 17.8 | 16.5 | 206.9 | 16.5 | ||||||||||||
| Inventory fair value adjustment | — | — | 47.9 | — | ||||||||||||
| Amortization of intangible assets resulting from AZEK acquisition | 72.4 | — | 178.7 | — | ||||||||||||
| Tax adjustments2 | (34.7 | ) | (33.0 | ) | (48.1 | ) | 23.1 | |||||||||
| Adjusted net income | $ | 172.6 | $ | 156.1 | $ | 595.7 | $ | 644.3 | ||||||||
| Quarter and Full Year Ended March 31 | ||||||||||||||||
| Q4 FY26 | Q4 FY25 | FY26 | FY25 | |||||||||||||
| Net income per common share - diluted | $ | 0.05 | $ | 0.10 | $ | 0.19 | $ | 0.98 | ||||||||
| Asbestos related expenses and adjustments | 0.09 | 0.32 | 0.10 | 0.33 | ||||||||||||
| AICF interest income | — | — | (0.02 | ) | (0.03 | ) | ||||||||||
| Restructuring, net | 0.07 | (0.02 | ) | 0.03 | 0.12 | |||||||||||
| Pre-close financing costs1 | — | — | 0.08 | — | ||||||||||||
| Acquisition related expenses | 0.03 | 0.04 | 0.38 | 0.04 | ||||||||||||
| Inventory fair value adjustment | — | — | 0.09 | — | ||||||||||||
| Amortization of intangible assets resulting from AZEK acquisition | 0.12 | — | 0.33 | — | ||||||||||||
| Tax adjustments2 | (0.06 | ) | (0.08 | ) | (0.09 | ) | 0.05 | |||||||||
| Adjusted diluted earnings per share3 | $ | 0.30 | $ | 0.36 | $ | 1.09 | $ | 1.49 |
| 1. | Includes pre-close financing interest of $34.9 million as well as an $11.6 million non-cash loss on our interest rate swap incurred in the first quarter of fiscal year 2026. |
| 2. | Includes tax adjustments related to the amortization benefit of certain US intangible assets, asbestos, and discrete items relating to the AZEK acquisition, and $18.2 million in respect of the ATO settlement agreement incurred in the second quarter of fiscal year 2026. |
| 3. | Weighted average common shares outstanding used in computing diluted net income per common share of 584.7 million and 430.9 million for the three months ended March 31, 2026 and 2025, respectively. Weighted average common shares outstanding used in computing diluted net income per common share of 545.5 million and 432.1 million for the fiscal years ended March 31, 2026 and 2025, respectively. |
| Siding & Trim Segment Adjusted EBITDA and Adjusted EBITDA margin | ||||||||||||
| (Millions of US dollars) | Quarter and Full Year Ended March 31 | |||||||||||
| Q4 FY26 | Q4 FY25 | FY26 | FY25 | |||||||||
| Siding & Trim Segment operating income | $ | 146.8 | $ | 202.4 | $ | 661.9 | $ | 840.9 | ||||
| Acquisition related expenses | 3.4 | — | 11.8 | — | ||||||||
| Inventory fair value adjustment | — | — | 11.2 | — | ||||||||
| Amortization of intangible assets resulting from AZEK acquisition | 19.1 | — | 42.7 | — | ||||||||
| Restructuring expenses | 35.6 | — | 35.6 | — | ||||||||
| Depreciation and amortization | 48.1 | 45.2 | 188.2 | 160.7 | ||||||||
| Siding & Trim Segment Adjusted EBITDA | $ | 253.0 | $ | 247.6 | $ | 951.4 | $ | 1,001.6 |
| Quarter and Full Year Ended March 31 | ||||||||||||
| Q4 FY26 | Q4 FY25 | FY26 | FY25 | |||||||||
| Siding & Trim Segment operating income margin | 19.1 | % | 28.2 | % | 22.3 | % | 29.4 | % | ||||
| Acquisition related expenses | 0.4 | % | — | % | 0.4 | % | — | % | ||||
| Inventory fair value adjustment | — | % | — | % | 0.4 | % | — | % | ||||
| Amortization of intangible assets resulting from AZEK acquisition | 2.5 | % | — | % | 1.4 | % | — | % | ||||
| Restructuring expenses | 4.7 | % | — | % | 1.2 | % | — | % | ||||
| Depreciation and amortization | 6.3 | % | 6.2 | % | 6.4 | % | 5.6 | % | ||||
| Siding & Trim Segment Adjusted EBITDA margin | 33.0 | % | 34.4 | % | 32.1 | % | 35.0 | % |
| Deck, Rail & Accessories Segment Adjusted EBITDA and Adjusted EBITDA margin | |||||||||
| (Millions of US dollars) | Quarter and Full Year Ended March 31 | ||||||||
| Q4 FY26 | FY26 | ||||||||
| Deck, Rail & Accessories operating income (loss) | $ | 18.2 | $ | (17.7 | ) | ||||
| Restructuring expenses | 1.2 | 3.4 | |||||||
| Inventory fair value adjustment | — | 36.7 | |||||||
| Amortization of intangible assets resulting from AZEK acquisition | 53.3 | 136.0 | |||||||
| Depreciation and amortization | 24.8 | 66.4 | |||||||
| Deck, Rail & Accessories Segment Adjusted EBITDA | $ | 97.5 | $ | 224.8 |
| Quarter and Full Year Ended March 31 | ||||||||
| Q4 FY26 | FY26 | |||||||
| Deck, Rail & Accessories operating income (loss) margin | 5.3 | % | (2.2 | %) | ||||
| Restructuring expenses | 0.3 | % | 0.4 | % | ||||
| Inventory fair value adjustment | — | % | 4.6 | % | ||||
| Amortization of intangible assets resulting from AZEK acquisition | 15.4 | % | 17.1 | % | ||||
| Depreciation and amortization | 7.2 | % | 8.4 | % | ||||
| Deck, Rail & Accessories Segment Adjusted EBITDA margin | 28.2 | % | 28.3 | % |
| Australia & New Zealand Segment Adjusted EBITDA and Adjusted EBITDA margin | |||||||||||||
| (Millions of US dollars) | Quarter and Full Year Ended March 31 | ||||||||||||
| Q4 FY26 | Q4 FY25 | FY26 | FY25 | ||||||||||
| Australia & New Zealand Segment operating income | $ | 42.5 | $ | 43.0 | $ | 153.9 | $ | 111.0 | |||||
| Restructuring expenses | 1.4 | (7.0 | ) | 1.4 | 50.3 | ||||||||
| Depreciation and amortization | 6.1 | 4.8 | 22.4 | 19.2 | |||||||||
| Australia & New Zealand Segment Adjusted EBITDA | $ | 50.0 | $ | 40.8 | $ | 177.7 | $ | 180.5 |
| Quarter and Full Year Ended March 31 | ||||||||||||
| Q4 FY26 | Q4 FY25 | FY26 | FY25 | |||||||||
| Australia & New Zealand Segment operating income margin | 30.4 | % | 36.4 | % | 29.6 | % | 21.7 | % | ||||
| Restructuring expenses | 1.0 | % | (5.9 | %) | 0.2 | % | 9.3 | % | ||||
| Depreciation and amortization | 4.4 | % | 4.0 | % | 4.3 | % | 3.7 | % | ||||
| Australia & New Zealand Segment Adjusted EBITDA margin | 35.8 | % | 34.5 | % | 34.1 | % | 34.7 | % |
| Europe Segment EBITDA and EBITDA margin | ||||||||||||
| (Millions of US dollars) | Quarter and Full Year Ended March 31 | |||||||||||
| Q4 FY26 | Q4 FY25 | FY26 | FY25 | |||||||||
| Europe Segment operating income | $ | 14.3 | $ | 13.3 | $ | 52.2 | $ | 38.0 | ||||
| Depreciation and amortization | 8.4 | 8.5 | 30.0 | 32.4 | ||||||||
| Europe Segment EBITDA | $ | 22.7 | $ | 21.8 | $ | 82.2 | $ | 70.4 |
| Quarter and Full Year Ended March 31 | ||||||||||||
| Q4 FY26 | Q4 FY25 | FY26 | FY25 | |||||||||
| Europe Segment operating income margin | 9.4 | % | 9.9 | % | 9.4 | % | 7.7 | % | ||||
| Depreciation and amortization | 5.5 | % | 6.3 | % | 5.4 | % | 6.5 | % | ||||
| Europe Segment EBITDA margin | 14.9 | % | 16.2 | % | 14.8 | % | 14.2 | % |
| Adjusted General Corporate and Unallocated R&D EBITDA | ||||||||||||||||
| (Millions of US dollars) | Quarter and Full Year Ended March 31 | |||||||||||||||
| Q4 FY26 | Q4 FY25 | FY26 | FY25 | |||||||||||||
| General Corporate and Unallocated R&D costs | $ | (113.0 | ) | $ | (196.6 | ) | $ | (402.7 | ) | $ | (334.0 | ) | ||||
| Restructuring, net | 2.0 | — | (24.2 | ) | — | |||||||||||
| Acquisition related expenses | 14.4 | 16.5 | 195.1 | 16.5 | ||||||||||||
| Asbestos related expenses and adjustments | 51.1 | 137.6 | 53.7 | 140.5 | ||||||||||||
| Depreciation and amortization | 3.2 | 0.9 | 7.8 | 3.9 | ||||||||||||
| Adjusted General Corporate and Unallocated R&D EBITDA | $ | (42.3 | ) | $ | (41.6 | ) | $ | (170.3 | ) | $ | (173.1 | ) |
| Adjusted income before income taxes, Adjusted income tax expense and Adjusted effective tax rate | ||||||||||||||||
| (Millions of US dollars) | Quarter and Full Year Ended March 31 | |||||||||||||||
| Q4 FY26 | Q4 FY25 | FY26 | FY25 | |||||||||||||
| Income before income taxes | $ | 46.4 | $ | 58.8 | $ | 206.7 | $ | 645.4 | ||||||||
| Asbestos related expenses and adjustments | 51.1 | 137.6 | 53.7 | 140.5 | ||||||||||||
| AICF interest income | (2.7 | ) | (2.4 | ) | (10.1 | ) | (10.9 | ) | ||||||||
| Restructuring, net | 40.2 | (7.0 | ) | 16.2 | 50.3 | |||||||||||
| Pre-close financing costs1 | — | 0.8 | 46.5 | 0.8 | ||||||||||||
| Acquisition related expenses | 17.8 | 16.5 | 206.9 | 16.5 | ||||||||||||
| Inventory fair value adjustment | — | — | 47.9 | — | ||||||||||||
| Amortization of intangible assets resulting from AZEK acquisition | 72.4 | — | 178.7 | — | ||||||||||||
| Adjusted income before income taxes | $ | 225.2 | $ | 204.3 | $ | 746.5 | $ | 842.6 | ||||||||
| Income tax expense | $ | 17.9 | $ | 15.2 | $ | 102.7 | $ | 221.4 | ||||||||
| Tax adjustments2 | 34.7 | 33.0 | 48.1 | (23.1 | ) | |||||||||||
| Adjusted income tax expense | $ | 52.6 | $ | 48.2 | $ | 150.8 | $ | 198.3 | ||||||||
| Effective tax rate | 38.6 | % | 25.9 | % | 49.7 | % | 34.3 | % | ||||||||
| Adjusted effective tax rate | 23.4 | % | 23.6 | % | 20.2 | % | 23.5 | % |
| 1. | Includes pre-close financing interest of $34.9 million as well as an $11.6 million non-cash loss on our interest rate swap incurred in the first quarter of fiscal year 2026. |
| 2. | Includes tax adjustments related to the amortization benefit of certain US intangible assets, asbestos, and discrete items relating to the AZEK acquisition, and $18.2 million in respect of the ATO settlement agreement incurred in the second quarter of fiscal year 2026. |
| Adjusted interest, net | |||||||||||||||
| (Millions of US dollars) | Quarter and Full Year Ended March 31 | ||||||||||||||
| Q4 FY26 | Q4 FY25 | FY26 | FY25 | ||||||||||||
| Interest, net | $ | 62.3 | $ | 2.9 | $ | 231.1 | $ | 10.3 | |||||||
| Pre-close financing and interest costs | — | (0.8 | ) | (34.9 | ) | (0.8 | ) | ||||||||
| AICF interest income | 2.7 | 2.4 | 10.1 | 10.9 | |||||||||||
| Adjusted interest, net | $ | 65.0 | $ | 4.5 | $ | 206.3 | $ | 20.4 |
| Adjusted other expense (income), net | |||||||||||||
| (Millions of US dollars) | Quarter and Full Year Ended March 31 | ||||||||||||
| Q4 FY26 | Q4 FY25 | FY26 | FY25 | ||||||||||
| Other expense, net | $ | 0.1 | $ | 0.4 | $ | 9.8 | $ | 0.2 | |||||
| Non-cash loss on interest rate swap | — | — | (11.6 | ) | — | ||||||||
| Adjusted other expense (income), net | $ | 0.1 | $ | 0.4 | $ | (1.8 | ) | $ | 0.2 | ||||
| Free Cash Flow | ||||||||
| (Millions of US dollars) | Full Year Ended March 31 | |||||||
| FY26 | FY25 | |||||||
| Net cash provided by operating activities | $ | 589.8 | $ | 802.8 | ||||
| Purchases of property, plant and equipment | (383.9 | ) | (422.2 | ) | ||||
| Proceeds from sale of property, plant and equipment | 108.2 | 0.4 | ||||||
| Free Cash Flow | $ | 314.1 | $ | 381.0 | ||||
| Net cash used in investing activities | $ | (4,208.5 | ) | $ | (446.7 | ) | ||
| Net cash provided by (used in) financing activities | $ | 3,350.9 | $ | (165.9 | ) | |||
**Investor and Media Contact
[email protected]
**
Source: James Hardie Industries plc
INVESTOR RELATIONS
[email protected]
Investor Email Alerts
Personal Information.
Email Address *Required Email Address is required. Email Address is invalid.
Investor Alert Options *
- News
- Quarterly Reports
- Annual Reports
- SEC Filings
- End of Day Stock Quote
- Events & Presentations
Investor Alert Options is required.
The captcha test has failed. Please try again.
Submit
© 2026 James Hardie Industries PLC - All rights reserved
James Hardie Announces Appointment of New Non-Executive Director and Retirement of Non-Executive Director
Bull 0
Bear 0
Management
May 14, 2026
SYDNEY--(BUSINESS WIRE)-- James Hardie Industries plc (NYSE / ASX: JHX) ("James Hardie" or the "Company"), a leading provider of exterior home and outdoor living solutions, is pleased to announce the appointment of Rob Sindel as an independent non-executive director of James Hardie to be effective 1 June 2026.
Mr. Sindel, a resident of Australia, is the former Managing Director and Chief Executive Officer of CSR Limited from January 2011 until September 2019. The majority of his 35-year career has been spent in the Global Building Products and Construction materials sector, working in ANZ, the US, the UK and Europe.
Mr. Sindel is an engineer by profession who has continued to develop his skills by completing additional study in finance, strategy, leadership and cultural change management. This has enabled him to drive change, M&A and cultural integration in several different businesses and geographies.
Mr. Sindel is currently the Chair of Mirvac Limited, an ASX-listed development and construction company, since January 2023, and is also the Chair of Orora Limited (also ASX-listed), since February 2020, a global producer of premium glass bottles with factories in nine global locations. Orora Limited also manufactures aluminum cans in Australia and New Zealand.
Commenting on the appointment, Nigel Stein, Chair of James Hardie, said, “I am delighted Rob has agreed to join the Board. He brings extensive experience from executive management and leadership positions, particularly in the construction and manufacturing industries globally. Rob also brings a wealth of knowledge and experience in finance, strategy and M&A integration. Rob will be a valuable addition to the Board.”
James Hardie further advises that Persio Lisboa, non-executive director of the Company, has retired from the Board effective 14 May 2026. Commenting on the retirement, Nigel expressed his appreciation for Mr. Lisboa’s time on the Board, “I would like to extend my sincere thanks to Persio for his valuable contribution in his eight years on the Board. He has provided steady guidance and leadership of the People and Remuneration Committee for the last five years. I particularly appreciate him extending his tenure beyond his intended end date to assist us with the complex integration of compensation structures following the AZEK acquisition. This included Persio joining me for our recent shareholder consultation meetings in Australia. I am pleased that Board member Gary Hendrickson, who has considerable experience of chairing compensation committees, has agreed to assume that role at James Hardie.”
This media release has been authorized for release by the Board of Directors.
END
About James Hardie
James Hardie Industries plc is the industry leader in exterior home and outdoor living solutions, with a portfolio that includes fiber cement, fiber gypsum, and composite and PVC decking and railing products. Products offered by James Hardie are engineered for beauty, durability, and climate resilience, and include trusted brands like Hardie®, TimberTech®, AZEK® Exteriors, Versatex®, fermacell® and StruXure®. With a global footprint, the James Hardie portfolio is marketed and sold throughout North America, Europe, Australia and New Zealand.
James Hardie Industries plc is incorporated and existing under the laws of Ireland. As an Irish plc, James Hardie is governed by the Irish Companies Act. James Hardie’s principal executive offices are located at 1st Floor, Block A, One Park Place, Upper Hatch Street, Dublin 2, D02 FD79, Ireland.
Investor and Media Contact
Bill Seymour
Vice President, Investor Relations
[email protected]
Source: James Hardie Industries plc
INVESTOR RELATIONS
[email protected]
Investor Email Alerts
Personal Information.
Email Address *Required Email Address is required. Email Address is invalid.
Investor Alert Options *
- News
- Quarterly Reports
- Annual Reports
- SEC Filings
- End of Day Stock Quote
- Events & Presentations
Investor Alert Options is required.
The captcha test has failed. Please try again.
Submit
© 2026 James Hardie Industries PLC - All rights reserved
James Hardie Announces Timing of Fourth Quarter FY26 Earnings Release and Conference Call
Bull 0
Bear 0
Routine
April 29, 2026
CHICAGO--(BUSINESS WIRE)-- James Hardie Industries plc (ASX / NYSE: JHX) ("James Hardie" or the "Company"), a leading provider of exterior home and outdoor living solutions, today announced it will release financial results for the fourth quarter of its 2026 fiscal year after the market closes in the United States on Tuesday, May 19th and before the market opens in Australia on Wednesday, May 20th. Following the release, the company will hold a conference call to discuss results, hosted by Aaron Erter, CEO and Ryan Lada, CFO. The event will be webcast live on the Investor Relations page of James Hardie’s corporate website (www.jameshardie.com
) at the respective times for the following time zones:
-
US: 6PM EDT / 5PM CDT on Tuesday, May 19th, 2026
-
Dublin: 11PM IST on Tuesday, May 19th, 2026
-
Australia: 8AM AEST on Wednesday, May 20th, 2026
Webcast Registration: https://events.q4inc.com/attendee/602490831
James Hardie Industries plc. — Announcement (Form 6-K)
Bull 0
Bear 0
Routine
James Hardie Industries plc 1st Floor, Block A, One Park Place, Upper Hatch Street, Dublin 2, D02 FD79, Ireland T: +353 (0) 1 411 6924 F: +353 (0) 1 479 1128 James Hardie Industries plc is a limited liability company incorporated in Ireland with its registered office at 1st Floor, Block A, One Park Place, Upper Hatch Street, Dublin 2, D02 FD79, Ireland. Directors: Nigel Stein (Chair, UK), Howard Heckes (USA), Gary Hendrickson (USA), Persio Lisboa (USA), Renee Peterson (USA), John Pfeifer (USA), Suzanne B. Rowland (USA), Jesse Singh (USA). Chief Executive Officer and Director: Aaron Erter (USA) Company number: 485719 ARBN: 097 829 895 20 March 2026 The Manager Company Announcements Office Australian Securities Exchange Limited 20 Bridge Street SYDNEY NSW 2000 Dear Sir/Madam Substantial Holding Notice As required under ASX Listing Rule 3.17.3 please see attached a copy of the substantial holding notice received by James Hardie Industries plc on 19 March 2026. Regards Aoife Rockett Company Secretary This announcement has been authorised for release by the Company Secretary, Ms Aoife Rockett.
Change of Director’s Interest Notice
Bull 0
Bear 0
Routine
Rule 3.19A.2
Appendix 3Y
Change of Director’s Interest Notice
Information or documents not available now must be given to ASX as soon as available. Information and documents given to ASX become ASX’s property and may be made public.
Introduced 30/09/01 Amended 01/01/11
Name of entity
ARBN
We (the entity) give ASX the following information under listing rule 3.19A.2 and as agent for the director for the purposes of section 205G of the Corporations Act.
Name of Director Persio V. Lisboa
Date of last notice 19 December 2025
Part 1 - Change of director’s relevant interests in securities
In the case of a trust, this includes interests in the trust made available by the responsible entity of the trust
Note: In the case of a company, interests which come within paragraph (i) of the definition of “notifiable interest of a director” should be disclosed in this part.
Direct or indirect interest Direct
Nature of indirect interest
(including registered holder)
Note: Provide details of the circumstances giving rise to the relevant interest.
n/a
Date of change 13 March 2026
No. of securities held prior to change Direct: 12,270 Ordinary Shares.
James Hardie Industries plc. — Announcement (Form 6-K)
Bull 0
Bear 0
Routine
Appendix 3G - Notification of issue, conversion or payment up of unquoted equity securities Appendix 3G - Notification of issue, conversion or payment up of unquoted equity securities 1 / 7 Announcement Summary Entity name JAMES HARDIE INDUSTRIES PLC Date of this announcement Thursday March 19, 2026 The +securities the subject of this notification are: Total number of +securities to be issued/transferred ASX +security code Security description Total number of +securities to be issued/transferred Issue date JHXAM ORDINARY SHARES 7,693 13/03/2026 Refer to next page for full details of the announcement +Other securities issued under an +employee incentive scheme that are not intended to be quoted on ASX
Appendix 3G - Notification of issue, conversion or payment up of unquoted equity securities Appendix 3G - Notification of issue, conversion or payment up of unquoted equity securities 2 / 7 Part 1 - Entity and announcement details 1.1 Name of entity JAMES HARDIE INDUSTRIES PLC We (the entity named above) give notice of the issue, conversion or payment up of the following unquoted +securities.
Chief Accounting Officer Transition
Bull 0
Bear 0
Management
James Hardie Industries plc (NYSE / ASX : JHX) ("James Hardie" or the "Company"), a leading provider of exterior home and outdoor living solutions, appointed David Hill, the Company’s Vice President of Finance Integration and Transformation, to succeed David Wisniewski as the Company’s Chief Accounting Officer, effective March 17, 2026. The transition is not due to any disagreement between Mr. Wisniewski and the Company or its Board regarding any matter related to the Company’s accounting principles or practices, financial disclosures, or internal controls.
Mr. Hill previously held the title of Vice President and Global Controller from 2016 until 2025 before transitioning into leading the finance integration efforts related to the Company’s acquisition of The AZEK Company Inc. Prior thereto, Mr. Hill served in a variety of roles at Mars Corp., United Service Companies, Hyatt Hotels and Ernst & Young. Mr. Hill is a certified public accountant (inactive) and has more than fifteen years of experience in accounting and finance with publicly traded companies. To help facilitate a smooth transition, it is expected that Mr.
Change of Director’s Interest Notice
Bull 0
Bear 0
Routine
Rule 3.19A.2
Appendix 3Y
Change of Director’s Interest Notice
Information or documents not available now must be given to ASX as soon as available. Information and documents given to ASX become ASX’s property and may be made public.
Introduced 30/09/01 Amended 01/01/11
Name of entity
ARBN
We (the entity) give ASX the following information under listing rule 3.19A.2 and as agent for the director for the purposes of section 205G of the Corporations Act.
Name of Director Renee Peterson
Date of last notice 19 December 2025
Part 1 - Change of director’s relevant interests in securities
In the case of a trust, this includes interests in the trust made available by the responsible entity of the trust
Note: In the case of a company, interests which come within paragraph (i) of the definition of “notifiable interest of a director” should be disclosed in this part.
Direct or indirect interest Indirect
Nature of indirect interest
(including registered holder)
Note: Provide details of the circumstances giving rise to the relevant interest.
The registered holder of indirect interest is Cede & Co., who hold the shares on behalf of Renee Peterson, as beneficial owner.
James Hardie Industries plc. — Announcement (Form 6-K)
Bull 0
Bear 0
Routine
Appendix 3G - Notification of issue, conversion or payment up of unquoted equity securities Appendix 3G - Notification of issue, conversion or payment up of unquoted equity securities 1 / 6 Announcement Summary Entity name JAMES HARDIE INDUSTRIES PLC Date of this announcement Saturday March 07, 2026 The +securities the subject of this notification are: Total number of +securities to be issued/transferred ASX +security code Security description Total number of +securities to be issued/transferred Issue date JHXAK RESTRICTED STOCK UNIT 4,077 02/03/2026 Refer to next page for full details of the announcement +Securities issued under an +employee incentive scheme that are subject to a restriction on transfer and are not being quoted on ASX until the restriction ends
Appendix 3G - Notification of issue, conversion or payment up of unquoted equity securities Appendix 3G - Notification of issue, conversion or payment up of unquoted equity securities 2 / 6 Part 1 - Entity and announcement details 1.1 Name of entity JAMES HARDIE INDUSTRIES PLC We (the entity named above) give notice of the issue, conversion or payment up of the following unquoted +securities.
James Hardie Industries plc. — Announcement (Form 6-K)
Bull 0
Bear 0
Routine
Appendix 3G - Notification of issue, conversion or payment up of unquoted equity securities Appendix 3G - Notification of issue, conversion or payment up of unquoted equity securities 1 / 5 Announcement Summary Entity name JAMES HARDIE INDUSTRIES PLC Date of this announcement Thursday March 05, 2026 The +securities the subject of this notification are: Total number of +securities to be issued/transferred ASX +security code Security description Total number of +securities to be issued/transferred Issue date JHXAM ORDINARY SHARES 10,440 27/02/2026 Refer to next page for full details of the announcement +Securities issued as part of a transaction or transactions previously announced to the market in an Appendix 3B that are not quoted, and are not intended to be quoted, on ASX
Appendix 3G - Notification of issue, conversion or payment up of unquoted equity securities Appendix 3G - Notification of issue, conversion or payment up of unquoted equity securities 2 / 5 Part 1 - Entity and announcement details 1.1 Name of entity JAMES HARDIE INDUSTRIES PLC We (the entity named above) give notice of the issue, conversion or payment up of the following unquoted +securities.
James Hardie Industries plc. — Announcement (Form 6-K)
Bull 0
Bear 0
Routine
Appendix 2A - Application for quotation of securities Appendix 2A - Application for quotation of securities 1 / 6 Announcement Summary Entity name JAMES HARDIE INDUSTRIES PLC Announcement Type New announcement Date of this announcement Friday February 20, 2026 The +securities to be quoted are: Total number of +securities to be quoted ASX +security code Security description Number of +securities to be quoted Issue date JHX CHESS DEPOSITARY INTERESTS 1:1 2,698 20/02/2026 Refer to next page for full details of the announcement +Securities issued under an +employee incentive scheme that are not subject to a restriction on transfer or that are to be quoted notwithstanding there is a restriction on transfer
Appendix 2A - Application for quotation of securities Appendix 2A - Application for quotation of securities 2 / 6 Part 1 - Entity and announcement details 1.1 Name of entity JAMES HARDIE INDUSTRIES PLC We (the entity named above) apply for +quotation of the following +securities and agree to the matters set out in Appendix 2A of the ASX Listing Rules.
Change of Director’s Interest Notice
Bull 0
Bear 0
Routine
Rule 3.19A.2
Appendix 3Y
Change of Director’s Interest Notice
Information or documents not available now must be given to ASX as soon as available. Information and documents given to ASX become ASX’s property and may be made public.
Introduced 30/09/01 Amended 01/01/11
Name of entity
ARBN
We (the entity) give ASX the following information under listing rule 3.19A.2 and as agent for the director for the purposes of section 205G of the Corporations Act.
Name of Director Gary Hendrickson
Date of last notice 18 December 2025
+ See chapter 19 for defined terms.
Appendix 3Y
Change of Director’s Interest Notice
Part 1 - Change of director’s relevant interests in securities
In the case of a trust, this includes interests in the trust made available by the responsible entity of the trust
Note: In the case of a company, interests which come within paragraph (i) of the definition of “notifiable interest of a director” should be disclosed in this part.
Direct or indirect interest Direct & Indirect
Nature of indirect interest
(including registered holder)
Note: Provide details of the circumstances giving rise to the relevant interest.
The Gary E.
Change of Director’s Interest Notice
Bull 0
Bear 0
Routine
Rule 3.19A.2
Appendix 3Y
Change of Director’s Interest Notice
Information or documents not available now must be given to ASX as soon as available. Information and documents given to ASX become ASX’s property and may be made public.
Introduced 30/09/01 Amended 01/01/11
Name of entity
ARBN
We (the entity) give ASX the following information under listing rule 3.19A.2 and as agent for the director for the purposes of section 205G of the Corporations Act.
Name of Director Jesse Singh
Date of last notice 6 January 2026
+ See chapter 19 for defined terms.
01/01/2011 Appendix 3Y Page 1
Appendix 3Y
Change of Director’s Interest Notice
Part 1 - Change of director’s relevant interests in securities
In the case of a trust, this includes interests in the trust made available by the responsible entity of the trust
Note: In the case of a company, interests which come within paragraph (i) of the definition of “notifiable interest of a director” should be disclosed in this part.
Direct or indirect interest Indirect
Nature of indirect interest
(including registered holder)
Note: Provide details of the circumstances giving rise to the relevant interest.
James Hardie Reports Third Quarter FY26 Results
Bull 3
Bear 3
Results
February 10, 2026
Q3 FY26 Net Sales of $1.2 Billion, Up +30% with Organic Net Sales +1%
Operating Income of $176 Million, Adjusted EBITDA of $330 Million
Siding & Trim Net Sales Up +10% with Organic Net Sales Down (2%)
~500 Basis Points of Sequential Siding & Trim Adjusted EBITDA Margin Expansion
Deck, Rail & Accessories Net Sales Up +2% with Sell-Through Up Mid-Single-Digits
Integration and Cost Synergies Ahead of Schedule, Focused on the Achievement of $125 Million Target
CHICAGO--(BUSINESS WIRE)-- James Hardie Industries plc (NYSE / ASX : JHX) ("James Hardie" or the "Company"), a leading provider of exterior home and outdoor living solutions, today announced results for its third quarter ending December 31, 2025.
Aaron Erter, CEO of James Hardie said, “In the third-quarter, we achieved or exceeded each of our financial commitments despite a mixed macro backdrop. We are taking actions to address the current market environment, including optimizing our manufacturing footprint and better aligning our cost structure with the slower, but stabilizing, pace of demand. These actions will improve near-term profitability and better position the Company to profitably grow when conditions improve.
“Siding & Trim organic net sales were down modestly in the quarter, while Adjusted EBITDA margin improved nearly 500 basis points sequentially primarily driven by price / mix favorability and our actions to drive Hardie Operating System savings. Deck, Rail & Accessories delivered mid-single-digit sell-through growth, demonstrating our ability to drive material conversion through channel expansion and new product initiatives."
Mr. Erter continued, “Our confidence in the combination of James Hardie and AZEK continues to be strong as customers respond to our differentiated products, leading brands, focus on innovation and investment across the value chain. We continue to make progress on the integration and have surpassed our FY26 cost synergy goal. Our progress to date reaffirms our confidence in hitting our $125 million cost synergy target. On the commercial front, our early wins with dealers, contractors and homebuilders will drive meaningful revenue synergies in FY27 and beyond, demonstrating our potential to accelerate material conversion across exteriors and outdoor living."
____________________
Note: All Deck, Rail & Accessories growth comparisons correspond to the quarter ended December 31, 2024, prior to the acquisition of AZEK by James Hardie, unless otherwise stated.
Consolidated Financial Information
| Q3 FY26 | Q3 FY25 | Change | 9 MonthsFY26 | 9 MonthsFY25 | Change | ||||||
| Group | (US$ millions, except per share data) | ||||||||||
| Net Sales | 1,239.8 | 953.3 | +30% | 3,431.9 | 2,906.0 | +18% | |||||
| Operating Income | 176.2 | 206.1 | (15%) | 338.8 | 593.8 | (43%) | |||||
| Operating Income Margin | 14.2% | 21.6% | (740bps) | 9.9% | 20.4% | (1,050bps) | |||||
| Adjusted EBITDA | 329.9 | 262.1 | +26% | 884.9 | 810.8 | +9% | |||||
| Adjusted EBITDA Margin | 26.6% | 27.5% | (90bps) | 25.8% | 27.9% | (210bps) | |||||
| Net Income | 68.7 | 141.7 | (52%) | 75.5 | 380.4 | (80%) | |||||
| Adjusted Net Income | 142.2 | 153.6 | (7%) | 423.1 | 488.2 | (13%) | |||||
| Diluted EPS - US$ per share | 0.12 | 0.33 | (64%) | 0.14 | 0.88 | (84%) | |||||
| Adjusted Diluted EPS - US$ per share | 0.24 | 0.36 | (31%) | 0.79 | 1.13 | (30%) |
Segment Business Update and Results
Siding & Trim
| Q3 FY26 | Q3 FY25 | Change | 9 MonthsFY26 | 9 MonthsFY25 | Change | ||||||
| Siding & Trim | (US$ millions) | ||||||||||
| Net Sales | 788.3 | 719.3 | +10% | 2,196.1 | 2,144.4 | 2% | |||||
| Operating Income | 202.9 | 209.3 | (3%) | 515.1 | 638.5 | (19%) | |||||
| Operating Income Margin | 25.7% | 29.1% | (340bps) | 23.5% | 29.8% | (630bps) | |||||
| Adjusted EBITDA | 268.6 | 250.5 | +7% | 698.4 | 754.0 | (7%) | |||||
| Adjusted EBITDA Margin | 34.1% | 34.8% | (70bps) | 31.8% | 35.2% | (340bps) |
Net sales increased 10% due to the inorganic net sales contribution from AZEK Exteriors. On an organic basis, net sales declined (2%) with an increase in average net sales price more than offset by lower volumes driven by soft market demand. Volume of Exterior products declined mid-single-digits, with Single-Family down high-single-digits and Multi-Family up high-single-digits, while volume of Interior products declined double-digits. The Single-Family Exteriors decline was primarily due to a weaker new construction environment across the South, where James Hardie has built strong leadership positions with large homebuilders in key long-term growth markets such as Texas, Florida and Georgia. Housing markets in these geographies have been especially impacted by affordability challenges and elevated housing inventory. While Adjusted EBITDA margin improved 490bps sequentially, adjusted EBITDA margin decreased (70bps) year-over-year to 34.1%, due to unfavorable production cost absorption and higher freight and raw material costs, and the allocation of certain R&D expenses which were not allocated to the segment in the prior year, partially offset by a higher average net sales price and Hardie Operating System (HOS) savings.
In Siding & Trim, we are focused on returning the segment to organic growth through four core growth strategies.
- R&R Focus: We are increasing our focus on repair & remodel, particularly in the Northeast and Midwest, where we see $1 billion material conversion opportunity in wood- and wood-look siding products
- Deeper New Construction Penetration: We are expanding on our strong large builder relationships and seeking growth with custom and local builders where there is $750 million of opportunity for additional growth
- Product Innovation: We are focused on new product innovation in Siding, including differentiated offerings, to support our long-term growth
- Installation Efficiency: We are partnering with our contractors and installers to introduce innovative installation techniques to reduce time and installed costs, expanding the total addressable market for fiber cement
Deck, Rail & Accessories (DR&A)
| Q3 FY26 | 9 MonthsFY26 | |||||
| Deck, Rail & Accessories | (US$ millions) | |||||
| Net Sales | 194.1 | 449.9 | ||||
| Operating Loss | (24.0 | ) | (35.9 | ) | ||
| Operating Loss Margin | (12.4 | %) | (8.0 | %) | ||
| Adjusted EBITDA | 48.7 | 127.3 | ||||
| Adjusted EBITDA Margin | 25.1 | % | 28.3 | % |
Deck, Rail & Accessories net sales increased +2% compared to the quarter ended December 31, 2024 prior to the acquisition driven primarily by price / mix. Sell-through was up mid-single-digits, consistent with growth in the prior quarter. Adjusted EBITDA margin was 25.1% reflecting the benefit of top-line growth, partially offset by growth investments. In addition to cost synergies, the runway for margin improvement in Deck, Rail & Accessories is enabled by recycling initiatives, improved absorption across the manufacturing network, and leveraging the Hardie Operating System.
In Deck, Rail & Accessories, the organic strategy remains consistent with a focus on continued channel expansion and new product launches. Last calendar year's new product launches have been well received by customers, and additional new offerings are being launched in early 2026 which strengthen TimberTech's commitment to combining superior aesthetics with advanced functionality for both homeowners and contractors alike. Additionally, the combination with James Hardie has helped to accelerate growth and secure incremental shelf space at dealer partners throughout early buy negotiations as customers recognize the enhanced value proposition delivered through a comprehensive product portfolio, trusted brands and long-term partnerships.
Australia & New Zealand (ANZ)
| Q3 FY26 | Q3 FY25 | Change | 9 MonthsFY26 | 9 MonthsFY25 | Change | ||||||
| Australia & New Zealand | (US$ millions, unless otherwise noted) | ||||||||||
| Net Sales | 126.5 | 118.1 | +7% | 381.0 | 401.8 | (5%) | |||||
| Net Sales (A$ millions) | 192.9 | 180.1 | +7% | 585.6 | 606.9 | (4%) | |||||
| Operating Income | 35.6 | 34.8 | +2% | 111.4 | 68.0 | +64% | |||||
| Operating Income Margin | 28.1% | 29.3% | (120bps) | 29.2% | 17.2% | +1,200bps | |||||
| Adjusted EBITDA | 41.2 | 39.7 | +4% | 127.7 | 139.7 | (9%) | |||||
| Adjusted EBITDA Margin | 32.6% | 33.5% | (90bps) | 33.5% | 34.7% | (120bps) |
Net sales increased +7%, with low-single-digit volume growth and a mid-single-digit increase in average net sales price. Adjusted EBITDA margin of 32.6% decreased (90bps) as volume and price growth and HOS savings were more than offset by unfavorable production cost absorption and the allocation of R&D costs which were not previously allocated to the reportable segments.
The Company is focused on driving growth in Australia and New Zealand through new customer acquisitions and project conversion enabled by customer collaboration and leveraging the James Hardie brand. The teams are innovating to accelerate material conversion to fiber cement with a key focus on new construction. Overall, while market demand remains challenged, the ANZ team is focused on finding further manufacturing efficiencies and driving HOS savings to underpin the segment's consistent profitability.
Europe
| Q3 FY26 | Q3 FY25 | Change | 9 MonthsFY26 | 9 MonthsFY25 | Change | ||||||
| Europe | (US$ millions, unless otherwise noted) | ||||||||||
| Net Sales | 130.9 | 115.9 | +13% | 404.9 | 359.8 | +13% | |||||
| Net Sales (€ millions) | 112.4 | 108.6 | +3% | 350.4 | 332.9 | +5% | |||||
| Operating Income | 9.1 | 3.6 | +153% | 37.9 | 24.7 | +53% | |||||
| Operating Income Margin | 7.0% | 3.1% | +390bps | 9.4% | 6.8% | +260bps | |||||
| EBITDA | 16.6 | 11.9 | +39% | 59.5 | 48.6 | +22% | |||||
| EBITDA Margin | 12.7% | 10.3% | +240bps | 14.7% | 13.5% | +120bps |
Net sales increased +13%, or +3% in Euros, driven by mid-single-digit volume growth. While underlying price realization remains positive, average net sales price in Euros was down modestly due to unfavorable mix shift as fiber gypsum volumes meaningfully outpaced fiber cement in the quarter. EBITDA margin increased +240bps to 12.7%, attributable to favorable plant performance, as well as lower raw material costs. Higher SG&A expense relates to increased investment in sales teams and marketing supporting growth strategies for high-value products.
Markets across Europe remain challenged, particularly in Germany, the Company's largest European market, where improvement is anticipated to be more gradual. Growth in high-value products, such as Therm25TM fiber gypsum flooring, remains a strategic priority, as leveraging a broader and deeper product portfolio should accelerate share gains and customer wins. The team's plan to expand margins is comprised of purposeful investment to drive operating leverage alongside sales growth and HOS savings from production footprint optimization and freight management.
Outlook
FY26 Guidance
With respect to FY26 guidance, Ryan Lada, CFO, said, “For Siding & Trim, market conditions remain challenged, consistent with our prior expectations; however, channel inventories have normalized. As a result, we are allowing our stronger-than-expected third-quarter performance to flow through to full-year results, resulting in a modest increase in the guidance range for the segment. We continue to expect the broader Exteriors market to remain mixed in the near term. For Deck, Rail & Accessories, mid-single-digit sell-through growth continued through the third quarter and into early Q4. We expect channel partner inventories to remain at seasonally normal levels for the remainder of the fiscal year."
- Net Sales for Siding & Trim: $2.953 to $2.998 billion(prev. $2.925 to $2.995 billion)
- Net Sales for Deck, Rail & Accessories: $787 to $800 million(prev. $780 to $800 million)
- Adjusted EBITDA for Siding & Trim: $939 to $962 million(prev. $920 to $955 million)
- Adjusted EBITDA for Deck, Rail & Accessories: $219 to $224****million(prev. $215 to $225 million)
- Total Adjusted EBITDA: $1.232 to $1.263****billion(prev. $1.20 to $1.25 billion)
- Free Cash Flow: At Least $200****million(unchanged)
Note: All guidance includes a partial-year contribution from the AZEK acquisition which was incorporated into James Hardie results beginning at closing on July 1, 2025. Free cash flow represents net cash provided by operating activities less purchases of property, plant and equipment net of proceeds from the sale of property, plant and equipment.
Cash Flow, Capital Investment & Allocation
Operating cash flow totaled $455 million for the nine months ended FY26, driven by net income, adjusted for non-cash items of $536 million and lower working capital of $33 million, partially offset by $87 million of asbestos claims and handling costs paid. Capital expenditures were $303 million.
Our capital expenditures program is driven by strategic investments that support long‑term growth and operational excellence. These priorities include adding new capacity ahead of anticipated demand, funding new product development and other strategic initiatives, and maintaining and reinvesting in our existing facilities and equipment. For fiscal year 2026, we expect total capital expenditures of approximately $400 million, inclusive of approximately $75 million related to AZEK initiatives. Spending associated with our Global Capacity Expansion program is projected to be approximately $90 million of the fiscal year 2026 total.
Reported Financial Results
| (Millions of US dollars) | (Unaudited)December 312025 | March 312025 | |||
| Assets | |||||
| Current assets: | |||||
| Cash and cash equivalents | $ | 344.2 | $ | 562.7 | |
| Restricted cash and cash equivalents | 5.0 | 5.0 | |||
| Restricted cash and cash equivalents - Asbestos | 25.7 | 37.9 | |||
| Restricted short-term investments - Asbestos | 187.3 | 175.8 | |||
| Accounts and other receivables, net | 311.0 | 391.8 | |||
| Inventories | 665.8 | 347.1 | |||
| Prepaid expenses and other current assets | 160.2 | 100.6 | |||
| Assets held for sale | 11.3 | 73.1 | |||
| Insurance receivable - Asbestos | 5.8 | 5.5 | |||
| Workers’ compensation - Asbestos | 2.5 | 2.3 | |||
| Total current assets | 1,718.8 | 1,701.8 | |||
| Property, plant and equipment, net | 3,095.4 | 2,169.0 | |||
| Operating lease right-of-use-assets | 127.3 | 70.4 | |||
| Finance lease right-of-use-assets | 106.1 | 2.7 | |||
| Goodwill | 4,822.0 | 193.7 | |||
| Intangible assets, net | 3,526.9 | 145.6 | |||
| Insurance receivable - Asbestos | 21.5 | 23.2 | |||
| Workers’ compensation - Asbestos | 17.5 | 16.5 | |||
| Deferred income taxes | 74.7 | 600.4 | |||
| Deferred income taxes - Asbestos | 272.1 | 284.5 | |||
| Other assets | 22.2 | 22.1 | |||
| Total assets | $ | 13,804.5 | $ | 5,229.9 | |
| Liabilities and Shareholders’ Equity | |||||
| Current liabilities: | |||||
| Accounts payable and accrued liabilities | $ | 667.2 | $ | 446.4 | |
| Accrued payroll and employee benefits | 150.7 | 133.3 | |||
| Operating lease liabilities | 31.6 | 21.6 | |||
| Finance lease liabilities | 5.4 | 1.1 | |||
| Long-term debt, current portion | 43.8 | 9.4 | |||
| Accrued product warranties | 11.2 | 7.3 | |||
| Income taxes payable | 14.4 | 10.3 | |||
| Asbestos liability | 127.3 | 119.4 | |||
| Workers’ compensation - Asbestos | 2.5 | 2.3 | |||
| Other liabilities | 59.7 | 59.1 | |||
| Total current liabilities | 1,113.8 | 810.2 | |||
| Long-term debt | 4,565.1 | 1,110.1 | |||
| Deferred income taxes | 564.6 | 121.1 | |||
| Operating lease liabilities | 112.5 | 63.9 | |||
| Finance lease liabilities | 103.6 | 1.8 | |||
| Accrued product warranties | 42.5 | 26.9 | |||
| Asbestos liability | 831.5 | 864.2 | |||
| Workers’ compensation - Asbestos | 17.5 | 16.5 | |||
| Other liabilities | 56.7 | 53.7 | |||
| Total liabilities | 7,407.8 | 3,068.4 | |||
| Total shareholders’ equity | 6,396.7 | 2,161.5 | |||
| Total liabilities and shareholders’ equity | $ | 13,804.5 | $ | 5,229.9 |
| (Unaudited)Three Months Ended December 31 | (Unaudited)Nine Months Ended December 31 | |||||||||||||
| (Millions of US dollars, except per share data) | 2025 | 2024 | 2025 | 2024 | ||||||||||
| Net sales | $ | 1,239.8 | $ | 953.3 | $ | 3,431.9 | $ | 2,906.0 | ||||||
| Cost of goods sold | 791.6 | 590.9 | 2,225.7 | 1,773.8 | ||||||||||
| Gross profit | 448.2 | 362.4 | 1,206.2 | 1,132.2 | ||||||||||
| Selling, general and administrative expenses | 249.7 | 144.7 | 656.6 | 444.4 | ||||||||||
| Research and development expenses | 16.6 | 11.5 | 44.5 | 36.1 | ||||||||||
| Restructuring, net | (24.0 | ) | — | (24.0 | ) | 57.3 | ||||||||
| Acquisition related expenses | 29.4 | — | 189.1 | — | ||||||||||
| Asbestos adjustments | 0.3 | 0.1 | 1.2 | 0.6 | ||||||||||
| Operating income | 176.2 | 206.1 | 338.8 | 593.8 | ||||||||||
| Interest, net | 65.6 | 3.8 | 168.8 | 7.4 | ||||||||||
| Other expense (income), net | — | — | 9.7 | (0.2 | ) | |||||||||
| Income before income taxes | 110.6 | 202.3 | 160.3 | 586.6 | ||||||||||
| Income tax expense | 41.9 | 60.6 | 84.8 | 206.2 | ||||||||||
| Net income | $ | 68.7 | $ | 141.7 | $ | 75.5 | $ | 380.4 | ||||||
| Income per share: | ||||||||||||||
| Basic | $ | 0.12 | $ | 0.33 | $ | 0.14 | $ | 0.88 | ||||||
| Diluted | $ | 0.12 | $ | 0.33 | $ | 0.14 | $ | 0.88 | ||||||
| Weighted average common shares outstanding (Millions): | ||||||||||||||
| Basic | 579.4 | 429.5 | 529.2 | 431.2 | ||||||||||
| Diluted | 583.1 | 430.9 | 533.9 | 432.6 |
| (Unaudited)Nine Months Ended December 31 | |||||||
| (Millions of US dollars) | 2025 | 2024 | |||||
| Cash Flows From Operating Activities | |||||||
| Net income | $ | 75.5 | $ | 380.4 | |||
| Adjustments to reconcile net income to net cash provided by operating activities: | |||||||
| Depreciation and amortization | 330.5 | 156.8 | |||||
| Lease expense | 30.6 | 24.6 | |||||
| Deferred income taxes | 5.6 | 94.8 | |||||
| Stock-based compensation | 29.2 | 17.7 | |||||
| Asbestos adjustments | 1.2 | 0.6 | |||||
| Non-cash restructuring expenses | 1.1 | 40.2 | |||||
| Non-cash interest expense | 6.9 | 1.5 | |||||
| Non-cash charge related to step up of inventory | 47.9 | — | |||||
| Gain on sale of land | (26.2 | ) | — | ||||
| Other, net | 33.4 | 17.0 | |||||
| Changes in operating assets and liabilities: | |||||||
| Accounts and other receivables | 150.6 | 86.4 | |||||
| Inventories | (77.4 | ) | (20.5 | ) | |||
| Operating lease assets and liabilities, net | (34.4 | ) | (25.8 | ) | |||
| Prepaid expenses and other assets | 1.6 | (8.6 | ) | ||||
| Insurance receivable - Asbestos | 3.2 | 3.0 | |||||
| Accounts payable and accrued liabilities | (40.7 | ) | (15.6 | ) | |||
| Claims and handling costs paid - Asbestos | (86.8 | ) | (87.7 | ) | |||
| Income taxes payable | 3.4 | (10.2 | ) | ||||
| Other accrued liabilities and interest | 0.2 | 2.8 | |||||
| Net cash provided by operating activities | $ | 455.4 | $ | 657.4 | |||
| Cash Flows From Investing Activities | |||||||
| Purchases of property, plant and equipment | $ | (302.8 | ) | $ | (333.0 | ) | |
| Proceeds from sale of property, plant and equipment | 108.2 | — | |||||
| Capitalized interest | (6.1 | ) | (16.7 | ) | |||
| Cash consideration for The AZEK Company acquisition, net of cash acquired | (3,919.8 | ) | — | ||||
| Purchase of restricted investments - Asbestos | (141.7 | ) | (145.2 | ) | |||
| Proceeds from restricted investments - Asbestos | 141.7 | 141.4 | |||||
| Other | — | 0.4 | |||||
| Net cash used in investing activities | $ | (4,120.5 | ) | $ | (353.1 | ) | |
| Cash Flows From Financing Activities | |||||||
| Proceeds from senior secured notes | $ | 1,700.0 | $ | — | |||
| Proceeds from term loans | 2,500.0 | — | |||||
| Proceeds from revolving credit facility | 70.0 | — | |||||
| Repayments of term loans | (312.5 | ) | (5.6 | ) | |||
| Repayment of senior unsecured notes | (465.2 | ) | — | ||||
| Debt issuance costs paid | (41.6 | ) | — | ||||
| Repayment of finance lease obligations | (2.8 | ) | (0.9 | ) | |||
| Shares repurchased | — | (149.9 | ) | ||||
| Taxes paid related to net share settlement of equity awards | (11.7 | ) | (7.3 | ) | |||
| Net cash provided by (used in) financing activities | $ | 3,436.2 | $ | (163.7 | ) | ||
| Effects of exchange rate changes on cash and cash equivalents, restricted cash and restricted cash - Asbestos | $ | (1.8 | ) | $ | 1.1 | ||
| Net (decrease) increase in cash and cash equivalents, restricted cash and restricted cash - Asbestos | (230.7 | ) | 141.7 | ||||
| Cash and cash equivalents, restricted cash and restricted cash - Asbestos at beginning of period | 605.6 | 415.8 | |||||
| Cash and cash equivalents, restricted cash and restricted cash - Asbestos at end of period | $ | 374.9 | $ | 557.5 | |||
| Non-Cash Investing and Financing Activities | |||||||
| Capital expenditures incurred but not yet paid | $ | 23.3 | $ | 23.2 | |||
| Non-cash ROU assets obtained in exchange for new lease liabilities | $ | 47.9 | $ | 27.2 | |||
| Non-cash consideration for AZEK acquisition | $ | 4,143.6 | $ | — | |||
| Supplemental Disclosure of Cash Flow Activities | |||||||
| Cash paid to AICF | $ | 62.7 | $ | 49.6 |
Further Information
Readers are referred to the Company’s Condensed Consolidated Financial Statements and Management’s Analysis of Results for the third quarter ended December 31, 2025 for additional information regarding the Company’s results.
All comparisons made are vs. the comparable period in the prior fiscal year and amounts presented are in US dollars, unless otherwise noted.
Conference Call Details
James Hardie will hold a conference call to discuss results and outlook Tuesday, February 10, 2026 at 5:00pm EST (Wednesday, February 11, 2026 at 9:00am AEDT). Participants may register for a live webcast and access a replay following the event of the event on the Investor Relations section of the Company’s website (ir.jameshardie.com).
About James Hardie
James Hardie Industries plc is the industry leader in exterior home and outdoor living solutions, with a portfolio that includes fiber cement, fiber gypsum, and composite and PVC decking and railing products. Products offered by James Hardie are engineered for beauty, durability, and climate resilience, and include trusted brands like Hardie®, TimberTech®, AZEK® Exteriors, Versatex®, fermacell® and StruXure®. With a global footprint, the James Hardie portfolio is marketed and sold throughout North America, Europe, Australia and New Zealand.
James Hardie Industries plc is incorporated and existing under the laws of Ireland. As an Irish plc, James Hardie is governed by the Irish Companies Act. James Hardie’s principal executive offices are located at 1st Floor, Block A, One Park Place, Upper Hatch Street, Dublin 2, D02 FD79, Ireland.
Cautionary Note and Use of Non-GAAP Measures
This Earnings Release includes financial measures that are not considered a measure of financial performance under generally accepted accounting principles in the United States (GAAP), such as Adjusted Net Income, Adjusted EBITDA, Adjusted Diluted EPS and Free Cash Flow. These non-GAAP financial measures should not be considered to be more meaningful than the equivalent GAAP measure. Management has included such measures to provide investors with an alternative method for assessing its operating results in a manner that is focused on the performance of its ongoing operations and excludes the impact of certain legacy items, such as asbestos adjustments, or significant non-recurring items, such as asset impairments, restructuring gain or expenses, acquisition and pre-close financing related costs, as well as adjustments to tax expense. Additionally, management uses such non-GAAP financial measures for the same purposes. However, these non-GAAP financial measures are not prepared in accordance with GAAP, may not be reported by all of the Company’s competitors and may not be directly comparable to similarly titled measures of the Company’s competitors due to potential differences in the exact method of calculation. A reconciliation of these adjustments to the most directly comparable GAAP measure is included in this Earnings Release below.
The Company is unable to forecast the comparable US GAAP financial measure for future periods due to, amongst other factors, uncertainty regarding the impact of actuarial estimates on asbestos-related assets and liabilities in future periods.
This Earnings Release contains forward-looking statements and information that are subject to risks, uncertainties and assumptions. Many factors could cause the actual results, performance or achievements of James Hardie to be materially different from those expressed or implied in this release, including, among others, the risks and uncertainties set forth in Section 3 "Risk Factors" in James Hardie’s Annual Report on Form 20-F for the fiscal year ended March 31, 2025; changes in general economic, political, governmental and business conditions globally and in the countries in which James Hardie does business; changes in interest rates; changes in inflation rates; changes in exchange rates; the level of construction generally; changes in cement demand and prices; changes in raw material and energy prices; changes in business strategy; the AZEK acquisition and various other factors. Should one or more of these risks or uncertainties materialize, or should underlying assumptions prove incorrect, actual results may vary materially from those described herein. James Hardie assumes no obligation to update or correct the information contained in this Earnings Release except as required by law.
This Earnings Release has been authorized by the James Hardie Board of Directors.
Non-GAAP Financial Measures
Adjusted EBITDA and Adjusted EBITDA margin
| US$ Millions | Three and Nine Months Ended December 31 | |||||||||||||
| Q3 FY26 | Q3 FY25 | FY26 | FY25 | |||||||||||
| Operating income | $ | 176.2 | $ | 206.1 | $ | 338.8 | $ | 593.8 | ||||||
| Asbestos related expenses and adjustments | 0.7 | 0.9 | 2.6 | 2.9 | ||||||||||
| Restructuring, net | (24.0 | ) | — | (24.0 | ) | 57.3 | ||||||||
| Acquisition related expenses | 29.4 | — | 189.1 | — | ||||||||||
| Inventory fair value adjustment | — | — | 47.9 | — | ||||||||||
| Amortization of intangible assets resulting from AZEK acquisition | 57.6 | — | 106.3 | — | ||||||||||
| Depreciation and amortization | 90.0 | 55.1 | 224.2 | 156.8 | ||||||||||
| Adjusted EBITDA | $ | 329.9 | $ | 262.1 | $ | 884.9 | $ | 810.8 |
| Three and Nine Months Ended December 31 | ||||||||||||
| Q3 FY26 | Q3 FY25 | FY26 | FY25 | |||||||||
| Operating income margin | 14.2 | % | 21.6 | % | 9.9 | % | 20.4 | % | ||||
| Asbestos related expenses and adjustments | 0.1 | % | 0.1 | % | 0.1 | % | 0.1 | % | ||||
| Restructuring, net | (2.0 | )% | — | % | (0.7 | %) | 2.0 | % | ||||
| Acquisition related expenses | 2.4 | % | — | % | 5.5 | % | — | % | ||||
| Inventory fair value adjustment | — | % | — | % | 1.4 | % | — | % | ||||
| Amortization of intangible assets resulting from AZEK acquisition | 4.6 | % | — | % | 3.1 | % | — | % | ||||
| Depreciation and amortization | 7.3 | % | 5.8 | % | 6.5 | % | 5.4 | % | ||||
| Adjusted EBITDA margin | 26.6 | % | 27.5 | % | 25.8 | % | 27.9 | % |
Adjusted net income and Adjusted diluted earnings per share
| US$ Millions, except per share amounts | Three and Nine Months Ended December 31 | |||||||||||||||
| Q3 FY26 | Q3 FY25 | FY26 | FY25 | |||||||||||||
| Net income | $ | 68.7 | $ | 141.7 | $ | 75.5 | $ | 380.4 | ||||||||
| Asbestos related expenses and adjustments | 0.7 | 0.9 | 2.6 | 2.9 | ||||||||||||
| AICF interest income | (2.4 | ) | (2.7 | ) | (7.4 | ) | (8.5 | ) | ||||||||
| Restructuring, net | (24.0 | ) | — | (24.0 | ) | 57.3 | ||||||||||
| Pre-close financing costs1 | — | — | 46.5 | — | ||||||||||||
| Acquisition related expenses | 29.4 | — | 189.1 | — | ||||||||||||
| Inventory fair value adjustment | — | — | 47.9 | — | ||||||||||||
| Amortization of intangible assets resulting from AZEK acquisition | 57.6 | — | 106.3 | — | ||||||||||||
| Tax adjustments2 | 12.2 | 13.7 | (13.4 | ) | 56.1 | |||||||||||
| Adjusted net income | $ | 142.2 | $ | 153.6 | $ | 423.1 | $ | 488.2 | ||||||||
| Three and Nine Months Ended December 31 | ||||||||||||||||
| Q3 FY26 | Q3 FY25 | FY26 | FY25 | |||||||||||||
| Net income per common share - diluted | $ | 0.12 | $ | 0.33 | $ | 0.14 | $ | 0.88 | ||||||||
| Asbestos related expenses and adjustments | — | — | — | 0.01 | ||||||||||||
| AICF interest income | — | (0.01 | ) | (0.01 | ) | (0.02 | ) | |||||||||
| Restructuring, net | (0.04 | ) | — | (0.04 | ) | 0.13 | ||||||||||
| Pre-close financing costs1 | — | — | 0.09 | — | ||||||||||||
| Acquisition related expenses | 0.05 | — | 0.35 | — | ||||||||||||
| Inventory fair value adjustment | — | — | 0.09 | — | ||||||||||||
| Amortization of intangible assets resulting from AZEK acquisition | 0.09 | — | 0.20 | — | ||||||||||||
| Tax adjustments2 | 0.02 | 0.04 | (0.03 | ) | 0.13 | |||||||||||
| Adjusted diluted earnings per share3 | $ | 0.24 | $ | 0.36 | $ | 0.79 | $ | 1.13 | ||||||||
| 1 Includes pre-close financing interest of $34.9 million as well as a $11.6 million non-cash loss on our interest rate swap incurred in the first quarter of fiscal year 2026.2 Includes tax adjustments related to the amortization benefit of certain US intangible assets, asbestos, and discrete items relating to the AZEK acquisition, and $18.2 million in respect of the ATO settlement agreement incurred in the second quarter of fiscal year 2026.3 Weighted average common shares outstanding used in computing diluted net income per common share of 583.1 million and 430.9 million for the three months ended December 31, 2025 and 2024, respectively. Weighted average common shares outstanding used in computing diluted net income per common share of 533.9 million and 432.6 million for the nine months ended December 31, 2025 and 2024, respectively. | ||||||||||||||||
Siding & Trim Segment Adjusted EBITDA and Adjusted EBITDA margin
| US$ Millions | Three and Nine Months Ended December 31 | |||||||||||
| Q3 FY26 | Q3 FY25 | FY26 | FY25 | |||||||||
| Siding & Trim Segment operating income | $ | 202.9 | $ | 209.3 | $ | 515.1 | $ | 638.5 | ||||
| Acquisition related expenses | 3.6 | — | 8.4 | — | ||||||||
| Inventory fair value adjustment | — | — | 11.2 | — | ||||||||
| Amortization of intangible assets resulting from AZEK acquisition | 12.8 | — | 23.6 | — | ||||||||
| Depreciation and amortization | 49.3 | 41.2 | 140.1 | 115.5 | ||||||||
| Siding & Trim Segment Adjusted EBITDA | $ | 268.6 | $ | 250.5 | $ | 698.4 | $ | 754.0 |
| Three and Nine Months Ended December 31 | ||||||||||||
| Q3 FY26 | Q3 FY25 | FY26 | FY25 | |||||||||
| Siding & Trim Segment operating income margin | 25.7 | % | 29.1 | % | 23.5 | % | 29.8 | % | ||||
| Acquisition related expenses | 0.5 | % | — | % | 0.4 | % | — | % | ||||
| Inventory fair value adjustment | — | % | — | % | 0.5 | % | — | % | ||||
| Amortization of intangible assets resulting from AZEK acquisition | 1.6 | % | — | % | 1.0 | % | — | % | ||||
| Depreciation and amortization | 6.3 | % | 5.7 | % | 6.4 | % | 5.4 | % | ||||
| Siding & Trim Segment Adjusted EBITDA margin | 34.1 | % | 34.8 | % | 31.8 | % | 35.2 | % |
Deck, Rail & Accessories Segment Adjusted EBITDA and Adjusted EBITDA margin
| US$ Millions | Three and Nine Months Ended December 31 | |||||||
| Q3 FY26 | FY26 | |||||||
| Deck, Rail & Accessories Segment operating loss | $ | (24.0 | ) | $ | (35.9 | ) | ||
| Restructuring expenses | 2.2 | 2.2 | ||||||
| Inventory fair value adjustment | — | 36.7 | ||||||
| Amortization of intangible assets resulting from AZEK acquisition | 44.8 | 82.7 | ||||||
| Depreciation and amortization | 25.7 | 41.6 | ||||||
| Deck, Rail & Accessories Segment Adjusted EBITDA | $ | 48.7 | $ | 127.3 |
| Three and Nine Months Ended December 31 | ||||||
| Q3 FY26 | FY26 | |||||
| Deck, Rail & Accessories Segment operating loss margin | (12.4 | %) | (8.0 | %) | ||
| Restructuring expenses | 1.1 | % | 0.5 | % | ||
| Inventory fair value adjustment | — | % | 8.1 | % | ||
| Amortization of intangible assets resulting from AZEK acquisition | 23.1 | % | 18.4 | % | ||
| Depreciation and amortization | 13.3 | % | 9.3 | % | ||
| Deck, Rail & Accessories Segment Adjusted EBITDA margin | 25.1 | % | 28.3 | % |
Australia & New Zealand Segment Adjusted EBITDA and Adjusted EBITDA margin
| US$ Millions | Three and Nine Months Ended December 31 | |||||||||||
| Q3 FY26 | Q3 FY25 | FY26 | FY25 | |||||||||
| Australia & New Zealand Segment operating income | $ | 35.6 | $ | 34.8 | $ | 111.4 | $ | 68.0 | ||||
| Restructuring expenses | — | — | — | 57.3 | ||||||||
| Depreciation and amortization | 5.6 | 4.9 | 16.3 | 14.4 | ||||||||
| Australia & New Zealand Segment Adjusted EBITDA | $ | 41.2 | $ | 39.7 | $ | 127.7 | $ | 139.7 |
| Three and Nine Months Ended December 31 | ||||||||||||
| Q3 FY26 | Q3 FY25 | FY26 | FY25 | |||||||||
| Australia & New Zealand Segment operating income margin | 28.1 | % | 29.3 | % | 29.2 | % | 17.2 | % | ||||
| Restructuring expenses | — | % | — | % | — | % | 13.9 | % | ||||
| Depreciation and amortization | 4.5 | % | 4.2 | % | 4.3 | % | 3.6 | % | ||||
| Australia & New Zealand Segment Adjusted EBITDA margin | 32.6 | % | 33.5 | % | 33.5 | % | 34.7 | % |
Europe Segment EBITDA and EBITDA margin
| US$ Millions | Three and Nine Months Ended December 31 | |||||||||||
| Q3 FY26 | Q3 FY25 | FY26 | FY25 | |||||||||
| Europe Segment operating income | $ | 9.1 | $ | 3.6 | $ | 37.9 | $ | 24.7 | ||||
| Depreciation and amortization | 7.5 | 8.3 | 21.6 | 23.9 | ||||||||
| Europe Segment EBITDA | $ | 16.6 | $ | 11.9 | $ | 59.5 | $ | 48.6 |
| Three and Nine Months Ended December 31 | ||||||||||||
| Q3 FY26 | Q3 FY25 | FY26 | FY25 | |||||||||
| Europe Segment operating income margin | 7.0 | % | 3.1 | % | 9.4 | % | 6.8 | % | ||||
| Depreciation and amortization | 5.7 | % | 7.2 | % | 5.3 | % | 6.7 | % | ||||
| Europe Segment EBITDA margin | 12.7 | % | 10.3 | % | 14.7 | % | 13.5 | % |
Adjusted General Corporate and Unallocated R&D EBITDA
| US$ Millions | Three and Nine Months Ended December 31 | |||||||||||||||
| Q3 FY26 | Q3 FY25 | FY26 | FY25 | |||||||||||||
| General Corporate and Unallocated R&D costs | $ | (47.4 | ) | $ | (41.6 | ) | $ | (289.7 | ) | $ | (137.4 | ) | ||||
| Restructuring gain | (26.2 | ) | — | (26.2 | ) | — | ||||||||||
| Acquisition related expenses | 25.8 | — | 180.7 | — | ||||||||||||
| Asbestos related expenses and adjustments | 0.7 | 0.9 | 2.6 | 2.9 | ||||||||||||
| Depreciation and amortization | 1.9 | 0.7 | 4.6 | 3.0 | ||||||||||||
| Adjusted General Corporate and Unallocated R&D EBITDA | $ | (45.2 | ) | $ | (40.0 | ) | $ | (128.0 | ) | $ | (131.5 | ) |
Adjusted income before income taxes, Adjusted income tax expense and Adjusted effective tax rate
| US$ Millions | Three and Nine Months Ended December 31 | |||||||||||||||
| Q3 FY26 | Q3 FY25 | FY26 | FY25 | |||||||||||||
| Income before income taxes | $ | 110.6 | $ | 202.3 | $ | 160.3 | $ | 586.6 | ||||||||
| Asbestos related expenses and adjustments | 0.7 | 0.9 | 2.6 | 2.9 | ||||||||||||
| AICF interest income | (2.4 | ) | (2.7 | ) | (7.4 | ) | (8.5 | ) | ||||||||
| Restructuring, net | (24.0 | ) | — | (24.0 | ) | 57.3 | ||||||||||
| Pre-close financing costs1 | — | — | 46.5 | — | ||||||||||||
| Acquisition related expenses | 29.4 | — | 189.1 | — | ||||||||||||
| Inventory fair value adjustment | — | — | 47.9 | — | ||||||||||||
| Amortization of intangible assets resulting from AZEK acquisition | 57.6 | — | 106.3 | — | ||||||||||||
| Adjusted income before income taxes | $ | 171.9 | $ | 200.5 | $ | 521.3 | $ | 638.3 | ||||||||
| Income tax expense | $ | 41.9 | $ | 60.6 | $ | 84.8 | $ | 206.2 | ||||||||
| Tax adjustments2 | (12.2 | ) | (13.7 | ) | 13.4 | (56.1 | ) | |||||||||
| Adjusted income tax expense | $ | 29.7 | $ | 46.9 | $ | 98.2 | $ | 150.1 | ||||||||
| Effective tax rate | 37.9 | % | 30.0 | % | 52.9 | % | 35.2 | % | ||||||||
| Adjusted effective tax rate | 17.3 | % | 23.4 | % | 18.8 | % | 23.5 | % | ||||||||
| 1 Includes pre-close financing interest of $34.9 million as well as a $11.6 million non-cash loss on our interest rate swap incurred in the first quarter of fiscal year 2026.2 Includes tax adjustments related to the amortization benefit of certain US intangible assets, asbestos, and discrete items relating to the AZEK acquisition, and $18.2 million in respect of the ATO settlement agreement incurred in the second quarter of fiscal year 2026. |
Adjusted interest, net
| US$ Millions | Three and Nine Months Ended December 31 | ||||||||||||
| Q3 FY26 | Q3 FY25 | FY26 | FY25 | ||||||||||
| Interest, net | $ | 65.6 | $ | 3.8 | $ | 168.8 | $ | 7.4 | |||||
| Pre-close financing and interest costs | — | — | (34.9 | ) | — | ||||||||
| AICF interest income | 2.4 | 2.7 | 7.4 | 8.5 | |||||||||
| Adjusted interest, net | $ | 68.0 | $ | 6.5 | $ | 141.3 | $ | 15.9 |
Adjusted other income, net
| US$ Millions | Three and Nine Months Ended December 31 | |||||||||||||
| Q3 FY26 | Q3 FY25 | FY26 | FY25 | |||||||||||
| Other expense (income), net | $ | — | $ | — | $ | 9.7 | $ | (0.2 | ) | |||||
| Non-cash loss on interest rate swap | — | — | (11.6 | ) | — | |||||||||
| Adjusted other income, net | $ | — | $ | — | $ | (1.9 | ) | $ | (0.2 | ) | ||||
Net Debt
| US$ Millions | December 31 | ||||
| FY26 | |||||
| Total principal amount of debt | $ | 4,648.1 | |||
| Cash and cash equivalents | (344.2 | ) | |||
| Net debt | $ | 4,303.9 | |||
Free Cash Flow
| US$ Millions | Nine Months Ended December 31 | |||||||
| FY26 | FY25 | |||||||
| Net cash provided by operating activities | $ | 455.4 | $ | 657.4 | ||||
| Purchases of property, plant and equipment | (302.8 | ) | (333.0 | ) | ||||
| Proceeds from sale of property, plant and equipment | 108.2 | — | ||||||
| Free Cash Flow | $ | 260.8 | $ | 324.4 | ||||
Investor and Media Contact
[email protected]
Source: James Hardie Industries plc
INVESTOR RELATIONS
[email protected]
Investor Email Alerts
Personal Information.
Email Address *Required Email Address is required. Email Address is invalid.
Investor Alert Options *
- News
- Quarterly Reports
- Annual Reports
- SEC Filings
- End of Day Stock Quote
- Events & Presentations
Investor Alert Options is required.
The captcha test has failed. Please try again.
Submit
© 2026 James Hardie Industries PLC - All rights reserved
January 26, 2026
CHICAGO--(BUSINESS WIRE)-- James Hardie Industries plc (ASX / NYSE: JHX) ("James Hardie" or the "Company"), a leading provider of exterior home and outdoor living solutions, today announced it will release financial results for the third quarter of its 2026 fiscal year after the market closes in the United States on Tuesday, February 10th and before the market opens in Australia on Wednesday, February 11th. Following the release, the company will hold a conference call to discuss results, hosted by Aaron Erter, CEO and Ryan Lada, CFO. The event will be webcast live on the Investor Relations page of James Hardie’s corporate website (www.jameshardie.com ) at the respective times for the following time zones:
- US: 5PM EST / 4PM CST on Tuesday, February 10 th, 2026
- Dublin: 10PM GMT on Tuesday, February 10 th, 2026
- Australia: 9AM AEDT on Wednesday, February 11 th, 2026
Teleconference Registration: https://events.q4inc.com/analyst/507859626?pwd=BLIJwWI3
Webcast Registration: https://events.q4inc.com/attendee/507859626
About James Hardie
James Hardie Industries plc is the industry leader in exterior home and outdoor living solutions, with a portfolio that includes fiber cement and fiber gypsum building products, and composite and PVC decking and railing products. Products offered by James Hardie are engineered for beauty, durability, and climate resilience, and include trusted brands like Hardie®, TimberTech®, AZEK® Exteriors, Versatex®, fermacell® and StruXure®. With a global footprint, the James Hardie portfolio is marketed and sold throughout North America, Europe, Australia and New Zealand.
James Hardie Industries plc is incorporated and existing under the laws of Ireland. As an Irish plc, James Hardie is governed by the Irish Companies Act. James Hardie’s principal executive offices are located at 1st Floor, Block A, One Park Place, Upper Hatch Street, Dublin 2, D02 FD79, Ireland.
Investor and Media Contact
Joe Ahlersmeyer, CFA
Vice President, Investor Relations
+1 773-970-1213
[email protected]
Source: James Hardie Industries plc
INVESTOR RELATIONS
[email protected]
Investor Email Alerts
Personal Information.
Email Address *Required Email Address is required. Email Address is invalid.
Investor Alert Options *
- News
- Quarterly Reports
- Annual Reports
- SEC Filings
- End of Day Stock Quote
- Events & Presentations
Investor Alert Options is required.
The captcha test has failed. Please try again.
Submit
© 2026 James Hardie Industries PLC - All rights reserved
James Hardie to Optimize Manufacturing Footprint
Bull 3
Bear 0
Product/operations
January 15, 2026
Initiatives Expected to Generate Annualized Cost Savings of Approximately $25 Million Beginning in Q1 Fiscal Year 2027
Company Reaffirms Guidance for the Third Quarter and Full Year of Fiscal Year 2026
SYDNEY & CHICAGO--(BUSINESS WIRE)-- James Hardie Industries plc (NYSE / ASX: JHX) ("James Hardie" or the "Company"), a leading provider of exterior home and outdoor living solutions, today announced that it is taking steps to optimize its manufacturing footprint as part of the Company’s ongoing commitment to operational excellence through the Hardie™ Operating System (“HOS”). As part of these actions:
- The Company’s manufacturing facilities in Fontana, California and Summerville, South Carolina will close within the next 60 days;
- The sites’ manufacturing operations, which represent approximately 6% of the Company’s year-to-date North American volume, will be absorbed by other facilities; and
- The Fontana site’s Innovation and Research & Development functions will remain in operation.
Aaron Erter, Chief Executive Officer, said, “During the past several years, James Hardie has made significant investments in modernizing our manufacturing facilities to improve efficiency, support our material conversion opportunities, and to better serve our customers. Following a comprehensive review of our manufacturing network, we have decided to transfer more production volume to our modern, advanced plants. These actions will further improve our cost structure, increase productivity, and reinforce the Hardie Operating System, while ensuring we have the capacity needed to support our growth initiatives. Our focus remains on driving sustainable growth and value creation over the long term.”
Erter continued, “The decision to close our plants in Fontana, California, and Summerville, South Carolina was not taken lightly, and I want to thank the teams at these sites for their years of dedication and hard work. We are grateful for their many contributions, which have been significant in shaping James Hardie.”
Financial Impact and FY26 Guidance
The Company expects the site closures and optimization initiatives to generate annualized cost savings of approximately $25 million beginning in the first quarter of fiscal year 2027. These cost savings will be driven by reduced fixed costs and improved utilization across the remaining manufacturing network, and are incremental to any cost synergy savings related to the recent AZEK acquisition.
The Company expects to incur one-time pre-tax charges of approximately $40 million to $44 million, in connection with the site closures and optimization actions. These charges are expected to consist primarily of employee severance, benefits and transition-related costs, contract termination, and facility exit costs, as well as asset impairments and other non-cash charges.
The one-time pre-tax charges are expected to be recognized primarily in the fourth quarter of fiscal year 2026, split approximately evenly between cash and non-cash items. Further information will be shared on the Company’s upcoming third quarter earnings call.
In connection with today’s announcement, James Hardie reaffirmed its guidance for the third quarter and full year of fiscal year 2026 provided on November 18, 2025, in connection with its second quarter earnings results.
About James Hardie
James Hardie Industries plc is the industry leader in exterior home and outdoor living solutions, with a portfolio that includes fiber cement, fiber gypsum, and composite and PVC decking and railing products. Products offered by James Hardie are engineered for beauty, durability, and climate resilience, and include trusted brands like Hardie®, TimberTech®, AZEK® Exteriors, Versatex®, fermacell® and StruXure®. With a global footprint, the James Hardie portfolio is marketed and sold throughout North America, Europe, Australia and New Zealand.
James Hardie Industries plc is incorporated and existing under the laws of Ireland. As an Irish plc, James Hardie is governed by the Irish Companies Act. James Hardie’s principal executive offices are located at 1st Floor, Block A, One Park Place, Upper Hatch Street, Dublin 2, D02 FD79, Ireland.
Forward-Looking Statements
This communication contains forward-looking statements and information that are subject to risks, uncertainties and assumptions. Many factors could cause the actual results, performance or achievements of James Hardie to be materially different from those expressed or implied in this communication, including, among others, the risks and uncertainties set forth in Section 3 "Risk Factors" in James Hardie’s Annual Report on Form 20-F for the fiscal year ended March 31, 2025; changes in general economic, political, governmental and business conditions globally and in the countries in which James Hardie does business; changes in interest rates; changes in inflation rates; changes in exchange rates; the level of construction generally; changes in cement demand and prices; changes in raw material and energy prices; changes in business strategy; the AZEK acquisition and various other factors. Should one or more of these risks or uncertainties materialize, or should underlying assumptions prove incorrect, actual results may vary materially from those described herein. James Hardie assumes no obligation to update or correct the information contained in this Press Release except as required by law.
This media release has been authorized by the James Hardie Board of Directors.
View source version on businesswire.com: https://www.businesswire.com/news/home/20260115229007/en/
James Hardie Contacts:
Investors:
Joe Ahlersmeyer, CFA
Vice President, Investor Relations
+1 773-970-1213
[email protected]
Media:
Ed Trissel / Arielle Rothstein
Joele Frank, Wilkinson Brimmer Katcher
+1 212-355-4449
Jack Gordon
Sodali & Co.
+61 478 060 362
[email protected]
Source: James Hardie Industries plc
Released January 15, 2026
INVESTOR RELATIONS
[email protected]
Investor Email Alerts
Personal Information.
Email Address *Required Email Address is required. Email Address is invalid.
Investor Alert Options *
- News
- Quarterly Reports
- Annual Reports
- SEC Filings
- End of Day Stock Quote
- Events & Presentations
Investor Alert Options is required.
The captcha test has failed. Please try again.
Submit
© 2026 James Hardie Industries PLC - All rights reserved
When Chrisse and Matt Dragon discovered hidden stucco damage, they turned to Hardie® siding for a lasting solution. Six years later, their home still looks brand new.
View gallery of photos

November 4, 2025
Danielle Pietersen
When Chrisse and Matt Dragon bought their Pennsylvania home, they knew right away the stucco had to go. A routine inspection uncovered hidden issues, pushing them to find a siding solution that could withstand four seasons of weather and still deliver the look they wanted. With the help of KLM Contractors and Hardie® fiber cement siding, their re-side turned into a transformation that still looks brand new nearly six years later.
From Stucco Stress to Siding Success: The Dragon Family’s Re-Side With Hardie® Fiber Cement
A DIY FAMILY TACKLES THEIR FIRST CONTRACTOR PROJECT
Chrisse Dragon grew up around construction — her parents are contractors — so home projects and design decisions come naturally. However, when they discovered major stucco siding damage during their home inspection, they realized that DIY wasn’t enough. “We decided to re-side our house, because during the inspection we had stucco issues, and so we knew we were going to have to find a product that was going to be replacing stucco in general,” Matt explained. He added that Hardie® siding stood out as “one of the most superior and best-designed products out there.”
The Dragons wanted a material that would solve their stucco problem and hold up against southeastern Pennsylvania’s extremes — from heat waves to freeze-thaw cycles, and even the occasional tornado.

REPLACING STUCCO WITH FIBER CEMENT
Although stucco has a long design history, it can conceal water damage if not installed and detailed correctly. The Dragons had seen these issues firsthand on their first home and wanted something different. As Matt put it, they chose Hardie® siding “over other products like vinyl or wood or stucco” because they wanted something higher end, longer lasting and more reliable in their area, where many homes suffer stucco problems.
Working with their contractor, KLM, the Dragons selected Gray Slate Hardie® Plank Lap siding with board-and-batten accents for a timeless but distinctive look. Chrisse recalls, “When initially designing this home, I really wanted something that was classic and timeless, and with the Hardie® product in Gray Slate, it really matched and complemented the interior of the home.”
Visualization tools made their creative decisions easier. A self-described “very visual person,” Chrisse said Hardie™ Designer , powered by Hover®, was “a game changer.” She found it easy to use — even for someone not tech-savvy — and it helped her feel comfortable knowing the siding choices would harmonize with the home’s interior palette of grays and blues. Hardie™ Designer allows homeowners to see their home clad in an endless combination of Hardie® siding profiles and colors with just one image upload — instantly.
Performance mattered just as much as style. “Our region experiences pretty harsh weather,” Matt noted, explaining that the siding needed to endure extreme heat, freezing cold, and sudden storms. Hardie® fiber cement gave them confidence it would.
In fact, just a year after the installation, a tornado passed near the Dragons’ home. While neighboring houses suffered significant damage, Matt remembered expecting the worst but being relieved to find that “none of that debris was ours. [The siding] held up perfectly in the weather.” The experience confirmed their decision to invest in fiber cement.
Now, nearly six years after the re-side, the Dragons say their home still looks new. Chrisse loves that the exterior has “a high-end polished look” that is easy to maintain, while Matt points out the siding “is not fading at all” and continues to draw compliments. The project even earned a Best Transformation honor during James Hardie’s Fourth Annual Exterior Design Week.
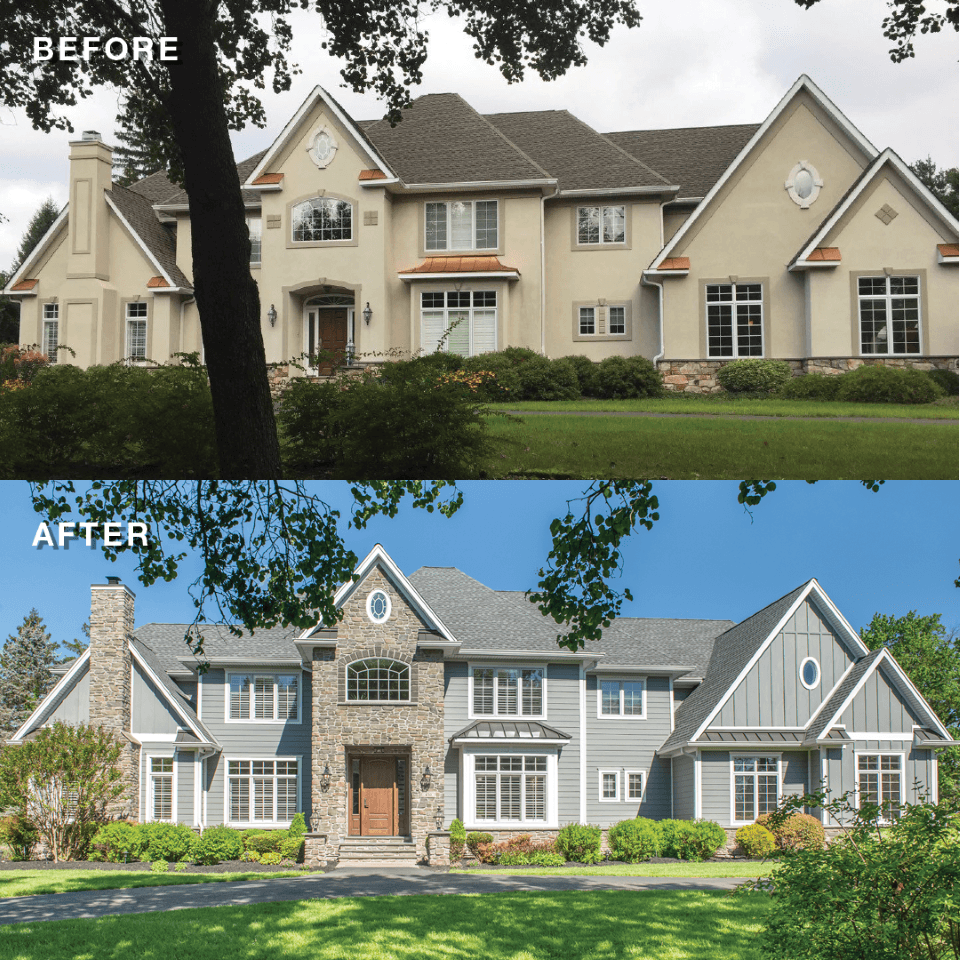
Before and After: Stucco to Hardie® Fiber Cement transformation
WORKING WITH A TRUSTED CONTRACTOR
The Dragons chose KLM Contractors, led by Maciej Chechla, on a realtor’s recommendation. Chrisse said that “Maciej, with his design sense and just overall care, was really important to us…He was amazing to work with, and his team was super knowledgeable.” That trust led the couple to hire KLM for additional projects, including a porch addition and a new roof.
KLM’s membership in the James Hardie™ ALLIANCE offered extra reassurance. According to Maciej, the program’s training, marketing support and tools provide credibility by showing clients the contractor is “backed by the industry leader in fiber cement siding.*” For homeowners, that translates into confidence that the job will be done right.
LESSONS FOR PROS AND HOMEOWNERS
The Dragons’ journey highlights best practices any re-side project should follow:
- Inspect honestly: A thorough inspection is essential, especially with stucco, which can hide moisture damage and structural issues beneath the surface. Planning for a full tear-off ensures you address problems early and avoid costly surprises later.
- Specify for climate: Every region has its own weather challenges. By selecting materials designed to withstand both sweltering summers and freezing winters, you safeguard your investment and maintain curb appeal over time.
- Visualize early: Design tools like the Hardie™ Designer make it easier to picture the finished home before work begins. This step helps align expectations, prevents miscommunication and allows homeowners to feel confident in their choices.
- Choose carefully: Success depends on more than just the siding product. Working with a trusted contractor and a proven material gives homeowners confidence that the project will be completed correctly and built to last.
- Think beyond day one: A re-side is a long-term investment, and the results should stand the test of time. Nearly six years after their project, the Dragons’ home still looks new, proving that smart choices today pay off for years to come.
As Matt advises, “Choosing the correct contractor and product… is a big investment.” Chrisse agrees, emphasizing the importance of “having confidence in who you are working with and the materials you are working with.”
By combining trusted professionals with durable Hardie® siding, the Dragons’ project demonstrates how the right decisions can deliver both beauty and peace of mind for years to come.

WHY HARDIE® SIDING WORKS
For Maciej and KLM, the Dragons’ project represents what they often see across Pennsylvania: outdated stucco, rotted wood, and warped vinyl. He explains that “premium products like fiber cement deliver long-term value, performance, and peace of mind,” while ColorPlus Technology® finishes ensure lasting beauty. His advice is simple: “Cutting corners or materials can cost more in the long run… I recommend Hardie® products to any homeowner who values quality, durability, and curb appeal.”
For Chrisse and Matt, the choice is clear. After living with their siding for nearly six years, they remain confident that they made the right decision. “We absolutely would recommend Hardie® products to anyone looking to re-side their home, especially if they value quality, durability and the overall look. We are extremely happy with the quality of the product and working with a contractor that we trust.” Their satisfaction reflects not just the lasting performance of the siding, but also the peace of mind that comes from knowing their home is protected and looks the way they envisioned.

DISCOVER THE JAMES HARDIE™ ALLIANCE ADVANTAGE
Ready to get your project started? Request a quote and we’ll connect you with up to three contractors from the James Hardie™ ALLIANCE whom you can trust are qualified to install your Hardie® siding and are insured.
Backed by the industry leader in fiber cement, the James Hardie™ ALLIANCE is designed to help contractors stand out and grow their business. Members gain access to specialized tools, training and marketing support, along with the added credibility of being backed by a trusted brand. Explore the James Hardie™ ALLIANCE for resources that help pros deliver projects built to inspire confidence.
*Based on Freedonia 2022 Global Siding (Cladding) demand estimates and James Hardie sales in North America
Danielle Pietersen
Danielle Pietersen is a content strategist and technical writer who specializes in home improvement and finance. Her work has appeared in a wide array of publications from trade to upper education.
Share
Follow James Hardie
Prompts
Click prompts to add them under the company line, click again to take one out, then copy the result into your AI chat. Shared by Asian Century Stocks and Uncovered Thai Stocks. Thank you.
James Hardie Industries plc (ticker JHX), listed in Australia.
Copied
Company History
Name and ticker changes, and re-registrations under a new regulatory id. When a ticker stopped being used is not recorded, so former tickers are undated.
| Date | Change | Detail |
|---|---|---|
| May 11, 2009 | Renamed | HARDIE JAMES INDUSTRIES NV → JAMES HARDIE INDUSTRIES N.V. |
ETFs Holding James Hardie Industries plc
Exchange-traded funds whose newest published daily portfolio holds one of the company's listings, largest weight first.
| ETF | Weight in ETF | Shares | Market value | As of |
|---|---|---|---|---|
| ACVU | 0.50% | 51,753 | $ 0.00 | Nov 18, 2026 |
| MMSC | 0.34% | 6,234 | $ 169.689K | Nov 16, 2026 |
| DFAT | 0.24% | 2,759,786 | $ 76.06M | Nov 12, 2026 |
| ESIM | 0.22% | 1,501 | $ 39.461K | Jul 31, 2026 |
| GVLU | 0.16% | 15,718 | $ 427.844K | Nov 17, 2026 |
| SHRT | 0.14% | 670 | $ 18.237K | Nov 17, 2026 |
| CLSE short | -0.14% | -41,764 | $ -1.241M | Aug 31, 2026 |
| AVUQ | 0.13% | 20,570 | $ 559.915K | Nov 16, 2026 |
| ESLG | 0.12% | 1,101 | $ 28.945K | Jul 31, 2026 |
| AVMV | 0.10% | 29,036 | $ 790.36K | Nov 16, 2026 |
| JMEE | 0.10% | 110,289 | $ 2.936M | Nov 17, 2026 |
| FTLS | 0.09% | 82,866 | $ 0.00 | Nov 16, 2026 |
| INRO | 0.09% | 20,132 | $ 547.993K | Nov 16, 2026 |
| IALT short | -0.06% | -164,154 | $ -4.468M | Nov 16, 2026 |
| NTSI | 0.06% | 10,465 | $ 276.883K | Jun 30, 2026 |
| DFSU | 0.05% | 42,228 | $ 1.164M | Nov 12, 2026 |
| DXUV | 0.05% | 107,012 | $ 2.949M | Nov 12, 2026 |
| DFAU | 0.03% | 141,439 | $ 3.898M | Nov 12, 2026 |
| AVLV | 0.03% | 276,800 | $ 7.534M | Nov 16, 2026 |
| AVLC | 0.03% | 16,382 | $ 445.918K | Nov 16, 2026 |
| AVSD | 0.03% | 4,776 | $ 129.451K | Nov 16, 2026 |
| DFUV | 0.03% | 164,183 | $ 4.525M | Nov 12, 2026 |
| DFAC | 0.03% | 920,151 | $ 25.359M | Nov 12, 2026 |
| VSLU | 0.03% | 5,227 | $ 136.843K | Jun 30, 2026 |
| DFUS | 0.02% | 175,188 | $ 4.828M | Nov 12, 2026 |
| AVMC | 0.02% | 3,376 | $ 91.895K | Nov 16, 2026 |
| DCOR | 0.02% | 285,413 | $ 7.866M | Nov 12, 2026 |
| AVUS | 0.01% | 73,861 | $ 2.01M | Nov 16, 2026 |
| DFSI | 0.01% | 4,056 | $ 114.435K | Nov 12, 2026 |
| DIHP | 0.01% | 22,162 | $ 625.274K | Nov 12, 2026 |
| DFIC | 0.01% | 46,660 | $ 1.316M | Nov 12, 2026 |
| DFAI | 0.01% | 49,732 | $ 1.403M | Nov 12, 2026 |
| DFAX | 0.01% | 32,727 | $ 923.353K | Nov 12, 2026 |
| EBI | 0.00% | 13 | $ 386.23 | Aug 31, 2026 |
| AVSU | 0.00% | 766 | $ 20.851K | Nov 16, 2026 |