FY27 Trading Update
Bull 2
Bear 4
Guidance
Fiscal year ends June
Quarters are offset from the calendar — Q1 is Jul–Sep
|
Inghams Group Limited is a vertically integrated poultry producer operating across Australia and New Zealand. The company produces and sells chicken and turkey products across free-range, value-enhanced, primary processed, further processed, and by-product categories. It also manufactures stockfeed primarily for internal use, as well as for the poultry, pig, and dairy feed industries. Inghams supplies major retailers, quick service restaurant (QSR) operators, food service distributors, and wholesalers. The group holds strong market positions in the Australian turkey and stockfeed sectors, as well as the New Zealand dairy feed industry. Founded in 1918, the company expanded through organic growth and acquisitions to become a major integrated poultry producer in the region. Summarised from the company's own disclosures, fiscal year ended Jun 2026 |
Industry Food, Beverage & Tobacco | Homepage inghams.com.au |
| Sector Consumer Defensive | IR page investors.inghams.com.au/Investor-Centre | |
|
Tags
poultry, chicken, turkey, stockfeed, free-range, value-enhanced, food service, wholesale, retail, qsr
|
Press page inghams.com.au/news |
Metrics
| Valuation | |
|---|---|
| Market cap | A$ 766.002M |
| Market cap (USD) | $ 554.406M |
| P/E | 24.50 |
| PEG | — |
| P/BV | 3.00 |
| P/S | 0.24 |
| P/OCF | 2.44 |
| P/FCF | — |
| Dividend yield | — |
| Turnover / mcap | — |
| Returns | |
|---|---|
| ROE | 13.1% |
| ROI | 4.1% |
| ROIC | 17.0% |
| Profit margin | 1.1% |
| Growth | |
|---|---|
| Revenue growing | No |
| Profits growing | No |
| Revenue up 3y | No |
| Revenue up 5y | No |
| Earnings growth 3y (net profit CAGR) | -16.9% |
| Quality | |
|---|---|
| Profitable | Yes |
| Margin expanding | No |
| Buying back stock | No |
| Diluting (TTM) | No |
| Debt/Equity | 236.6% |
| Podcast bulls (TTM) | Sign up |
| Podcast bears (TTM) | Sign up |
| Podcast sentiment (TTM) | Sign up |
| Podcast sentiment % (TTM) | Sign up |
| News sentiment (TTM) | 0 |
| Quality score | -6.3% |
| Insiders | |
|---|---|
| Buys, 1w | Sign up |
| Buys, 1m | Sign up |
| Buys, 1y | Sign up |
| Sells, 1w | Sign up |
| Sells, 1m | Sign up |
| Sells, 1y | Sign up |
Sign up to see this company's insider trades
Sign up to see institutional holdings
Sign UpPodcast Mentions
Sign up to see podcast mentions and sentiment
Sign UpAnnouncements lodged with ASX, newest first, routine forms (director and substantial-holding notices, daily buy-back and quotation notices) included. The link opens the announcement on ASX. Press releases from the company's own website, newest first.
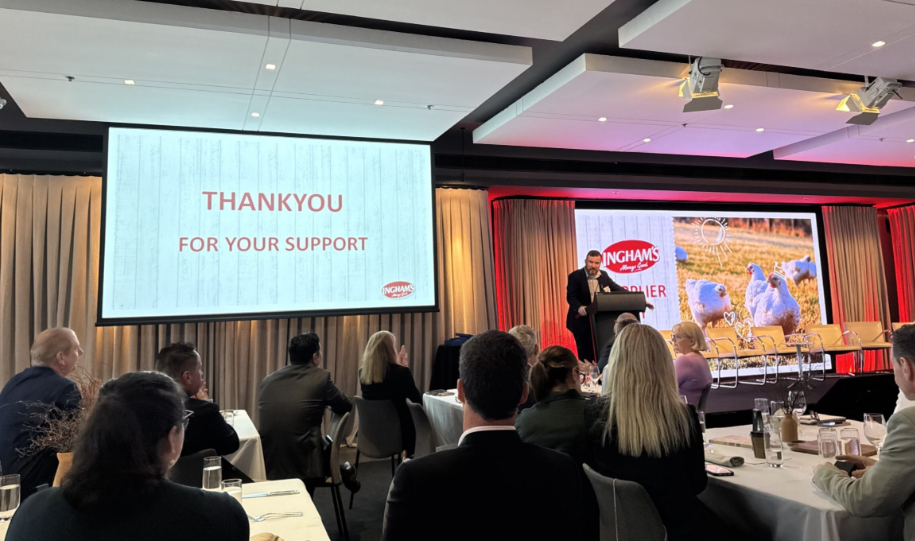
2026 AGM Chair and CEO/MD Addresses and Presentation
Bull 0
Bear 0
Routine
Results of 2026 AGM
Bull 0
Bear 0
Routine


Prompts
Click prompts to add them under the company line, click again to take one out, then copy the result into your AI chat. Shared by Asian Century Stocks and Uncovered Thai Stocks. Thank you.
Inghams Group Limited (ticker ING), listed in Australia.
Copied
ETFs Holding Inghams Group Limited
Exchange-traded funds whose newest published daily portfolio holds one of the company's listings, largest weight first.
| ETF | Weight in ETF | Shares | Market value | As of |
|---|---|---|---|---|
| AVDV | 0.10% | 12,514,572 | $ 18.48M | Nov 16, 2026 |
| AVDS | 0.02% | 58,030 | $ 85.69K | Nov 16, 2026 |
| DFIS | 0.02% | 730,015 | $ 1.133M | Nov 12, 2026 |
| DXIV | 0.01% | 16,022 | $ 24.877K | Nov 12, 2026 |
| AVDE | 0.01% | 796,568 | $ 1.176M | Nov 16, 2026 |
| DFIC | 0.00% | 488,668 | $ 758.744K | Nov 12, 2026 |
| DFAX | 0.00% | 240,798 | $ 373.882K | Nov 12, 2026 |
| DFAI | 0.00% | 328,162 | $ 509.53K | Nov 12, 2026 |