AGM Webcast Notification
Bull 0
Bear 0
Routine
Fiscal year ends June
Quarters are offset from the calendar — Q1 is Jul–Sep
|
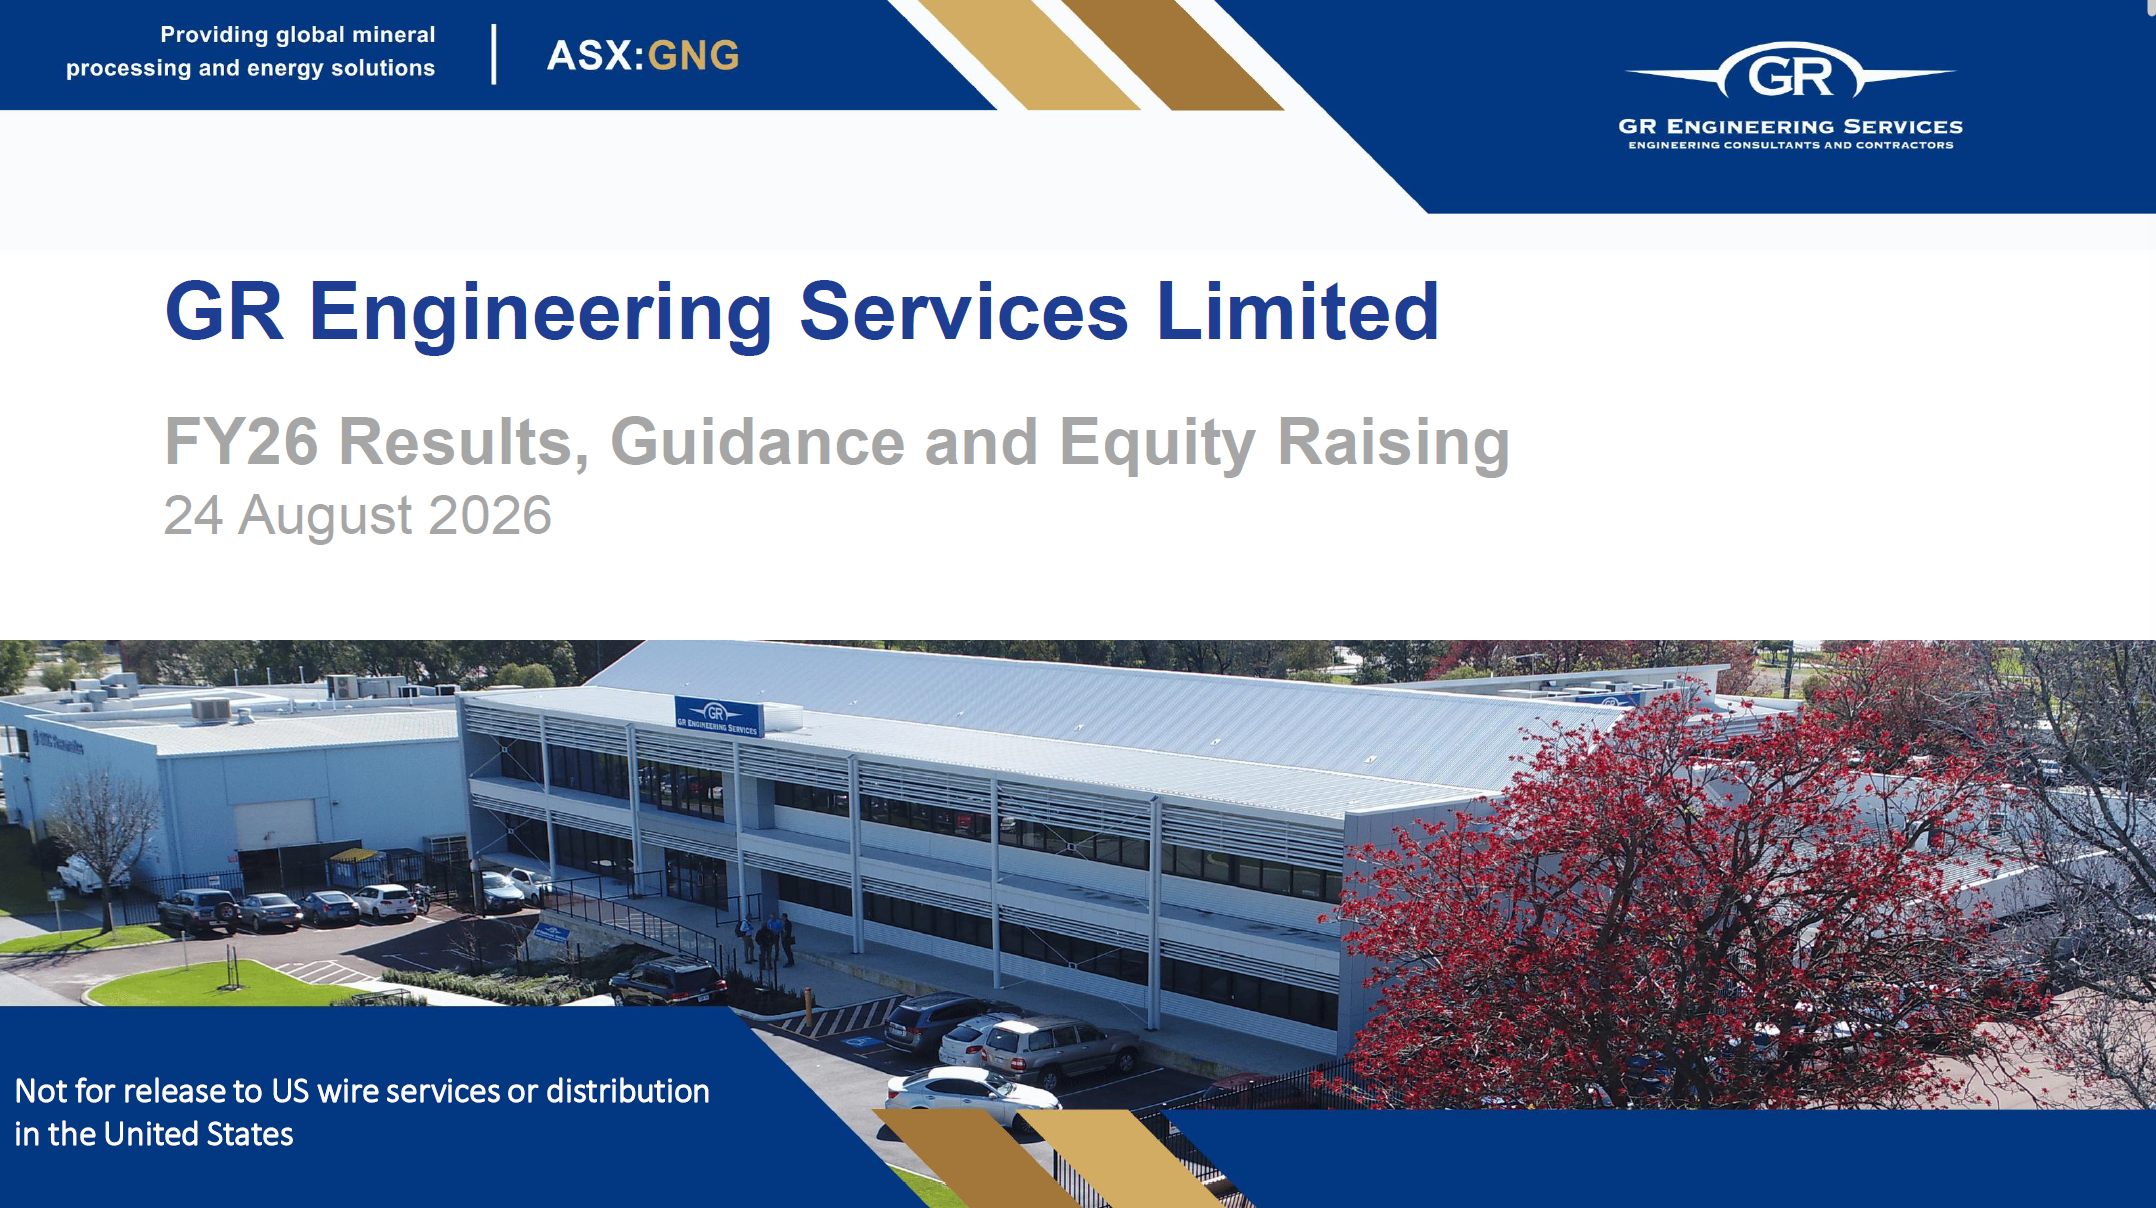
GR Engineering Services Limited is a process engineering, design, and construction company serving the mining, mineral processing, and energy sectors. The group provides engineering, procurement, and construction (EPC) services, detailed engineering design, and process control solutions for precious metals, base metals, and mineral sands projects. Its subsidiaries include GR Production Services, which offers operations and maintenance services for the energy sector, including gas, LNG, and green hydrogen, and Mipac and Paradigm, which supply control systems and automation. The company serves clients ranging from junior resource companies to international mining houses across Australia, Papua New Guinea, and other international markets. Notable projects include the King of the Hills Operations Upgrade, the Kainantu Gold Project, and the Eloise Copper Expansion. GR Engineering has origins dating back to 1986 and maintains a presence in Australia, Indonesia, and the United Kingdom. Summarised from the company's own disclosures, fiscal year ended Aug 2025 |
Industry Materials | Homepage gres.com.au |
| Sector Industrials | IR page gres.com.au | |
|
Tags
process engineering, mineral processing, epc, energy operations, automation, gas production, lng, green hydrogen, control systems, mining services, GR Production Services, Mipac, Paradigm, King of the Hills Operations, Kainantu Gold Project, Eloise Copper Expansion Project, Mungari Future Growth Project, Kathleen Valley Lithium Backfill Project, Woodlawn Restart Project, West Musgrave Project, Moranbah Gas Project, Gorgon Project, Ichthys LNG, Blacktip gas field, Cosmic Boy Concentrator Conversion Project
|
Press page — |
Metrics
| Valuation | |
|---|---|
| Market cap | A$ 1.467B |
| Market cap (USD) | $ 995.458M |
| P/E | 22.99 |
| PEG | 1.85 |
| P/BV | 11.71 |
| P/S | 2.97 |
| P/OCF | 23.41 |
| P/FCF | — |
| Dividend yield | — |
| Turnover / mcap | — |
| Returns | |
|---|---|
| ROE | 53.7% |
| ROI | 51.0% |
| ROIC | 51.0% |
| Profit margin | 7.9% |
| Growth | |
|---|---|
| Revenue growing | Yes |
| Profits growing | Yes |
| Revenue up 3y | No |
| Revenue up 5y | No |
| Earnings growth 3y (net profit CAGR) | 12.4% |
| Quality | |
|---|---|
| Profitable | Yes |
| Margin expanding | Yes |
| Buying back stock | No |
| Diluting (TTM) | Yes |
| Debt/Equity | — |
| Podcast bulls (TTM) | Sign up |
| Podcast bears (TTM) | Sign up |
| Podcast sentiment (TTM) | Sign up |
| Podcast sentiment % (TTM) | Sign up |
| News sentiment (TTM) | 0 |
| Quality score | 18.8% |
| Insiders | |
|---|---|
| Buys, 1w | Sign up |
| Buys, 1m | Sign up |
| Buys, 1y | Sign up |
| Sells, 1w | Sign up |
| Sells, 1m | Sign up |
| Sells, 1y | Sign up |
Sign up to see this company's insider trades
| Figure | FY 2026 | FY 2025 | FY 2024 | FY 2023 | FY 2022 | FY 2021 | FY 2020 | FY 2019 | FY 2018 | FY 2017 | FY 2016 | FY 2015 | FY 2014 | FY 2013 | FY 2012 | FY 2011 | FY 2010 |
|---|---|---|---|---|---|---|---|---|---|---|---|---|---|---|---|---|---|
| Revenue | 493.164M | 479.02M | 424.064M | 551.361M | 651.669M | 392.385M | 222.402M | 182.256M | 283.603M | 238.691M | 255.292M | 216.893M | 114.183M | 114.695M | 114.695M | 152.838M | 128.217M |
| Net profit | 39.033M | 34.209M | 31.18M | 27.491M | 34.72M | 21.01M | -7.25M | 6.53M | 11.641M | 12.865M | 19.34M | 12.938M | 14.164M | 7.539M | 7.539M | 13.115M | 17.836M |
Sign up to see institutional holdings
Sign UpPodcast Mentions
Sign up to see podcast mentions and sentiment
Sign UpAnnouncements lodged with ASX, newest first, routine forms (director and substantial-holding notices, daily buy-back and quotation notices) included. The link opens the announcement on ASX. Press releases from the company's own website, newest first.
Application for quotation of securities - GNG
Bull 0
Bear 0
Routine
Cleansing Notice
Bull 0
Bear 0
Routine
 LinkedIn
 Facebook

Prompts
Click prompts to add them under the company line, click again to take one out, then copy the result into your AI chat. Shared by Asian Century Stocks and Uncovered Thai Stocks. Thank you.
GR Engineering Services Limited (ticker GNG), listed in Australia.
Copied
ETFs Holding GR Engineering Services Limited
Exchange-traded funds whose newest published daily portfolio holds one of the company's listings, largest weight first.
| ETF | Weight in ETF | Shares | Market value | As of |
|---|---|---|---|---|
| AVSD | 0.02% | 11,750 | $ 57.743K | Nov 16, 2026 |
| AVDS | 0.02% | 15,666 | $ 76.987K | Nov 16, 2026 |
| DFIS | 0.02% | 193,842 | $ 1.016M | Nov 12, 2026 |
| DFSI | 0.01% | 19,054 | $ 99.913K | Nov 12, 2026 |
| DFIC | 0.00% | 134,779 | $ 706.74K | Nov 12, 2026 |
| DFAX | 0.00% | 85,939 | $ 450.638K | Nov 12, 2026 |
| DXIV | 0.00% | 941 | $ 4,934.32 | Nov 12, 2026 |
| DFAI | 0.00% | 58,181 | $ 305.083K | Nov 12, 2026 |
| AVDE | 0.00% | 83,648 | $ 411.069K | Nov 16, 2026 |