Australia and India: Partners in a changing world Drawing on both personal experience and four decades of ANZ's presence in India, ANZ CEO Nuno Matos reflects on the evolution of the Australia-India relationship and the opportunities that lie…
Australia and India: Partners in a changing world
Drawing on both personal experience and four decades of ANZ's presence in India, ANZ CEO Nuno Matos reflects on the evolution of the Australia-India relationship and the opportunities that lie ahead.
Nuno Matos, CEO, ANZ
Published on 14 September 2026
Share


As the Australia India Business Council celebrates its 40th anniversary, it is worth reflecting on what sustained economic partnerships look like.
Strong relationships are built over decades, not years. ANZ has had a presence in India for more than 40 years and, over that time, we have helped build strong connections between our two countries.
For me, the relationship between Australia and India is also personal. My grandfather was born in Daman before moving to Mozambique, where he met my Portuguese grandmother. I was born and raised in Lisbon and, while I have had the opportunity to live and work across many countries and cultures, I have always felt a particularly strong connection to India.
Today, I have the privilege of leading one of Australia's largest employers in India, with around 9,000 employees.
Through my career, I've learned that the strongest and most enduring economic relationships are built on understanding, trust and long-term commitment. That's one of the reasons I find the Australia-India relationship so compelling. It brings together two countries with different strengths, experiences and perspectives, but a growing willingness to work together and invest in each other's success.
The importance of that relationship becomes even clearer when viewed against a rapidly changing global backdrop.
Geopolitical relationships are evolving, technology is advancing at an exponential rate, and countries are reassessing how they position themselves in an increasingly complex environment. Artificial intelligence, the energy transition, digital infrastructure and defence capabilities are reshaping economies and societies alike.
Yet despite this turbulence, the global economy remains resilient, with another 3 per cent-plus year expected in 2026.
{IMAGE HERE}

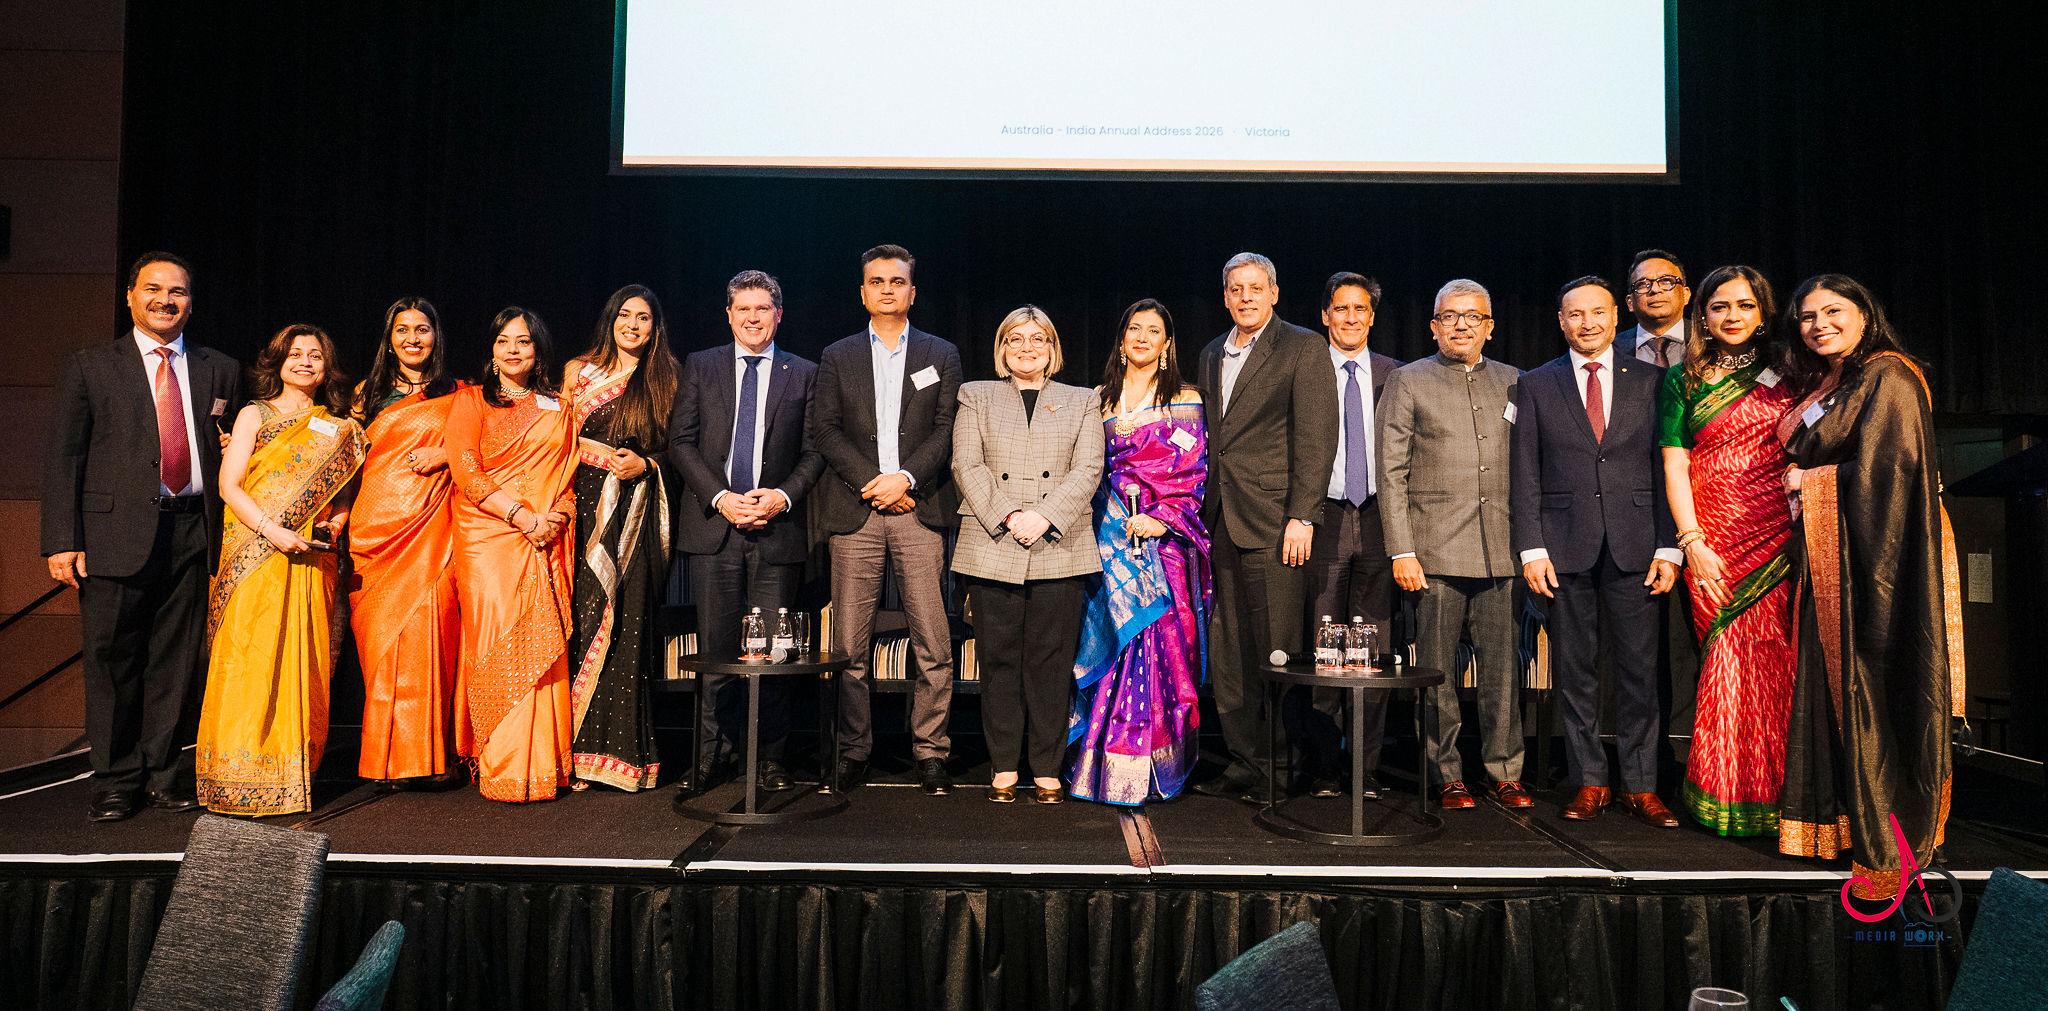
Dr Dhara Shah, Victoria President, Australia-India Business Council (AIBC), Nuno Matos, CEO of ANZ and Deepak-Raj Gupta, National Chair of the Australia-India Business Council (AIBC)
The rise of India
Against this backdrop, India is increasingly being viewed as one of the world's most important growth engines.
A US$4 trillion economy with economic growth close to 7 per cent and 1.45 billion people cannot be ignored. IMF projections show that, in purchasing power parity terms, India's contribution to global growth could approach China's by the end of this decade.
Some argue that the 21st century could be, at least in part, the "India Century".
For much of the past three decades, Asia's economic story was largely synonymous with China's rise. The next decade is likely to be characterised by a more multipolar Asia, with India playing a significantly larger role in driving growth, demand and investment.
What makes India important is not simply its size.
It is one of the few large economies simultaneously contributing to global demand while also attracting investment, supplying talent and becoming more relevant to global supply chains. At a time when multinational firms and investors are seeking both diversification and scale, India is one of the few markets that can offer both.
Importantly, India's economic rise has been relatively "clean", not characterised by excessive leverage, property sector booms or an overdependence on exports. The balance sheets of banks, households, corporates and government remain healthy.
Such strong growth with macro stability in a volatile global environment is a feat few economies have been able to achieve.
That hasn't happened by accident. India's period of remarkable growth has been underpinned by ambitious reforms, including major tax reform infrastructure spending, digitalisation and simplified labour laws.
At the same time, India's view of global trade has undergone a notable and timely shift towards active engagement, reflected in the Australia-India Economic Cooperation and Trade Agreement signed in 2022. Since then, India has signed several FTAs with both small and large economies, giving it preferential access to a much larger share of global GDP.
All of this means India is no longer just a market opportunity. Real integration into the global economy is happening across production, exports and supply chains.
The mobile phone sector provides a compelling example. A net trade deficit of around US$20 billion until 2018 has become a trade surplus of approximately US$10 billion.
In financial services, India has the largest real-time payments system in the world, with 242 billion transactions in FY26, roughly half of all global real-time payments transactions.
Like China, India will also play a critical role in the success of global decarbonisation efforts. A disproportionate share of future global energy demand growth will come from India, making its energy choices critical for global emissions outcomes. Encouragingly, India crossed 50 per cent non-fossil-fuel power capacity in 2025, five years ahead of its Paris target.
Why Australia and India matter to each other
Within this context, India's impressive growth and reform ambitions offer significant opportunities for Australian businesses, and vice versa.
India is Australia's fifth-largest trading partner, with two-way trade worth more than $50 billion annually. However, the India opportunity is larger than trade alone.
As one of the world's fastest-growing major economies, India is seeking investment, technology and resource security. Australia is a major provider of capital, resources, energy and critical minerals, while also bringing expertise in infrastructure, finance and clean energy that can support the next phase of India's growth.
Both countries have shared strategic interests in industries that will shape the future economy, including renewable energy, infrastructure, data centres, critical minerals, logistics and advanced manufacturing.
The cultural links between our countries are also a powerful economic asset. Migration, education, tourism and family networks have created deep people-to-people ties, while Australia's large Indian diaspora and strong education links have helped build enduring commercial and cultural connections.
As businesses increasingly look beyond trade and towards long-term investment, these networks have become a significant competitive advantage.
What was once primarily a commodity trade relationship is evolving into a broader strategic partnership, where both countries can strengthen supply chains, enhance resilience and support growth across the Indo-Pacific.
There is also an opportunity to deepen collaboration further through businesses, financial institutions, regulators and infrastructure agencies. These partnerships can help build trust, pool expertise and create the confidence needed for larger, longer-term commitments.
{IMAGE HERE}
ANZ's role in the corridor
As the most international of the Australian banks, ANZ plays a key role connecting Australia and India.
We operate in almost 30 markets globally and have had a presence in India since 1984, making us the longest-established of the major Australian banks in the market.
Today we have banking operations across Mumbai, Gurugram, Bengaluru and GIFT City, alongside a global capability centre in Bengaluru.
Looking ahead, ANZ stands ready to continue supporting the economic development of both nations.
From potential to outcomes
The Australia-India relationship has matured significantly over the past four decades and is moving beyond potential – to outcomes, partnerships and shared success.
The question is no longer whether Australia and India should work more closely together. The question now is how quickly we can turn economic potential into increased investment, investment into growth, and growth into shared prosperity.
The Australia-India corridor has the strategic alignment, commercial logic and institutional goodwill to become an even more significant economic partnership in the decades ahead.
Like the AIBC, ANZ has been part of this story for more than 40 years, and we are excited about the role we can play in the next chapter.
This article is adapted from a keynote address delivered by ANZ CEO Nuno Matos at the Australia India Business Council's 40th anniversary celebrations on 1 September 2026.
Nuno Matos is CEO at ANZ
anzcomau:Bluenotes/asia-pacific-region
Australia and India: Partners in a changing world
Nuno Matos,
CEO, ANZ
2026-09-14
/content/dam/anzcomau/bluenotes/images/articles/2026/AIBC26-147.jpg
The views and opinions expressed in this communication are those of the author and may not necessarily state or reflect those of ANZ.
EDITOR'S PICKS
Artboard Created with Sketch.
Bluenotes
Connect with us
Top
© Australia and New Zealand Banking Group Limited (ANZ) 2024 ABN 11 005 357 522.
Top