|
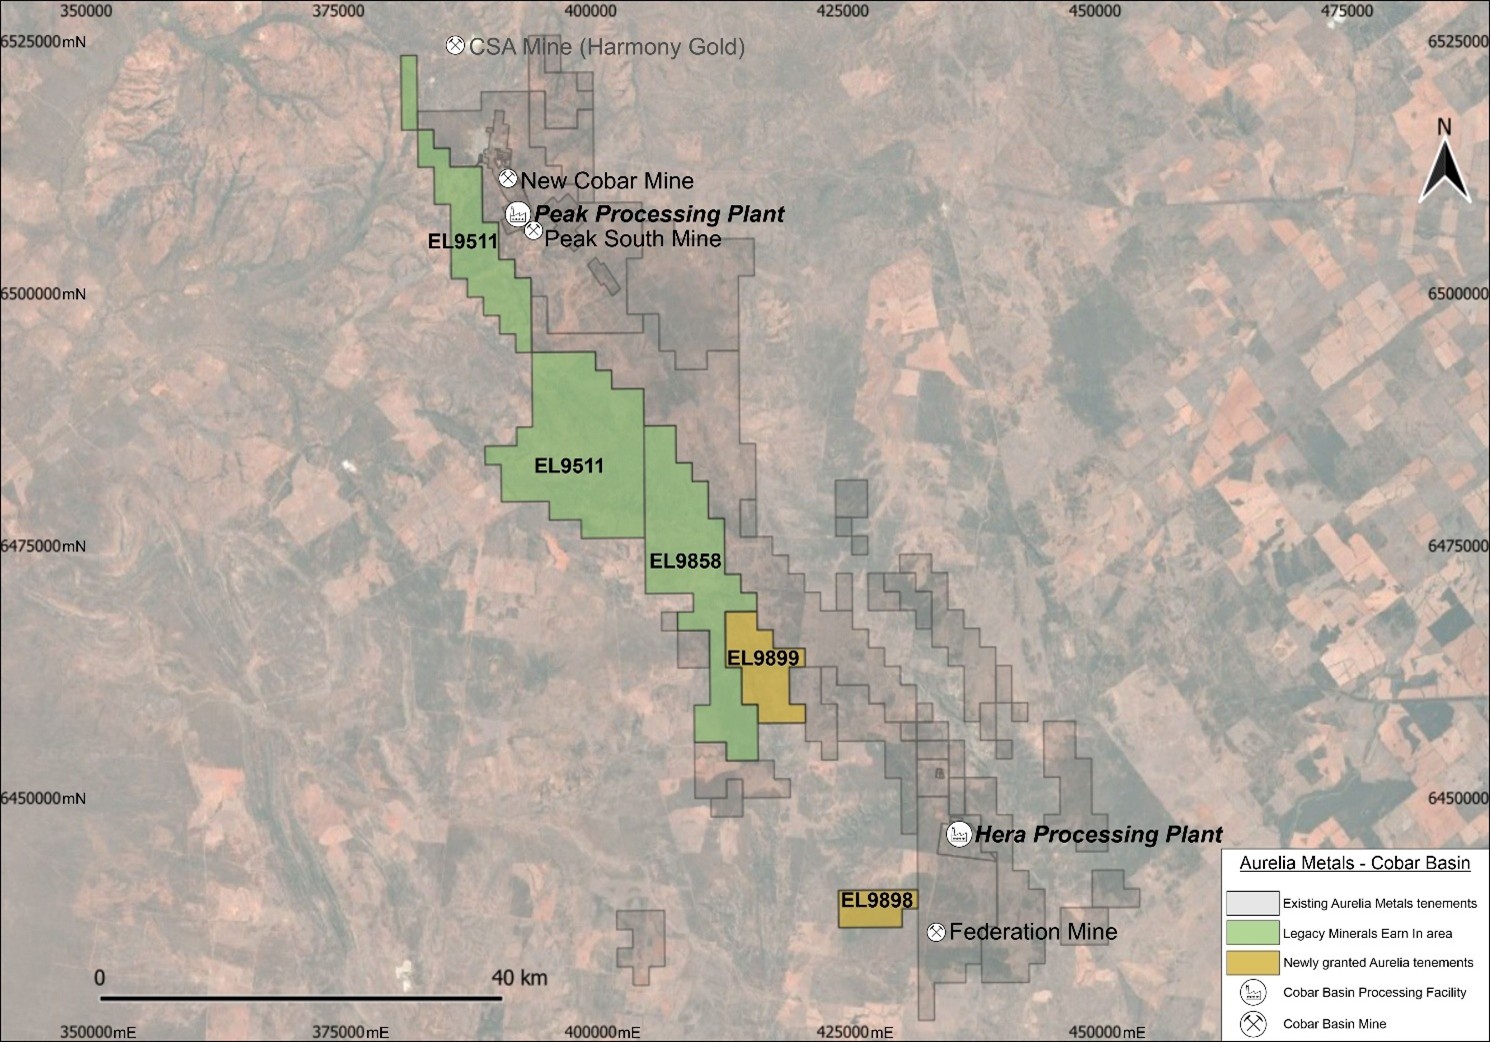
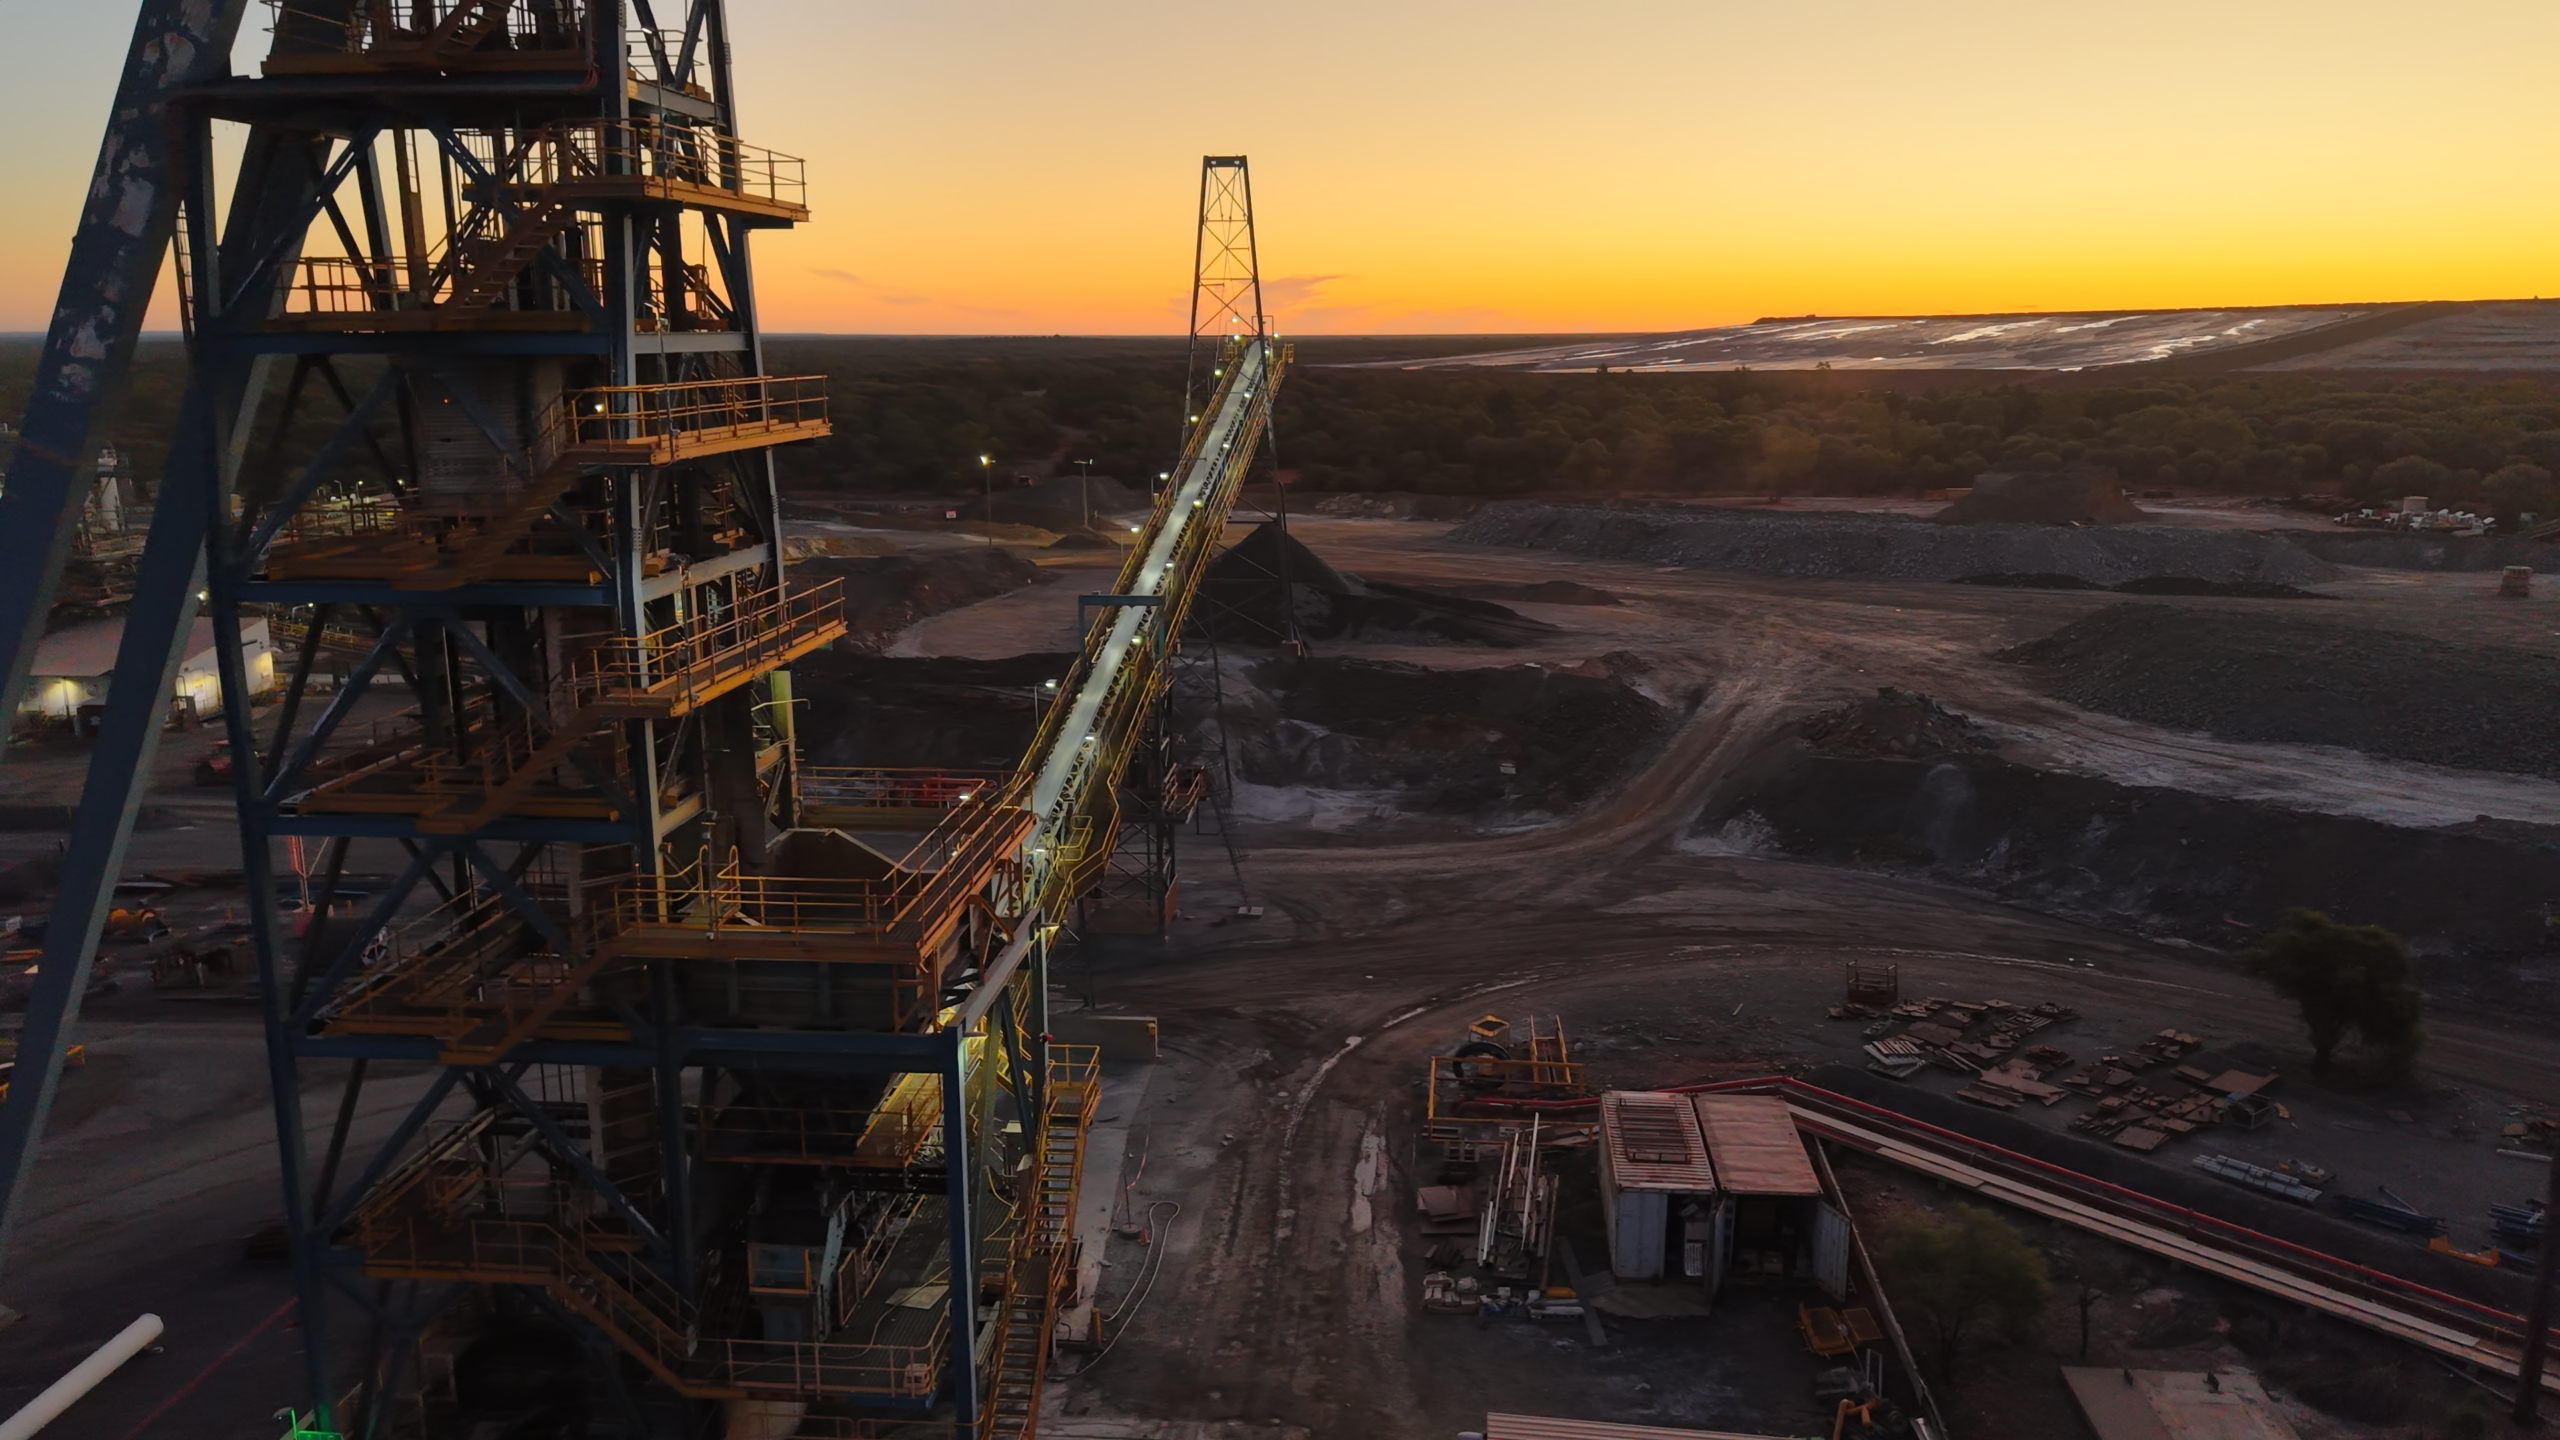
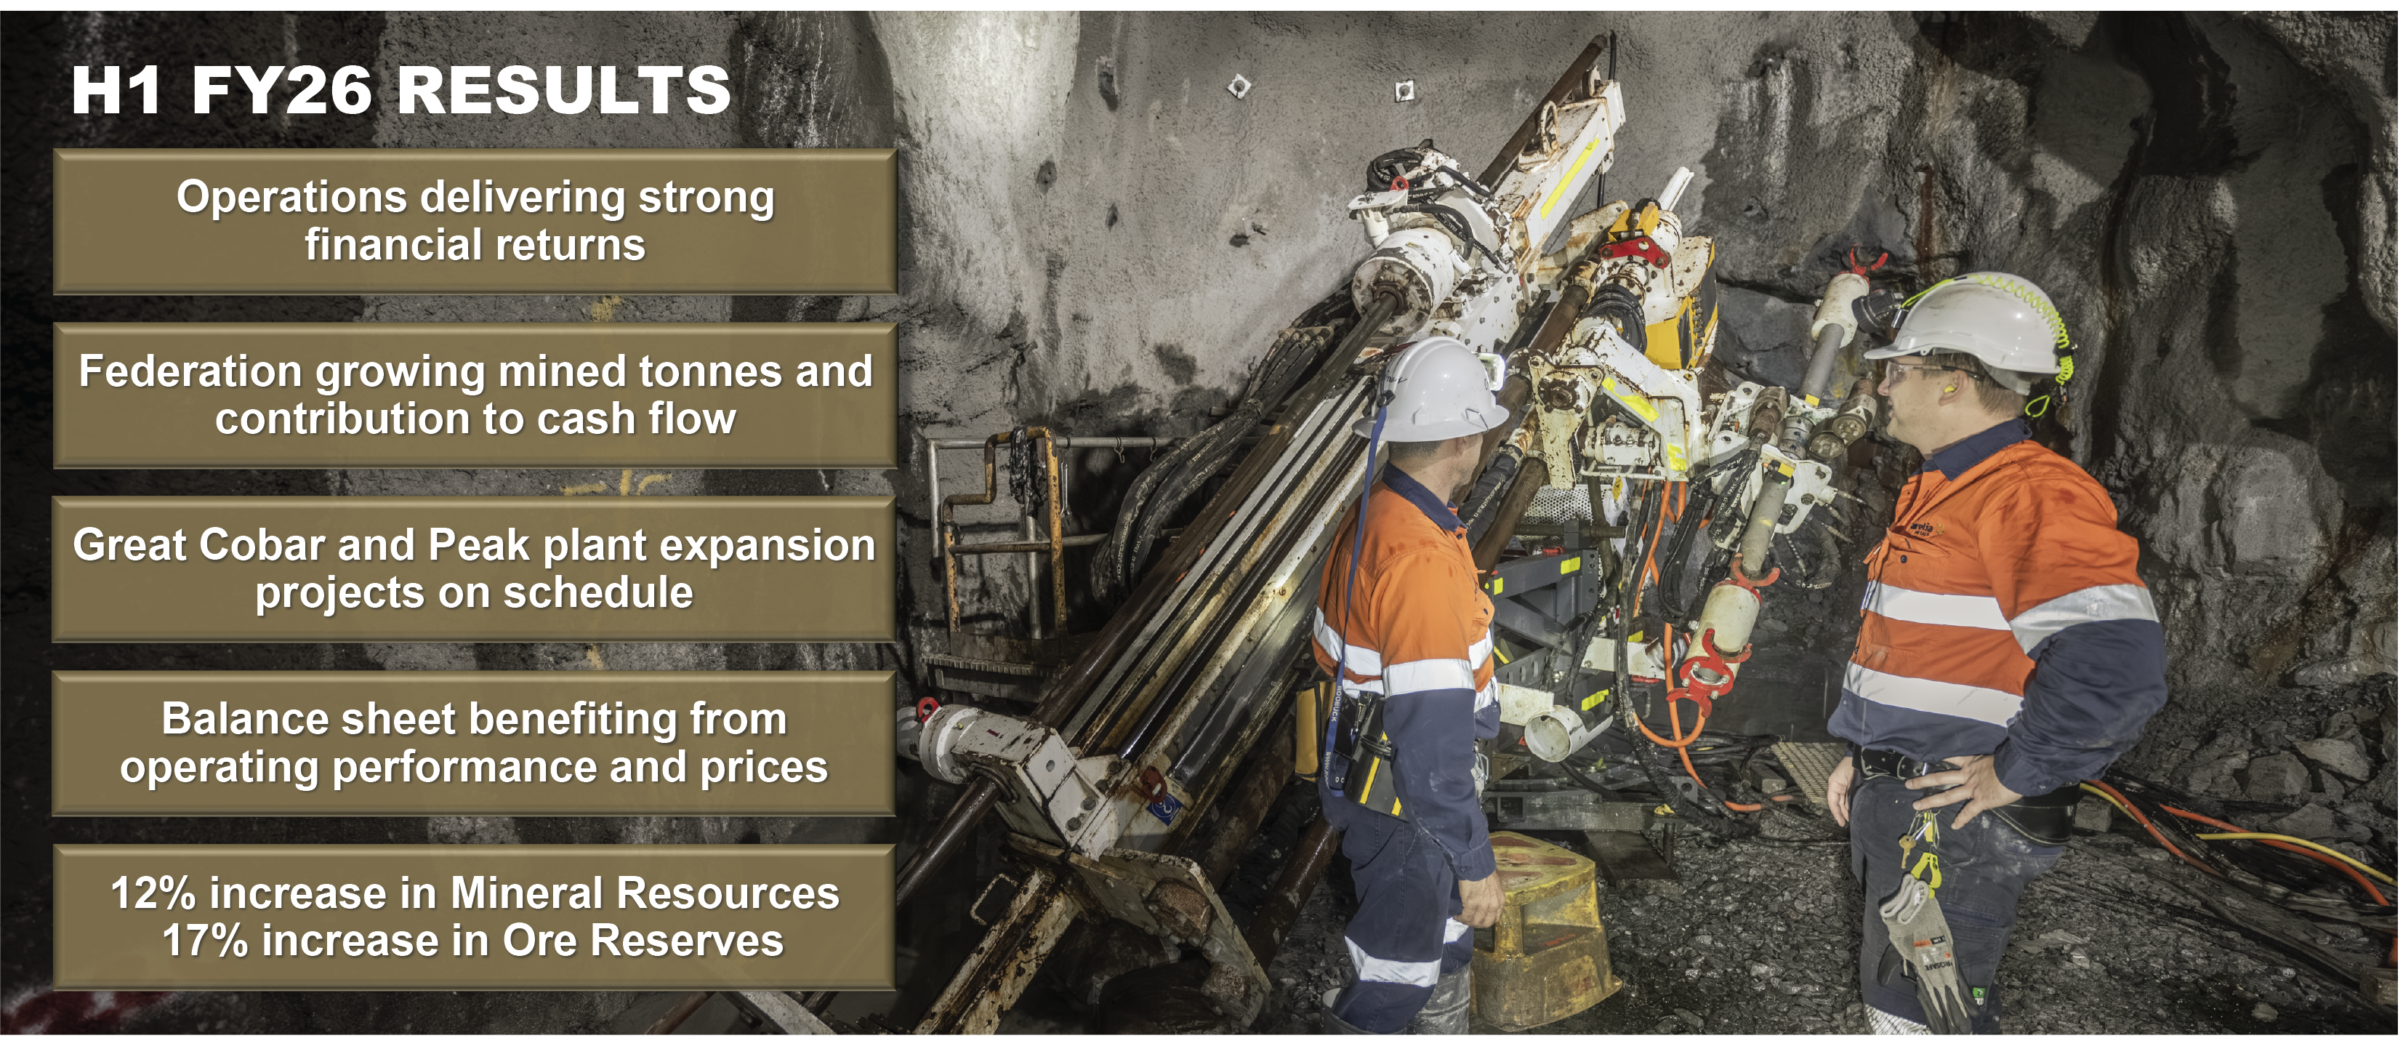
Aurelia Metals Limited is an Australian mining and exploration company operating in the Cobar Basin in western New South Wales. The company produces copper, lead, zinc, gold, and silver through its integrated Cobar Region operations, which include the Peak Operation and the Federation Mine. The Peak Operation comprises the Peak South and New Cobar underground mines and the Peak Processing Plant, which treats ore to produce separate base metal concentrates and gold/silver doré. The Federation Mine, which commenced production in 2024, is a high-grade base metal development. The company is developing the Great Cobar Project, a high-grade copper and gold development accessed via the New Cobar Mine, with development commencing in July 2025. Aurelia Metals also holds the Hera site, which is in care and maintenance, and the Dargues site, which is undergoing rehabilitation and closure. The company engages in exploration activities in the Nymagee District and has entered into an earn-in agreement with Legacy Minerals Pty Ltd for West Cobar exploration tenements. Its operations are focused on the Cobar Basin, serving global markets for base and precious metals. Summarised from the company's own disclosures, fiscal year ended Jun 2026 |
Industry Materials | Homepage aureliametals.com |
| Sector Basic Materials | IR page aureliametals.com/investors | |
|
Tags
base metals, copper, lead, zinc, gold, silver, underground mining, ore processing, exploration, mining, Peak Operation, Peak South, New Cobar, Peak Processing Plant, Great Cobar Project, Federation Mine, Hera site, Dargues site, Peak Gold Mines Pty Ltd, Legacy Minerals Pty Ltd, Nymagee District, Chesney North, Queen Bee deposit, North Mine, South Mines, Peak Mine Complex, Cobar District, Lancelot prospect, Federation deposit, New Occidental Tailings Retreatment Project, Tertiary Ball Mill Project, Crushing and Materials Handling Project, Cobar Basin Optimisation
|
Press page — |
Metrics
| Valuation | |
|---|---|
| Market cap | A$ 714.001M |
| Market cap (USD) | $ 490.574M |
| P/E | 8.79 |
| PEG | — |
| P/BV | 1.59 |
| P/S | 1.49 |
| P/OCF | 5.00 |
| P/FCF | — |
| Dividend yield | — |
| Turnover / mcap | — |
| Returns | |
|---|---|
| ROE | 20.2% |
| ROI | 17.9% |
| ROIC | 17.9% |
| Profit margin | 17.2% |
| Growth | |
|---|---|
| Revenue growing | Yes |
| Profits growing | Yes |
| Revenue up 3y | No |
| Revenue up 5y | No |
| Earnings growth 3y (net profit CAGR) | — |
| Quality | |
|---|---|
| Profitable | Yes |
| Margin expanding | Yes |
| Buying back stock | No |
| Diluting (TTM) | No |
| Debt/Equity | 1.2% |
| Podcast bulls (TTM) | Sign up |
| Podcast bears (TTM) | Sign up |
| Podcast sentiment (TTM) | Sign up |
| Podcast sentiment % (TTM) | Sign up |
| News sentiment (TTM) | 0 |
| Quality score | 58.8% |
| Insiders | |
|---|---|
| Buys, 1w | Sign up |
| Buys, 1m | Sign up |
| Buys, 1y | Sign up |
| Sells, 1w | Sign up |
| Sells, 1m | Sign up |
| Sells, 1y | Sign up |
Sign up to see this company's insider trades
| Figure | FY 2026 | FY 2025 | FY 2024 | FY 2023 | FY 2022 | FY 2021 | FY 2020 | FY 2019 | FY 2018 | FY 2017 | FY 2015 | FY 2014 | FY 2013 |
|---|---|---|---|---|---|---|---|---|---|---|---|---|---|
| Revenue | 480.241M | 343.469M | 309.891M | 369.202M | 438.815M | 416.477M | 331.819M | 295.002M | 248.599M | 109.298M | 13.22M | — | — |
| Net profit | 82.678M | 48.852M | -5.734M | -52.221M | -81.688M | 42.917M | 29.442M | 36.017M | 99.105M | 19.333M | -118.158M | -10.623M | — |
Sign up to see institutional holdings
Sign UpPodcast Mentions
Sign up to see podcast mentions and sentiment
Sign UpAnnouncements lodged with ASX, newest first, routine forms (director and substantial-holding notices, daily buy-back and quotation notices) included. The link opens the announcement on ASX. Press releases from the company's own website, newest first.




Prompts
Click prompts to add them under the company line, click again to take one out, then copy the result into your AI chat. Shared by Asian Century Stocks and Uncovered Thai Stocks. Thank you.
ETFs Holding Aurelia Metals Limited
Exchange-traded funds whose newest published daily portfolio holds one of the company's listings, largest weight first.
| ETF | Weight in ETF | Shares | Market value | As of |
|---|---|---|---|---|
| AVDV | 0.05% | 32,166,583 | $ 9.056M | Nov 16, 2026 |
| DISV | 0.04% | 6,452,413 | $ 1.867M | Nov 12, 2026 |
| AVDS | 0.02% | 233,298 | $ 65.683K | Nov 16, 2026 |
| DFIS | 0.01% | 2,863,174 | $ 828.673K | Nov 12, 2026 |
| DXIV | 0.01% | 112,861 | $ 32.665K | Nov 12, 2026 |
| DFIC | 0.00% | 2,219,677 | $ 642.429K | Nov 12, 2026 |
| DFAX | 0.00% | 1,231,018 | $ 356.287K | Nov 12, 2026 |
| DFAI | 0.00% | 1,474,493 | $ 426.755K | Nov 12, 2026 |
| DFSI | 0.00% | 91,811 | $ 26.572K | Nov 12, 2026 |
| AVDE | 0.00% | 2,236,375 | $ 629.631K | Nov 16, 2026 |